 Michael Kunz1*
 Syed S. Abbas2
 Matteo Bauckholt3
 Alexander Böhmländer1
 Thomas Feuerle4Philipp Gasch1Clarissa Glaser5Jochen Groß1Irena Hajnsek6,7
 Jan Handwerker1Frank Hase1Dina Khordakova8
 Peter Knippertz1Martin Kohler1Diego Lange2Melissa Latt1Johannes Laube8
 Lioba Martin1Matthias Mauder1,9Ottmar Möhler1
 Susanna Mohr1René W. Reitter10Andreas Rettenmeier11Christian Rolf8
 Harald Saathoff1
 Martin Schrön3
 Claudia Schütze3
 Stephanie Spahr5,12
 Florian Späth2Franziska Vogel1
 Ingo Völksch1
 Ute Weber3Andreas Wieser1Jannik Wilhelm1Hengheng Zhang1
 Peter Dietrich3,5
- 1Institute of Meteorology and Climate Research, Karlsruhe Institute of Technology (KIT), Karlsruhe, Germany
- 2Institute of Physics and Meteorology, University of Hohenheim, Stuttgart, Germany
- 3Helmholtz Centre for Environmental Research GmbH—UFZ, Leipzig, Germany
- 4Institute of Flight Guidance, Technische Universität Braunschweig, Braunschweig, Germany
- 5Department of Geosciences, University of Tübingen, Tübingen, Germany
- 6Institute of Environmental Engineering, ETH Zurich, Zurich, Switzerland
- 7German Aerospace Center, Microwaves and Radar Institute, Oberpfaffenhofen, Germany
- 8Institute of Energy and Climate Research (IEK-7), Forschungszentrum Jülich, Jülich, Germany
- 9Faculty of Environmental Sciences, Institute of Hydrology and Meteorology, Technische Universität Dresden, Dresden, Germany
- 10Deutscher Wetterdienst (DWD), Offenbach am Main, Germany
- 11Center for Solar Energy and Hydrogen Research Baden-Württemberg (ZSW), Stuttgart, Germany
- 12Leibniz Institute of Freshwater Ecology and Inland Fisheries (IGB), Berlin, Germany
The Neckar Valley and the Swabian Jura in southwest Germany comprise a hotspot for severe convective storms, causing tens of millions of euros in damage each year. Possible reasons for the high frequency of thunderstorms and the associated event chain across compartments were investigated in detail during the hydro-meteorological field campaign Swabian MOSES carried out between May and September 2021. Researchers from various disciplines established more than 25 temporary ground-based stations equipped with state-of-the-art in situ and remote sensing observation systems, such as lidars, dual-polarization X- and C-band Doppler weather radars, radiosondes including stratospheric balloons, an aerosol cloud chamber, masts to measure vertical fluxes, autosamplers for water probes in rivers, and networks of disdrometers, soil moisture, and hail sensors. These fixed-site observations were supplemented by mobile observation systems, such as a research aircraft with scanning Doppler lidar, a cosmic ray neutron sensing rover, and a storm chasing team launching swarmsondes in the vicinity of hailstorms. Seven Intensive Observation Periods (IOPs) were conducted on a total of 21 operating days. An exceptionally high number of convective events, including both unorganized and organized thunderstorms such as multicells or supercells, occurred during the study period. This paper gives an overview of the Swabian MOSES (Modular Observation Solutions for Earth Systems) field campaign, briefly describes the observation strategy, and presents observational highlights for two IOPs.
1 Introduction
Convective storms and associated phenomena such as wind gusts, heavy rain, or hail are localized yet destructive weather systems that can cause significant damage to buildings, vehicles, infrastructure, and agriculture. According to MunichRe (2018), convective storms have accounted for about one-third of all natural hazard losses in Central Europe over the past two decades. In addition, related losses show the largest increase of all weather-related perils (Hoeppe, 2016; Púčik et al., 2019), apparently in response to climate warming (Rädler et al., 2018; Taszarek et al., 2018; Raupach et al., 2021).
Heat waves, on the other hand, defined as periods of consecutive days with high temperatures, can affect entire continents. They represent the direct effect of climate change and have increased in frequency and intensity over recent decades (Lhotka et al., 2018; Masson-Delmotte et al., 2021). Of all weather extremes, intense heat waves, such as those that occurred in Europe in 2003, 2018, and 2019, cause by far the highest excess human mortality (e.g., WMO, 2014; Watts et al., 2021). Associated droughts substantially impact food and energy production, ecosystems such as forests (Senf et al., 2020; Salomón et al., 2022), or supply chains as they can lead to material shortages or logistical breakdowns (Ghadge et al., 2020).
Although these two types of extremes are triggered and occur at very different temporal and spatial scales, they share also common features: They are often associated with similar synoptic-scale weather patterns, such as atmospheric blocking (García-Herrera et al., 2010; Mohr et al., 2019); convective storms that terminate heat waves are often severe (e.g., Kunz et al., 2018); they represent the perils with the most adverse effects in southern Germany; and, as alluded to previously, they have already increased in frequency and intensity.
Both extremes and the associated event chains from triggering to amplification to impact were the focus of the Swabian MOSES field campaign, carried out from May to September 2021 in the Neckar Valley and the Swabian Jura in southwestern Germany. However, as the summer of 2021 proved to be colder and wetter than those in recent years, with no heat wave or drought, the focus of the campaign had to be shifted to convective storms only.
The event chain related to thunderstorms consists of various interrelated processes across compartments, i.e., atmosphere—biosphere—lithosphere—hydrosphere—anthroposphere, evolving a broad range of temporal and spatial scales. The general setting for convection-favoring conditions is provided by flow patterns on the synoptic scale ( ∼1,000 km; Kottmeier et al., 2008; Piper et al., 2019; Mohr et al., 2019). Associated atmospheric conditions such as unstable stratification, sufficient moisture at lower levels, and a proper initial lifting mechanism for triggering convection, all of them necessary but not sufficient ingredients for deep moist convection (e.g., Doswell, 1987; Johns and Doswell, 1992), are predominantely controlled by processes on the meso-β scale (20–200 km; Orlanski, 1975). This scale also controls the vertical wind shear, which is crucial for the organization of the storms, and the intra-cloud dynamics (Markowski and Richardson, 2010; Kunz et al., 2020) Aerosol particles, such as organic compounds or mineral dust, alter the radiative budget and thus thermal stability mainly on the meso-γ scale (2–20 km; e.g., Tao et al., 2012; Braga et al., 2017; Schneider et al., 2019). Aerosols acting as cloud condensation or ice-nucleating particles (CCN, INP), respectively, control the size distributions of cloud droplets and ice particles and, thus, precipitation formation processes on the microscale (e.g., Lohmann et al., 2016; Dennis and Kumjian, 2017; Wellmann et al., 2020). Very strong updrafts in the clouds are capable of penetrating the tropopause and can transport and deposit water vapor into the lower stratosphere (e.g., Solomon et al., 2010; Smith et al., 2017; Khordakova et al., 2022). In addition, intense and broad updrafts can produce hailstones with diameters of several centimeters, which can cause significant damage to infrastructure, buildings, and plants (e.g., Kunz et al., 2018; Púčik et al., 2019; Wilhelm et al., 2021). Depending on the local topography, vegetation, or soil type, heavy rain affects surface runoff and erosion in the upper soil layers in dependence to soil moisture (e.g., Holz et al., 2015). Heavy rain may cause creeks or rivers to swell within several minutes, occasionally provoking flash floods (e.g., Hübl, 2017). Resulting increased surface runoff can cause serious water quality impairments through input of contaminants into streams, for example, from agricultural or urban land use (Tang et al., 2013; Brudler et al., 2019; Neale et al., 2020; Spahr et al., 2020; Pamuru et al., 2022).
Despite the high societal relevance, detailed knowledge of how convective storms are triggered and amplified and how the associated phenomena propagate through the compartments is still limited. One of the reasons for this deficit are limitations in observational capacity, as they usually do not fully cover or resolve all relevant processes and their interactions over a wide enough range of scales (Wieser et al., 2022). This also hinders sufficient representation of the processes in numerical models, such as numerical weather prediction (NWP) or runoff models.
The overarching goal of Swabian MOSES 2021 was therefore to observe and scrutinize the processes involved in the entire hydro-meteorological event chain described above. For this purpose, researchers from various disciplines were involved in Swabian MOSES, such as meteorologists, hydrologists, chemists, physicists, or soil scientists, among others. A broad range of state-of-the-art in situ and remote sensing observation systems were installed at 27 fixed ground-based stations, supplemented by mobile observation teams (e.g., aircraft observations, storm chaser).
Besides the comprehensive event chain investigation, the objectives of Swabian MOSES are: 1) To explore causes of the frequent occurrence and usually poor predictability of severe thunderstorms in the study area; 2) to investigate reasons for the inhomogeneity of precipitation and soil moisture distribution, and their relation to local flooding; 3) to quantify the exchange of trace gases between troposphere and stratosphere during deep moist convection; 4) to gain a better understanding of the formation and evolution of hail, including the influence of INPs; and 5) to quantify the input of pollutants to streams during heavy rain events.
This paper describes the campaign’s design and presents some first results. Section 2 provides an overview of the field campaign as well as the concept and observation strategy, and briefly introduces the measuring instruments. While Section 3 reports on the campaign procedure and the Intensive Observation Periods (IOPs), Section 4 presents some highlights of two IOPs, during which the most damaging thunderstorms occurred. The last Section 5 draws some conclusions and gives an outlook on the next Swabian MOSES campaign planned for summer 2023.
2 Background and concept of field experiment
2.1 MOSES background
To investigate entire event chains from the formation and evolution of weather extremes to their environmental and societal impacts, the new observing system MOSES (Modular Observation Solutions for Earth Systems) has been developed. MOSES is financed by the Helmholtz Association of German Research Centers; its component measuring systems are managed by the participating research centers. By quantifying energy, water, nutrient and greenhouse gas states and fluxes during high-impact weather events, such as heat waves, droughts, or hydro-meteorological extremes, and subsequently along the related event chains, it is aimed to gain a better understanding of such extremes that are expected to increase in frequency and intensity in a changing climate. To obtain comprehensive data sets that enable to scrutinize relevant processes on a broad range of scales, a cross-compartment approach is followed, covering atmosphere, land surface and hydrosphere. During the implementation period 2017–2021, a series of test campaigns were carried out that provided a proof of concept (Weber et al., 2022). The Swabian MOSES 2021 campaign introduced in this paper was the final and most comprehensive of these campaigns.
2.2 Swabian MOSES concept
The design of Swabian MOSES builds upon the experience gained from previous event-driven interdisciplinary measurement campaigns, such as MOSES Müglitz in 2019 (Wieser et al., 2022). The campaign adapted the flexible observation and operation concepts developed for convective events and combined them with those for investigation emerging heatwaves and droughts that amplify over days to weeks (but which did not occur in 2021). Coordinated by the Karlsruhe Institute of Technology (KIT), Swabian MOSES was conducted by five Helmholtz Research Centers, three universities, and the German Weather Service (DWD). To observe as many of the desired weather extremes as possible, the campaign was conducted in one of the hotspots of thunderstorm and hailstorm occurrence in Germany.
Based on analyses of radar, lightning, and insurance loss data, several studies (Kunz and Puskeiler, 2010; Puskeiler et al., 2016; Enno et al., 2020; Fluck et al., 2021) found evidence that (severe) thunderstorms in southwestern Germany preferably form east of the Black Forest ridge and around or over the Swabian Jura. (Kunz and Puskeiler, 2010) hypothesized that low-level flow convergence as a consequence of a predominant flow-around regime around the Black Forest is paramount to the increased frequency of convective storms in this area. Low-level flow convergence in that region was also observed in semi-idealized simulations based on COSMO (Consortium for Small-scale Modeling) model simulations by Köbele (2014).
With the highly industrialized Neckar Valley and the open landscape of the Swabian Jura, the study area represents a unique landscape and settlement area. It is characterized by a large altitudinal gradient, large variation in soil types, vegetation and land use over short distances, and rather small river catchments that are prone to local flooding. To observe a wide range of processes related to convective storms and to sample the relevant parameters with the resolution necessary to conduct subsequent model and evaluation studies as well as to allow for data assimilation into NWP models, a cross-scale observation concept was established for Swabian MOSES ranging from the meso-β scale down to the micro scale.
Figure 1 gives an overview of the study area, measurement sites and river catchments of Swabian MOSES. The main observation site was located in a wheat field in the plain of the Neckar Valley (338 m above mean sea level, amsl), close to the city of Rottenburg, where according to the semi-idealized model simulations by Köbele (2014) severe thunderstorms are frequently triggered by near-surface flow convergence. The site delivered high resolution in situ and remote sensing observations by the integrated atmospheric observation system KITcube (Kalthoff et al., 2013), including an energy balance and radiosonde station, Doppler-lidar, microwave radiometer, sun photometer, dual-frequency FMCW dual-pol cloud radar, and cloud cameras as well as soil moisture, CCN and INP observations (Section 2.3; Supplementary Table S1). The KITcube X-band radar was set up about 30 km to the northeast in Nürtingen at the Hochen vantage point (370 m amsl), from where most of the study area could be covered. Two research aircraft operated from Baden Airport (FKB) during two IOPs in last 2 weeks in June. This period was pre-selected based on the climatology of thunderstorm frequency in the study area.
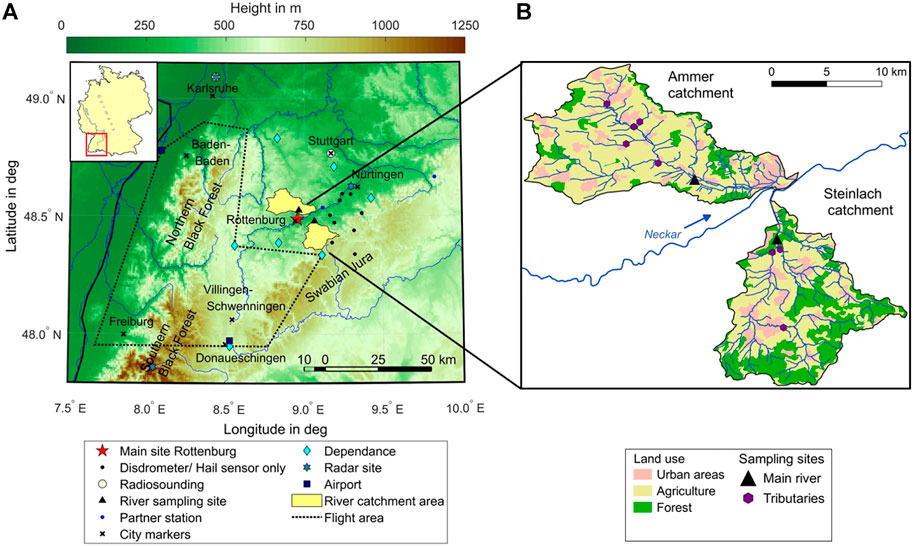
FIGURE 1. (A) Swabian MOSES study area with measurement sites, river catchments and flight areas. The KITcube was installed at the main site of Rottenburg (including, e.g., meteorological tower, wind and aerosol lidar, cloud chamber, cloud radar, humidity and temperature profiler, PARSIVEL disdrometer, radiosounding, stratospheric balloon). The dependence stations were equipped with disdrometers, hail sensors, and devices for meteorological near-surface (standard + partial energy fluxes), and/or vertical wind profile observations. In addition to the three radars shown in the map, the Türkheim radar outside of the map was also considered in the analyses (X-band in Nürtingen, the others C-band from DWD). One of the partner stations measured soil moisture, the other one observed wind profiles and standard meteorological parameters. (B) Zoom into the two catchment areas of the Ammer and Steinlach Rivers with the sampling sites.
With the goal to verify (or falsify) the hypothesis of Kunz and Puskeiler (2010) of a predominant flow-around regime and resulting flow convergence zones downstream of Black Forest being responsible for the thunderstorm hotspot in the study area, a Doppler lidar network was set up and distributed within an area of approximately 100 km × 70 km (north-south/east-west) over seven dependance stations going clockwise from Friolzheim (445 m amsl) in the northwest over Hohenheim (388 m amsl), Owen (Teck; 457 m amsl), Ringingen (775 m amsl), Haigerloch (489 m amsl), Sulz (Neckar; 453 m amsl), and Donaueschingen (676 m amsl) in the south. These dependances were additionally instrumented with a meteorological station including a sonic anemometer, and were part of the 19-station Parsivel (PARticle SIze and VElocity) laser-optical disdrometer network, which was designed to allow optimum calibration of the X-band radar derived precipitation intensities. At eight of the latter sites spanned up a hail sensor network. The Haigerloch site, located approximately 18 km southwest of Rottenburg, was additionally equipped with a MoLEAF (Mobile Land-Ecosystem-Atmosphere Flux) system, and Ringingen with an eddy covariance station to establish a cross-sectional flux network from the Neckar wettlands (KITcube) over mid-altitude loam soils to the karst on Swabian Jura.
Because soil moisture is an important state variable that determines land-atmosphere coupling (Alessi et al., 2022) as well as soil processes (Vogel et al., 2018), various systems were operated for mapping and monitoring soil moisture states during Swabian MOSES. Continuous temporal measurements of soil moisture dynamics in different depths were recorded by an in situ wireless sensor network based on Frequency Domain Reflectometry sensors (Schrön et al., 2018a; Lausch et al., 2018). Spatial patterns of field-scale soil moisture of the root zone were captured by occasional measurements with a mobile cosmic ray neutron sensor (CRNS Schrön et al., 2018b). In addition, surface soil moisture at the regional scale was mapped by three overflights using a Synthetic Aperture Radar (SAR) from the German Aerospace Center (DLR).
For hydrological investigations, two tributaries of the Neckar River, namely the Ammer River (22 km) and the Steinlach River (25 km), were selected (Figure 1B). The Ammer catchment (134 km2) is located north of Rottenburg with mostly agricultural land use, and headwaters located near the town of Herrenberg (Schwientek et al., 2013b). The Steinlach catchment (138 km2) south of Rottenburg is characterized by agriculture and forest.
2.3 Methods and instruments
Most of the instruments installed in the study area measured continuously during the entire campaign (Extended Observation Period, EOP). Only mobile observations and in situ vertical profile measurements with radiosondes were limited to IOP days (see also the description of observational modes and procedures in Section 3). The following sections, separated according to the compartment, briefly introduce the instruments for which some selected highlights are presented in Section 4. A special focus is put on new instruments or methods, such as the airborne Doppler lidar (ADL) observations (Section 2.3.1.5), infrasound sensor (Section 2.3.1.6), swarmsondes (Section 2.3.1.7), or mobile aerosol observations (Section 2.3.1.8). A full list of instruments deployed at the various observation sites, including their main features and properties, is provided in the Supplementary Table S1.
2.3.1 Atmosphere
With the main objective of better understanding convection initiation and subsequent amplification to deep moist convection, most of the instruments installed during Swabian MOSES were designed and deployed to observe relevant processes in the atmosphere.
2.3.1.1 Radiosounding
Standard radiosoundings were launched by KIT at the main site Rottenburg and at KIT Campus North, located about 12 km north of Karlsruhe (Figure 1), from 02:00 UTC onwards every 3 or 1.5 h, respectively, depending on the actual convective situation (release times are shown in Figure 2). At the site of Stuttgart-Schnarrenberg (WMO code 10739), located 45 km northwest of Rottenburg, DWD conducted in addition to the operational synoptic upper-air observations (00, 06, 12 UTC) further soundings on IOP days at specially agreed times (09, 15, 18, 21 UTC). At Rottenburg and Karlsruhe, DFM-09 sondes from Graw Radiosondes (www.graw.de/products/radiosondes/dfm-09/) were used, while DWD used Vaisala RS41-SGP sondes (Vaisala, 2020). The sondes measure vertical profiles of temperature, pressure, humidity and winds up to 20–30 km. Both sonde types provide high quality measurements (Jing et al., 2021) and comply with to the Global Climate Observing System (GCOS) Reference Upper-Air Network (GRUAN) standards. At the DWD station, an automatic launcher Autosonde type AS15 from Vaisala has been used since 2012.
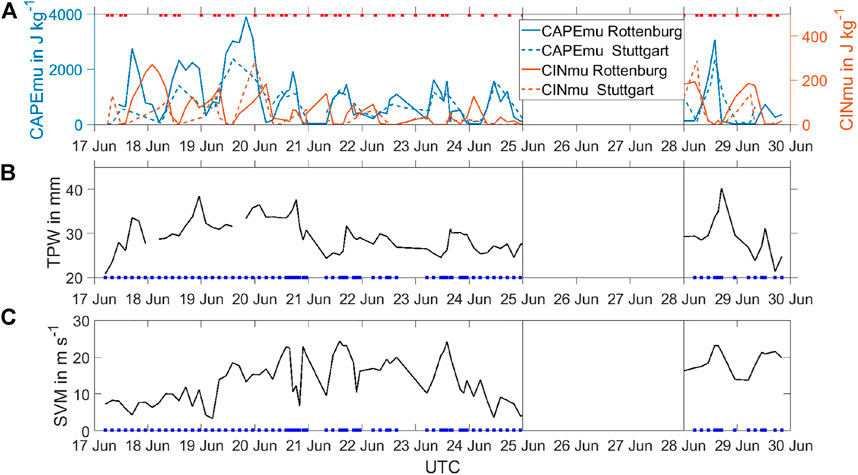
FIGURE 2. Time series of (A) most unstable convective available potential energy (CAPEmu, blue line) and convective inhibition (CINmu, red line) at the main site Rottenburg (solid lines) and the DWD station at Stuttgart-Schnarrenberg (dashed lines), (B) total precipitable water (TPW) at Rottenburg, and (C) shear vector magnitude (SVM) between 6 km and 10 m agl at Rottenburg. Red rectangles in (A) indicate release times of DWD radiosondes, blue rectangles in (B,C) release times ofsondes at Rottenburg.
2.3.1.2 Stratospheric balloon sounding
The impact of convective storms on the trace gas distribution of the upper troposphere and lower stratosphere (UTLS) was investigated with the help of special stratospheric balloon instrumentation. We used two different payloads on larger weather balloons (1,500 g) launched at the main site Rottenburg directly before and/or after a thunderstorm passing by (similar to the approach in Khordakova et al., 2022). The difference of both profiles reveals the impact of the thunderstorm on the measured trace gases, such as water vapor, ozone, methane, carbon dioxide, and halocarbons.
The first payload consisted of a standard radiosonde (Vaisala RS41-SGP; same type as above), a cryogenic frostpoint hygrometer (CFH; Vömel et al., 2007; Vömel et al., 2016) to measure most accurately the small water vapor concentration in the UTLS, and an electrochemical concentration cell ozone instrument (Smit et al., 2007). The second payload consisted of an AirCore sampler, which collects air masses within a long lightweight coiled piece of stainless-steel tubing (≈100 m) during the descent phase from the stratosphere (≈35 km) down to the surface. The collected air was later analyzed in a laboratory with a cavity ring-down spectrometer for its methane, carbon monoxide, and carbon dioxide content (Engel et al., 2017) and with a gas chromatographic high-sensitivity mass spectrometer system for the range of halogenated trace gases (Laube et al., 2020).
2.3.1.3 Rainradar
The KITcube X-band radar (dual-pol, Dopplerized) installed at Nürtingen (Figure 1) measured with a radial resolution of 500 m up to a horizontal range of 100 km. Azimuthal resolution was 1°, and 11 elevation angles were deployed from 0.7 to 40°.
Quality control consists of removal of clutter and insect echoes with a fuzzy logic approach (Krause, 2016). Scatter classification is based on reflectivity, differential reflectivity, copolar correlation coefficient as well as the textures of differential reflectivity, differential phase and copolar correlation coefficient. The probability is empirically determined that a certain measurement belongs to a measurement of rain, ground clutter or insect echoes. Apparently occurring spike signals (dashed reflectivity patterns along the azimuthal direction) are identified by high values of differential phase and a signal quality index below 0.3. Signals from non-meteorological scatterer are replaced by interpolated values from meteorological measurements in the vicinity. Attenuation caused by rain is corrected by the so-called ZPHI algorithm described in Testud et al., (2000). Finally, a single calibration of the radar is performed based on rain gauge measurements from DWD. Attenuation by hydrometeors adhering to the radome is taken into account by determining a linear fit with the rain intensity determined by two Parsivel distrometers collocated with the radar.
The X-band radar was deployed to obtain a high spatial resolution of the observations in the study area. For some purposes, however, an overview of the precipitation patterns over larger areas is necessary. To this end, data from the KIT C-band radar, mounted on a roof at KIT Campus North, and from the DWD radars at Feldberg and Türkheim were used. Data from the DWD radars are quality-controlled with DWDs own quality assurance routine (POLARA, polarimetric radar algorithms).
2.3.1.4 Land-atmosphere feedback observatory
The LAFO1 [Land-Atmosphere Feedback Observatory; Späth et al., 2022], located at the University of Hohenheim at the northern border of the study area (Figure 1), is equipped to investigate interactions and vertical exchanges between the compartments atmosphere and land-surface, including vegetation and soil. Two Doppler lidars [Streamline XR from Halo Photonics; Pearson et al., 2009] and one Doppler cloud radar from Metek GmbH (Görsdorf et al., 2015) operated during the entire EOP. One lidar and the radar were put in vertical steering mode to measure vertical wind speed. The second lidar operated in 6-beam velocity azimuth display (VAD) mode with 5 azimuth directions under 45° elevation angle, and one vertical beam to determine vertical profiles of horizontal wind speed and direction as well as to quantify further variables, such as turbulent kinetic energy and momentum fluxes (Bonin et al., 2017). Doppler lidars provide wind data in clear air, but require scattering particles (aerosols), limiting the observation range mainly to the atmospheric boundary layer (ABL) and to thin clouds. Wind observations within deeper clouds are obtained from the Doppler cloud radar. During all IOPs, the ARTHUS (Atmospheric Raman Temperatur and HUmidity Sounder; Lange et al., 2019) system was additionally operated, providing vertical profiles of temperature and water vapor mixing ratio with turbulence resolution. This allows to investigate fluctuations and higher-order moments of these variables (Behrendt et al., 2015; Lenschow et al., 2000; Wulfmeyer et al., 2016) as well as, in combination with wind profiles, to quantify sensible and latent heat fluxes in the ABL (Behrendt et al., 2020). At the land-surface, two eddy-covariance stations provided sensible and latent heat fluxes and other meteorological variables. In the LAFO study area, a water and temperature sensor network was installed to capture soil moisture content and temperature in 40 cm depth as well as surface precipitation.
2.3.1.5 Targeted airborne Doppler lidar measurements
During a two-week period in the second half of June, two research aircraft were deployed by KIT: the Dornier 128-6 (Do128) and the Cessna F406. Both aircraft, operated by TU Braunschweig, were outfitted with 100 Hz turbulence probing equipment (Corsmeier et al., 2001). As a highlight, the Do128 was additionally equipped with an airborne Doppler lidar (ADL) developed by KIT (Gasch, 2021). The ADL was used to provide spatially resolved flow observations prior to convection development as well in the vicinity of convective cells. Due to the combination of slow operation speed of the Do128 (60 m s−1), fast data acquisition of the lidar (10 Hz), and a fast scanner (30 deg s−1 azimuthal scan rate), ADL observations of mesoscale flow are available at an unprecedented resolution of less than 1 km. So far, comparable ADL observations have been conducted only in the vicinity of tropical convective systems, but using high and fast flying aircraft (Pu et al., 2010; Turk et al., 2020; Cui et al., 2020). These provide a much coarser spatial resolution [O (10) km] and less operation flexibility, limiting their use for flow investigations in the PBL. To our knowledge, there are only two studies in which an ADL was operated from low and slow flying aircraft to observe flow phenomena in the PBL, but not convective systems (De Wekker et al., 2012; Schroeder et al., 2020). Detailed information about the ADL observations during Swabian MOSES will be presented in separate publications.
Aircraft-based observations of convective systems are challenging because the prediction of the spatio-temporal occurrence of convection involves large uncertainties that must be accounted for in flight planning and safety. The situation is additionally complicated by high air-traffic density and airspace regulations in Germany. Both aircraft were operated under visual flight rules in uncontrolled airspace category E below 3 km (10 000 ft), for which the ADL was certified. Due to this operation, cloud penetration was forbidden and a minimum distance (300 m vertically, 1.5 km horizontally) to clouds was required. Additionally, flexible flights above the main site Rottenburg were impossible due to the controlled airspace category C of the Stuttgart airport.
During the two-week period, the crews of both aircraft were on standby and ready to deploy within 48 h if an IOP were planned. Aligned with the IOP decisions, the selection of a pre-defined flight pattern was announced 24 h in advance. Two flight slots per day were possible. A total of ten flights were conducted on 4 days, each lasting more than 2.5 h. Seven flights were performed by the Do128, while the F406 flew in parallel on three of the flights. One flight slot was intended for measurements approximately 3–6 h prior to the onset of expected convective activity. A second slot aimed to observe the flow during convective initiation.
2.3.1.6 Infrasound observations
Several studies have shown that thunderstorms can emit not only audible, but also infrasound waves. Different generation mechanisms have been proposed to contribute to the observed infrasound emissions (Bedard, 2005; Schecter, 2012; White et al., 2022; Coffer and Parker, 2022). Using a mobile infrasound detector (White et al., 2022), identified pronounced infrasound emissions peaking at 12 Hz from a tornado-generating cloud, while their observation of a large hailstorm did not produce a signal at this frequency. The hailstorm infrasound spectrum, however, also showed some elevated signal levels at lower (3–8 Hz) and higher (40–50 Hz) frequencies (Figure 13 in White et al., 2022).
To systematically investigate how convective storms of different organizational forms and associated severe weather events emit infrasound waves, an infrasound sensor was installed and operated in a garage located in a quiet residential area of Rottenburg, about 1 km to the southwest of the KITcube main site. The concrete structure forming the garage has ventilation slots on the front and backside, so pressure variations from outside are forwarded to the inside.
The campaign sensor uses differential pressure sensors for infrasound detection, as suggested by Grangeon and Lesage (2019). The infrasound signal is derived from the measured pressure difference between a thermally insulated 5 L reference volume and the ambient air. A low-pass filtering is applied on the raw signal in order to suppress aliasing artefacts. The unit achieved an excellent level of data availability, as it operated throughout the EOP without any instrumental failures or downtimes.
2.3.1.7 Storm chasing using swarmsondes
To measure in situ vertical profiles of temperature, humidity and wind at high temporal resolution in the vicinity of thunderstorms, a mobile storm chasing team operated the newly developed windsondes/swarmsondes from Sparv. The system with small (yoghurt cup size) and lightweight (12 g) sondes can track up to 17 devices per radio frequency, allowing the user to launch a swarm of sondes in close proximity. The sondes ascend to a specified height, where they can be cut-off from the balloon by heating a hot wire, subsequently following pseudo-Lagrangian trajectories (Markowski et al., 2018). Based on the last or current position of the transmitted GPS fix, the sondes laying on the ground can be retrieved and subsequently reused. The objective of the swarmsondes’ deployment was to gather experience of the storm chaser team with respect to logistics, time criticality, and handling of the system for a subsequent field campaign focusing on hailstone growth. The team was in operation five times, launching a total of 29 swarmsondes.
The decisions on potentially chased cells were made by visual inspection of the temporal evolution of the radar echo-top height in combination with lightning detections from the EUCLID network. All selected cells could actually be reached in the right place at the right time. However, directly in the heavy rain area, the sonde or GPS signals were attenuated too much, so that the position could not be tracked. In addition, raindrops adhering to the balloon sometimes prevented the sondes from ascending. Therefore, we decided to launch swarmsondes only in the vicinity of thunderstorms to study how environmental conditions are modified by convection.
2.3.1.8 Aerosol observations
The spatial distribution, ice nucleation activity, number concentration and size distribution of aerosol particles as well as their correlation with temperature, humidity, soil moisture, and other meteorological parameters were investigated and characterized by different instruments: a scanning aerosol lidar (Raymetrics Inc. LR111-ESS-D200), a Portable Ice Nucleation Experiment (PINE; Möhler et al., 2021), and ground level aerosol sensors. The scanning lidar did zenith scanning measurement from elevation angles of 90 to 5° with steps of 5° in two directions, and with a temporal resolution of around 15 (30) minutes during the IOPs (EOP). This setup provided an excellent coverage of aerosol particle movements in space and time at the main site Rottenburg. PINE measured ice nucleation activity of the aerosol particles at a temperature of about 251 K with a temporal resolution of 6 min. The mobile ground level aerosol sensors, based on filter technology, were used in conjunction with the mobile storm chasing team (see above).
2.3.1.9 Hail sens network
Eight stations of the Parsivel disdrometer network, which are most frequently affected by hail according to long-term radar data analyses (Puskeiler et al., 2016; Fluck et al., 2021), were additionally equipped with the automatic hail monitoring system HailSens from Hyquest Solutions. Hailstones hitting a sensing area of approximately 0.2 m2 generate a vibration of a plate, which is recorded by a piezoelectric microphone mounted beneath the plate. The signal of each hailstone is converted into kinetic energy and hail diameter, and automatically sent to a web interface. The derived hail size spectra can be used, for example, to adjust the conversion of the radar signal to hail at the surface or to improve damage and risk assessment models for buildings, vehicles, and agricultural crops.
2.3.2 Near-surface measurements
2.3.2.1 Soil moisture and temperature
Time-domain transmission soil moisture sensors and temperature sensors with custom-made data logger systems were used to measure time series of these soil state variables at six locations in three depths with two sensors, each at 5-minute intervals. Decisions on the specific observation depths were made during the installation at the respective sites based on the local soil profiles. The measured values were transferred to the database twice a day to enable near-real-time monitoring.
To obtain information on root-zone soil moisture along transects towards regional scales, several campaigns with CRNS (Schrön et al., 2018a) have been conducted and scheduled before and after prospective rain events. The method estimates the average water content in an area of up to 200 m distance from the road by sampling the natural cosmogenic neutron radiation in the air. The number of neutrons depends on the abundance of near-surface hydrogen atoms within hundreds of meters distance and tens of centimeters depth (Köhli et al., 2015).
2.3.2.2 Airborne radar measurements of surface soil moisture and vegetation parameters
In addition to the instruments briefly described in the previous paragraph, the Synthetic Aperture Radar (SAR) system is sensitive to the material and geometrical property of the illuminated scene and is therefore able to estimate surface soil moisture over larger areas. This quantity cannot be estimated directly from the radar signal, but needs a model for the signal inversion. The model development and the processing of longwave SAR data are still an open research topic, and several concepts have been explored to obtained the most precise results. For this purpose, not only the image processing was further developed, but also the imaging mode of the SAR system. It could be shown that when using SAR polarimetry and interferometry, due to the capability to separate ground from volume, a higher sensitivity to soil moisture is obtained (Joerg et al., 2017).
In this campaign, the airborne F-SAR sensor of DLR was flown over three test sites (Lauswiesen, Rottenburg and Haigerloch) to acquire data at longer wavelength (L-band with 24 cm wavelength) and fully-polarimetric as well as with two interferometric baselines. Flights were performed on 3 days (16, 21, and 24 June), accompanied by parallel measurements on the ground with the CRNS sensor (Reigber et al., 2012).
2.3.2.3 Vertical energy fluxes at the surface
In addition to LAFO (Section 2.3.1.4), vertical fluxes of energy and water in the study area were also measured by the MoLEAF system at the Haigerloch site. MoLEAF consists of a trailer mast that can be equipped with various measuring instruments and that can be pneumatically extended to a height of 30 m. The second important component of the MoLEAF system is a mobile laboratory cabin that can be transported as an attachment on a pickup truck and set down at the measurement site. This component contains a computer workstation, the power supply for the measuring system and a broadband internet connection. All this enables the rapid deployment of this measuring system in extreme weather events with a short warning time and a self-sufficient operation on site. Thus, measurements can be taken within a few hours after arrival. The central measuring unit of the MoLEAF is an eddy-covariance system (Campbell CSAT3B + Licor LI7500) for determining vertical turbulent fluxes within the ABL. The method analyses high-frequency wind and scalar atmospheric data series to determine the vertical fluxes of momentum, energy, and gaseous air constituents. In addition, the MoLEAF includes measuring instruments to record the radiation balance, which is made up of short and long wave radiation, and to determine soil heat flux, soil water content, air temperature and humidity. Wind speed and direction are also recorded. During Swabian MOSES, all measurements were run automatically around the clock in high temporal resolution (0.1 s for turbulent variables and 1 min for non-turbulent variables).
2.3.3 Surface water measurements
At the outlets of the gauged river catchments (main river sampling sites in Figure 1B), probes were installed to provide continuous measurements of discharge, turbidity, water temperature, dissolved oxygen, pH, (specific) conductivity, ammonium, nitrate, and dissolved organic carbon. To assess the impact of heavy rainfall and related high surface runoff on surface water quality in the Ammer and the Steinlach Rivers during selected IOPs, water samples were collected both during baseflow conditions and high discharge events. Time-proportional water samples were obtained using autosamplers installed next to the rivers. Grab samples were collected from various tributaries to identify potential water and pollution sources that may have contributed to both high discharge and contamination in the river. Analyses in the laboratory included water isotopes, greenhouse gases (Mwanake et al., 2022), total suspended solids, total organic carbon, dissolved organic matter composition (da Silva et al., 2021), nutrients, trace elements (Baborowski et al., 2004) organic contaminants and associated mixture toxicity (Neale et al., 2020).
3 Swabian MOSES field campaign: Overview
As with most field campaigns focusing on convective storms (e.g., Browning et al., 2007; Kottmeier et al., 2008; Wulfmeyer et al., 2011; Wieser et al., 2022), Swabian MOSES included two types of observational modes: 1) Observations with fully automated, mainly remotely-controlled instruments such as the KITcube or the MoLEAF, covering the period with the most frequent and intense convective storms and, thus, operated during the entire EOP between May and July (slightly reduced until mid-September for possible heat waves and droughts, which did not occur); and 2) ad-hoc decided IOPs on days with a high probability of (severe) thunderstorms according to operational weather forecasts. In case an IOP was scheduled, the automatic systems were supplemented by mobile observations and those requiring a high level of personnel or financial resources, such as aircraft measurements, radiosonde launches, storm chasing, water sampling, or CRR-rides.
3.1 Campaign procedure
During the EOP, the staff foreseen and previously trained for additional or mobile observations had to be on standby and ready to start with the observations if an IOP was scheduled. Excluded were only days or periods on which deep moist convection was highly unlikely due to predicted environmental conditions. During daily briefings, a professional weather forecaster together with the campaign team on duty analyzed the current forecasts with regard to potentially upcoming convection development. Considered were both, ensemble prediction systems with lead times of up to 10 days and high-resolution forecasts with short lead times of one to 2 days. The decision-making processes and the conduction of the IOPs were organized according to Wieser et al., (2022).
The event-based procedure followed of a fixed schedule:
1. Campaign-specific weather report:
Every morning, a weather report with a focus on convection in the study area was provided by EWB Wetterberatung (Bernhard Mühr). This report included forecasts for the next 3 days with a warning table as well as an outlook for the medium-range weather.
2. Daily online briefing:
In a joint online briefing, the current and predicted weather situation was discussed and a decision was made whether an IOP is scheduled for the next days or not. Members of the pre-defined teams were consulted about their availability as well as the required equipment. All partners briefly reported about technical issues such as instrumentation status, failures, or other problems that had to be solved by a maintenance team.
3. Briefing report:
After the meeting, a briefing report was sent out to all partners summarizing the schedule for the next two to 3 days including the decision about a possible IOP with additional instruments foreseen, status of all measuring devices, extended weather forecast, additional information, and—in case of an ongoing IOP—a brief summary of the previous day(s).
3.2 Summary of IOPs during swabian MOSES
Between May and July 2021, seven IOPs were scheduled (in total 21 days), each lasting between one and 8 days. Table 1 provides an overview of all IOPs, including prevailing weather patterns, precipitation characteristics, and additional instruments operated only on IOP days. Most of the IOPs took place during blocking weather conditions, i.e., a dominant high pressure system over or downstream of the study area according to the novel set of Atlantic–European weather regimes by Grams et al. (2018). IOP1 was a test IOP with only shallow convection to check the procedures for the measurements and the handling of the measuring equipment. The focus of IOP2 and IOP3 was on local heavy rainfall events caused by slow moving thunderstorms, which were isolated and unorganized. Severe convective storms accompanied with heavy rain and large hail were observed during IOP4 and IOP5. In the first half of IOP4, high concentrations of Saharan dust were advected in the study area, and convection was not initiated despite very high observed CAPE values of almost 4,000 J kg−1 (Section 4.1.1.1) and although convection was predicted by the operational NWP models. Only a few days later, on 23 June, a supercell causing widespread damage due to large hail and heavy rain moved over the study area and also passed the main site Rottenburg in the afternoon. Another supercell affected the study area on 28 June (IOP5), again with large hail and heavy rainfall, the latter causing flash floods in several regions, including the Ammer and Steinlach catchments. During IOP6 and IOP7, deep moist convection was almost absent in the study area (the latter again with high concentrations of Saharan dust).
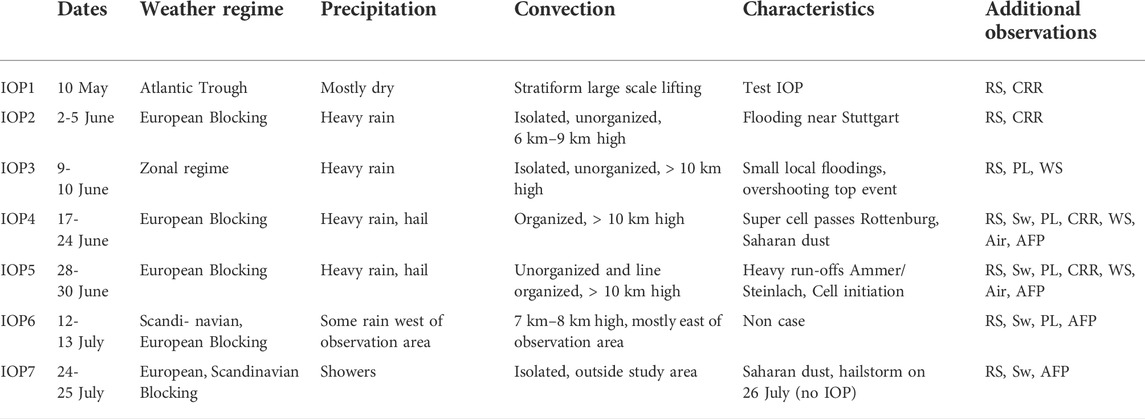
TABLE 1. Overview of all Swabian MOSES IOPs with the following listing columns: Dates, Atlantic–European weather regime (Grams et al., 2018; Büeler et al., 2021), precipitation, convection, characteristics and additional observations. Radiosondes (RS), payloads (PL), swarmsondes (Sw), the cosmic ray rover (CRR), water samplers (WS), aircrafts (Air), and aerosol filter probes (AFP) were used for additional observations. Each IOP started at 00:00 and ended at 23:59 UTC.
Almost all severe convective storms that occurred in the study area (e.g., those with hail diameters of 2 cm or larger according to the DWD WarnWetter-App) were captured by an IOP with additional mobile devices. Only one interesting day with severe thunderstorms on 26 July was missed by the IOP instrumentation (IOP7 ended just the day before). Both the occurrence of a large number of deep convective storms and days without convection despite predicted by the models provide an excellent data basis for further analyses with respect to convection-related processes and event chain investigation. Some selected examples and highlights are presented in the next section.
4 First results and highlights
This section presents first results and highlights from IOP4 (17-24 June) and IOP5 (28-30 June), during which several organized and non-organized convective storms occurred. Southwesterly flow from the Mediterranean associated with a European blocking weather regime (Table 1) provided not only unstable atmospheric conditions as prerequisite for convective development, but also high concentrations of Saharan dust on a few days. During these two IOPs, all teams were on site for conducting additional measurements. These included balloon soundings (radiosonde, payload, swarmsondes) to record atmospheric vertical profiles, aircraft lidar and in situ measurements to estimate flow conditions and turbulence, aerosol filters to determine number concentrations of CCN/INP, CRR-rides to observe soil moisture distributions, and water samplings in the Ammer and Steinlach Rivers to measure contaminant concentrations and turbidity.
Two days, the 23 (IOP4) and the 28 June (IOP5), with the most damaging thunderstorms that occurred throughout the EOP are highlighted in more detail. On 23 June, hail with a maximum diameter of up to 4 cm, hail accumulations on the surface up to 30 cm depth, heavy rainfall and associated flooding were observed on a 70-km streak oriented from southwest to northeast. Insured building damage in the study area amounted to around EUR 150 million. Numerous agricultural fields (especially corn and cereals) were partially or completely damaged, and numerous trees lost their leaves. Severe hailstorms during a 3-day period around 23 June (note that the insurance industry defines events as 72-hour periods) were also reported in other regions of Germany (mainly Bavaria), France, Switzerland, Austria, and the Czech Republic, with total insurance losses approaching EUR 4 billion. The supercell on 28 June spawned slightly smaller hailstones with maximum diameters of 3 cm (insured losses around EUR 5 million). However, heavy rainfall in combination with high soil moisture triggered several flash floods in the study area, resulting in high pollutant loads, for example in the Steinlach and Ammer Rivers. These 2 days impressively demonstrated how extreme events affect and cascade through the different compartments.
To highlight the event chain related to convective storms, this section is separated according to the compartments atmosphere (Section 4.1), geosphere (Section 4.2), and hydrosphere (Section 4.3).
4.1 Atmosphere
Because most of the instruments operated during Swabian MOSES are designed for atmospheric observations, the following section first gives an overview of the entire IOP4/5 (Section 4.1.1) before presenting results for the two selected days, 23 and 28 June, in the second part (Section 4.1.2).
4.1.1 Overview of IOP4/5
4.1.1.1 Atmospheric conditions from radiosoundings
During IOP4 and IOP5, 79 radiosondes were launched at the main site Rottenburg and 52 at the DWD station Stuttgart-Schnarrenberg. The period of these two IOPs was characterized by several distinct phases of convective conditions. At the beginning of IOP4 (17–20 June) a high potential for deep convection was observed. On 19 June, for example, most unstable convective available potential energy [CAPEmu; parcel trajectory that produces the highest value; Markowski and Richardson, 2010] reached values of up to 3,900 J kg−1 in Rottenburg (Figure 2A). Such high values are extremely rare for southern Germany, and occur only once in a few years (Kunz, 2007). At Stuttgart, CAPEmu on that day was slightly lower with values of about 2,400 J kg−1. Total precipitable water (TPW) in Rottenburg increased from 20 mm on 17 June to high values of 38 mm on 20 June, which is also a value that occurs only very rarely (Figure 2B).
Wind shear vector magnitude (SVM) calculated from the wind vector difference between 6 km height and the surface was low (≤10 m s−1) on 17 and 18 June, but increased from 19 June onwards, reaching a value of 22.8 m s−1 on 20 June at 1400 UTC (Figure 2C). Although ambient conditions with high CAPEmu, moderate CIN (e.g., 73 J kg−1 at Rottenburg) and high shear appeared to be favorable for organized convective storms, particularly on 19 June, no thunderstorms formed (Section 4.1.1.2). It is still unclear what exactly prevented the onset of deep moist convection on those days. However, as we will see later in Section 4.1.1.3, high concentrations of Saharan dust were observed at the beginning of IOP4, and especially on 20 July, which may have had a decisive effect on both the radiation and the microphysical processes.
From 20 to 24 June, high CAPEmu values between 700 and 1,900 J kg−1 were measured at both sites, Rottenburg and Stuttgart. However, a drop in CINmu was also observed, facilitating an exceeding of the trigger temperature. Widespread stratiform precipitation during the night of 20 June caused a decrease in TPW to 28 mm. On 23 June, the day with the most severe supercell (Section 4.1.1.2), CAPEmu at the two sites was around 1,600 J kg−1, and TPW has risen again to a level of 32 mm during the day. Likewise, CINmu decreased to almost 0 J kg−1. Wind shear (SVM) observed at Rottenburg (24.15 m s−1 at 1400 UTC) was large enough to support the formation of organized convective storms.
On 28 June, during IOP5, again very high CAPEmu values of 3,000 J kg−1 (2,400 J kg−1 at Stuttgart) in combination with high TPW of 40 mm was observed at Rottenburg. CIN was near 0 J kg−1. SVM higher than 20 m s−1 was measured indicating again favourable condition for organized thunderstorms. Towards the end of IOP5, the convective situation calmed down with decreasing values of CAPEmu and TPW, whereas SVM was still high (20 m s−1). Because of a substantial drop in convection-favoring conditions on the last day of IOP5, 30 June, no sondes at Rottenburg and no additional sondes at Stuttgart-Schnarrenberg were released.
4.1.1.2 Radar-estimated rain totals and convection development
Total precipitation accumulated over the entire IOP4 (Figure 3A) and IOP5 (Figure 3B), respectively, was derived from the X-band radar in Nürtingen (Section 2.3.1.3), complemented by additional data from the C-band radars of KIT and of DWD in Türkheim and Feldberg (Figure 1). For each 5-minute time step and each location, the maximum rain amount derived from the four radars was used to estimate precipitation accumulation composites. For each radar and each azimuth angle, we determined the lowest measurement height not affected by obstacles by additionally using data from a digital elevation model. Following the above described procedure, only radar data as close as possible to the surface entered the composite, which generally makes areal precipitation totals more realistic than using a constant height above ground or elevation. In some areas, however, this resulted to abrupt changes in the underlying elevation and thus to artificial stripes in the radar-estimated precipitation totals (here especially north of Nürtingen). Furthermore, the measuring areas of the individual radars are visible in the composites, and obstacles close to the radar lead to negative spikes (e.g., from the radar Feldberg to the north).
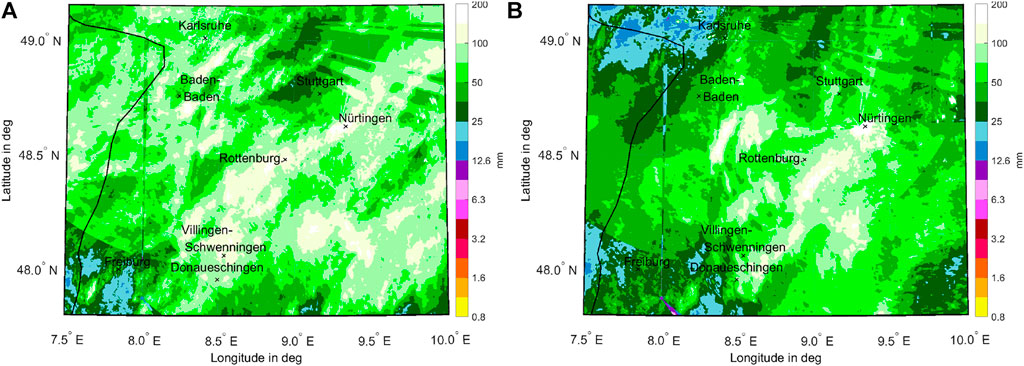
FIGURE 3. Rain totals in mm estimated from the composite of different radars (KIT radars Nürtingen and KIT Campus North, DWD radars Türkheim and Feldberg) during (A) IOP4 (17-24 June, 8 days) and (B) IOP5 (28-30 June, 3 days).
During IOP4, most of the study area was affected by high rainfall with maximum totals exceeding 100 mm. Moderate to heavy rainfall was observed on 20 (mesoscale convective systeme, MCS), 21 (mainly stratiform rain field) and 23 June (isolated convection with a supercell), whereas the other days were almost dry in the study area. The 8-day total mean averaged over the area shown was about 71 mm, with 31% of this detected on 23 June (Figure 3A). Although several convective storms developed during IOP4, both of isolated and mesoscale characteristic, the track of the supercell on 23 June is clearly visible in the composite (compare Figures 3A, 4A). On that day, convection was already triggered over northern Black Forest (8.3° E/48.5° N) when at around 13:00 UTC a new weak storm initialized (Figure 4A). This storm developed slowly and moved in a northeasterly direction, reaching only 45-dBZ-echotops at roughly 5 km height until 13:40 UTC. Probably triggered by the cold pool from that cell, a new cell rapidly developed on the south-eastern flank of the first cell at 14:00, reaching a reflectivity of more than 55 dBZ on side area and immediately covering the area of the first cell. This new cell approximately followed the direction of the initial one until 14:30. Without splitting—which is usually the case for supercells (Markowski and Richardson, 2010) - it turned to the right (so-called right-mover), while at the same time significantly increasing its area and height. Reflectivities of more than 60 dBZ and 45 dBZ echotops at 9 km were reached. At around 15:00, the 50 dBZ area was estimated to cover an area of 300 km2. About half an hour later at 15:45, the storm passed the main site Rottenburg. After moving along the Neckar Valley, the cell propagated almost parallel to the slopes of Swabian Jura, hardly reaching 10 km height, but with reflectivities well above 70 dBZ. Shortly after 17:00, the storm started to dissipate. Individual parts propagated longer than 18:30 UTC.
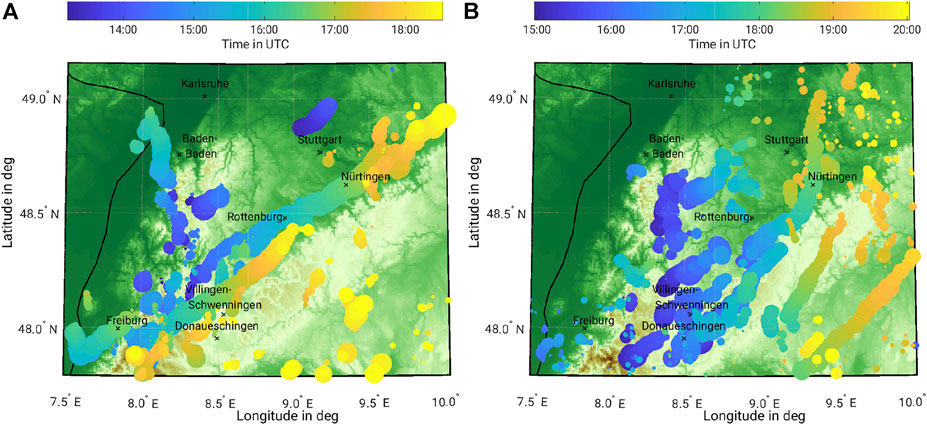
FIGURE 4. Storm tracks on (A) 23 June during IOP4 and (B) on 28 June during IOP5 as determined from radar measurements. The tracking algorithm TRACE3D Handwerker (2002) is used to identify the storm tracks. The color indicates the time (UTC) according to the colorbar above each image. The size of the markers represents the highest reflectivity measured within the storm (maximum size corresponds to roughly 76 dBZ).
During IOP5, significant amounts of rain were observed on all 3 days with a total amount of nearly 53 mm. Severe thunderstorms with heavy rain occurred mainly on the eastern side of Nortern Black Forest, in the Neckar Valley, and over the western slopes of Swabian Jura. As with IOP4, the spatial rainfall distribution was dominated by a single supercell thunderstorm, which developed in the afternoon of 28 July close to the main site Rottenburg (compare Figures 3B, 4B). Around 15:00 UTC, several thunderstorms have already developed over Northern and Southern Black Forest. According to their temporal and spatial proximity, the cold pools from those storms could have acted as trigger for the storm near the main site, which intensified very slowly at the beginning. First signs with weak reflectivities of this storm were visible at 15:15. About 25 min later, maximum reflectivity reached 55 dBZ with the 45 dBZ echotop still under 8 km height. During this stage, the storm was almost stationary, leading to very high precipitation accumulations of more than 100 mm locally (see above). At 15:55, when reflectivities reached more than 65 dBZ even at 8 km height, the storm, now showing signs of a supercell, began to move slowly in a northeasterly direction, as did the storms that had developed over the Black Forest. At this time, the storm cluster covered an area of roughly 75 km in north-south and 40 km in west-east direction. Around 17:00 UTC, when the supercell propagated almost parallel to the slopes of the Swabian Jura, it merged with another storm moving from the southwestern part of the Swabian Jura, to cover an area of more than 500 km2 with reflectivities of more than 55 dBZ. A short time later, the merged convective systems turned to the left, heading to nearly northern directions. Finally, the system dissipated into several smaller cells with decreasing intensities at around 49° N.
Considering that the mean monthly rainfall total for June in the study area (Neckar Valley) is about 100 mm, the totals observed during the 11-day period IOP4 and IOP5 exemplifies how exceptional this period was with a large number of convective storms.
4.1.1.3 Aerosol measurements
The objective of the aerosol measurements (Section 2.3.1.8) was to study how spatial distribution and temporal evolution of aerosol particles correlate with heat, drought, soil moisture, and other meteorological parameters. Furthermore, INP concentrations in relation to other aerosol particle characteristics and meteorological parameters were measured to investigate the role of aerosol particles and INPs for the formation of strong convective clouds. Therefore, aerosols were characterized with respect to their number and mass concentration, size distribution, ice nucleation ability, and their spatial distribution. In addition to the measurements at the main site Rottenburg, mobile INP measurements were performed for special events in conjunction with the mobile operation of the swarmsondes (cf. Section 4.1.2.5).
An especially interesting period during IOP4 is shown in Figure 5, during which a Saharan dust plume was observed at ground level (indicated by the grey shaded areas). This period is marked with higher PM10/PM2.5 ratios (particulate matter with maximum diameter of 10/2.5 µm) and significantly more particles with sizes larger than 2 µm. Note that the particle number concentrations are dominated by smaller particles, as opposed to the mass concentration, which is dominated by the larger ones. The fraction of ice active aerosol particles at 251 K (Figure 5D), calculated by dividing the ice crystal number concentration by the total aerosol number concentration, shows similar patterns as the PM10 concentrations (Figure 5B). The volume depolarization and range corrected backscatter signals of the lidar (Figures 5E,F) illustrate the spatial distribution of the aerosol particles in and above the planetary boundary layer. The Saharan dust plume arrived at noon above the main site at an altitude between 3 and 4 km and reached ground level about 12 h later. Note that aerosol lidar data are not available during precipitation events (cf. Figure 5A).
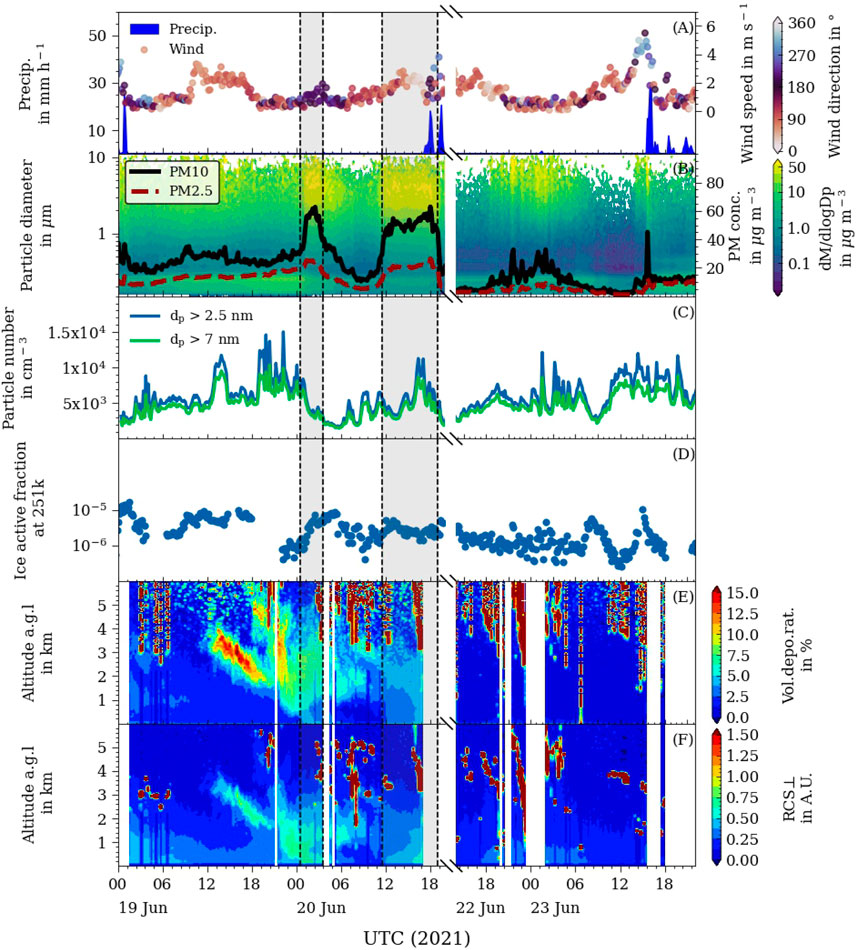
FIGURE 5. Overview of aerosol measurements at the main site Rottenburg during IOP4 with higher concentrations of Saharan dust. (A) Wind speed, wind direction, and precipitation, (B) particle mass (PM10 and PM2.5; lines) and particle mass size distributions (contour), (C) particle number concentrations for particles larger than 2.5 and 7 nm, (D) ice active fraction at 251 K, (E) lidar volume depolarization ratio (contour), (F) lidar range corrected backscatter signal perpendicular to the emitted laser polarization (contour). Grey shaded areas indicate Saharan dust reaching ground level.
Both the PM10 and PM2.5 concentrations were highly affected by thunderstorms. On 20 June around 18:00 UTC, for example, an MCS that passed the main site led to an abrupt decrease in the particle mass concentrations due to precipitation. On 23 June around 15:45 UTC, the concentration of larger particles presumably from the surface (PM10) substantially increased prior the passage of the supercell over the main site (indicated by the shift in the wind direction in Figure 5A; Section 4.1.1.2). Directly with the onset of heavy precipitation (rain and small hail), the PM10 concentration abruptly dropped to low values that remained almost constant until midnight. A direct relation between thunderstorms and the ice active fraction (Figure 5D), however, was not found.
Figure 6 shows the evolution of aerosol particles during IOP5. During this period, no substantial Saharan dust influence was visible. Therefore, aerosol particles in the boundary layer dominated. On 28 July, as the supercell passed the main site, no substantial changes in aerosol properties were detected.
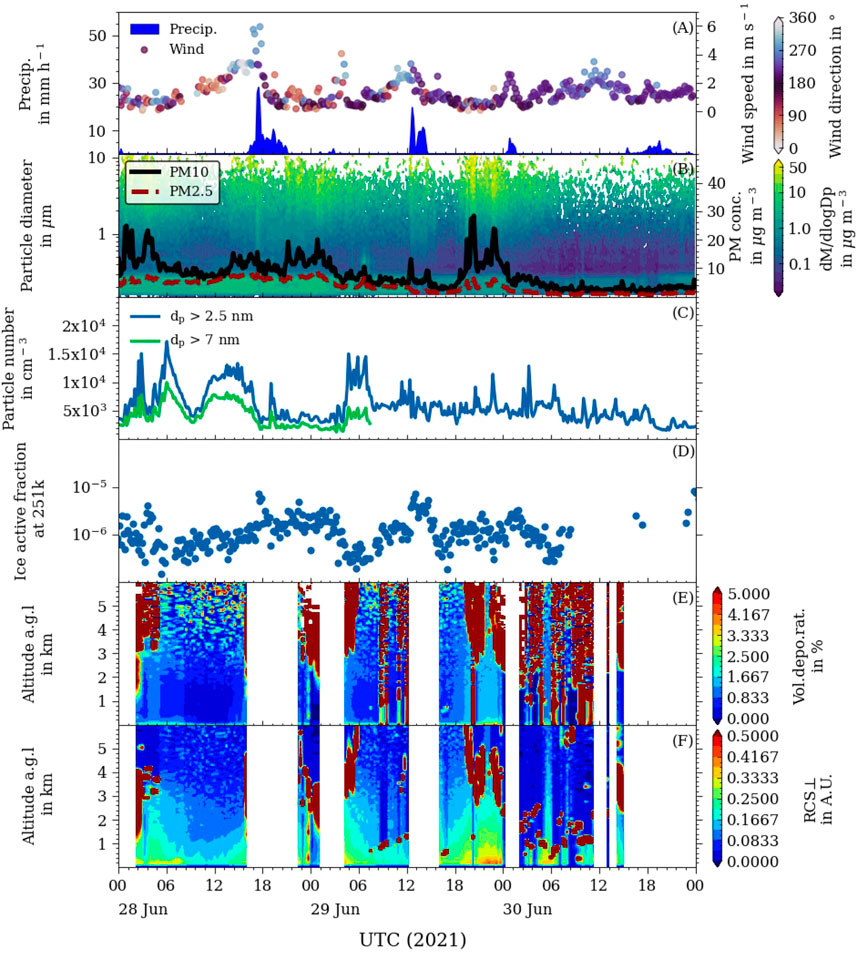
FIGURE 6. Same as Figure 5, but for IOP5.
4.1.2 Highlights on 2 days with the most severe hailstorms
As already mentioned above, the most prominent days during IOP4 and 5 were 23 and 28 June, respectively, with supercells associated with heavy rain and hail in the study area. In the following section, we present some observational highlights for these (and other) interesting days for the compartment atmosphere from instruments that either operated only on single days (e.g., stratospheric balloons, aircraft) or measured convection-related phenomena (e.g., infrasound, hailstone size).
4.1.2.1 Impacts of convection on the lower stratosphere
If deep moist convection is strong enough to overshoot the local tropopause, this can transport large amounts of water vapor and other trace gases into the lower stratosphere, where they impact the radiative budget and thus the climate on longer time scales. We used the stratospheric balloon payloads (Section 2.3.1.2) to investigate this impact on dedicated thunderstorm cases. Figure 7A shows a balloon profile from 20 June at 16:30 UTC (launch time) during IOP4, when an MCS moved over the study area. A clear water vapor enhancement of around 6–8 ppmv compared to background levels of 4–6 ppmv is discernible at pressure levels between about 170 and 150 hPa in the lower stratosphere. The ozone mixing ratio shows a slight negative offset within this layer despite the generally expected increase of ozone with increasing altitude in the lower stratosphere. This is an indication for small-scale in-mixing of tropospheric low-ozone air masses due to the overshoot (Khordakova et al., 2022).
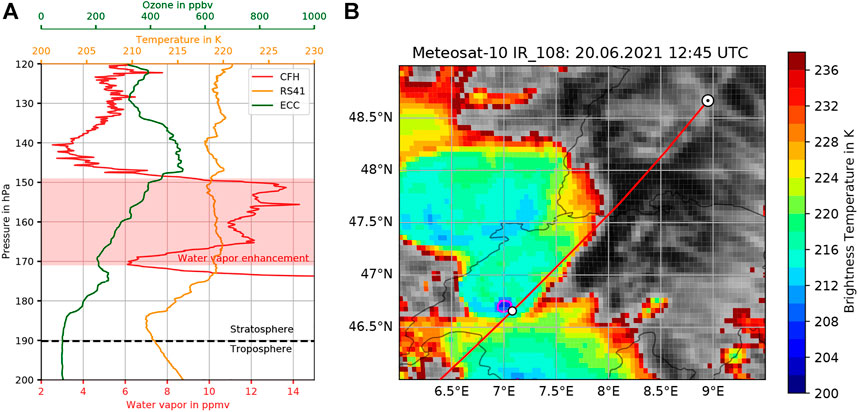
FIGURE 7. (A) Balloon profile of water vapor (red), temperature (orange), and ozone (green) on 20 June at 16:30 UTC launch time. (B) Meteosat10 satellite brightness temperature of the 10.8 µm channel at 12:45 UTC. The red line marks the calculated airmass trajectory from the observed water vapor enhancement (white/black dot) backward in time.
The overshoot was verified and confirmed by means of airmass backward trajectories calculated from ECMWF ERA5 reanalysis (Hersbach et al., 2020) and geostationary EUMETSAT MeteoSat10 brightness temperature satellite observations. Figure 7B shows the cloud top brightness temperature of the 10.8 µm channel at 12:45 UTC together with the airmass trajectory of the water vapor enhancement. Close to the airmass location (white dot), a low brightness temperature signature of around 205 K can be seen (pink circle), which is far lower than the tropopause temperature of 213 K in the balloon observations (Figure 7A). Thus, this part of the cloud cooled adiabatically during the convective forced lift into the lower stratosphere and finally mixed tropospheric air and importantly ice particles into the airmass at the trajectory. Just 5 min later, this overshooting top collapsed back into the main cloud deck, but sublimated ice particles and trace gases remained in the stratospheric air mass, which then was measured at the main site at 17:10 UTC by the balloon. In the balloon profile, an even stronger water vapor enhancement is visible at higher pressures above 170 hPa down to the tropopause, which is also most likely a result of a convective overshoot. This example profile shows that overshooting convection has a significant influence on the water vapor distribution in the lower stratosphere.
More such observations are needed to better constrain how this effect influences the radiation balance and thus the climate, in particular in mid-latitudes. This is all the more important because convective storms are expected to increase in their frequency and to become more severe in response to climate warming and the associated increase in water vapor. Thus, it can be expected that overshoots into the stratosphere likewise become more frequent with the consequence of an increase in water vapor in the lower stratosphere.
4.1.2.2 LAFO: Doppler Lidar, Doppler Cloud Radar
With the combination of lidar and radar instruments at LAFO (see Section 2.3.1.4), we can observe atmospheric features and the development of the ABL from clear sky conditions to the development of clouds. Figures 8A,B shows the vertical and horizontal wind speed, respectively, on 28 June 2021 before the onset of heavy precipitation associated with the supercell at around 18:00 UTC. The vertical wind clearly shows the growth of the convective ABL during the morning hours from 06:00 UTC onwards. This is indicated by up- (red) and downward (blue) motions of turbulent eddies which started from the surface related to the energy intake by insolation after sunrise. With the updraft, moisture from the land-surface was mixed into the ABL. Horizontal wind speed was low in the morning hours, but increased towards the afternoon with northern directions (Figure 8C). In the period before the heavy rain, horizontal wind speed reached values of up to 15 ms−1. With the onset of clouds and rainfall, the measurement range of the Doppler lidars broke down, but the Doppler cloud radar allowed to retrieve vertical wind speed (Figure 8D). The time series shows the falling rain below 3 km, while the clouds reached altitudes of up to 12 km. Heavy rain between 18:00 and 19:00 UTC substantially attenuated the radar beam leading to a gap in most of the vertical profile. More or less with the onset of the heavy rain, the convective ABL collapsed with the consequence that calm wind conditions remained afterwards.
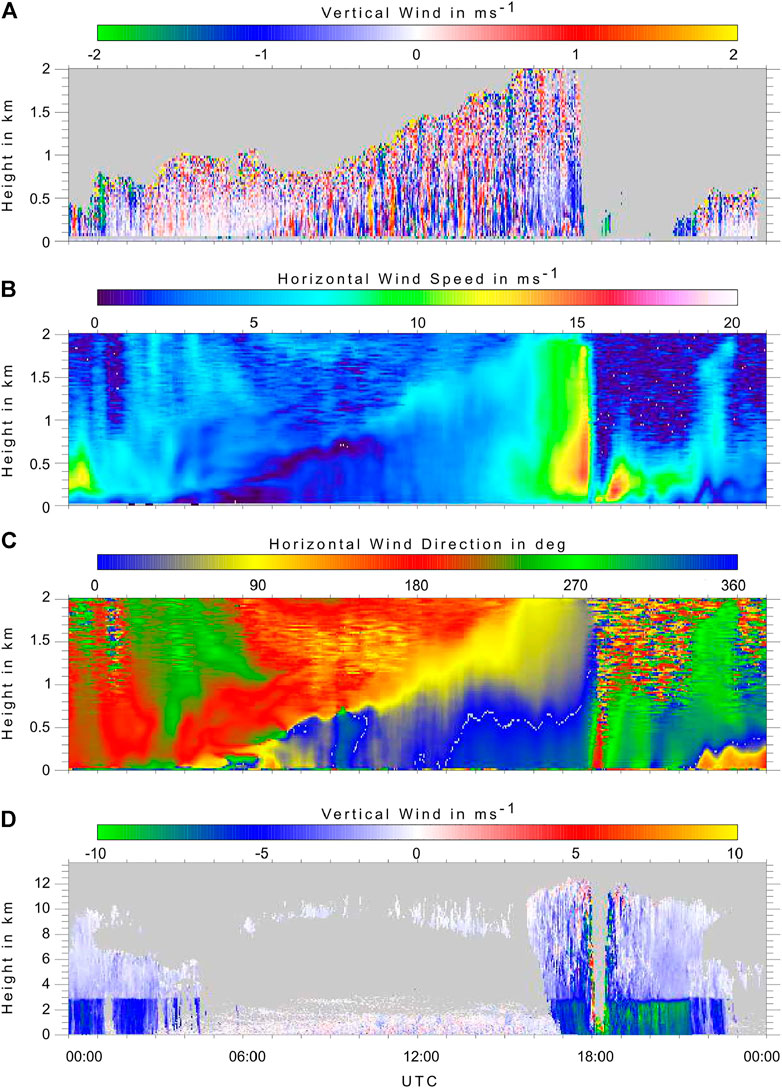
FIGURE 8. LAFO observations on 28 June with Doppler lidar and Doppler cloud radar. With the Doppler lidars, the (A) vertical and (B,C) horizontal wind was observed during the almost cloud-free daytime, especially the development of ABL in the lowest 2 km. Around 18:00 UTC, a high precipitation event was observed. While the Doppler lidars were disturbed by rainfall, the simultaneously operated (D) cloud radar captured the situation inside the clouds. Heavy rain attenuated the radar signal between 18:00 and 19:00 UTC.
4.1.2.3 Targeted aircraft observations of flow characteristics
During IOP4 and IOP5, convection developed on three out of four flight days. The morning flights were always possible without flight path adjustments and concluded prior to the onset of deep convection. For the afternoon flights, take-off times coincided with the beginning of convection initiation (except on 18 June, when deep moist convection developed
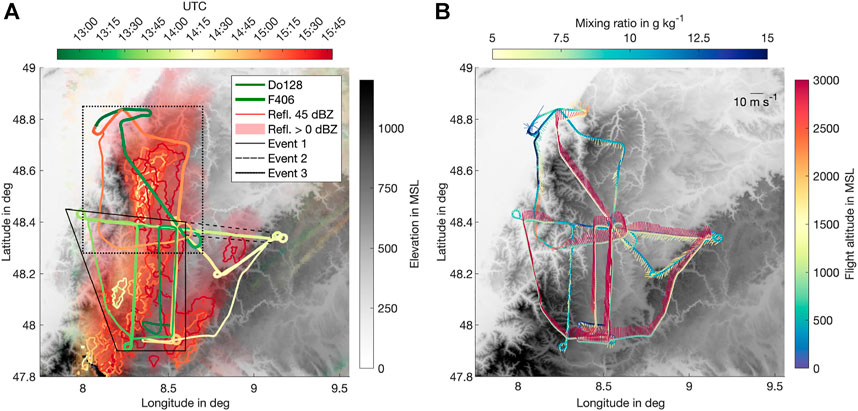
FIGURE 9. Aircraft measurements on 28 June during IOP5. (A) Temporal evolution of the flight tracks of Do128 and F406 aircrafts as well as radar reflectivity in the study area. Reflectivity
After sampling of the convection initiation region, the two aircraft flew eastward towards the Swabian Jura, where convective intensification was expected to occur (event 2). The Do128 transected at 3,000 m, with the F406 flying at 1,400 m below. In situ wind measurements by both aircraft reveal significant wind shear, both in direction and speed, between the two levels in the Neckar region (Figure 9B). After retracing the original flight path from Donaueschingen, both aircraft started their return to Baden airpark. As already discussed in Section 4.1.1.2 and shown in Figure 4B, two other convective cells had developed over Black Forest, creating a total of three cells that moved towards north-east. During descend, the Do128 circumnavigated the cell above Black Forest on the southern side, whereas the F406 circumnavigated the cell on the northern side (event 3). Again, in situ measurements reveal a strong directional shear of the flow due to convergence associated with the convective cell (Figure 9B), which had matured above the 45 dBZ contour shown in Figure 9A approximately 30 min prior to sampling. Similarly, in situ water vapor mixing ratio measurements also show noticeable spatial and vertical variability in the vicinity of the convective cell (Figure 9B).
Overall, this example demonstrates the successful spatio-temporal targeting of convective cells by aircraft measurements. Clear convective system-related flow features are already detectable in the in situ data, with the ADL measurements providing a much more comprehensive and complete picture of the flow situation compared to observations at ground stations (ADL analyses will be presented in detail in a separate paper).
4.1.2.4 Infrasound
Strong pressure fluctuations of up to ±10 Pa were observed during the thunderstorm events of IOP4 and IOP5. Figure 10B visualizes an example of the temporal evolution of the infrasound recording (Section 2.3.1.6) in the afternoon of 28 June during IOP5. The onset of elevated infrasound noise occurred around 17:00 UTC (subperiod highlighted in dark blue) and extended to about 17:45 (subperiod highlighted in light orange in Figure 10B). In this time window the associated thunderstorm cell (supercell) had reached its highest intensity (Section 4.1.1.2; Figure 4B). The frequency distribution of the signal during each subperiod is shown in Figure 10A in corresponding colors. No distinct spectral features are obvious, mostly a broadband increase in the noise level is found. A zoom into the time series reveals numerous confined pressure fluctuations associated with thunder, and these broadband contributions dominate the enhancement of the spectral record. However, a spectrally confined increase of the infrasound level in the 6–8 Hz range might be detectable towards the end of the elevated activity (dashed contour in Figure 10A).
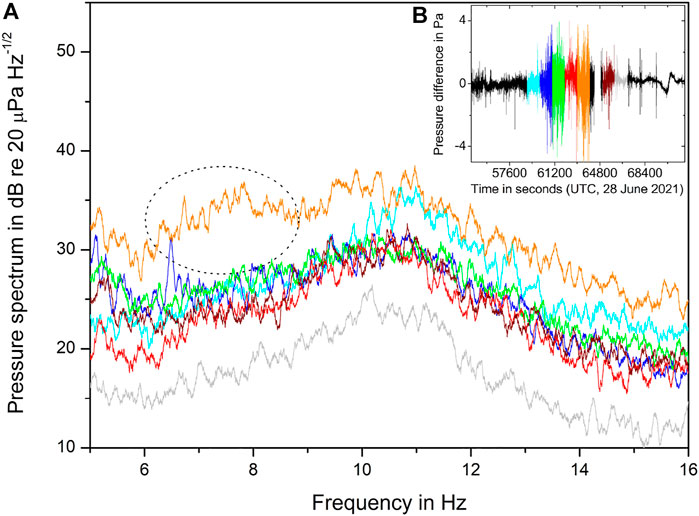
FIGURE 10. (A) Evolution of the measured infrasound spectral distribution during the afternoon of 28 June (IOP5). (B) Shows the time series of measured pressure fluctuations; the colored subsections indicate the time windows used for the Fast Fourier Transform (FFT) analysis. During the maximum of infrasound activity, a spectrally confined increase of the infrasound level might be indicated (dotted marking).
4.1.2.5 Swarmsondes
During IOP4 and IOP5, swarmsondes (Section 2.3.1.7) were launched on 3 days (20, 28, and 29 June). On 28 June, between 16:40 and 17:30 UTC, when the supercell moved towards the main site (Figure 4B), the storm chasing team installed their instrumentation (swarmsondes and mobile aerosol sensors for INP measurements) on the northwestern flank of the cell (approx. 5.5 km eastnortheast of the main site). Five sondes were launched at time intervals between 4 and 7 min (one sounding failed) before heavy rain and an incipient downdraft prevented further balloon launches. Despite the prevailing wind direction and cell propagation from southwest to northeast, the balloons’ trajectories with a speed of up to 15 m s−1 were oriented towards the cell, i.e., first with a southeasterly direction, which slowly turned into a westerly direction (Figure 11A). Interestingly, the wind direction in the lowest 400–600 m above ground level was almost constant, and also wind speed as well as equivalent potential temperature θe (Figure 11B) did not vary much, the latter an indication suggesting that the sondes approximately followed the air parcels on Lagrangian trajectories. Probably as a result of the onset of (heavy) rain, θe decreased in the course of time, i.e. between the individual soundings. Whether the flow directed into the convective cell is a robust indicator of its further intensification needs to be investigated by further soundings.
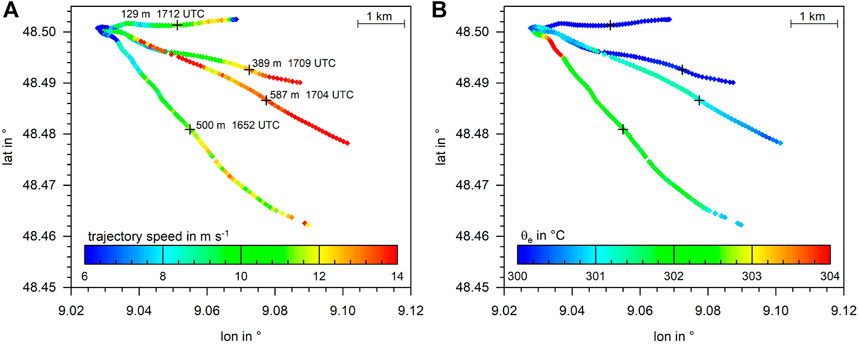
FIGURE 11. Trajectories obtained from swarmsondes in the vicinity of the supercell on 28 June with (A) trajectory speed and (B) equivalent potential temperature θe. The cell propagation at that time was approximately from southwest to northeast (cf. Figure 4B). The crosses in (A) show the maximum height above ground reached (with respective time). The sondes were launched about 5.5 km eastnortheast of the main site Rottenburg.
4.1.2.6 In situ hail observations
On 23 June, five of the eight hail sensors (Section 2.3.1.9) measured maximum hail sizes of 2 cm from the supercell that passed over the main site Rottenburg ealier. At the station of Grossbettlingen (approx. 4 km south of Nürtingen, see Figure 1), for example, 1,132 hailstones with an average diameter of about 1 cm were registered within only 13 min (Figure 12A). The sensor installed at Mittelstadt, located 6 km southwest of the Grossbettlingen station, registered 486 stones with a mean diameter of about 8 mm a few minutes earlier. Despite the difference in mean diameters, the size spectra at the two stations are almost identical with an approximately exponential distribution (Figure 12B). Such hail size spectra, when obtained for a large number of storms, help improve knowledge of the temporal and spatial variability of hail, which in turn is required to better assess (and reduce) hail risk.
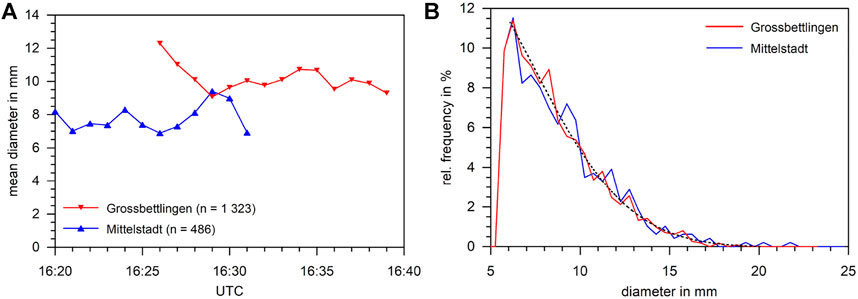
FIGURE 12. Hail observations on 23 June 2021 at the stations of Grossbettlingen and Mittelstadt. (A) Time series of mean diameter (1-min means; n indicates the number of observed hailstones) and (B) size spectra (exponential distribution as black dotted line, estimated from the Grossbettlingen data).
4.2 Near-surface measurements
4.2.1 Soil moisture and soil temperature
During Swabian MOSES, soil measuring nodes (Section 2.3.2.1) were installed at six locations. Figure 13B shows an example of the data for the Haigerloch site for the period that includes both IOP4 and and IOP5. During IOP4, three CRNS-rover measurements were conducted to map root-zone soil moisture at the meso to regional scales. The data were processed using the accepted methods for the correction of atmospheric and road-related effects (Schrön et al., 2018b). The results are indicated by the dots in Figure 13B. For a better understanding of processes and cross-compartment event chain, the time series measured at the same location of total precipitation and rain rate derived from PARSIVEL distrometer data and energy fluxes between land surface and atmosphere derived from the MoLEAF tower are included in Figure 13 as panels A and C.
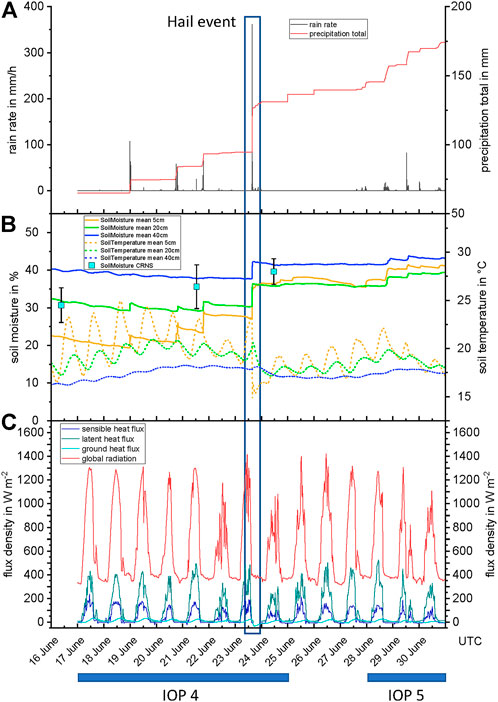
FIGURE 13. Cross-compartment time series of (A) daily total precipitation and rain rate, (B) soil moisture, soil temperature at 5, 20 and 40 cm depth and CRNS-rover measurements at 3 days at the location, and (C) energy fluxes at the Haigerloch site.
Regarding the measurement period of IOP4 and IOP5 (17–30 June), a saturation of the soil layers driven by multiple precipitation events is recognizable. Especially the hail and heavy rain event on 23 June during IOP4 (cf. Figure 4) shows a clear effect of heavy precipitation down to a depth of 40 cm for the first time during the campaign. The measured soil temperature at a depth of 5 cm also shows a significant and abrupt cooling of the near-surface soil layers by more than 7 K due to the large hailstones at this site. A few hours after the hail event, a temperature decrease at 40 cm depth was also recorded after a short temperature increase.
4.2.2 Vertical energy fluxes at the surface
The micrometeorological measurements taken by the MoLEAF at the Haigerloch site (Section 2.3.2.3) show a period of 5 days with few clouds at the beginning of IOP4 (Figure 13C). Daytime Bowen ratios were between 0.3 and 0.5, which is typical for temperate grasslands during the summer. Then on 22 June, increased cloudiness resulted in much smaller net radiation and, as a consequence, also in smaller latent and sensible heat fluxes. On 23 June, the day of the severe hail event, net radiation and turbulent fluxes developed similar to the days with few clouds until about noon, when net radiation and the turbulent fluxes dropped suddenly as a result of increased cloud coverage. Also the soil heat flux decreased sharply at the same time. The increased soil moisture after this intense precipitation resulted in slightly lower Bowen ratios on the subsequent days, continuing throughout IOP5.
4.3 Surface Waters
Intense rainfall can lead to high discharge in rivers causing severe flood events and mobilization of particles and contaminants. The Ammer River is characterized by a mean annual discharge of 0.87 m3 s−1 (see2) at the main river sampling site (Figure 1B). During IOP4 and IOP5, the areal rain rate in the catchment exceeded 8 mm h−1 for six times. However, only during two intense storm events during IOP5, on 28 and 29 June (Section 4.1.1.2 and Figure 4B), heavy precipitation with areal rain rates of up to 20 mm h−1 led to distinct discharge peaks with maximum values of 11 m3s −1 (Figure 14A). The increase in river discharge was accompanied with an increase in water turbidity indicating mobilization and transport of suspended solids.
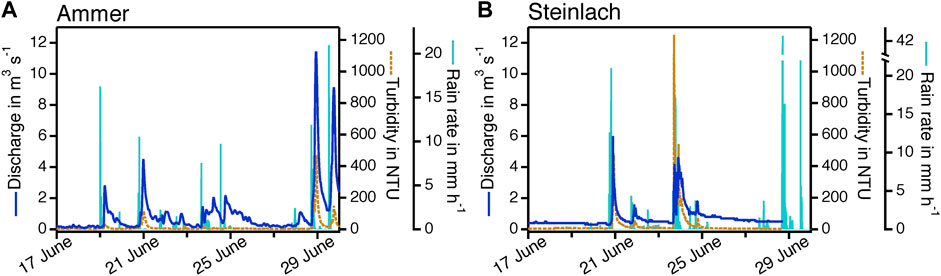
FIGURE 14. Discharge and turbidity in (A) the Ammer River and (B) the Steinlach River over the course of different rain events. Precipitation is shown as rain rate in the Ammer and Steinlach catchments, respectively.
The Ammer catchment has a flat topography and the soils show poor hydraulic connectivity to the river network. High discharge and turbidity in the Ammer River are, thus, predominantly triggered and controlled by locally generated runoff from urban areas and outfalls of the sewage systems (Schwientek et al., 2013a), and can hardly be predicted by catchment precipitation only.
The Steinlach River has an annual mean discharge of 1.84 m3 s−1. During IOP4, two major storm events on 20 and 23 June (Section 4.1.1.2 and Figure 4A) occurred in the Steinlach catchment leading to maximum rain rates of 17 mm h−1 (Figure 14B). During both storm events, the discharge in the Steinlach River increased markedly up to 5 m3 s−1. During IOP5, maximum rain rates of 47 mm h−1 led to a sharp rise in discharge. This 50-year flood event in the Steinlach River flushed away the measuring instruments, causing a lack of data for the period after 29 June.
The Steinlach catchment is characterized by steep hill slopes, which promote fast surface runoff components (Schwientek and Selle, 2016) from forested and urban areas resulting in prompt discharge and turbidity peaks in the river. Increased turbidity values are due to high concentrations of suspended particles that are likely flushed into the river from surfaces but may also originate from the riverbed. Current ongoing investigations aim to link the observed discharge and turbidity measurements with water quality parameters including nutrients, metals, and organic contaminants to identify major pollution sources in the catchments [Glaser et al., 2020; Spahr et al., 2020], and assess risks for aquatic ecosystems and drinking water resources.
5 Conclusion and outlook
Despite significant advances in meteorological monitoring systems and NWP models in recent years, accurate forecasting of convective storms and the associated impacts, such as high runoff and resulting destructive flooding, remains a significant challenge. The limited prediction capability is partially due to the complex interactions of various processes leading to the formation and development of convective cells and their impacts. The relevant processes are usually not fully covered or resolved over a sufficiently large range of scales by operationally available observations. The Swabian MOSES field campaign offers a major advance in our observational capacities by synergistically combining a broad range of state-of-the-art in situ and remote sensing instruments.
The campaign was conducted between May and September 2021 in the Neckar Valley and over the Swabian Jura in southwestern Germany, a major hot spot of severe convective storms. Participation of research institutes from different disciplines additionally created synergy in deploying equipment and personnel. It also promotes a gain of scientific knowledge, especially via improved observation and understanding of the event chain associated with convective storms. The overall cross-disciplinary observation strategy presented in this paper provides new ways of creating an integrative and scale-bridging understanding of event chains. It provides a blueprint for future investigations of hydro-meteorological extremes that rely on short-term responses, such as convective storms. The comprehensive data set from the campaign allows us to conduct individual detailed process studies and scrutinize and better understand the cross-scale process interactions and the entire associated event chain.
This paper has given a broad overview of the Swabian MOSES 2021 campaign, including a description of the observation strategy and the instruments involved. Observational highlights have been presented for two IOPs, during which both organized and unorganized convective storms occurred. A focus was placed on the application and testing of new instruments and/or observation techniques, such as the CRNS-rover used to estimate soil moisture over a range of several hundred meters, the airborne Doppler lidar system to provide evidence of low-level convergence zones and the relation to convection triggering, the infrasound detector used to observe how these waves are emitted from thunderstorms, or the swarmsonde deployment to obtain high temporal resolution vertical atmospheric profiles.
Following the successful measurement campaign and the post-processing of the different observation datasets, these are currently being analyzed for specific questions on individual processes and mechanisms as well as for cross-compartment considerations in the sense of the event chain. In order to make the best use of synergies from the collaboration of the different disciplines, four thematically-oriented working groups have been established for further analyses: 1) Atmospheric Dynamics, Convection, and Modeling; 2) Atmospheric Dynamics and Aerosols, 3) Exchange Processes Land-Atmosphere; and 4) Surface Waters. The analyses of the measured data obtained during Swabian MOSES are supplemented by numerical model simulations to further close the gap to processes that are not observed or cannot be monitored. For example, aerosol measurements are combined with both meteorological observations (e.g., radar, soundings) and DWD/KIT’s ICON-ART numerical weather prediction (NWP) model (Rieger et al., 2015) to better understand how aerosol particles - particularly mineral dust – determines the development of convective clouds and precipitation. High-resolution NWP model simulation will be used to investigate when and why precipitation forecasts have sometimes been particularly inaccurate, and how prevailing ambient conditions at different scales determine forecast skill. Near-surface flow convergences, which are hypothesized of being responsible for the increased number of convective storms in the study area, are currently inferred from the combination of lidar-observed wind profiles and thunderstorm tracks determined by applying a cell tracking algorithm to all cells over the entire campaign. The objective here is to assess the importance of flow convergence for thunderstorm development relative to thermodynamic factors. Soil moisture observations collected with CRNS and in-situ sensors will be used to evaluate the aircraft F-SAR sensor, inverting the latter to soil moisture information products. In this context, models will be extended for soil moisture estimation under the vegetation cover, which is currently not the case. These are a few examples of current and future research that will also be published in the near future. In addition, a special data paper with expanded meta data and links to data archives is in preparation.
Building on the successes of our 2021 Swabian MOSES campaign and the lessons learned, the project team is currently planning a second campaign for summer 2023 in the same region. While the overall strategy, approach and scientific objectives remain largely unchanged, the campaign will be extended and adapted to address the issues of the diverse participants. New topics currently being discussed and planned include the following:
a) Improving the linkages between observations and numerical modelling using the data assimilation capabilities of DWD; moreover, combining aerosols (lidar) and cloud (radar) measurements with dedicated cloud-resolving models (ICON) will allow us to better constrain the reasons for the differences between predicted and observed storm development (including influence of Saharan dust on convection);
b) Inclusion of impact-based forecasting for the different convective perils in the decision on potentially interesting situations;
c) Enhancement of the interaction and dialog with authorities and agencies of federal, state and local level to better address their specific needs;
d) Involvement of the public via citizen science (e.g.,participation in the collection of data, exchange of knowledge and scientific experience);
e) Adding research operations focusing on urban areas;
f) Integrating new partners (e.g., the Collaborative Research Center 301, “The tropopause region in a changing atmosphere,” with possible additional aircraft measurements);
g) Integrating new instruments, such as ground-based water vapor lidars and a Global Navigation Satellite System (GNSS) Integrated Water Vapor (IWV) station network, gravimetric methods to monitor total water in the soil and ground, drone-based observations, KITsonde dropsondes, and a prototype of a new airborne lidar;
h) Improving instruments that functioned suboptimally in 2021 and other operation modes, such as hail trajectory observations using swarmsondes and further development of the infrasound sensor into at least a bistatic setup to provide azimuthal information.
Depending on the meteorological conditions, the 2023 campaign will provide additional data on intense convection and sufficiently long, warm and dry periods to examine multiple aspects of heat waves and drought.
Data availability statement
The raw data supporting the conclusion of this article will be made available by the authors, without undue reservation.
Author contributions
All authors contributed to the conception, organization, and design of the Swabian MOSES 2021 campaign and of the monitoring systems. Responsible campaign coordinators were AW, MK, and JW. Material preparation, data collection, and analysis were performed by all authors. The draft of the manuscript was written by the above listed authors and by JW and UW. All authors complemented and improved the manuscript. All authors read parts of the manuscript, some the entire manuscript, gave feedback, and approved the final manuscript.
Funding
This work was supported by funding from the Helmholtz Association within the framework of MOSES. Parts of this work were conducted in collaboration with the DFG (German Research Foundation) Collaborative Research Center CAMPOS (CRC-1253) at the University of Tübingen. AirCore flights were also supported by the ERC project EXC3ITE (EXC3ITE-678904-ERC-2015-STG).
Acknowledgments
This project made use of the facilities that are part of the KITcube (Kalthoff et al., 2013). We thank all participating Helmholtz centers for their additional personal and financial support. We acknowledge the support of the former acting director of IMK-TRO, Joaquim Pinto. We would like to express our sincere thanks to the workshop staff, technicians and student workers of KIT, UFZ, and the University of Tübingen. We gratefully acknowledge access to the platform CITEPro (Chemicals in the Terrestrial Environment Profiler) funded by the Helmholtz Association. The execution of the measurement campaign would not have been possible without their tireless efforts, even on weekends and at night. The authors thank Bernhard Mühr from EWB Wetterberatung (wetterberatung.com) for his profound daily weather reports and the presentation of the forecasts during daily briefings, which played an important role in the success of the Swabian MOSES. Manuel Schmidberger (KIT) is acknowledged for his support of the campaign webpage3,4,5. The German Weather Service (DWD) is acknowledged for their support of additional radiosonde launches and their network data. We would like to thank EUMETSAT for the Metop10 brightness temperature data. We are grateful to the ECMWF for their meteorological reanalysis data support, and Stefan Thern from Siemens AG Karlsruhe for providing EUCLID lightning data and access to the real-time lightning detection system BLIDS. We thank Isabell Kramer and her family for hosting the infrasound sensor. Our special thanks go to the landlords Ammertal Schönbuch Gruppe (Ralf Göttsche), Alfons Vollmer, and regional governor Klaus Tappeser for their support at the main site Rottenburg, Stadtwerke Nürtingen, councilor Felix Doll, and Ulrich Schaber at Nürtingen, Benjamin Beuter, Thomas Dannenmann, Jürgen Böhmler, GVV Donaueschingen (Martin Eschenhagen), Biogasanlage Dieter, and Stadtwerke Sulz at the dependance sites, all the landlords of the network sites, as well as the local people for their support and interest. We acknowledge funding from the Initiative and Networking Fund of the Helmholtz Association through project “Digital Earth” (funding code ZT-0025).
Conflict of interest
The authors declare that the research was conducted in the absence of any commercial or financial relationships that could be construed as a potential conflict of interest.
Publisher’s note
All claims expressed in this article are solely those of the authors and do not necessarily represent those of their affiliated organizations, or those of the publisher, the editors and the reviewers. Any product that may be evaluated in this article, or claim that may be made by its manufacturer, is not guaranteed or endorsed by the publisher.
Supplementary material
The Supplementary Material for this article can be found online at: https://www.frontiersin.org/articles/10.3389/feart.2022.999593/full#supplementary-material
Footnotes
1https://lafo.uni-hohenheim.de/en/1670.
2https://www.hvz.baden-wuerttemberg.de.
3https://www.atmohub.kit.edu/english/105.php.
4https://moses-data.gfz-potsdam.de/onestop/.
5https://www.atmohub.kit.edu/english/105.php.
References
Alessi, M. J., Herrera, D. A., Evans, C. P., DeGaetano, A. T., and Ault, T. R. (2022). Soil moisture conditions determine land-atmosphere coupling and drought risk in the northeastern United States. JGR. Atmos. 127, e2021JD034740. doi:10.1029/2021JD034740
Baborowski, M., von Tümpling, W., and Friese, K. (2004). Behaviour of suspended particulate matter (SPM) and selected trace metals during the 2002 summer flood in the River Elbe (Germany) at Magdeburg monitoring station. Hydrol. Earth Syst. Sci. 8, 135–150. doi:10.5194/hess-8-135-2004
Bedard, A. (2005). Low-frequency atmospheric acoustic energy associated with vortices produced by thunderstorms. Mon. Weather Rev. 133, 241–263. doi:10.1175/MWR-2851.1
Behrendt, A., Wulfmeyer, V., Hammann, E., Muppa, S. K., and Pal, S. (2015). Profiles of second- to fourth-order moments of turbulent temperature fluctuations in the convective boundary layer: First measurements with rotational Raman lidar. Atmos. Chem. Phys. 15, 5485–5500. doi:10.5194/acp-15-5485-2015
Behrendt, A., Wulfmeyer, V., Senff, C., Muppa, S. K., Späth, F., Lange, D., et al. (2020). Observation of sensible and latent heat flux profiles with lidar. Atmos. Meas. Tech. 13, 3221–3233. doi:10.5194/amt-13-3221-2020
Bonin, T. A., Choukulkar, A., Brewer, W. A., Sandberg, S. P., Weickmann, A. M., Pichugina, Y. L., et al. (2017). Evaluation of turbulence measurement techniques from a single Doppler lidar. Atmos. Meas. Tech. 10, 3021–3039. doi:10.5194/amt-10-3021-2017
Braga, R. C., Rosenfeld, D., Weigel, R., Jurkat, T., Andreae, M. O., Wendisch, M., et al. (2017). Further evidence for CCN aerosol concentrations determining the height of warm rain and ice initiation in convective clouds over the Amazon basin. Atmos. Chem. Phys. 17, 14433–14456. doi:10.5194/acp-17-14433-2017
Browning, K. A., Blyth, A. M., Clark, P. A., Corsmeier, U., Morcrette, C. J., Agnew, J. L., et al. (2007). The convective storm initiation project. Bull. Am. Meteorol. Soc. 88, 1939–1956. doi:10.1175/BAMS-88-12-1939
Brudler, S., Rygaard, M., Arnbjerg-Nielsen, K., Hauschild, M. Z., Ammitsøe, C., and Vezzaro, L. (2019). Pollution levels of stormwater discharges and resulting environmental impacts. Sci. Total Environ. 663, 754–763. doi:10.1016/j.scitotenv.2019.01.388
Büeler, D., Ferranti, L., Magnusson, L., Quinting, J. F., and Grams, C. M. (2021). Year-round sub-seasonal forecast skill for Atlantic–European weather regimes. Q. J. R. Meteorol. Soc. 147, 4283–4309. doi:10.1002/qj.4178
Coffer, B. E., and Parker, M. D. (2022). Infrasound signals in simulated nontornadic and pre-tornadic supercells. J. Acoust. Soc. Am. 151, 939–954. doi:10.1121/10.0009400
Corsmeier, U., Hankers, R., and Wieser, A. (2001). Airborne turbulence measurements in the lower troposphere onboard the research aircraft Dornier 128-6, D-IBUF. metz. 10, 315–329. doi:10.1127/0941-2948/2001/0010-0315
Cui, Z., Pu, Z., Emmitt, G. D., and Greco, S. (2020). The impact of airborne Doppler aerosol wind (DAWN) lidar wind profiles on numerical simulations of tropical convective systems during the nasa convective processes experiment (CPEX). J. Atmos. Ocean. Technol. 37, 705–722. doi:10.1175/JTECH-D-19-0123.1
da Silva, M. P., Blaurock, K., Beudert, B., Fleckenstein, J., Hopp, L., Peiffer, S., et al. (2021). Delineating source contributions to stream dissolved organic matter composition under baseflow conditions in forested headwater catchments. JGR. Biogeosciences 126, e2021JG006425. doi:10.1029/2021JG006425
De Wekker, S., Godwin, K., Emmitt, G., and Greco, S. (2012). Airborne Doppler lidar measurements of valley flows in complex coastal terrain. J. Appl. Meteorol. Climatol. 51, 1558–1574. doi:10.1175/JAMC-D-10-05034.1
Dennis, E. J., and Kumjian, M. R. (2017). The impact of vertical wind shear on hail growth in simulated supercells. J. Atmos. Sci. 74, 641–663. doi:10.1175/JAS-D-16-0066.1
Doswell, C. A. (1987). The distinction between large-scale and mesoscale contribution to severe convection: A case study example. Wea. Forecast. 2, 3–16. doi:10.1175/1520-0434(1987)002⟨0003:TDBLSA⟩2.0.CO;2
Engel, A., Boenisch, H., Ullrich, M., Sitals, R., Membrive, O., Danis, F., et al. (2017). Mean age of stratospheric air derived from AirCore observations. Atmos. Chem. Phys. 17, 6825–6838. doi:10.5194/acp-17-6825-2017
Enno, S.-E., Sugier, J., Alber, R., and Seltzer, M. (2020). Lightning flash density in Europe based on 10 years of ATDnet data. Atmos. Res. 235, 104769. doi:10.1016/j.atmosres.2019.104769
Fluck, E., Kunz, M., Geissbuehler, P., and Ritz, S. P. (2021). Radar-based assessment of hail frequency in Europe. Nat. Hazards Earth Syst. Sci. 21, 683–701. doi:10.5194/nhess-21-683-2021
García-Herrera, R., Díaz, J., Trigo, R. M., Luterbacher, J., and Fischer, E. M. (2010). A review of the European summer heat wave of 2003. Crit. Rev. Environ. Sci. Technol. 40, 267–306. doi:10.1080/10643380802238137
Gasch, P. (2021). Advancing airborne Doppler lidar wind measurements for atmospheric boundary layer research. Ph.D. thesis. Karlsruhe (Germany): Karlsruhe Institute of Technology KIT.
Ghadge, A., Wurtmann, H., and Seuring, S. (2020). Managing climate change risks in global supply chains: A review and research agenda. Int. J. Prod. Res. 58, 44–64. doi:10.1080/00207543.2019.1629670
Glaser, C., Zarfl, C., Rügner, H., Lewis, A., and Schwientek, M. (2020). Analyzing particle-associated pollutant transport to identify in-stream sediment processes during a high flow event. Water 12, 1794. doi:10.3390/w12061794
Görsdorf, U., Lehmann, V., Bauer-Pfundstein, M., Peters, G., Vavriv, D., Vinogradov, V., et al. (2015). A 35-GHz polarimetric Doppler radar for long-term observations of cloud parameters—Description of system and data processing. J. Atmos. Ocean. Technol. 32, 675–690. doi:10.1175/JTECH-D-14-00066.1
Grams, C. M., Magnusson, L., and Madonna, E. (2018). An atmospheric dynamics perspective on the amplification and propagation of forecast error in numerical weather prediction models: A case study. Q. J. R. Meteorol. Soc. 144, 2577–2591. doi:10.1002/qj.3353
Grangeon, J., and Lesage, P. (2019). A robust, low-cost and well-calibrated infrasound sensor for volcano monitoring. J. Volcanol. Geotherm. Res. 387, 106668. doi:10.1016/j.jvolgeores.2019.106668
Handwerker, J. (2002). Cell tracking with TRACE3D—a new algorithm. Atmos. Res. 61, 15–34. doi:10.1016/S0169-8095(01)00100-4
Hersbach, H., Bell, B., Berrisford, P., Hirahara, S., Horányi, A., Muñoz-Sabater, J., et al. (2020). The ERA5 global reanalysis. Q. J. R. Meteorol. Soc. 146, 1999–2049. doi:10.1002/qj.3803
Hoeppe, P. (2016). Trends in weather related disasters – consequences for insurers and society. Weather Clim. Extrem. 11, 70–79. doi:10.1016/j.wace.2015.10.002
Holz, D. J., Williard, K. W., Edwards, P. J., and Schoonover, J. E. (2015). Soil erosion in humid regions: A review. J. Contemp. Water Res. Educ. 154, 48–59. doi:10.1111/j.1936-704X.2015.03187.x
Hübl, J. (2017). “Hochwasser Simbach 2016: Dokumentation und Analyse,” in Vorsorgender und nachsorgender Hochwasserschutz. Editor S. Heimerl (Wiesbaden, Deutschland): Springer Vieweg-Verlag), 139–150.
Jing, X., Shao, X., Liu, T.-C., and Zhang, B. (2021). Comparison of gruan rs92 and rs41 radiosonde temperature biases. Atmosphere 12, 857. doi:10.3390/atmos12070857
Joerg, H., Pardini, M., Hajnsek, I., and Papathanassiou, K. P. (2017). On the separation of ground and volume scattering using multibaseline SAR data. IEEE Geosci. Remote Sens. Lett. 14, 1570–1574. doi:10.1109/LGRS.2017.2723980
Johns, R. H., and Doswell, C. A. (1992). Severe local storms forecasting. Wea. Forecast. 7, 588–612. doi:10.1175/1520-0434(1992)007<0588:slsf>2.0.co;2
Kalthoff, N., Adler, B., Wieser, A., Kohler, M., Träumner, K., Handwerker, J., et al. (2013). KITcube–a mobile observation platform for convection studies deployed during HyMeX. metz. 22, 633–647. doi:10.1127/0941-2948/2013/0542
Khordakova, D., Rolf, C., Grooss, J.-U., Mueller, R., Konopka, P., Wieser, A., et al. (2022). A case study on the impact of severe convective storms on the water vapor mixing ratio in the lower mid-latitude stratosphere observed in 2019 over Europe. Atmos. Chem. Phys. 22, 1059–1079. doi:10.5194/acp-22-1059-2022
Köbele, D. (2014). Analyse von Konvergenzbereichen bei Hagelereignissen stromab von Mittelgebirgen anhand von COSMO-Modellsimulationen. Master’s thesis. Karlsruhe (Germany): Institute of Meteorology and Climate Research, Karlsruhe Institute of Technology KIT, 90.
Köhli, M., Schrön, M., Zreda, M., Schmidt, U., Dietrich, P., and Zacharias, S. (2015). Footprint characteristics revised for field-scale soil moisture monitoring with cosmic-ray neutrons. Water Resour. Res. 51, 5772–5790. doi:10.1002/2015WR017169
Kottmeier, C., Kalthoff, N., Barthlott, C., Corsmeier, U., van Baelen, J., Behrendt, A., et al. (2008). Mechanisms initiating deep convection over complex terrain during COPS. metz. 17, 931–948. doi:10.1127/0941-2948/2008/0348
Krause, J. M. (2016). A simple algorithm to discriminate between meteorological and nonmeteorological radar echoes. J. Atmos. Ocean. Technol. 33, 1875–1885. doi:10.1175/JTECH-D-15-0239.1
Kunz, M., Blahak, U., Handwerker, J., Schmidberger, M., Punge, H. J., Mohr, S., et al. (2018). The severe hailstorm in southwest Germany on 28 july 2013: Characteristics, impacts and meteorological conditions. Q. J. R. Meteorol. Soc. 144, 231–250. doi:10.1002/qj.3197
Kunz, M., and Puskeiler, M. (2010). High-resolution assessment of the hail hazard over complex terrain from radar and insurance data. metz. 19, 427–439. doi:10.1127/0941-2948/2010/0452
Kunz, M. (2007). The skill of convective parameters and indices to predict isolated and severe thunderstorms. Nat. Hazards Earth Syst. Sci. 7, 327–342. doi:10.5194/nhess-7-327-2007
Kunz, M., Wandel, J., Fluck, E., Baumstark, S., Mohr, S., and Schemm, S. (2020). Ambient conditions prevailing during hail events in central Europe. Nat. Hazards Earth Syst. Sci. 20, 1867–1887. doi:10.5194/nhess-20-1867-2020
Lange, D., Behrendt, A., and Wulfmeyer, V. (2019). Compact operational tropospheric water vapor and temperature Raman Lidar with turbulence resolution. Geophys. Res. Lett. 46, 14844–14853. doi:10.1029/2019GL085774
Laube, J. C., Elvidge, E. C. L., Adcock, K. E., Baier, B., Brenninkmeijer, C. A. M., Chen, H., et al. (2020). Investigating stratospheric changes between 2009 and 2018 with halogenated trace gas data from aircraft, AirCores, and a global model focusing on CFC-11. Atmos. Chem. Phys. 20, 9771–9782. doi:10.5194/acp-20-9771-2020
Lausch, A., Borg, E., Bumberger, J., Dietrich, P., Heurich, M., Huth, A., et al. (2018). Understanding forest health with remote sensing, part III: Requirements for a scalable multi-source forest health monitoring network based on data science approaches. Remote Sens. 10, 1120. doi:10.3390/rs10071120
Lenschow, D. H., Wulfmeyer, V., and Senff, C. (2000). Measuring second-through fourth-order moments in noisy data. J. Atmos. Ocean. Technol. 17, 1330–1347. doi:10.1175/1520-0426(2000)017⟨1330:MSTFOM⟩2.0.CO;2
Lhotka, O., Kyselỳ, J., and Farda, A. (2018). Climate change scenarios of heat waves in Central Europe and their uncertainties. Theor. Appl. Climatol. 131, 1043–1054. doi:10.1007/s00704-016-2031-3
Lohmann, U., Lüönd, F., and Mahrt, F. (2016). An introduction to clouds: From the microscale to climate. Cambridge, United Kingdom): Cambridge University Press, 391.
Markowski, P. M., Richardson, Y. P., Richardson, S. J., and Petersson, A. (2018). Aboveground thermodynamic observations in convective storms from balloonborne probes acting as pseudo-Lagrangian drifters. Bull. Am. Meteorol. Soc. 99, 711–724. doi:10.1175/BAMS-D-17-0204.1
Markowski, P., and Richardson, Y. (2010). Mesoscale meteorology in midlatitudes. Chichester, United Kingdom): John Wiley & Sons, Ltd., Publication, 407.
Masson-Delmotte, V., Zhai, P., Pirani, A., Connors, S. L., Péan, C., Berger, S., et al. (2021). Climate change 2021: The physical science basis. Contribution of working group I to the sixth assessment report of the intergovernmental panel on climate change.
Möhler, O., Adams, M., Lacher, L., Vogel, F., Nadolny, J., Ullrich, R., et al. (2021). The portable ice nucleation experiment (PINE): A new online instrument for laboratory studies and automated long-term field observations of ice-nucleating particles. Atmos. Meas. Tech. 14, 1143–1166. doi:10.5194/amt-14-1143-2021
Mohr, S., Wandel, J., Lenggenhager, S., and Martius, O. (2019). Relationship between atmospheric blocking and warm-season thunderstorms over Western and central Europe. Q. J. R. Meteorol. Soc. 145, 3040–3056. doi:10.1002/qj.3603
Mwanake, R. M., Gettel, G. M., Ishimwe, C., Wangari, E. G., Butterbach-Bahl, K., and Kiese, R. (2022). Basin-scale estimates of greenhouse gas emissions from the Mara River, Kenya: Importance of discharge, stream size, and land use/land cover. Limnol. Oceanogr. 67, 1776–1793. doi:10.1002/lno.12166
Neale, P. A., Braun, G., Brack, W., Carmona, E., Gunold, R., König, M., et al. (2020). Assessing the mixture effects in in vitro bioassays of chemicals occurring in small agricultural streams during rain events. Environ. Sci. Technol. 54, 8280–8290. doi:10.1021/acs.est.0c02235
Orlanski, I. (1975). A rational subdivision of scales for atmospheric processes. Bull. Amer. Meteor. Soc. 56 (5), 527–530.
Pamuru, S. T., Forgione, E., Croft, K., Kjellerup, B. V., and Davis, A. P. (2022). Chemical characterization of urban stormwater: Traditional and emerging contaminants. Sci. Total Environ. 813, 151887. doi:10.1016/j.scitotenv.2021.151887
Pearson, G., Davies, F., and Collier, C. (2009). An analysis of the performance of the UFAM pulsed Doppler lidar for observing the boundary layer. J. Atmos. Ocean. Technol. 26, 240–250. doi:10.1175/2008JTECHA1128.1
Piper, D., Kunz, M., Allen, J., and Mohr, S. (2019). Investigation of the temporal variability of thunderstorms in central and Western Europe and the relation to large-scale flow and teleconnection patterns. Q. J. R. Meteorol. Soc. 145, 3644–3666. doi:10.1002/qj.3647
Pu, Z., Zhang, L., and Emmitt, G. D. (2010). Impact of airborne Doppler wind lidar profiles on numerical simulations of a tropical cyclone. Geophys. Res. Lett. 37, L05801. doi:10.1029/2009GL041765
Púčik, T., Castellano, C., Groenemeijer, P., Kühne, T., Rädler, A. T., Antonescu, B., et al. (2019). Large hail incidence and its economic and societal impacts across Europe. Mon. Weather Rev. 147, 3901–3916. doi:10.1175/MWR-D-19-0204.1
Puskeiler, M., Kunz, M., and Schmidberger, M. (2016). Hail statistics for Germany derived from single-polarization radar data. Atmos. Res. 178-179, 459–470. doi:10.1016/j.atmosres.2016.04.014
Rädler, A. T., Groenemeijer, P., Faust, E., and Sausen, R. (2018). Detecting severe weather trends using an additive regressive convective hazard model (AR-CHaMo). J. Appl. Meteorol. Climatol. 57, 569–587. doi:10.1175/JAMC-D-17-0132.1
Raupach, T. H., Martius, O., Allen, J. T., Kunz, M., Lasher-Trapp, S., Mohr, S., et al. (2021). The effects of climate change on hailstorms. Nat. Rev. Earth Environ. 2, 213–226. doi:10.1038/s43017-020-00133-9
Reigber, A., Scheiber, R., Jager, M., Prats-Iraola, P., Hajnsek, I., Jagdhuber, T., et al. (2012). Very-high-resolution airborne synthetic aperture radar imaging: Signal processing and applications. Proc. IEEE 101, 759–783. doi:10.1109/JPROC.2012.2220511
Rieger, D., Bangert, M., Bischoff-Gauss, I., Förstner, J., Lundgren, K., Reinert, D., et al. (2015). Icon–art 1.0–a new online-coupled model system from the global to regional scale. Geosci. Model Dev. 8, 1659–1676. doi:10.5194/gmd-8-1659-2015
Salomón, R. L., Peters, R. L., Zweifel, R., Sass-Klaassen, U. G., Stegehuis, A. I., Smiljanic, M., et al. (2022). The 2018 European heatwave led to stem dehydration but not to consistent growth reductions in forests. Nat. Commun. 13, 28–11. doi:10.1038/s41467-021-27579-9
Schecter, D. A. (2012). In search of discernible infrasound emitted by numerically simulated tornadoes. Dyn. Atmos. Oceans 57, 27–44. doi:10.1016/j.dynatmoce.2012.06.001
Schneider, L., Barthlott, C., Hoose, C., and Barrett, A. I. (2019). Relative impact of aerosol, soil moisture, and orography perturbations on deep convection. Atmos. Chem. Phys. 19, 12343–12359. doi:10.5194/acp-19-12343-2019
Schroeder, P., Brewer, W. A., Choukulkar, A., Weickmann, A., Zucker, M., Holloway, M. W., et al. (2020). A compact, flexible, and robust micropulsed Doppler lidar. J. Atmos. Ocean. Technol. 37, 1387–1402. doi:10.1175/JTECH-D-19-0142.1
Schrön, M., Rosolem, R., Köhli, M., Piussi, L., Schröter, I., Iwema, J., et al. (2018b). Cosmic-ray neutron rover surveys of field soil moisture and the influence of roads. Water Resour. Res. 54, 6441–6459. doi:10.1029/2017WR021719
Schrön, M., Zacharias, S., Womack, G., Köhli, M., Desilets, D., Oswald, S. E., et al. (2018a). Intercomparison of cosmic-ray neutron sensors and water balance monitoring in an urban environment. Geosci. Instrum. Method. Data Syst. 7, 83–99. doi:10.5194/gi-7-83-2018
Schwientek, M., Osenbrück, K., and Fleischer, M. (2013a). Investigating hydrological drivers of nitrate export dynamics in two agricultural catchments in Germany using high-frequency data series. Environ. Earth Sci. 69, 381–393. doi:10.1007/s12665-013-2322-2
Schwientek, M., Rügner, H., Beckingham, B., Kuch, B., and Grathwohl, P. (2013b). Integrated monitoring of particle associated transport of PAHs in contrasting catchments. Environ. Pollut. 172, 155–162. doi:10.1016/j.envpol.2012.09.004
Schwientek, M., and Selle, B. (2016). Quantifying in-stream retention of nitrate at catchment scales using a practical mass balance approach. Environ. Monit. Assess. 188, 111–386. doi:10.1007/s10661-016-5097-6
Senf, C., Buras, A., Zang, C. S., Rammig, A., and Seidl, R. (2020). Excess forest mortality is consistently linked to drought across Europe. Nat. Commun. 11, 6200–6208. doi:10.1038/s41467-020-19924-1
Smit, H. G. J., Straeter, W., Johnson, B. J., Oltmans, S. J., Davies, J., Tarasick, D. W., et al. (2007). Assessment of the performance of ECC-ozonesondes under quasi-flight conditions in the environmental simulation chamber: Insights from the juelich ozone sonde intercomparison experiment (JOSIE). J. Geophys. Res. 112, D19306. doi:10.1029/2006JD007308
Smith, J. B., Wilmouth, D. M., Bedka, K. M., Bowman, K. P., Homeyer, C. R., Dykema, J. A., et al. (2017). A case study of convectively sourced water vapor observed in the overworld stratosphere over the United States. JGR. Atmos. 122, 9529–9554. doi:10.1002/2017JD026831
Solomon, S., Rosenlof, K. H., Portmann, R. W., Daniel, J. S., Davis, S. M., Sanford, T. J., et al. (2010). Contributions of stratospheric water vapor to decadal changes in the rate of global warming. Science 327, 1219–1223. doi:10.1126/science.1182488
Spahr, S., Teixidó, M., Sedlak, D. L., and Luthy, R. G. (2020). Hydrophilic trace organic contaminants in urban stormwater: Occurrence, toxicological relevance, and the need to enhance green stormwater infrastructure. Environ. Sci. Water Res. Technol. 6, 15–44. doi:10.1039/C9EW00674E
Späth, F., Rajtschan, V., Weber, T. K. D., Morandage, S., Lange, D., Abbas, S. S., et al. (2022). The land-atmosphere feedback observatory: A new observational approach for characterizing land-atmosphere feedback. Geosci. Instrum. Method. Data Syst. Discuss. doi:10.5194/gi-2022-9
Tang, J. Y., Aryal, R., Deletic, A., Gernjak, W., Glenn, E., McCarthy, D., et al. (2013). Toxicity characterization of urban stormwater with bioanalytical tools. Water Res. 47, 5594–5606. doi:10.1016/j.watres.2013.06.037
Tao, W.-K., Chen, J.-P., Li, Z., Wang, C., and Zhang, C. (2012). Impact of aerosols on convective clouds and precipitation. Rev. Geophys. 50, 2011RG000369. doi:10.1029/2011RG000369
Taszarek, M., Allen, J., Púčik, T., Groenemeijer, P., Czernecki, B., Kolendowicz, L., et al. (2018). A climatology of thunderstorms across Europe from a synthesis of multiple data sources. J. Clim. 32, 1813–1837. doi:10.1175/JCLI-D-18-0372.1
Testud, J., Le Bouar, E., Obligis, E., and Ali-Mehenni, M. (2000). The rain profiling algorithm applied to polarimetric weather radar. J. Atmos. Ocean. Technol. 17, 332–356. doi:10.1175/1520-0426(2000)017⟨0332:TRPAAT⟩2.0.CO;2
Turk, F. J., Hristova-Veleva, S., Durden, S. L., Tanelli, S., Sy, O., Emmitt, G. D., et al. (2020). Joint analysis of convective structure from the APR-2 precipitation radar and the DAWN Doppler wind lidar during the 2017 Convective Processes Experiment (CPEX). Atmos. Meas. Tech. 13, 4521–4537. doi:10.5194/amt-13-4521-2020
Vaisala, (2020). Vaisala Radiosonde RS41-SGP– accuracy and reliability. Tech. Rep. B211444EN-H. Vaisala.
Vogel, S., BartkeDaedlow, K., Helming, K., Kögel-Knabner, I., and Lang, B. (2018). A systemic approach for modeling soil functions. Soil 4, 83–92. doi:10.5194/soil-4-83-2018
Vömel, H., David, D. E., and Smith, K. (2007). Accuracy of tropospheric and stratospheric water vapor measurements by the cryogenic frost point hygrometer: Instrumental details and observations. J. Geophys. Res. 112, D08305. doi:10.1029/2006JD007224
Vömel, H., Naebert, T., Dirksen, R., and Sommer, M. (2016). An update on the uncertainties of water vapor measurements using cryogenic frost point hygrometers. Atmos. Meas. Tech. 9, 3755–3768. doi:10.5194/amt-9-3755-2016
Watts, N., Amann, M., Arnell, N., Ayeb-Karlsson, S., Beagley, J., Belesova, K., et al. (2021). The 2020 report of the lancet countdown on health and climate change: Responding to converging crises. Lancet 397, 129–170. doi:10.1016/S0140-6736(20)32290-X
Weber, U., Attinger, S., Baschek, B., Boike, J., Borchardt, D., Brix, H., et al. (2022). Moses: A novel observation system to monitor dynamic events across Earth compartments. Bull. Am. Meteorol. Soc. 103, E339–E348. doi:10.1175/BAMS-D-20-0158.1
Wellmann, C., Barrett, A. I., Johnson, J. S., Kunz, M., Vogel, B., Carslaw, K. S., et al. (2020). Comparing the impact of environmental conditions and microphysics on the forecast uncertainty of deep convective clouds and hail. Atmos. Chem. Phys. 20, 2201–2219. doi:10.5194/acp-20-2201-2020
White, B. C., Elbing, B. R., and Faruque, I. A. (2022). Infrasound measurement system for real-time in-situ tornado measurements. Atmos. Meas. Tech. 15, 2923–2938. doi:10.5194/amt-15-2923-2022
Wieser, A., Güntner, A., Dietrich, P., Handwerker, J., Khordakova, D., Ködel, U., et al. (2022). First implementation of a new cross-disciplinary observation strategy for heavy precipitation events from formation to flooding. Hydrol. Earth Syst. Sci. Discuss. doi:10.5194/hess-2022-131
Wilhelm, J., Mohr, S., Punge, H. J., Mühr, B., Schmidberger, M., Daniell, J. E., et al. (2021). Severe thunderstorms with large hail across Germany in June 2019. Weather 76, 228–237. doi:10.1002/wea.3886
WMO (2014). Atlas of mortality and economic losses from weather, climate and water extremes (1970–2012). Geneva, Switzerland: WMO. Tech. Rep. WMO-No. 1123.
Wulfmeyer, V., Behrendt, A., Kottmeier, C., Corsmeier, U., Barthlott, C., Craig, G. C., et al. (2011). The convective and orographically-induced precipitation study (COPS): The scientific strategy, the field phase, and research highlights. Q. J. R. Meteorol. Soc. 137, 3–30. doi:10.1002/qj.752
Wulfmeyer, V., Muppa, S. K., Behrendt, A., Hammann, E., Späth, F., Sorbjan, Z., et al. (2016). Determination of convective boundary layer entrainment fluxes, dissipation rates, and the molecular destruction of variances: Theoretical description and a strategy for its confirmation with a novel lidar system synergy. J. Atmos. Sci. 73, 667–692. doi:10.1175/JAS-D-14-0392.1
Keywords: field campaign, convective storms, supercell, soil moisture, aerosols, sediment transport, hail
Citation: Kunz M, Abbas SS, Bauckholt M, Böhmländer A, Feuerle T, Gasch P, Glaser C, Groß J, Hajnsek I, Handwerker J, Hase F, Khordakova D, Knippertz P, Kohler M, Lange D, Latt M, Laube J, Martin L, Mauder M, Möhler O, Mohr S, Reitter RW, Rettenmeier A, Rolf C, Saathoff H, Schrön M, Schütze C, Spahr S, Späth F, Vogel F, Völksch I, Weber U, Wieser A, Wilhelm J, Zhang H and Dietrich P (2022) Swabian MOSES 2021: An interdisciplinary field campaign for investigating convective storms and their event chains. Front. Earth Sci. 10:999593. doi: 10.3389/feart.2022.999593
Received: 21 July 2022; Accepted: 20 September 2022;
Published: 05 October 2022.
Edited by:
Andreas Franz Prein, National Center for Atmospheric Research (UCAR), United StatesReviewed by:
Chris Nowotarski, Texas A&M University College Station, United StatesErik Rasmussen, NOAA National Severe Storms Laboratory, United States
Copyright © 2022 Kunz, Abbas, Bauckholt, Böhmländer, Feuerle, Gasch, Glaser, Groß, Hajnsek, Handwerker, Hase, Khordakova, Knippertz, Kohler, Lange, Latt, Laube, Martin, Mauder, Möhler, Mohr, Reitter, Rettenmeier, Rolf, Saathoff, Schrön, Schütze, Spahr, Späth, Vogel, Völksch, Weber, Wieser, Wilhelm, Zhang and Dietrich. This is an open-access article distributed under the terms of the Creative Commons Attribution License (CC BY). The use, distribution or reproduction in other forums is permitted, provided the original author(s) and the copyright owner(s) are credited and that the original publication in this journal is cited, in accordance with accepted academic practice. No use, distribution or reproduction is permitted which does not comply with these terms.
*Correspondence: Michael Kunz, bWljaGFlbC5rdW56QGtpdC5lZHU=