 Siddhartha Sarkar
 Sangeeta Verma1
 Most Shirina Begum
 Ji-Hyung Park
 Sanjeev Kumar
- 1Geosciences Division, Physical Research Laboratory, Ahmedabad, India
- 2Indian Institute of Technology, Gandhinagar, India
- 3Department of Environmental Science and Engineering, Ewha Womans University, Seoul, Republic of Korea
Asian rivers, covering ∼29% of the global river surface area, account for ∼35% of the global freshwater discharge and transport a disproportionately large flux (∼70%) of total suspended matter to the oceans. With recent anthropogenic and climate-induced changes in the flow regimes, it is challenging to constrain the fluxes and elemental signatures of the suspended organic matter in rivers. This study aimed to understand seasonal changes in the characteristics of total suspended matter (TSM) associated organic carbon (C) and total nitrogen (N) during high and low flow periods in three large Asian rivers (Ganges, Mekong, and Yellow). By measuring organic C and total N contents and their isotopic compositions at multiple locations along the studied rivers, distinct seasonality in the sources of organic matter was observed. Allochthonous sources dominated the organic matter pool during the high flow condition, whereas autochthonous organic matter derived from enhanced phytoplankton production appeared to have dominated during low flow. C/N ratio showed positive correlation with altitude during wet period, which reversed during dry, supporting the transition of sediment dominated high flow riverine system into relatively clear and productive low flow system. Generally, organic matter content in TSM was higher during the low flow with signatures of potential N2 fixation. Temporal analysis based on present and earlier estimates of fluxes and yields of TSM indicated manifold decrease in TSM load and associated C and N fluxes over decades in the three river systems largely attributed to reduction in river discharge. Wastewater dominated locations showed similar C and N contents and isotopic signatures as those of productive river waters during low flow, indicating a possible interference in the interpretation of biogeochemical information.
1 Introduction
Inland waters cover less than 4% of the surface of the Earth and play a disproportionately large role in the global biogeochemical cycles, especially for carbon (C) and nitrogen (N) (Cole et al., 2007; Tranvik et al., 2009; Downing, 2010; Verpoorter et al., 2014). Annually, around 50% (∼2.7 billion metric tons) of C removed from the atmosphere via terrestrial sink winds up in the inland waters, which then has a huge potential to process and eventually either bury or emit the C in forms of organic/inorganic matter and greenhouse gases (GHGs: CO2 and CH4) respectively (Battin et al., 2009; Aufdenkampe et al., 2011; Bastviken et al., 2011; Raymond et al., 2013). Rivers act as active conduits for the transport of C and N from the terrestrial to the marine system. Annually ∼0.9 and 0.046 Pg of C and N, respectively, get exported to the global oceans (Hope et al., 1994; Mackenzie et al., 2002; McKee, 2003; Suchet et al., 2003; Cole et al., 2007; Biddanda, 2017). This flux of C, if not constrained, could disturb the elemental budgets and offset our climate predictions to a large extent. Nitrogen is closely connected to C in the global biogeochemical cycle and often acts as a limiting nutrient, thereby making its flow vital along the land ocean continuum. With increasing human perturbations to the biosphere and a changing climate, the movement and fluxes of C and N along the river continuum has been largely altered over the past decades.
Stable isotopes of C (12C and 13C) and N (14N and 15N) have proven to be robust tools for tracking the organic matter sources and identifying the biogeochemical processes in aquatic environments (Meybeck, 1982; Pocklington and Tan, 1987; Louchouarn et al., 1997; Louchouarn et al., 1999; Hopkinson et al., 1998). Isotope analysis also provides information regarding the watershed, especially the dominant vegetation, and the level of anthropogenic developments (Hedges et al., 1986; Lambert et al., 2017). Terrestrial plants can largely be classified into C3 and C4 plants depending on their photosynthetic pathways and each have distinct isotopic signatures (C3: δ13C −32‰ to −22‰, C4: δ13C −14‰ to −9‰) (Ehleringer, 1978; Ehleringer and Pearcy, 1983). Similarly, the C isotopic signatures of freshwater macrophytes and plankton range between −28‰ to −18‰ and −42‰ to −24‰, respectively (Kendall et al., 2001). The isotopic signatures of soil organic matter (SOM) reflect that of the dominant vegetation over the region (Boutton, 1996). The N isotopic signatures of SOM in most soils varies between +2‰ and +5‰, with cultivated soils showing lower values (Broadbent et al., 1980). The relative abundance of these end members along with various biogeochemical processes, both physiochemical and microbial, determine the concentrations and isotopic signatures of total suspended matter (TSM) in rivers. Intense weathering and fluvial control on the TSM in rivers result in a TSM with dominant allochthonous inputs and therefore represent the isotopic signatures of SOM and litter of the catchment (Lloret et al., 2011; Tamooh et al., 2012). Increased productivity, on the other hand, increases the relative contribution of planktons to the particulate organic matter (POM) fraction of TSM and therefore lowers its C isotopic composition (δ13CTSM). Similarly, N isotopic signatures of TSM (δ15NTSM) integrate processes like dinitrogen fixation, denitrification, and mineralization. Over the years, stable isotopes of C and N in organic matter have been widely used for source apportionment of river—estuarine suspended matter and sediments (Thornton and McManus, 1994; Prasad et al., 2017; Gawade et al., 2018; Wang et al., 2018; Huang et al., 2020), paleoclimate reconstructions (Rahman et al., 2020), and to decipher the biogeochemical processes driving their concentrations and signatures.
Among the world’s rivers, those originating from the Tibetan Plateau carry ∼70% of the global suspended sediments to the oceans (Milliman and Meade, 1983; Ran et al., 2013). Tropical monsoonal rivers such as the Ganges and Mekong, originating from the Himalayan highland, have high sediment yields as well (Lu et al., 2010). The suspended matter load in rivers represents an aggregation of minerals and organic matter, which acts as a substrate for several microbially mediated processes that often releases CO2, CH4, and N2O as by-products. Understanding the sources and fate of organic matter is therefore vital to constrain the loss processes of C and N from these systems. Furthermore, with increasing urbanisation and human induced changes in the flow regimes of world rivers, it is essential to revisit the export fluxes of TSM and associated C and N from the rivers. In this study, an attempt has been made to understand the dynamics of C and N in TSM of three large Asian river systems, i.e., Ganges, Mekong, and Yellow. The specific aims of the study were to understand i) seasonal and spatial variations in C and N in TSM along the river continuum across the altitudinal gradient, ii) the effect of seasonality on their concentrations and isotopic compositions along with underlying processes, and iii) the export fluxes of C and N from these rivers and potential long-term changes compared to previous studies.
2 Materials and methods
2.1 Study area
The Ganges, Mekong, and Yellow River originate from the Himalayan mountains and the Tibetan plateau (Figure 1). The source of the Ganges is the Gangotri Glacier in the Garhwal Himalaya. With headwaters at the elevation of 3,800 m (Gaumukh), the mainstem of the Ganges forms later at Devprayag with the confluence of the Alaknanda and Bhagirathi Rivers (Singh, 2007). Thereafter, the river descends down into the plains and traverses a journey of ∼2,700 Kilometer (km), with a catchment of 1,260,000 km2 (Parua, 2010). Once the river enters the Gangetic plains, it passes through major cities like Kanpur, Prayagraj, Varanasi, and Patna. A major tributary of the Ganges (i.e., the Yamuna) passes through Delhi and joins the mainstem near Prayagraj. The river supports large human population along its banks, providing water for irrigation and drinking purposes. Two bifurcated distributaries of Ganges, Hooghly and Padma, flow through India and Bangladesh, respectively. The Padma River confluence with two major rivers in Bangladesh, i.e., Brahmaputra and Meghna, before discharging into the Bay of Bengal (Parua, 2010).

FIGURE 1. Map showing sampling locations on the Ganges, Mekong, and Yellow River Basins (shaded).
Rising at an altitude of 5,000–6,000 m at the source in the Tibetan Plateau, the Yellow River covers around 5,464 km, draining a catchment of 753,000 km2 to finally discharge into the Bohai Sea near Shandong Province, China (Xu and Ma, 2009; Peng et al., 2010; Miao et al., 2011; Ran et al., 2013). In terms of the channel length, the Yellow River is the second largest in Asia and seventh in the world. It is followed by the Mekong and Ganges-Brahmaputra at third and sixth place, respectively. The upper reaches of the Yellow River are predominantly an arid setting with complex geological structures, mainly comprising of old metamorphosed rocks, carbonates and modern fluvio-lacustrine sediments (Wang et al., 2012; Ran et al., 2013). In the middle reaches, the river drains the loess plateau, with abundant Quaternary loess deposits (Zhang et al., 1995; Chen et al., 2005; Wu et al., 2005). Finally, the lower reaches reflect a flat alluvial plain. The lower reaches have extensive man-made levees along its banks giving the perched riverbed an elevation of 3–4 m higher than the surrounding floodplains (Bulletin of Chinese River Sediment (BCRS), 2000; Peng et al., 2010).
The Mekong River originates at an elevation of 4,968 m in the Tibetan Plateau and flows southwards through several countries (China, Myanmar, Thailand, Lao PDR, Cambodia, and Vietnam) to drain into the South China Sea. The channel length of the river is around 4,800 km and the drainage basin area is 795,000 km2. The upper reaches of the river are confined to narrow deep gorges with high energy, resulting in largescale transport of sediments to the lower reaches (Hori, 2000; Gupta, 2005; MRC, 2005). Only at the very lower stages, near Kratie, Cambodia, the Mekong River has been observed to drain flat terrains and flood plains where there is scope for sedimentation (Gupta et al., 2002; Wang et al., 2011). The Ganges, Mekong, and Yellow River support around 400, 70, and 107 million people in its basins (Parua, 2010; Gao et al., 2017; Park et al., 2018; MRC: Mekong River Commission, 2019).
2.2 Basin characteristics of the Ganges, Mekong, and Yellow river
Based on the amount of fluvial runoff (discharge/surface area), Milliman and Farnsworth (2011) classified the Yellow River basin as arid (<100 mm y−1 runoff) and the Ganges and Mekong River basins as humid basins (250–750 mm y−1). But within each of these river basins there is large spatial heterogeneity of the hydrological parameters. For instance, the northern catchments of the Ganges River basin receive heavier rainfall as compared to the southern parts, which leads to an increased annual runoff (750 mm y−1) from the northern tributaries as compared to the low runoff (300 mm y−1) in the rivers draining the southern basin (Parua, 2010). Seasonal distribution of rainfall over the Ganges, Mekong, and Yellow River basins clearly shows the rainfall rates to be minimum in the Yellow River basin as compared to the Ganges and the Mekong River Basin (Figures 2A–F). The northern parts of the Ganges River basin and the central and southern regions in the Mekong River basin receive relatively more precipitation as compared to the other regions over these basins. Normalized differential vegetation index (NDVI), which is widely used for vegetation classification and crop monitoring, revealed that among the three basins, Mekong was the most densely vegetated followed by the Ganges and Yellow River basins (Figures 2G–I). The Yellow River basin seemed to be dominantly arid with scarce vegetation in the upstream reaches with dominant ecosystem being alpine meadows (Weiguo et al., 2003; Ran et al., 2013). The average soil organic carbon (SOC) in the three basins were below 300 t ha−1 (Figures 2J–L). Among the three river basins, the Ganges had most of its region with poor SOC content followed by the Yellow River, which had high SOC contents only in the upstream reaches of the basin. The upstream reaches of the Yellow River basin have been reported to have SOC content ∼1.5%–39% whereas the loess plateau has SOC below 0.8% (Ran et al., 2013). The Mekong River basin had relatively large SOC contents in the soils with higher contents in the middle reaches (Figure 2L).
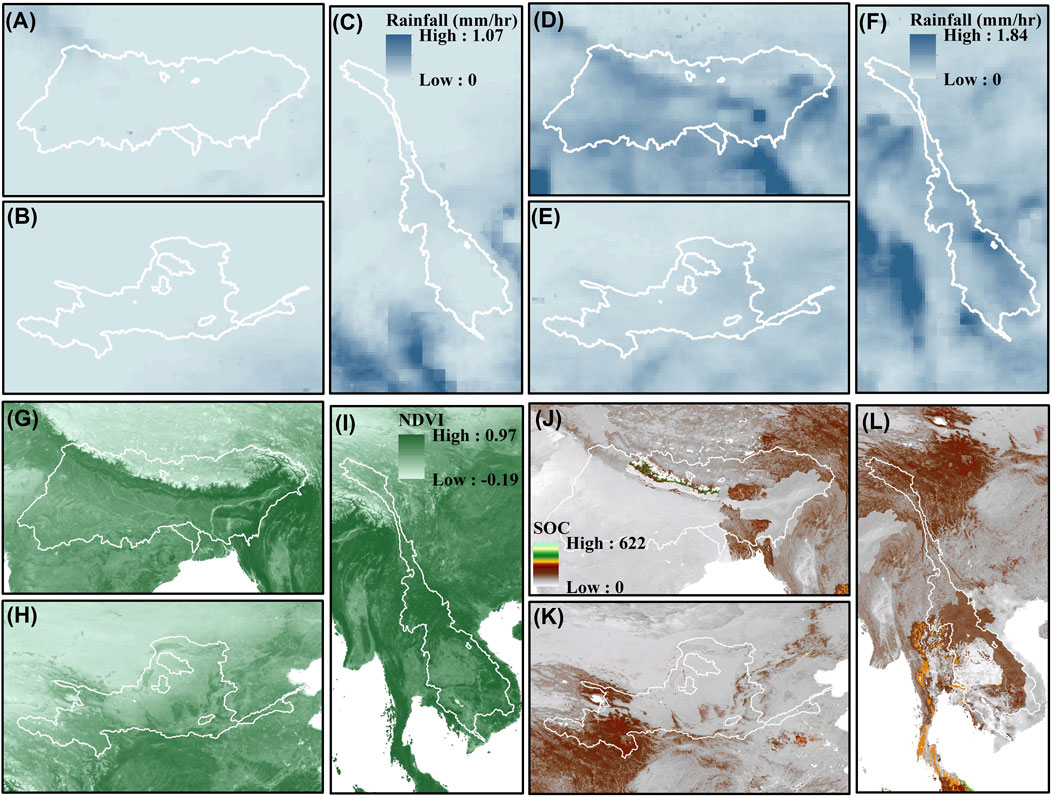
FIGURE 2. Time average rainfall over the river basins (Ganges, Mekong, and Yellow) for the dry [(A–C): January–May] and wet [(D–F): July–October] seasons during 2016–2018. Normalized differential vegetation index (NDVI) showing the distribution of vegetated land cover across the (G) Ganges, (H) Mekong, and (I) Yellow River Basin. Briefly, higher NDVI values indicate hardwood trees and dense forest canopy, whereas low values represent scarce vegetation, shrubland, and arid deserts. Soil organic carbon contents in the surficial soils of the (J) Ganges, (K) Mekong, and (L) Yellow River Basin. Data source: Global Soil Organic Carbon Map (GSOC map), published and maintained by Food and Agriculture Organisation (FAO) of the United Nations (http://54.229.242.119/GSOCmap/).
2.3 Sample collection and laboratory analysis
The sampling for the present study was carried out as a part of a larger project aimed at assessing the dynamics of GHGs in these anthropogenically modified Asian river systems (Begum et al., 2021). Sampling campaigns were carried out along mainstem reaches of the Ganges, Mekong, and Yellow River along with few tributaries and wastewater drains between August 2016 and July 2019. The mainstems were divided in upper, middle and lower reaches. Wastewater samples were collected at outlets of natural streams or constructed drains used for discharging urban sewage (Supplementary Table S1; Begum et al., 2021). Sampling was conducted during the wet (July–September; Ganges: n = 21, Mekong: n = 11 and Yellow: n = 7) and the dry (January–May; Ganges: n = 9, Mekong: n = 9 and Yellow: n = 2) seasons to capture the high and low flow conditions (Figure 1). Briefly, water samples were collected at 10–20 cm below the surface using polycarbonate bottles or a portable water sampler (Masterflex E/S, Cole-Parmer, United States). In situ water quality parameters were measured using a portable multiparameter probe (Orion 5-Star Portable, Thermo Scientific, United States). Samples were frozen within 12 h and shipped to the laboratory wherein thawed water was filtered through pre-combusted (4 h at 400°C) and pre weighed glass fibre filters (Whatman GF/F, 0.7 µm pore size) for TSM. The filters were dried at 60°C for 48 h and weighed gravimetrically for estimating the TSM load. Filters for particulate organic carbon (POC) concentration and its stable isotopic composition (δ13CTSM) were fumigated in HCl vapours to remove any inorganic C and analysed using an EA-IRMS (Flash 2000 connected to a Delta V, Thermo Fisher Scientific, Germany). Filters for particulate nitrogen (PN) concentrations and isotopic composition (δ15NTSM) were not treated with HCl vapours. IAEA standards of cellulose (IAEA-CH-3; δ13C =−24.72‰; C content = 44.4%) and ammonium sulphate (IAEA-N-2; δ15N = 20.3‰; N content = 21.2%) were used as laboratory standards for C and N contents and isotopic analysis. The analytical precision for C and N isotopic composition for repeat measurement of standards were better than 0.1‰ and 0.3‰, respectively. The precision for C and N contents were better than 10%.
2.4 Statistical analysis
Shapiro-Wilk test was applied to check the normality in the distribution of the data using SigmaPlot (Systat, United States). To analyze significant difference in measured parameters across seasons and basins, a one-way ANOVA on ranks using the Kruskal-Wallis’s method, followed by Dunn’s test was performed (for the data not normally distributed). Spearman rank correlation and Pearson’s correlation among parameters were performed in R. Isotope mixing model was used to identify the source of organic matter in these river systems. Briefly, the isotopic signature of the source was obtained from the slope of the regression between the C concentration of the pool of interest and the product of δ13C and C concentrations (Miller and Tans, 2003). This method is based on the principle of conservation of mass and mixing of C sources with distinct isotopic signatures. This method was further extended for the source identification of N in TSM. Mixing models have been widely used in related studies around riverine DIC and GHGs (Campeau et al., 2017; O’Dwyer et al., 2020; Begum et al., 2021). We attempted to use this model to distinguish the source isotopic signatures across basins and across seasons.
2.5 Estimation of export fluxes and yields
The fluxes and yields of organic matter were calculated based on the following equations:
here, TSM is the median TSM concentration at the lower sampling sites (i.e., outlet), Q is the annual discharge, FTSM is the annual flux of TSM, FPOC is the annual flux of organic C, FPN is the annual flux of N, A is the catchment surface area and YPOC is the annual yield of POC from the catchment. The discharge data were taken from the existing literature (Table 1) and the concentration values used for flux calculation are shown in Table 2.
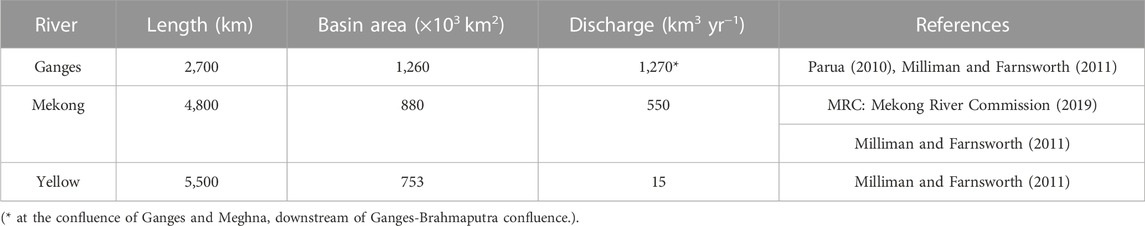
TABLE 1. Length, basin area, and annual discharge of the Ganges, Mekong, and the Yellow River systems.
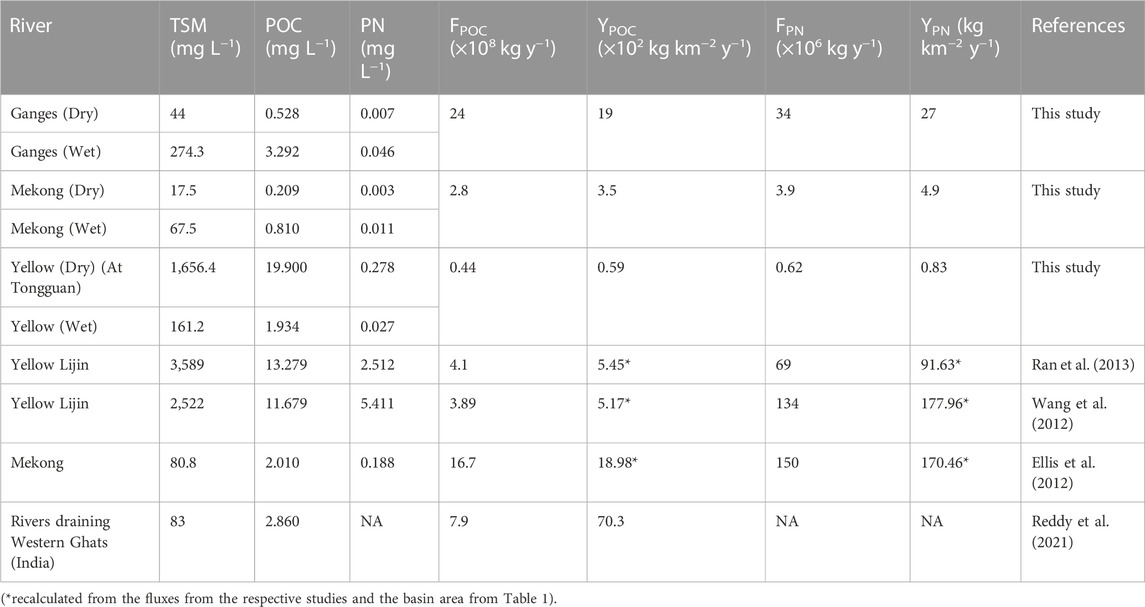
TABLE 2. Concentrations, annual fluxes, and yields of suspended particulate carbon and nitrogen in some Asian rivers. TSM, POC and PN values shown from the present study represent median concentrations of selected downstream locations [Ganges (Dry): G9 and G12; Ganges (Wet): G8, G9, G10 and G11; Mekong (Dry and Wet): M8 and M9; and Yellow (Wet): Y6], which have been used for flux and yield calculations during this study. Complete dataset from the present study have been provided in Supplementary Table S1.
3 Results
3.1 Total suspended matter
Total suspended matter (TSM) concentration was high during the monsoon season in the mainstem of all the three river systems (Ganges: 263.5 ± 232.9 mg L−1; Mekong: 136.3 ± 106.4 mg L−1; Yellow: 707.4 ± 944.2 mg L−1; Figures 3A, D, G). In the Ganges basin, high TSM was observed in the Yamuna (a major tributary of Ganges) near Dakpatthar Barrage (1,940.6 mg L−1), Delhi (254.4 mg L−1) and at several sites in the Ganges mainstem along major cities (393 mg L−1 near Rishikesh; 341.3 mg L−1 near Kanpur; 416.9 mg L−1 near Patna; 828.2 mg L−1 at Hardinge Bridge near Kushtia, and 416.6 mg L−1 at the confluence of Ganges and Brahmaputra near Mawa) (Supplementary Table S1). TSM in the Mekong mainstem was the highest in the upstream reaches (128.5 ± 64.1 mg L−1), followed by the middle reaches (82.4 ± 26.3 mg L−1) and tributaries (54.7 ± 2.7 mg L−1) (Figure 3D). In the Yellow River, very high TSM were observed at two downstream sites near the outlet of loess plateau (1941.6 mg L−1) and upstream of Sanmenxia Dam, Hancheng (1909.2 ± 64.1 mg L−1) (Figure 3G; Supplementary Table S1). During the dry season, TSM was low in the Ganges (53.9 ± 34.9 mg L−1) and Mekong (20.7 ± 6.0 mg L−1), whereas high TSM load was observed at the sites along the middle reaches of the Yellow River (1,656.4 mg L−1) (Figures 3A, D, G). Wastewater TSM concentrations were around 116.2 ± 36.4 mg L−1 in the Ganges and 111.7 ± 54.7 mg L−1 in the Mekong (Supplementary Table S1).
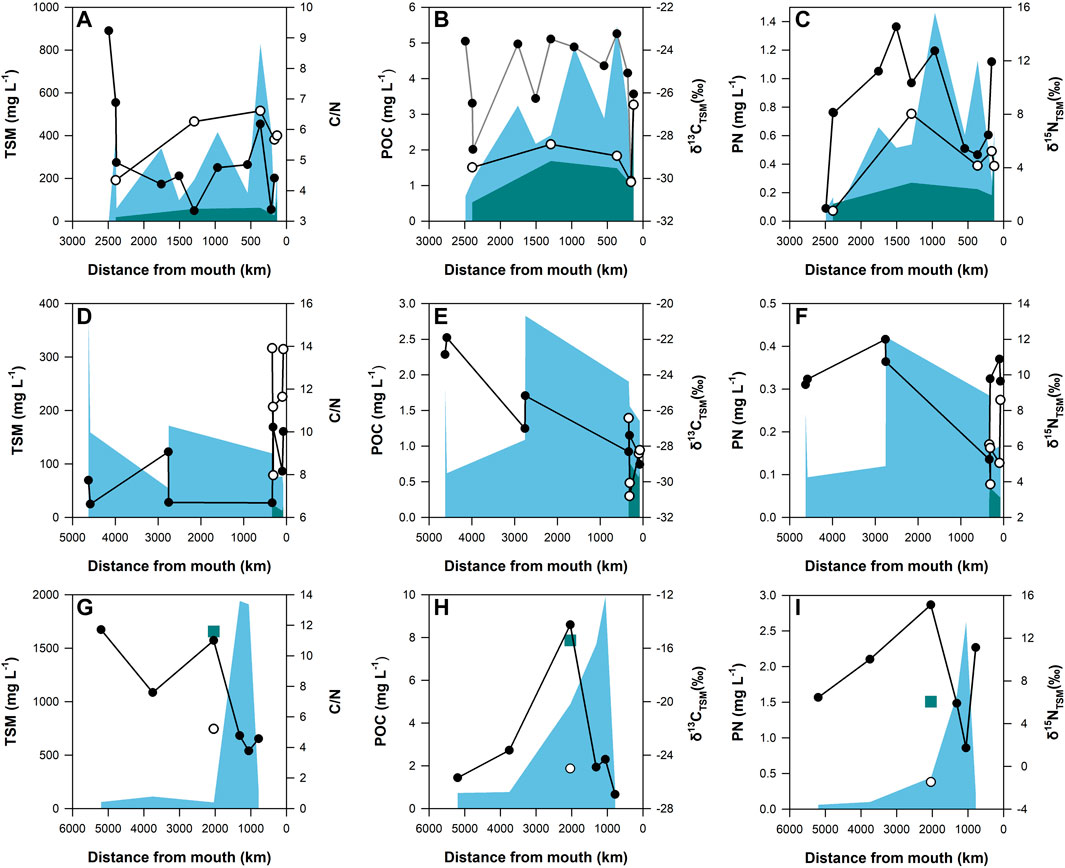
FIGURE 3. Variation of TSM, C/N, POC, δ13CTSM, PN and δ15NTSM along the mainstem of Ganges (A–C), Mekong (D–F) and Yellow River (G–I). Shaded area represents TSM, POC and PN in wet (blue) and dry (dark green) seasons. Circles connected by solid lines represent C/N, δ13CTSM and 15NTSM in wet (black circles) and dry (white circles) seasons. In Yellow river, dry seasons data is represented by scatter plot (dark green square and white circle).
3.2 Particulate organic carbon
During monsoon, POC concentrations varied significantly along the mainstem of the Ganges (average ∼2.58 ± 1.50 mg L−1) with low values near the headwaters (1.01 ± 0.27 mg L−1), which increased towards the middle (3.12 ± 1.07 mg L−1) and downstream reaches (3.09 ± 1.85 mg L−1) (Figure 3B). The highest POC concentration (∼39.47 mg L−1) was observed in the wastewater draining into the Ganges (Supplementary Table S1). The Yamuna also followed a similar trend with increasing POC from the headwaters (0.52 mg L−1) to urban location near Delhi (8.39 mg L−1) (Supplementary Table S1). In general, the mean POC in the Ganges mainstem declined from monsoon to dry season (Figure 3B); however, the station on the Yamuna near Delhi showed an increase in the POC (∼16.89 mg L−1). Compared to the Ganges, the average concentration of POC in the Mekong was relatively low during monsoon (1.57 ± 0.65 mg L−1), with 1.84 mg L−1 in the upstream reach, later falling to 0.62 mg L−1 and steadily increasing to 2.83 mg L−1 in the middle reach (Figure 3E). Downstream reaches of the Mekong River had POC ∼1.55 ± 0.26 mg L−1 with even lesser concentration (1.21 ± 0.17 mg L−1) at the lower reaches where two tributaries join. During the dry season, Mekong had very low POC (downstream: 0.69 ± 0.12 mg L−1, tributaries: 0.79 ± 0.24 mg L−1) (Figure 3E). Similar to that in the Ganges, the highest POC in the Mekong River basin was observed at the wastewater discharge site (∼4.71 mg L−1 in monsoon and 21.28 ± 21.87 mg L−1 during the dry season). The Yellow River had a wide range of POC along its mainstem (4.15 ± 3.99 mg L−1) with lower concentration in the upstream reach (0.75 ± 0.03 mg L−1) to increase in the middle (5.85 ± 3.86 mg L−1) (Figure 3H). Surprisingly DaHeiHe tributary had the highest POC (∼15.78 mg L−1). During the dry season, two sites sampled showed 7.86 mg L−1 POC in the middle reach and 4.10 mg L−1 in the DaHeiHe tributary (Supplementary Table S1).
3.3 Particulate nitrogen
During monsoon, particulate nitrogen in the Ganges mainstem varied between 0.08 and 1.46 mg L−1 (mean: 0.60 ± 0.40) (Figure 3C). Similar to POC, the upstream reach had low PN (0.12 ± 0.06 mg L−1) as compared to the middle (0.76 ± 0.40 mg L−1) and downstream reach (0.64 ± 0.36 mg L−1). The highest PN was observed in the wastewaters (2.75 ± 3.20 mg L−1) followed by that in the Yamuna (1.24 ± 0.86 mg L−1). PN was low during the dry season (0.25 ± 0.13 mg L−1) except for the site in Yamuna near Delhi (∼2.60 mg L−1) (Figure 3C; Supplementary Table S1). PN in the Mekong during monsoon had a low range (0.20 ± 0.11 mg L−1) with the upstream site having PN at 0.24 mg L−1. PN showed a wide range in the middle (0.21 ± 0.18 mg L−1) and downstream reaches (0.19 ± 0.07 mg L−1) with low values for tributaries (0.13 ± 0.02 mg L−1) (Figure 3F; Supplementary Table S1). PN decreased during the dry season with average concentration ∼0.06 ± 0.03 mg L−1 in the downstream reaches and ∼0.09 ± 0.04 mg L−1 in the tributaries (Figure 3F; Supplementary Table S1). In the Yellow River, PN showed a wide range (0.84 ± 1.05 mg L−1) with low concentrations in the upstream region (0.08 ± 0.03 mg L−1) and higher concentrations with wider range (1.22 ± 1.12) mg L−1 in the middle reaches (Figure 3I). The PN was high in the Yellow River during the dry period with concentration ∼1.51 mg L−1. In all the river basins, the highest PN concentrations were observed in the wastewaters (Ganges: 2.75 ± 3.20 mg L−1 in monsoon and 2.40 mg L−1 in dry period; Mekong: 1.00 mg L−1 in monsoon and 2.01 ± 1.58 mg L−1 in dry period) (Supplementary Table S1).
In the Ganges and the Mekong, C/N ratio in TSM were lower during the wet period. In the Ganges, the C/N ratio near the headwaters were ∼8.1 ± 1.7, and dropped near the middle (4.3 ± 0.6) and lower reaches (4.7 ± 1.2) (Figure 3A). In the Mekong the C/N ratio remained similar along the mainstem during the wet period (8.1 ± 1.5) (Figure 3D). Similar to the Ganges, the Yellow River witnessed a fall in C/N ratio during the wet period from the upper (9.7 ± 2.9) to the middle (6.5 ± 3.9) and lower (4.5) reaches (Figure 3G). During the dry period, C/N ratios were relatively higher in the Ganges mainstem (5.7 ± 0.9) and downstream reaches of the Mekong (11.7 ± 2.4) (Figures 3A, D).
3.4 Isotopic composition of total suspended matter
δ13CTSM did not show much variation along the whole continuum of the Ganges River (monsoon: −25.4‰ ± 2.2‰; dry: −28.7‰ ± 1.4‰) (Figure 3B). However, during monsoon, the δ15NTSM was high in the middle reaches (11.4‰ ± 2.4‰) as compared to the other sections (mainstem mean: 8.6‰ ± 4.0‰; upstream: 4.0‰ ± 4.6‰; downstream: 7.19‰ ± 3.21‰; Figure 3C). The Yamuna had the lowest δ15NTSM with average value ∼2.0‰ ± 1.4‰. In the Ganges, the average δ15NTSM decreased during the dry season to 4.5‰ ± 2.6‰. The Mekong River showed similar range as the Ganges for δ13CTSM (Monsoon: −26.3‰ ± 2.7‰; Dry: −28.8‰ ± 1.7‰) and δ15NTSM (Monsoon: 9.7‰ ± 2.0‰; Dry: 5.9‰ ± 1.7‰) (Figures 3E, F). The δ13CTSM was highest in the Yellow River (Monsoon: −23.3‰ ± 4.6‰; Dry: −25.0‰) (Figure 3H). δ15NTSM was high in the Yellow River during monsoon (8.4‰ ± 4.7‰) and surprisingly showed negative value during the dry period (- 1.5‰) (Figure 3I). Overall, we also observed consistently higher δ13CTSM during monsoon in the three rivers. The wastewater isotopic signatures for δ13CTSM and δ15NTSM in the Ganges were −25.8‰ ± 0.4‰ and 3.5‰ ± 3.8‰, respectively. The same for the Mekong were −25.8‰ ± 0.7‰ and 2.5‰ ± 1.6‰, respectively (Supplementary Table S1).
4 Discussion
4.1 Total suspended matter along the river continuum
Overall, TSM varied over a broad range along the continuum of the studied rivers with relatively higher concentrations near major urban areas. In the Ganges, for example, high TSM were observed near major urban clusters like Rishikesh, Kanpur and Patna. This is generally attributed to different levels of anthropogenic activities, including agricultural practices, which play a significant role in mobilizing the surface soils and subsequent loading into the river (Asselman et al., 2003; Walling and Fang, 2003; Hunter and Walton, 2008). Furthermore, higher TSM near major cities could be a result of wastewater inputs. The Mekong River had lower TSM concentrations compared to the Ganges with decreasing concentrations from upstream to downstream. Along the continuum, abruptly low TSM was observed downstream of Jinghong Dam, Yunnan, which could be attributed to enhanced sedimentation upstream of the dam. During the dry periods, only the downstream sites were sampled and they showed low TSM concentrations, typical of clear waters. All sites in the Yellow River except for those within the loess plateau region during the wet periods, and Hohhot during the dry months, had TSM below 500 mg L−1. The high TSM load near the middle reaches of Yellow River was potentially due to the high soil erosion in the loess plateau region. Intensive rainfall in the middle reaches (the loess plateau) has been attributed as the causal factor for high discharge and TSM as compared to upstream and downstream sites (Ran et al., 2013). Earlier studies have also recognized the loess plateau to supply 90% of the sediments in the Yellow River (Zhang et al., 1990; Milliman and Syvitski, 1992; Chen et al., 2005; Wang et al., 2010; Wang et al., 2016; Wang et al., 2017; Yu et al., 2013).
The increase in TSM in the middle reaches of the Yellow River basin was accompanied by an abrupt increase in δ13CTSM and δ15NTSM. A similar increase in δ15NTSM was observed in the Ganges with decrease in altitude (Figure 4A). This increase in isotopic signatures of TSM can either be a result of inputs of organic matter with enriched isotopic signatures or in-stream processes altering the isotopic composition of TSM. It was also observed that the altitude exercised a significant control on C/N ratios of TSM in the river basins (Figures 4A, E) which was quite obvious in the Ganges but not conclusive in the Mekong and Yellow, particularly due to lower sample size. During the wet season, with decrease in altitude, the C/N ratios started to fall (r = 0.35, p < 0.05; Pearson), reflecting the dominance of allochthonous organic matter inputs in the upstream reaches mainly consisting of plant litter having high C/N. In contrast, the C/N ratios were negatively correlated with altitude during the dry periods (r =−0.85, p < 0.05; Spearman), which suggested organic matter inputs of high C/N ratios into the rivers as the river order increased.
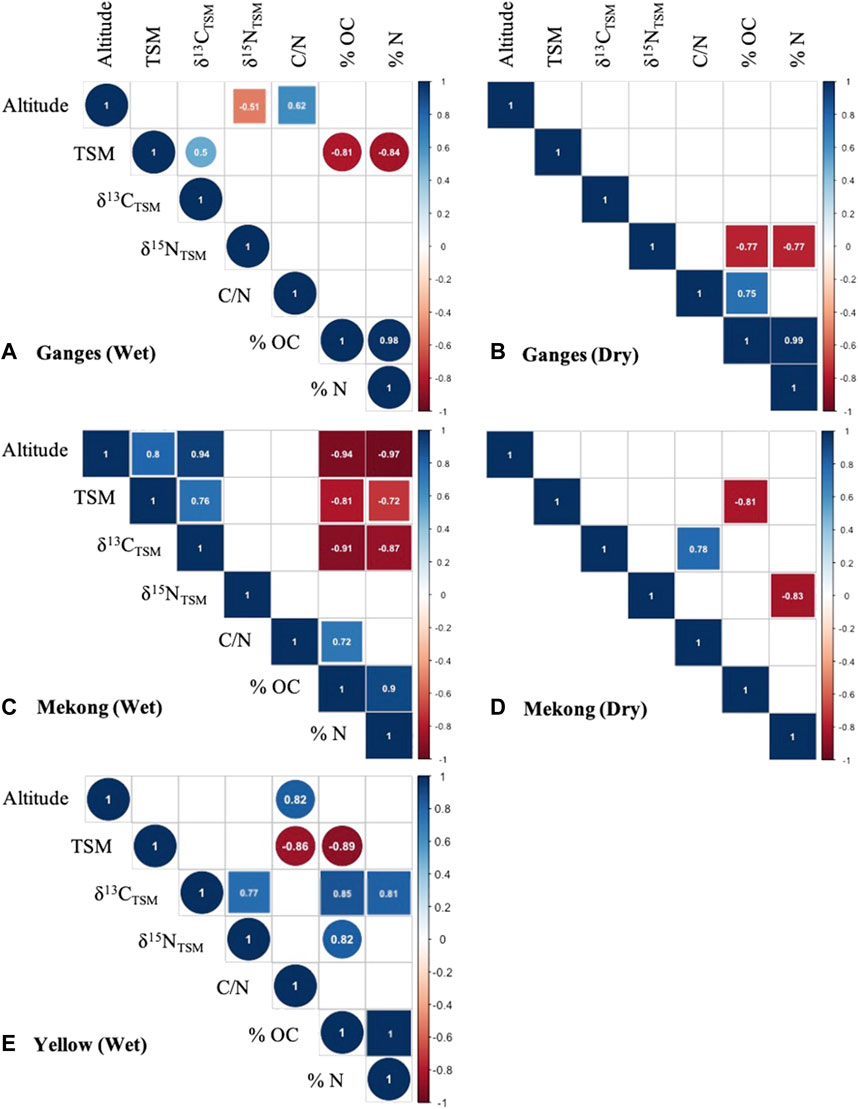
FIGURE 4. Correlation plots between measured parameters in (A) Ganges (Wet), (B) Ganges (Dry), (C) Mekong (Wet), (D) Mekong (Dry), and (E) Yellow (Wet). The coefficient of correlation was derived from Spearman rank correlation (Circles) and Pearson’s correlation (Squares). The coefficient of correlation (R) is shown in the figure (p < 0.05).
Apart from the above-mentioned control of terrain on TSM across the three rivers, the Mekong River also displayed significant positive relationship between altitude and TSM loading (Figure 4C). With decreasing altitude, the TSM concentrations in the Mekong fell consistently accompanied by an increase in its organic C and N contents. This relationship between TSM and its organic contents to altitude provides an insight into the effect of damming and changes in flow regime of the river on its TSM dynamics. The upstream reaches of the Mekong showed the signatures of intense weathering and erosion with high TSM load and low organic content, whereas the lower reaches displayed decrease in TSM loading and increase in organic content, characteristic of productive waters.
4.2 Sources of riverine carbon and nitrogen
The TSM in rivers is a derivative of in situ primary producers, plant litter, and soil (Ittekkot, 1988; Hillebrand et al., 2018). Different environmental and hydrological factors (precipitation, runoff, catchment land cover, discharge, etc.) control the relative dominance of each source. For instance, rivers with high discharge generally have high turbidity due of excessive sediment loading, which prevents light penetration, thereby decreasing primary production. Such rivers have a dominant allochthonous sources of organic matter. On the other hand, low discharge rivers with relatively low TSM loads are favorable for in situ productivity (Leithold et al., 2006; Ran et al., 2013).
In the present study, isotope mixing model did not clearly distinguish among the prospective organic matter sources such as C3 plants, C4 plants, SOM, and in situ phytoplankton. However, the source of organic matter was significantly enriched in 13C during the wet seasons compared to the dry season (by 1.4‰ in the Ganges and 10.9‰ in Mekong) (Figure 5). Except for Mekong during the wet seasons (source δ15NTSM = 9.1‰), the mixing models did not clearly identify the N sources as a strong linear regression was not achieved (Figure 5). The lack of correlation could be attributed to point source N pollution along the river continuum, prevalent in urbanized river systems (Zhang et al., 2015). The relationship between TSM concentrations and its organic C and N contents provide insight into vegetation versus soil contributions. If organic C and N contents increase with TSM, it suggests contribution from in situ phytoplankton or terrestrial litter (C3 and C4). We observed significant negative relationships between TSM and organic C and N contents in the Ganges and Mekong (Figures 4A, C), whereas with only organic C during the wet season was observed in the Yellow River (Figure 4E). Such relationships indicated inputs from soil organic matter with low C and N contents to TSM (Meybeck and Ragu, 1995; Ludwig et al., 1996). This observation was further supported by positive correlations between TSM and δ13CTSM in the Ganges and Mekong during the wet period (Figures 4A, C), as soil organic matter is generally associated with high δ13C. Similarly, a decrease in C/N ratio with increase in TSM in the Yellow River during the wet period indicated SOM as the dominant source of organic matter, which is consistent with high sediment load derived from the loess plateau. Previous studies have also reported the middle reaches of the Yellow River to be rich in highly decomposed loess deposits which have high δ13C signatures (Zhang et al., 1990; 1992; Chen et al., 2005). During the dry season, N contents showed significant negative relationship with δ15NTSM (Figures 4B, D) indicating association of increase in productivity with enhanced N2 fixation by phytoplankton.
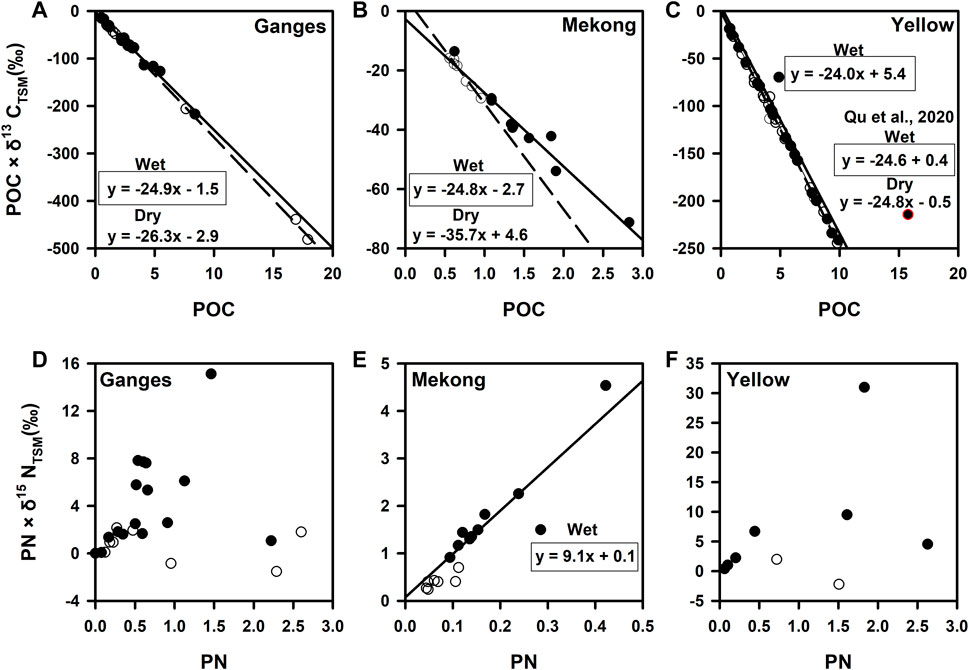
FIGURE 5. Graphical mixing model for tracking the sources of OC and N in TSM. Significant regressions obtained for OC in the (A) Ganges, (B) Mekong, and (C) Yellow River. Source organic matter isotopic signatures are shown by the slope of the regression. The regressions for wet seasons are bounded by a rectangular box. For the Yellow River, due to low sample size in the dry seasons, we used the data from Qu et al. (2020) for seasonal comparison. This graphical mixing model failed to distinguish the source signature of N in (D) Ganges and (F) Yellow but obtained a strong regression for (E) Mekong during the wet season (source δ15NTSM = 9.1‰).
4.3 Seasonality in total suspended matter as inferred from elemental biogeochemistry
The Asian rivers are subjected to high seasonality in their hydrological regime, which in turn governs the in situ elemental biogeochemistry. The TSM is usually a function of the discharge and also reflects the level of anthropogenic disturbances within the watershed (Li et al., 2008; Chang et al., 2021). Higher TSM concentrations were observed during the wet season than in the dry period in all the three rivers (Figure 6A), which is in agreement with studies elsewhere (Dunne and Ongweny, 1976; Kitheka et al., 2005; Tamooh et al., 2012). The low C/N that accompanied the high TSM during the wet season indicated terrestrial inputs of SOM having low C/N (Figure 6B). The TSM and C/N ratio obey an inverse relationship in an environmental setting prone to aeolian and fluvial erosion (Weiguo et al., 2003; Boix-Fayos et al., 2015). Generally, the surficial soil of the catchment holding the remains of parent plant material with high C/N is likely to be removed first leaving behind SOM with relatively low C/N. With successive erosion events, the rivers draining such terrain would receive this organic matter resulting in higher TSM with low C/N (Weiguo et al., 2003). Contrary to the general observations of low C/N during low flow conditions, representing fine algal materials and phytoplankton (C/N: 4.6 to 7.5, Bordowskiy, 1965; Muller, 1977; Meybeck, 1982; Balakrishna and Probst, 2005; Ellis et al., 2012), we observed relatively higher C/N ratio during the dry season. This might be due to high growth period, wherein competition for nutrients likely resulted in higher C uptake relative to N by phytoplankton resulting in higher C/N of TSM. As such productivity increases during the low flow conditions under reduced turbidity which is favorable for algal growth (Beusen et al., 2005). Possible increase in productivity during the dry period is also reflected on higher organic C and N contents in TSM (Figures 6C, D). In contrast, organic C in TSM decreased during the high flow condition (Figure 6C), reflecting the C content of SOM (Giresse and Maley, 1998; Coynel et al., 2005). Although decomposition of organic matter during high flow conditions might also result in lower organic carbon in TSM and associated increase in δ13CTSM, the negative relationship observed between TSM and % OC and % N (Figures 4A, C, E) indicates addition of TSM with low organic matter content. Similar negative relationship between organic matter and TSM have been reported in the Yellow River basin during high flow periods (Beusen et al., 2005; Ellis et al., 2012).
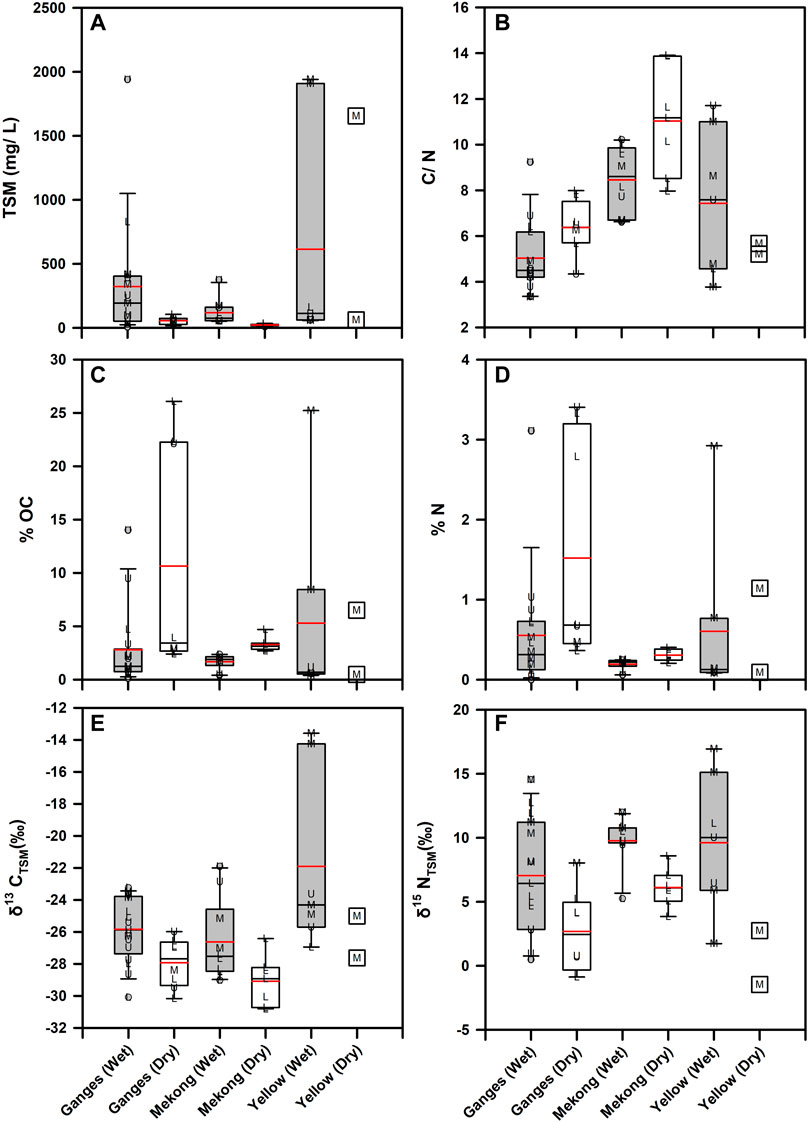
FIGURE 6. Box-whiskers plots showing seasonal variation in (A) TSM, (B) C/N ratios, (C) % OC, (D) % N, (E) δ13CTSM and (F) δ15NTSM. Red lines shows mean values. Significant difference (p < 0.001) between the median TSM values were observed across seasons and river basins. The whole range of TSM were significantly different (p < 0.05) among Mekong (Dry) and Mekong (Wet). Similarly, median C/N were significantly different among different sample classes (p < 0.001). During each season, the whole range of C/N values were higher for the Mekong as compared to the Ganges (p < 0.05). Median values were significantly different in (C) with p < 0.005 and (D) p < 0.05. Median δ13CTSM and δ15NTSM were significantly different among each class (p < 0.005). The letters L, M and U represents sites from the lower, middle and upper reaches respectively.
Generally, C/N ratios, when used solely, do not convincingly distinguish the sources and relative contributions (autochthonous versus allochthonous) of organic matter to riverine systems (C/N for phytoplankton: 4.6 to 7.5, aquatic plants: 4 to 12, degraded SOM: low C/N; Bordowskiy, 1965; Meybeck, 1982; Muller, 1977) as these systems have large catchments and several biogeochemical processes simultaneously regulate the elemental ratios (Milliman et al., 1984; Meyers, 1997). However, in conjunction with stable isotopes, they can be a robust tool to study aquatic elemental biogeochemistry. In this study, relatively lower δ13CTSM (Figure 6E) in all the river basins during the dry season was observed, which possibly indicated increased in situ primary production, which has a general range between −40‰ and −22‰ (Kendall et al., 2001). As described earlier, low flow conditions with clear and less turbid water are favourable for primary productivity and algal growth. Phytoplankton in such an environmental setting, i.e., well oxygenated and non-eutrophic, can have isotopically depleted organic C signatures (Leng et al., 2006). Yu et al. (2019) employed dual isotopic (δ13C and ∆14C) source apportionment and observed similar signatures of enhanced primary production in the Yellow River due to less turbidity and suitable water temperature during spring and summer. Furthermore, higher δ13CTSM during the wet season showed signatures of terrestrial inputs, with higher C4 contribution, in the Yellow River. Unlike earlier observations of a lack of seasonality in the isotopic composition of POM in the Mekong River (Ellis et al., 2012), our results showed significant increase in the C and N isotopic signatures during the wet seasons. Similar to C, relatively higher δ15NTSM during the wet season is indicative of SOM and the low δ15NTSM during the dry season is indicative of in situ production with the low (∼0‰) signatures representing N2 fixation during high growth phase (Figure 6F).
4.4 Yield and export fluxes of particulate organic carbon and nitrogen
Assuming a catchment area of 980 × 103 km2, annual sediment load and yield for the Ganges have been reported to be ∼1,060 × 109 kg y−1 and 1,340 × 103 kg km−2 y−1, respectively (Milliman and Farnsworth, 2011). Similarly, for the Yellow and the Mekong Rivers, the sediment load (yield) has been estimated at 1,100 (1,500) and 150 × 109 kg y−1 (190 × 103 kg km–2 y−1), respectively (Milliman and Farnsworth, 2011). Estimates of C and N fluxes from the Ganges River system is scarce and only one study reported organic C flux to be 6 × 10⁹ kg y−1 (Aucour et al., 2006). For the Ganges, our estimates for the annual TSM export flux was 202 × 109 kg y−1, which indicated significant decrease in the suspended load and its C content (at present FPOC = 2.4 × 10⁹ kg y−1; Table 2) over the years. TSM flux from the Yellow River has been known to reduce drastically over the decades. Milliman and Farnsworth (2011) reported ∼10 times reduction of TSM export from the Yellow River in recent decades, from 1,100 Mt y−1 (Qian and Dai, 1980) to <100 Mt y−1 (Wang et al., 2016), attributing the major cause of this decline to be excessive water consumption and droughts. For the Yellow River, the early export flux of organic C was estimated to be 6.1 × 10⁹ kg y−1 in 1987 (Zhang et al., 1992). Later, a reduction by a factor of 15 by the year 2009 was observed (Wang et al., 2012). The estimates calculated based on the wet season data from the present study showed further reduction by a factor of 10 since Wang et al. (2012). Paucity of dry season observation from the Yellow River during the present study restricted us from providing a well constrained annual flux estimate. This high reduction in POC flux in the Yellow River within a decade is not surprising, considering the steady fall in river discharge and associated sediment load over the last 60 years (Wang et al., 2016). Apart from the construction of dams and landscape engineering, large scale vegetation restoration projects and associated reduction in soil erosion rates have been identified as the causal factors for the decline in sediment load in the Yellow River (Wang et al., 2016). In the last decade, a large fall in the export fluxes were observed in the Mekong River basin as well. Ellis et al. (2012) reported an annual flux of 76.3 × 10⁹ kg y−1 and 1.67 × 10⁹ kg y−1 for TSM and organic C, respectively, during the year 2006. Our results indicated ∼6 times decrease in organic C flux for the Mekong River.
Transport of N in rivers are generally assumed to be dominantly in the form of dissolved inorganic ions. However, Ittekkot and Zhang (1989) highlighted the global significance of the movement of particulate N within river corridors. They estimated a net global riverine flux of ∼33 × 109 kg N y−1 in the form of PN among which ∼80% was supposedly delivered by large river systems like the Ganges, Mekong, and Yellow River. Following the work by Ittekkot and Zhang (1989), studies on PN fluxes and yields are still limited from the Asian rivers systems. Our flux calculations showed the Ganges with the highest PN flux followed by the Mekong and the Yellow Rivers (Table 2). Similar to organic C, significant reduction in PN flux was also observed for three studied river basins (Table 2).
4.5 Wastewater input: an underrepresented source of organic matter
With rapid urbanization and population bloom, large quantities of sewage are being generated by metropolises across the globe. Most of these cities are situated alongside river channels and therefore dumps all the wastes into the flowing water, most of which remains poorly treated or otherwise untreated. The Ganges and the Yellow Rivers are known to receive around 1,186 × 109 and 45 × 109 kg y−1 of wastewater, respectively (CPCB, 2013; Dutta et al., 2020; Qi et al., 2020; Zhao et al., 2020). Taking the wastewater discharge from the earlier studies (CPCB, 2013; Dutta et al., 2020) and using our TSM data, we estimated a total flux of (123.2 ± 43.3) × 106 kg y−1 of TSMwastewater into the Ganges. Paucity of wastewater discharge information from the Mekong Basin and TSMwastewater from the Yellow river makes it difficult to estimate the TSMwastewater flux for these systems in our study. There are studies where wastewater have been found to play a significant role in the inorganic C dynamics (Yang et al., 2018; Li et al., 2019). Wastewaters usually have a high concentration of DIC accompanied by low δ13CDIC (Yang et al., 2018). In terms of organic C content, wastewater have high concentration of DOC, which further acts as substrates for methanogenesis leading to enhanced GHGs emissions (Begum et al., 2021). The TSM in the wastewater from our sampled sites were rich in organic matter (∼17% organic C and ∼2% N). Such high organic matter content is usually characteristic of autochthonous productivity in rivers. Therefore, it is possible that overlooking the contributions from wastewater inputs, while interpreting TSM data in rivers may be misleading.
5 Conclusion
The present study attempted to compare the flow of C and N in its particulate form (POC and PN) between dry and wet periods among three large Asian river systems. Given the global implication in constraining their fluxes and isotopic signatures, this study deciphered the effect of seasonality on the POC and PN fluxes and the associated biogeochemical processes that might have a significant control over their process dynamics. In the three studied river systems, altitude seemed to have a strong control over the C/N ratios and C isotopic signatures of TSM. Furthermore, in the Yellow River basin, the loess plateau was the major driver of suspended matter dynamics. Application of a mixing model revealed an enriched C isotopic signature of the source organic matter in the Ganges and Mekong during the wet seasons which was attributed to allochthonous inputs (soil organic matter and C4 vegetation). Using the same model for N source identification, the δ15NTSM (Source) for the Mekong River was also constrained. Primary production dominated in all the three river systems during the dry seasons with evidences of N2 fixation as well. The high C/N ratios that accompanied the high growth phase during this study disagreed with the general understanding of low C/N during low flow conditions, indicating that competition for nutrients can shoot up the C/N ratios of POM beyond the known range of values. The fluxes and yields of C and N estimated in this study showed drastic reduction over the decades in these river basins and also provided a modest number that could be used in models for global budgeting. Finally, the potential role of wastewater inputs in the elemental biogeochemistry of riverine system was indicated by similar C/N ratios and isotopic composition of wastewater and productive river POM, which suggest that they might cause biases while investigating river processes.
Data availability statement
The original contributions presented in the study are included in the article/Supplementary Material, further inquiries can be directed to the corresponding author.
Author contributions
MB and J-HP collected the samples, SV and SK analyzed the samples, SS analyzed the data and wrote the draft with contributions from all the co-authors.
Funding
The funding for sampling towards this work was supported by the Asia-Pacific Network for Global Change Research (CRRP 2016-01MY-Park) and the National Research Foundation of Korea funded by the Korean Government (NRF-2017R1D1A1B06035179). The funding for sample analysis was provided by the Department of Space, Govt. of India.
Acknowledgments
The authors thank the project members and students of Jahangirnagar University, Royal University of Phnom Penh, Cantho University, and University of Inner Mongolia for their assistance with sampling.
Conflict of interest
The authors declare that the research was conducted in the absence of any commercial or financial relationships that could be construed as a potential conflict of interest.
Publisher’s note
All claims expressed in this article are solely those of the authors and do not necessarily represent those of their affiliated organizations, or those of the publisher, the editors and the reviewers. Any product that may be evaluated in this article, or claim that may be made by its manufacturer, is not guaranteed or endorsed by the publisher.
Supplementary material
The Supplementary Material for this article can be found online at: https://www.frontiersin.org/articles/10.3389/feart.2023.1067744/full#supplementary-material
References
Asselman, N. E., Middelkoop, H., and Van Dijk, P. M. (2003). The impact of changes in climate and land use on soil erosion, transport and deposition of suspended sediment in the River Rhine. Hydrol. Process. 17 (16), 3225–3244. doi:10.1002/hyp.1384
Aucour, A. M., France-Lanord, C., Pedoja, K., Pierson-Wickmann, A. C., and Sheppard, S. M. (2006). Fluxes and sources of particulate organic carbon in the Ganga-Brahmaputra river system. Glob. Biogeochem. Cycles 20 (2). doi:10.1029/2004gb002324
Aufdenkampe, A. K., Mayorga, E., Raymond, P. A., Melack, J. M., Doney, S. C., Alin, S. R., et al. (2011). Riverine coupling of biogeochemical cycles between land, oceans, and atmosphere. Front. Ecol. Environ. 9 (1), 53–60. doi:10.1890/100014
Balakrishna, K., and Probst, J. L. (2005). Organic carbon transport and C/N ratio variations in a large tropical river: Godavari as a case study, India. Biogeochemistry 73 (3), 457–473. doi:10.1007/s10533-004-0879-2
Bastviken, D., Tranvik, L. J., Downing, J. A., Crill, P. M., and Enrich-Prast, A. (2011). Freshwater methane emissions offset the continental carbon sink. Science 331 (6013), 50. doi:10.1126/science.1196808
Battin, T. J., Luyssaert, S., Kaplan, L. A., Aufdenkampe, A. K., Richter, A., and Tranvik, L. J. (2009). The boundless carbon cycle. Nat. Geosci. 2 (9), 598–600. doi:10.1038/ngeo618
Begum, M. S., Bogard, M. J., Butman, D. E., Chea, E., Kumar, S., Lu, X., et al. (2021). Localized pollution impacts on greenhouse gas dynamics in three anthropogenically modified Asian river systems. J. Geophys. Res. Biogeosciences 126, e2020JG006124. doi:10.1029/2020jg006124
Beusen, A. H. W., Dekkers, A. L. M., Bouwman, A. F., Ludwig, W., and Harrison, J. (2005). Estimation of global river transport of sediments and associated particulate C, N, and P. Glob. Biogeochem. Cycles 19 (4). doi:10.1029/2005gb002453
Biddanda, B. A. (2017). Global significance of the changing freshwater carbon cycle. Eos, 98. doi:10.1029/2017EO069751
Boix-Fayos, C., Nadeu, E., Quiñonero, J. M., Martínez-Mena, M., Almagro, M., and De Vente, J. (2015). Sediment flow paths and associated organic carbon dynamics across a Mediterranean catchment. Hydrology Earth Syst. Sci. 19 (3), 1209–1223. doi:10.5194/hess-19-1209-2015
Bordowskiy, O. K. (1965). Sources of organic matter in marine basins. Mar. Geol. 3, 5–31. doi:10.1016/0025-3227(65)90003-4
Boutton, T. W. (1996). Stable carbon isotope ratios of soil organic matter and their use as indicators of vegetation and climate change. Mass Spectrom. soils, 47–82.
Broadbent, F. E., Rauschkolb, R. S., Lewis, K. A., and Chang, G. Y. (1980). Spatial variability of nitrogen-15 and total nitrogen in some virgin and cultivated soils. Soil Sci. Soc. Am. J. 44 (3), 524–527. doi:10.2136/sssaj1980.03615995004400030017x
Bulletin of Chinese River Sediment (BCRS) (2000). Ministry of Water Resources Conservancy. Beijing, China. Available at: http://www.mwr.gov.cn/xygb/hlnsgb/index.aspx. (in Chinese).
Campeau, A., Wallin, M. B., Giesler, R., Löfgren, S., Mörth, C. M., Schiff, S., et al. (2017). Multiple sources and sinks of dissolved inorganic carbon across Swedish streams, refocusing the lens of stable C isotopes. Sci. Rep. 7 (1), 9158. doi:10.1038/s41598-017-09049-9
Central Pollution Control Board (CPCB) (2013). Pollution assessment: River Ganga. CPCB. Available at: https://cpcb.nic.in.
Chang, H., Makido, Y., and Foster, E. (2021). Effects of land use change, wetland fragmentation, and best management practices on total suspended solids concentrations in an urbanizing Oregon watershed, USA. J. Environ. Manag. 282, 111962. doi:10.1016/j.jenvman.2021.111962
Chen, J., Wang, F., Meybeck, M., He, D., Xia, X., and Zhang, L. (2005). Spatial and temporal analysis of water chemistry records (1958–2000) in the Huanghe (Yellow River) basin. Glob. Biogeochem. cycles 19 (3). doi:10.1029/2004gb002325
Cole, J. J., Prairie, Y. T., Caraco, N. F., McDowell, W. H., Tranvik, L. J., Striegl, R. G., et al. (2007). Plumbing the global carbon cycle: Integrating inland waters into the terrestrial carbon budget. Ecosystems 10 (1), 172–185. doi:10.1007/s10021-006-9013-8
Coynel, A., Seyler, P., Etcheber, H., Meybeck, M., and Orange, D. (2005). Spatial and seasonal dynamics of total suspended sediment and organic carbon species in the Congo River. Glob. Biogeochem. cycles 19 (4). doi:10.1029/2004gb002335
Downing, J. A. (2010). Emerging global role of small lakes and ponds: Little things mean a lot. Limnetica 29 (1), 0009–0024. doi:10.23818/limn.29.02
Dunne, T., and Ongweny, G. S. O. (1976). A new estimate of sedimentation rates on the upper Tana River. Kenyan Geogr. 2 (2), 26–109.
Dutta, V., Dubey, D., and Kumar, S. (2020). Cleaning the River Ganga: Impact of lockdown on water quality and future implications on river rejuvenation strategies. Sci. Total Environ. 743, 140756. doi:10.1016/j.scitotenv.2020.140756
Ehleringer, J. R. (1978). Implications of quantum yield differences on the distributions of C3 and C4 grasses. Oecologia 31 (3), 255–267. doi:10.1007/bf00346246
Ehleringer, J., and Pearcy, R. W. (1983). Variation in quantum yield for CO2 uptake among C3 and C4 plants. Plant Physiol. 73 (3), 555–559. doi:10.1104/pp.73.3.555
Ellis, E. E., Keil, R. G., Ingalls, A. E., Richey, J. E., and Alin, S. R. (2012). Seasonal variability in the sources of particulate organic matter of the Mekong River as discerned by elemental and lignin analyses. J. Geophys. Res. Biogeosciences 117 (G1). doi:10.1029/2011jg001816
Gao, X., Shi, Y., Han, Z., Wang, M., Wu, J., Zhang, D., et al. (2017). Performance of RegCM4 over major river basins in China. Adv. Atmos. Sci. 34 (4), 441–455. doi:10.1007/s00376-016-6179-7
Gawade, L., Krishna, M. S., Sarma, V. V. S. S., Hemalatha, K. P. J., and Rao, Y. V. (2018). Spatio-temporal variability in the sources of particulate organic carbon and nitrogen in a tropical Godavari estuary. Estuar. Coast. Shelf Sci. 215, 20–29. doi:10.1016/j.ecss.2018.10.004
Giresse, P., and Maley, J. (1998). The dynamic of organic carbon in South Cameroon: Fluxes in a tropical River system and a lake system as a varying sink on a glacial–interglacial time scale. Glob. Planet. Change 16, 53–74. doi:10.1016/s0921-8181(98)00007-1
Gupta, A., Hock, L., Xiaojing, H., and Ping, C. (2002). Evaluation of part of the Mekong River using satellite imagery. Geomorphology 44 (3-4), 221–239. doi:10.1016/s0169-555x(01)00176-3
Gupta, A. (Editor) (2005). The physical geography of Southeast Asia(Vol. 4) (Oxford University Press on Demand).
Hedges, J. I., Ertel, J. R., Quay, P. D., Grootes, P. M., Richey, J. E., Devol, A. H., et al. (1986). Organic carbon-14 in the amazon River system. Science 231 (4742), 1129–1131. doi:10.1126/science.231.4742.1129
Hillebrand, G., Hardenbicker, P., Fischer, H., Otto, W., and Vollmer, S. (2018). Dynamics of total suspended matter and phytoplankton loads in the river Elbe. J. Soils Sediments 18 (10), 3104–3113. doi:10.1007/s11368-018-1943-1
Hope, D., Billett, M. F., and Cresser, M. S. (1994). A review of the export of carbon in river water: Fluxes and processes. Environ. Pollut. 84 (3), 301–324. doi:10.1016/0269-7491(94)90142-2
Hopkinson, C. S., Buffam, I., Hobbie, J., Vallino, J., Perdue, M., Eversmeyer, B., et al. (1998). Terrestrial inputs of organic matter to coastal ecosystems: An intercomparison of chemical characteristics and bioavailability. Biogeochemistry 43 (3), 211–234. doi:10.1023/a:1006016030299
Huang, C., Chen, F., Zhang, S., Chen, C., Meng, Y., Zhu, Q., et al. (2020). Carbon and nitrogen isotopic composition of particulate organic matter in the Pearl River Estuary and the adjacent shelf. Estuar. Coast. Shelf Sci. 246, 107003. doi:10.1016/j.ecss.2020.107003
Hunter, H. M., and Walton, R. S. (2008). Land-use effects on fluxes of suspended sediment, nitrogen and phosphorus from a river catchment of the Great Barrier Reef, Australia. J. hydrology 356 (1-2), 131–146. doi:10.1016/j.jhydrol.2008.04.003
Ittekkot, V., and Zhang, S. (1989). Pattern of particulate nitrogen transport in world rivers. Glob. Biogeochem. Cycles 3 (4), 383–391. doi:10.1029/gb003i004p00383
Ittekkot, V. (1988). Global trends in the nature of organic matter in river suspensions. Nature 332 (6163), 436–438. doi:10.1038/332436a0
Kendall, C., Silva, S. R., and Kelly, V. J. (2001). Carbon and nitrogen isotopic compositions of particulate organic matter in four large river systems across the United States. Hydrol. Process. 15 (7), 1301–1346. doi:10.1002/hyp.216
Kitheka, J. U., Obiero, M., and Nthenge, P. (2005). River discharge, sediment transport and exchange in the Tana Estuary, Kenya. Estuar. Coast. Shelf Sci. 63 (3), 455–468. doi:10.1016/j.ecss.2004.11.011
Lambert, T., Bouillon, S., Darchambeau, F., Morana, C., Roland, F. A., Descy, J. P., et al. (2017). Effects of human land use on the terrestrial and aquatic sources of fluvial organic matter in a temperate river basin (The Meuse River, Belgium). Biogeochemistry 136 (2), 191–211. doi:10.1007/s10533-017-0387-9
Leithold, E. L., Blair, N. E., and Perkey, D. W. (2006). Geomorphologic controls on the age of particulate organic carbon from small mountainous and upland rivers. Glob. Biogeochem. Cycles 20 (3). doi:10.1029/2005gb002677
Leng, M. J., Lamb, A. L., Heaton, T. H., Marshall, J. D., Wolfe, B. B., Jones, M. D., et al. (2006). “Isotopes in lake sediments,” in Isotopes in palaeoenvironmental research (Dordrecht: Springer), 147–184.
Li, S., Gu, S., Liu, W., Han, H., and Zhang, Q. (2008). Water quality in relation to land use and land cover in the upper Han River Basin, China. Catena 75 (2), 216–222. doi:10.1016/j.catena.2008.06.005
Li, X., Han, G., Liu, M., Song, C., Zhang, Q., Yang, K., et al. (2019). Hydrochemistry and dissolved inorganic carbon (DIC) cycling in a tropical agricultural river, Mun River Basin, Northeast Thailand. Int. J. Environ. Res. public health 16 (18), 3410. doi:10.3390/ijerph16183410
Lloret, E., Dessert, C., Gaillardet, J., Albéric, P., Crispi, O., Chaduteau, C., et al. (2011). Comparison of dissolved inorganic and organic carbon yields and fluxes in the watersheds of tropical volcanic islands, examples from Guadeloupe (French West Indies). Chem. Geol. 280 (1-2), 65–78. doi:10.1016/j.chemgeo.2010.10.016
Louchouarn, P., Lucotte, M., Canuel, R., Gagné, J. P., and Richard, L. F. (1997). Sources and early diagenesis of lignin and bulk organic matter in the sediments of the Lower St. Lawrence Estuary and the Saguenay Fjord. Mar. Chem. 58 (1-2), 3–26. doi:10.1016/s0304-4203(97)00022-4
Louchouarn, P., Lucotte, M., and Farella, N. (1999). Historical and geographical variations of sources and transport of terrigenous organic matter within a large-scale coastal environment. Org. Geochem. 30 (7), 675–699. doi:10.1016/s0146-6380(99)00019-4
Lu, X. X., Zhang, S., and Xu, J. (2010). Climate change and sediment flux from the Roof of the World. Earth Surf. Process. Landforms J. Br. Geomorphol. Res. Group 35 (6), 732–735. doi:10.1002/esp.1924
Ludwig, W., Probst, J. L., and Kempe, S. (1996). Predicting the oceanic input of organic carbon by continental erosion. Glob. Biogeochem. Cycles 10 (1), 23–41. doi:10.1029/95gb02925
Mackenzie, F. T., Ver, L. M., and Lerman, A. (2022). Century-scale nitrogen and phosphorus controls of the carbon cycle. Chem. Geol. 190 (1–4), 13–32. doi:10.1016/S0009-2541(02)00108-0
McKee, B. A. (2023). RiOMar: The transport, transformation and fate of carbon in river-dominated ocean margins: a report of the RioMar community workshop. New Orleans, LA: Tulane University. (Accessed November 1–3, 2001).
Mekong River Commission (2005). Overview of the hydrology of the Mekong Basin. Vientiane: Mekong River Commission, 82.
Meybeck, M., and Ragu, A. (1995). River discharges to oceans: An assessment of suspended solids, major ions and nutrients, report. Nairobi: UN Environ.Programme.
Meybeck, M. (1982). Carbon, nitrogen, and phosphorus transport by world rivers. Am. J. Sci. 282 (4), 401–450. doi:10.2475/ajs.282.4.401
Meyers, P. A. (1997). Organic geochemical proxies of paleoceanographic, paleolimnologic, and paleoclimatic processes. Org. Geochem. 27 (5-6), 213–250. doi:10.1016/s0146-6380(97)00049-1
Miao, C., Ni, J., Borthwick, A. G., and Yang, L. (2011). A preliminary estimate of human and natural contributions to the changes in water discharge and sediment load in the Yellow River. Glob. Planet. Change 76 (3-4), 196–205. doi:10.1016/j.gloplacha.2011.01.008
Miller, J.B., and Tans, P. P. (2003). Calculating isotopic fractionation from atmospheric measurements at various scales. Tellus B Chem. Phys. Meteorol. 55 (2), 207–214. doi:10.1034/j.1600-0889.2003.00020.x
Milliman, J. D., and Farnsworth, K. L. (2011). River discharge to the coastal ocean: A global synthesis. Cambridge University Press. doi:10.1017/CBO9780511781247
Milliman, J. D., and Meade, R. H. (1983). World-wide delivery of river sediment to the oceans. J. Geol. 91 (1), 1–21. doi:10.1086/628741
Milliman, J. D., and Syvitski, J. P. (1992). Geomorphic/tectonic control of sediment discharge to the ocean: The importance of small mountainous rivers. J. Geol. 100 (5), 525–544. doi:10.1086/629606
Milliman, J. D., Qinchun, X., and Zuosheng, Y. (1984). Transfer of particulate organic carbon and nitrogen from the Yangtze River to the ocean. Am. J. Sci. 284 (7), 824–834. doi:10.2475/ajs.284.7.824
Müller, P. J. (1977). Ratios in Pacific deep-sea sediments: Effect of inorganic ammonium and organic nitrogen compounds sorbed by clays. Geochimica Cosmochimica Acta 41 (6), 765–776. doi:10.1016/0016-7037(77)90047-3
O’Dwyer, M., Butman, D. E., Striegl, R. G., Dornblaser, M. M., Wickland, K. P., Kuhn, C. D., et al. (2020). Patterns and isotopic composition of greenhouse gases under ice in lakes of interior Alaska. Environ. Res. Lett. 15 (10), 105016. doi:10.1088/1748-932=6/abb493
Park, J. H., Nayna, O. K., Begum, M. S., Chea, E., Hartmann, J., Keil, R. G., et al. (2018). Reviews and syntheses: Anthropogenic perturbations to carbon fluxes in Asian river systems–concepts, emerging trends, and research challenges. Biogeosciences 15 (9), 3049–3069. doi:10.5194/bg-15-3049-2018
Parua, P. K. (2010). The Ganga: Water use in the Indian subcontinent(vol 64). Springer Science & Business Media.
Peng, J., Chen, S., and Dong, P. (2010). Temporal variation of sediment load in the Yellow River basin, China, and its impacts on the lower reaches and the river delta. Catena 83 (2-3), 135–147. doi:10.1016/j.catena.2010.08.006
Pocklington, R., and Tan, F. C. (1987). Seasonal and annual variations in the organic matter contributed by the st lawrence River to the gulf of st. Lawrence. Geochimica Cosmochimica Acta 51 (9), 2579–2586. doi:10.1016/0016-7037(87)90308-5
Prasad, M., Kumar, A., Ramanathan, A. L., and Datta, D. K. (2017). Sources and dynamics of sedimentary organic matter in Sundarban mangrove estuary from Indo-Gangetic delta. Ecol. Process. 6 (1), 8–15. doi:10.1186/s13717-017-0076-6
Qi, M., Yang, Y., Zhang, X., Zhang, X., Wang, M., Zhang, W., et al. (2020). Pollution reduction and operating cost analysis of municipal wastewater treatment in China and implication for future wastewater management. J. Clean. Prod. 253, 120003. doi:10.1016/j.jclepro.2020.120003
Qian, N., and Dai, D. Z. (1980). “The problems of river sedimentation and the present status of its research in China,” in Proceedings of the International Symposium on River Sedimentation. Guanghue Press 24 (29), 19–39.
Qu, Y., Jin, Z., Wang, J., Wang, Y., Xiao, J., Gou, L. F., et al. (2020). The sources and seasonal fluxes of particulate organic carbon in the Yellow River. Earth Surf. Process. Landforms 45 (9), 2004–2019. doi:10.1002/esp.4861
Rahman, A., Sarkar, S., and Kumar, S. (2020). Paleoenvironment of the Central Himalaya during late MIS 3 using stable isotopic compositions of lacustrine organic matter occluded in diatoms and sediments. Quat. Int. 558, 1–9. doi:10.1016/j.quaint.2020.08.024
Ran, L., Lu, X. X., Sun, H., Han, J., Li, R., and Zhang, J. (2013). Spatial and seasonal variability of organic carbon transport in the Yellow River, China. J. Hydrology 498, 76–88. doi:10.1016/j.jhydrol.2013.06.018
Raymond, P. A., Hartmann, J., Lauerwald, R., Sobek, S., McDonald, C., Hoover, M., et al. (2013). Global carbon dioxide emissions from inland waters. Nature 503 (7476), 355–359. doi:10.1038/nature12760
Reddy, S. K. K., Gupta, H., Badimela, U., Reddy, D. V., Kurakalva, R. M., and Kumar, D. (2021). Export of particulate organic carbon by the mountainous tropical rivers of Western Ghats, India: Variations and controls. Sci. Total Environ. 751, 142115. doi:10.1016/j.scitotenv.2020.142115
Singh, I. B. (2007). “The Ganga river,” in Large rivers: Geomorphology and management (Chichester: Wiley), 347–371.
Suchet, P. A., Probst, J. L., and Ludwig, W. (2003). Worldwide distribution of continental rock lithology: Implications for the atmospheric/soil CO2 uptake by continental weathering and alkalinity river transport to the oceans. Glob. Biogeochem. cycles 17 (2), 7–1. doi:10.1029/2002GB001891
Tamooh, F., Van den Meersche, K., Meysman, F., Marwick, T. R., Borges, A. V., Merckx, R., et al. (2012). Distribution and origin of suspended matter and organic carbon pools in the Tana River Basin, Kenya. Biogeosciences 9 (8), 2905–2920. doi:10.5194/bg-9-2905-2012
Thornton, S. F., and McManus, J. (1994). Application of organic carbon and nitrogen stable isotope and C/N ratios as source indicators of organic matter provenance in estuarine systems: Evidence from the tay estuary, scotland. Estuar. Coast. Shelf Sci. 38 (3), 219–233. doi:10.1006/ecss.1994.1015
Tranvik, L. J., Downing, J. A., Cotner, J. B., Loiselle, S. A., Striegl, R. G., Ballatore, T. J., et al. (2009). Lakes and reservoirs as regulators of carbon cycling and climate. Limnol. Oceanogr. 54, 2298–2314. doi:10.4319/lo.2009.54.6_part_2.2298
Verpoorter, C., Kutser, T., Seekell, D. A., and Tranvik, L. J. (2014). A global inventory of lakes based on high-resolution satellite imagery. Geophys. Res. Lett. 41 (18), 6396–6402. doi:10.1002/2014gl060641
Walling, D. E., and Fang, D. (2003). Recent trends in the suspended sediment loads of the world's rivers. Glob. Planet. change 39 (1-2), 111–126. doi:10.1016/s0921-8181(03)00020-1
Wang, H., Bi, N., Saito, Y., Wang, Y., Sun, X., Zhang, J., et al. (2010). Recent changes in sediment delivery by the huanghe (Yellow River) to the sea: Causes and environmental implications in its estuary. J. Hydrology 391 (3-4), 302–313. doi:10.1016/j.jhydrol.2010.07.030
Wang, J. J., Lu, X. X., and Kummu, M. (2011). Sediment load estimates and variations in the lower Mekong River. River Res. Appl. 27 (1), 33–46. doi:10.1002/rra.1337
Wang, X., Ma, H., Li, R., Song, Z., and Wu, J. (2012). Seasonal fluxes and source variation of organic carbon transported by two major Chinese Rivers: The Yellow River and Changjiang (Yangtze) River. Glob. Biogeochem. Cycles 26 (2). doi:10.1029/2011gb004130
Wang, S., Fu, B., Piao, S., Lü, Y., Ciais, P., Feng, X., et al. (2016). Reduced sediment transport in the Yellow River due to anthropogenic changes. Nat. Geosci. 9 (1), 38–41. doi:10.1038/ngeo2602
Wang, S., Fu, B., Liang, W., Liu, Y., and Wang, Y. (2017). Driving forces of changes in the water and sediment relationship in the Yellow River. Sci. Total Environ. 576, 453–461. doi:10.1016/j.scitotenv.2016.10.124
Wang, C., Lv, Y., and Li, Y. (2018). Riverine input of organic carbon and nitrogen in water-sediment system from the Yellow River estuary reach to the coastal zone of Bohai Sea, China. Cont. Shelf Res. 157, 1–9. doi:10.1016/j.csr.2018.02.004
Weiguo, L., Zisheng, A., Weijian, Z., Head, M. J., and Delin, C. (2003). Carbon isotope and C/N ratios of suspended matter in rivers: An indicator of seasonal change in C4/C3 vegetation. Appl. Geochem. 18 (8), 1241–1249. doi:10.1016/s0883-2927(02)00249-4
Wu, L., Huh, Y., Qin, J., Du, G., and van Der Lee, S. (2005). Chemical weathering in the upper Huang He (Yellow River) draining the eastern Qinghai-Tibet plateau. Geochimica Cosmochimica Acta 69 (22), 5279–5294. doi:10.1016/j.gca.2005.07.001
Xu, J., and Ma, Y. (2009). Response of the hydrological regime of the Yellow River to the changing monsoon intensity and human activity. Hydrological Sci. J. 54 (1), 90–100. doi:10.1623/hysj.54.1.90
Yang, X., Xue, L., Li, Y., Han, P., Liu, X., Zhang, L., et al. (2018). Treated wastewater changes the export of dissolved inorganic carbon and its isotopic composition and leads to acidification in coastal oceans. Environ. Sci. Technol. 52 (10), 5590–5599. doi:10.1021/acs.est.8b00273
Yu, Y., Wang, H., Shi, X., Ran, X., Cui, T., Qiao, S., et al. (2013). New discharge regime of the Huanghe (Yellow River): Causes and implications. Cont. Shelf Res. 69, 62–72. doi:10.1016/j.csr.2013.09.013
Yu, M., Eglinton, T. I., Haghipour, N., Montluçon, D. B., Wacker, L., Hou, P., et al. (2019). Impacts of natural and human-induced hydrological variability on particulate organic carbon dynamics in the Yellow River. Environ. Sci. Technol. 53 (3), 1119–1129. doi:10.1021/acs.est.8b04705
Zhang, J., Huang, W. W., and Shi, M. C. (1990). Huanghe (Yellow River) and its estuary: sediment origin, transport and deposition. J. Hydrology 120 (1-4), 203–223. doi:10.1016/0022-1694(90)90150-v
Zhang, S., Gan, W. B., and Ittekkot, V. (1992). Organic matter in large turbid rivers: the Huanghe and its estuary. Mar. Chem. 38 (1-2), 53–68. doi:10.1016/0304-4203(92)90067-k
Zhang, J., Huang, W. W., Letolle, R., and Jusserand, C. (1995). Major element chemistry of the Huanghe (Yellow River), China-weathering processes and chemical fluxes. J. Hydrology 168 (1-4), 173–203. doi:10.1016/0022-1694(94)02635-o
Zhang, X., Wu, Y., and Gu, B. (2015). Urban rivers as hotspots of regional nitrogen pollution. Environ. Pollut. 205, 139–144. doi:10.1016/j.envpol.2015.05.031
Keywords: rivers, total suspended matter, particulate organic matter, carbon, nitrogen, Ganges, Yellow, Mekong
Citation: Sarkar S, Verma S, Begum MS, Park J-H and Kumar S (2023) Sources, supply, and seasonality of total suspended matter and associated organic carbon and total nitrogen in three large Asian rivers—Ganges, Mekong, and Yellow. Front. Earth Sci. 11:1067744. doi: 10.3389/feart.2023.1067744
Received: 12 October 2022; Accepted: 11 April 2023;
Published: 09 May 2023.
Edited by:
Mashura Shammi, Jahangirnagar University, BangladeshReviewed by:
Jeffrey E. Richey, University of Washington, United StatesLishan Ran, The University of Hong Kong, Hong Kong SAR, China
Yuanbi Yi, Hong Kong University of Science and Technology, Hong Kong SAR, China
Selvaraj Kandasamy, Xiamen University, China
Copyright © 2023 Sarkar, Verma, Begum, Park and Kumar. This is an open-access article distributed under the terms of the Creative Commons Attribution License (CC BY). The use, distribution or reproduction in other forums is permitted, provided the original author(s) and the copyright owner(s) are credited and that the original publication in this journal is cited, in accordance with accepted academic practice. No use, distribution or reproduction is permitted which does not comply with these terms.
*Correspondence: Sanjeev Kumar, c2FuamVldkBwcmwucmVzLmlu