 Shujing Zhang
 Huaichun Wu
 Shihong Zhang1
 Tianshui Yang
 Haiyan Li
 Qiang Fang
 Meinan Shi
- 1State Key Laboratory of Biogeology and Environmental Geology, China University of Geosciences (Beijing), Beijing, China
- 2School of Ocean Sciences, China University of Geosciences, Beijing, China
SK-2 borehole in Songliao Basin provides unprecedented geological materials for investigating the Early Cretaceous continental paleoenvironment and paleoclimate in northeastern China. The lacustrine successions of the lower Shahezi (K1sh) Formation at the depth from 4,542 to 5,695 m was systematically studied using environmental magnetism and cyclostratigraphy in this study. Magnetic analysis reveals an inverse correlation between magnetic susceptibility (MS) and lithological ranks in fine clastic sediments, with the highest values in mudstones and the lowest in sandstones. The main magnetism carriers in the lower K1sh are pseudo-single-domain (PSD) and/or multi-domain (MD) magnetite with minor presence of hematite. MS was used to further explore the genesis of the environmental and climatic variations through cyclostratigraphic analysis. Sedimentary cycles of 113 m, 34 m, 13 m and 6 m can be identified in the power spectrum, which were interpreted as long and short eccentricity, obliquity, and precession cycles, demonstrating the impact of astronomical cyclicity on sedimentary rhythmicity. Floating astronomical time scale (FATS) of 4,090 kyr and 4,148 kyr were established by tuning the inferred long and short eccentricity cycles to the artificial 405-kyr and 105-kyr orbital eccentricity curves respectively. The estimated sediment accumulation rate around 28 cm/kyr confirms the rapid deposition process within the faulted lacustrine basin. Based on this study, the lake level oscillations in Songliao Basin are assumed to be shaped by long and short eccentricity, precession and semi-precession cycles during Early Cretaceous. This study also indicates that the sand-mudstone alternations deposition in K1sh is most likely driven by the seasonal discrepancies of summer insolation during semi-precession periods.
1 Introduction
The Early Cretaceous is a complex period characterized by a series of widespread oceanic anoxic events (OAEs), cold intervals interrupting the warm greenhouse climates, and several marine biotic crises, which are largely influenced by the global paleoceanographic and paleoclimatic changes (Pucéat et al., 2003; McAnena et al., 2013; Yang et al., 2013; Herrle et al., 2015; Matsumoto et al., 2020; Xu et al., 2022). As an essential component of the Earth’s climate system, continental deposits play critical roles in documenting global climate changes and interactions with ocean systems. Songliao Basin (SB) in northeastern China is well-known as a typical continental lacustrine basin deposit during the Cretaceous. This region has attracted tremendous attention in multidisciplinary investigations related to the Cretaceous Earth evolution. However, most paleoenvironmental and paleoclimatic studies conducted in SB are generally focused on the Late Cretaceous or the Cenozoic Eras in the past decade (Wu et al., 2013a; Chamberlain et al., 2013; Wang et al., 2013; Wu et al., 2014; Gao et al., 2015; Gao et al., 2021a; Gao et al., 2021b; Wu et al., 2022), and studies focused on the Early Cretaceous remain insufficient. Fortunately, the successful completion of Songke 2 well (SK-2) provides an unprecedented opportunity to systematically recover the global evolution from the Early to Mid-Cretaceous from the terrestrial perspective (Feng et al., 2013; Gao et al., 2019) with coring from Permian basement to the Yingcheng Formation (Zhu et al., 2018). Marked by rapidly deposited lacustrine strata and thick lacustrine deposits and interbedded with surrounding volcanic rocks, Shahezi Formation (K1sh) is considered to be a valuable sequence that systematically documented the terrestrial climate evolution from Early to Mid-Cretaceous.
In contrast to the slow depositional processes of marine sedimentation or turbulent fluvial/alluvial depositional environments, lacustrine sediments contain stable, continuous and high-resolution archives of the continental paleoenvironment (Liu et al., 2012). Compared with the complex clay mineralogy and (radio-)isotopic stratigraphy testing procedures, rock magnetism and the derived environmental magnetic interpretations are favored by paleoenvironmentalists and paleoclimatologists for their simple, rapid, cost-effective and informative measurements (King and Channell, 1991; Dekkers, 1997; Liu et al., 2012; Zhang et al., 2020). Most importantly, environmental evolution can be tracked through time from the properties of magnetic minerals, concentrations and domain states of the magnetic substance contained in rocks or sediments (Thompson and Oldfield, 1986; Verosub and Roberts, 1995).
Analyzing the magnetic parameters using cyclostratigraphy is one of the most effective methods to reconstruct the paleoenvironment and explore the astronomical origin which potentially controls the paleoclimate changes. In the study of Cretaceous strata in SB, Li et al. (2013) found that the main magnetization-carrying minerals in the Qingshankou Formation of SK-1s Well is clastic magnetite, and the lake level was affected by both tectonics and Milankovitch forcing. From the same well, Wu et al. (2013a) established an astronomical age-depth model for the Late Cretaceous lacustrine sequences using MS data, which provides a precise chronological basis for important geological events. These results indicate that magnetic parameters can be used as a reliable paleoclimatic proxy of continental successions for further interdisciplinary research. However, the paucity of related work in the Early Cretaceous has created a knowledge gap in our understanding of the continental paleoenvironment, preventing comprehensive coverage of the coupling between land and ocean climatic processes during the Early Cretaceous.
In this study, detailed rock-magnetic measurements were conducted on the samples from the lower part of the K1sh, SK-2, and then lithology and cyclostratigraphy were applied to preliminarily analyze the distinct sedimentary cycles. The main scientific objectives of this study are to 1) describe the magnetic characteristics of the sediments in the K1sh, and compare these characteristics among different lithologies, 2) provide preliminary temporal constraints on the studied strata, which can be used as a reference for future correlation studies between marine and terrestrial records, and 3) probe the response of sedimentation to the orbital and sub-orbital forcing mechanisms recorded in the K1sh.
2 Geological setting and SK-2 well
2.1 Geological setting
With a N-NE trending axis, Songliao Basin (SB) is located on the Jiameng Block across three provinces (Heilongjiang, Jilin and Liaoning) of northeast China at the convergence of the Siberian Plate, North China Plate and the western margin of the paleo-Pacific tectonic belt (Zhou et al., 2009) (Figures 1A–C). It is one of the longest-evolved and largest Cretaceous continental basins in the world (Hou et al., 2018). SB is 760 km long, 330–370 km wide and covers an area of 260,000 km2. Tectonically, the formation of the basin in the Cretaceous period was closely related to the subduction of the paleo-Pacific plate beneath the paleo-Asian Plate and active magmatism due to both plume activity and subduction (Okada, 2000; Zhou et al., 2009). Following the mantle upwelling stage during the Middle and Late Jurassic, the Cretaceous SB underwent three episodes: syn-rifting stage (∼150–110 Ma), post-rift thermal sagging stage (∼110–79.1 Ma), and structural inversion stage (∼79.1–64 Ma) (Wang et al., 2007; 2016; Zhou et al., 2009; Feng et al., 2010).
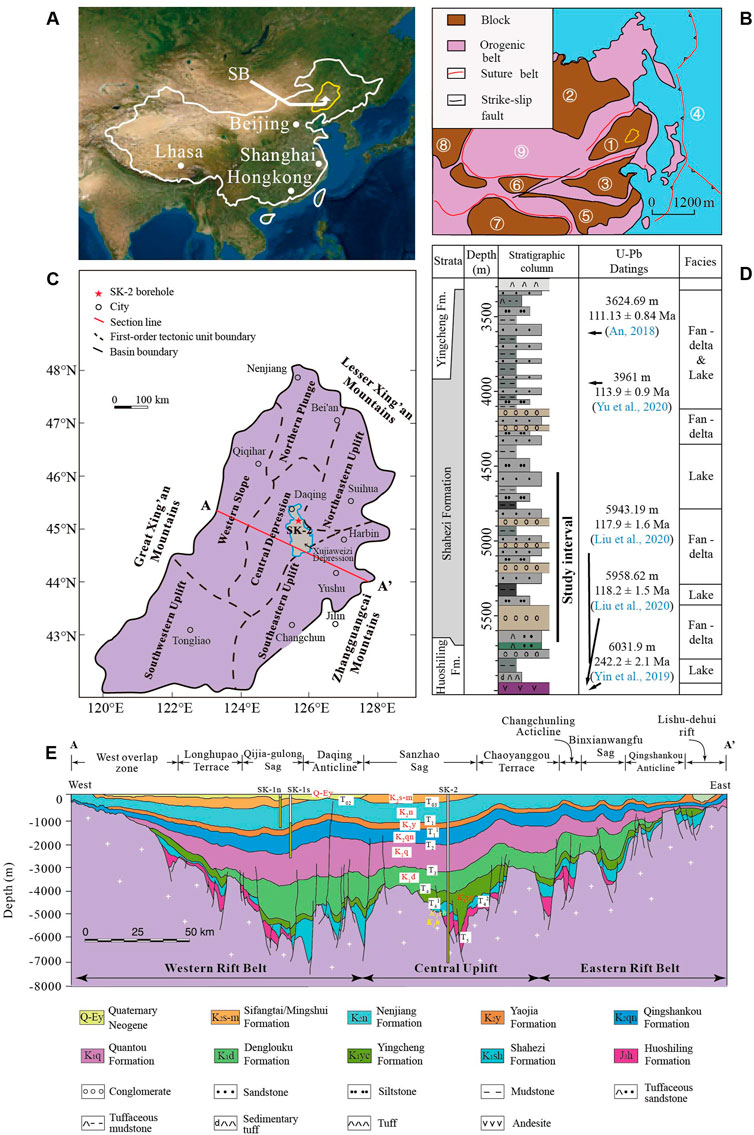
FIGURE 1. (A) Location of the Songliao Basin (SB) in northeastern Chinese mainland (B) Tectonics of East Asia, yellow circle is the same as (A), ① Jiameng block, ② Siberian block, ③ North China block, ④ Pacific plate, ⑤ South China block, ⑥ Tarim block, ⑦ India block, ⑧ Eastern Europe block, and ⑨ Central Asian orogenic belt (modified from Zhou et al., 2009) (C) The first-order tectonic units of SB and location of SK-2 borehole (modified from Feng et al., 2013) (D) Stratigraphic sequence of the Shahezi Formation in SK-2 and corresponding age data (modified from Liu et al., 2020), the black line represents interval in this study (E) The structural section across the central SB (A-A′ in (C)) and sites of the boreholes which had been drilled in Continental Deep Scientific Drilling of SB up to 2018. The yellow bars are intervals with continuous coring, and white bars are uncored intervals (modified from Wang et al., 2013).
As a superimposed rift basin, the SB overlies a basement that consists mainly of Precambrian to Paleozoic metamorphic and igneous rocks and Paleozoic to Mesozoic granites. The Mesozoic and Cenozoic continental strata as thick as 10,000 m are recovered in the central part of the basin (Figure 1E) (Wang et al., 2006; Pei et al., 2007; Zhou et al., 2009; Zhang et al., 2011; Hou et al., 2018). The Cretaceous lithologic strata are divided into ten formations, namely, Huoshiling (K1h), Shahezi (K1sh), Yingcheng (K1yc), Denglouku (K1d), Quantou (K1q), Qingshankou (K2qn), Yaojia (K2y), Nenjiang (K2n), Sifangtai (K2s), and Mingshui (K2m) in ascending order (Wang et al., 2007; 2013; Feng et al., 2010) (Figure 1E).
The Cretaceous period in the SB had a humid to sub-humid subtropical paleoclimate with four cooling events, three warming events, and two semi-arid events (Wang et al., 2013). Based on the literature references referring to geology (Wang et al., 1995; Du et al., 2011; Zhang et al., 2018), paleontology (Gao et al., 1992; Gao et al., 1999b) and oxygen isotopic materials (Chamberlain et al., 2013), these climatic events are in agreement with the climatic pattern documented by synchronous marine formations. The consistency of the cold Early Cretaceous climate patterns reconstructed from both continents, especially western Liaoning of northeastern China (Amiot et al., 2011; Wang et al., 2017), and marine enviroment (Pucéat et al., 2003; Gutiérrez-Puente et al., 2021), may indicate that the atmosphere-ocean system had a global impact on continental climate and environment.
2.2 The SK-2 well and the K1sh
Cretaceous International Continental Scientific Drilling Project of SK-2 started at April 2014, and was officially completed on 26 May 2018, with a total drilling depth of 7,018 m. It obtained 4,134.8 m length of sediments with a recovery ratio of 96.61% (Hou et al., 2018; Zhu et al., 2018). SK-2 well is located at the Xujiaweizi faulted depression in Songzhan area, where the lacustrine mudstones dominate the section (Wang et al., 2017). The project collected continuous sediments from the bottom of the K1d down to the basement of SB, with K1yc, K1sh, and K1h as the main target strata, which were deposited during the Early Cretaceous syn-rifting stage. Unlike the volcaniclastic sequences in K1yc and K1h, the intercalated K1sh is characterized by lacustrine clastic deposits containing abundant hydrocarbon rocks and coal seams (Wang et al., 2015; Fu et al., 2019).
The Shahezi (K1sh) Formation (5,695.1–3336 m) of SK-2 is generally composed of dark rocks interbedded with coals, and is interpreted as river, lacustrine, and delta deposits formed in reducing environment during a greenhouse condition (Wang et al., 2017). K1sh unconformably overlies the K1h, and it can be divided into two members. The Member 1 (5,695.1–4,542 m) consists of variegated conglomerates intercalated with gray coarse sandstones, grayish-black mudstones of unequal thickness at the bottom and gray silty sandstones, dark gray mudstones in the upper part, suggesting that sedimentary facies shifted from fan delta to deep lake in ascending order. The Member 2 (4,542–3,336 m) is composed of a large amount of fine-grained sediments, such as grayish-black silty sandstone and mudstone with occasional variegated conglomerate-bearing sandstone that were deposited in lacustrine environment. Li. (2018) divided the K1sh of the SK-2 into six sedimentary cycles according to detailed core description, with each of them displaying fining-upward trend that reveals multi-periodic climate cycles from relatively arid to humid. It is a succession with normal grading in the grain size deposition, indicating a weakening hydrodynamic condition and gradually wetter paleoclimate.
2.3 Geochronological constraints of the K1sh
Previous investigations have extensively estimated the chronostratigraphy for K1sh strata distributed in northeastern China basins by using diverse dating techniques. In the view of biostratigraphically, K1sh has been commonly considered belonging to the lower Cretaceous (Gao et al., 1999a). Wang et al. (2002) obtained ages from volcanic rocks of 135.96 ± 0.28 Ma at the bottom of the K1yc and 147.77 ± 0.28 Ma at the top of the K1h using 40Ar/39Ar dating method, providing a ∼10 Myr duration for K1sh. Liu et al. (2020) constructed a 11.14 Myr floating astronomical time scale for the K1sh of the Songshen-4 well located near SK-2. Afterwards, further precise zircon U-Pb ages of 111–115 Ma and 105-112 Ma in K1yc performed by Shu et al. (2007) and Huang et al. (2011) respectively, demonstrated the base of K1sh is supposedly formed during Aptian period. Recently, more new zircon U-Pb data derived from the SK-2 borehole restrict K1sh into ∼118–111 Ma (An, 2018; Liu et al., 2020; Yu et al., 2020; Wang et al., 2022) (Figure 1D) and correlate this non-marine succession to late Aptain-early Albian stage. This ∼118–111 Ma age scale is currently the mostly acceptable chronological constraint for the K1sh in present research.
3 Materials and methods
3.1 Sampling and data
A total of 1,097 samples were collected from the lower K1sh (5,690–4,542 m) of the SK-2 except for the 4,900–4,918 m interval with an average interval of 1 m. Each sample was broken into pieces and placed into a 8 cm3 non-magnetic, cubic plastic box for detailed magnetic measurements. Low-field mass-specific magnetic susceptibility (χ) is the magnetization induced by the applied magnetic field versus the value of the applied field per unit mass. The concentration of all magnetic minerals (i.e., ferromagnetic, paramagnetic, and diamagnetic minerals) affects the χ in sediments making it challenging to interpret the climate or environment fluctuations. Anhysteretic remanent magnetic susceptibility (χARM) is obtained by applying a direct current (DC) magnetic field in the presence of an alternating magnetic field that is decreased from some peak value to 0. It is a measure of the concentration of only the fine low coercivity ferrimagnetic minerals in a rock sample which usually has a detrital origin in lacustrine sediments. Saturation isothermal remanent magnetization (SIRM) measures the concentration of all ferrimagnetic minerals in a sample by using a stable DC field at room temperature to apply the maximum remanence magnetization from the specimen. Numerous studies have shown that the magnetic parameters can serve as a sensitive indicator of the climate cycles (Ellwood et al., 2000; Latta et al., 2006; Boulila et al., 2010; Kodama et al., 2010; Wu et al., 2012). We used magnetic data on these three parameters to identify the most suitable climate proxy and better understand the paleoclimate evolution.
3.2 Methods
3.2.1 Magnetic testing
χ was measured in a low magnetic field (approximately 0.256 mT) using the AGICO MFK1-FA Kappabridge with a low frequency of 974 Hz. Anhysteretic remanent magnetization (ARM) was obtained by the ASC D-2000 AF demagnetizer with a 100 mT alternating field superimposed with a 0.05 mT DC field and its value would be divided by 0.05 mT to get χARM. Specimens were remagnetized in a positive 1 T field with the ASC IM-10–30 impulse magnetizer to approach the saturation isothermal remanent magnetization (SIRM). All remanences were measured with a JR-6A spinner magnetometer. Additionally, it is essential to weigh rock samples before magnetic measurements to ensure mass normalization can be conducted. Thermomagnetic κ-T curves for 10 representative samples were obtained using AGICO KLY-4S Kappabridge in argon atmosphere with a CS-3 heating component between room temperature and 700 °C. These experiments were performed in the Paleomagnetism and Environmental Magnetism Laboratory at China University of Geosciences, Beijing.
IRM acquisitions, hysteresis loops and first order reversal curves (FORCs) were performed to the 10 samples using MicroMag Model 3,900 vibrating sample magnetometer (VSM, Princeton MicroMag 3,900) in the Institute of Geophysics, China Earthquake Administration. The maximum applied fields for IRM acquisitions are 1 T. Hysteresis loops were imparted to maximum fields of 200 mT for nine samples, 500 mT for one sample with 500 m averaging time. FORCs with 160 segments were diagramed using the FORCinel software (Harrison and Feinberg, 2008).
3.2.2 Cyclostratigraphy
Cyclostratigraphic analysis concerning the environmental magnetic records provides an effective method to investigate the mechanism of the climate variation imprinted in the basinal strata (Wu et al., 2013a; Wu et al., 2013b). Before time series analysis, the data series were interpolated onto an evenly sampled grid of ∼1.05 m and detrended to remove linear trend. Multi-taper method (MTM) was applied to identify the presence of spectral peaks in the data (Thomson, 1982). Classical red noise estimation was conducted to interpret the significance of spectral peaks (Mudelsee, 2014). Then cycle ratio method was used to estimate the possible existence of the Milankovitch cycles (Weedon, 2003). The evolutive harmonic analysis (EHA) was used to evaluate the persistence and/or transience of orbital frequencies and to track the possible changes in sediment accumulation rates in depth domain (Meyers, 2014). The Gaussian bandpass filters were designed to extract the signals of the interpreted Milankovitch and sub-Milankovitch cycles (Bloch et al., 1969; Meyers, 2014). Stratigraphic series were transformed from depth to age scale using specified anchor points with tune function. Hilbert transform was performed to examine the amplitude modulation (AM) of the studied signals. These spectral analyses and astronomical calibration processes were implemented using the Astrochron package in R (Meyers, 2014). The correlation coefficient (COCO) analysis was carried out to quantitatively identify the astronomical forcing on stratigraphic cycles and accurately assess the sediment accumulation rate (SAR) with ACycle v2.1 (Li et al., 2018). Evolutionary correlation coefficient (eCOCO) analysis was used to track the changes in SAR along the studied stratigraphic series (Li et al., 2018).
3.2.3 Lithological statistics
The ten lithological ranks, from mudstone to conglomerate, are numbered from 1 to 10 in order with increasing grain size (see Figure 2A for the classification). These lithological ranks were used to fit a lake level curve, with lower ranks denoting high lake level and higher ones denoting low lake level (Figure 3A). Histogram. m, fitdist. m, and boxplot. m functions to individually and collectively describe the χ distributions associated to each rank were applied in MATLAB.
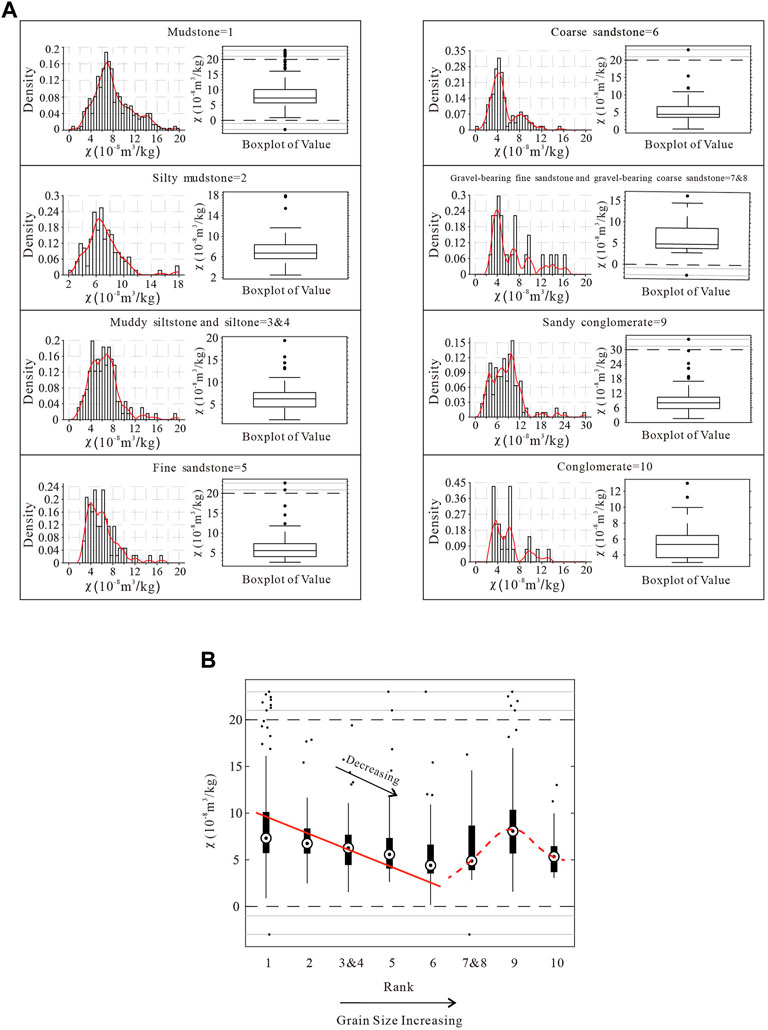
FIGURE 2. (A) Probability density distribution of mass-specific magnetic susceptibility (χ) values (left) and boxplot (right) from the SK-2 Well for the ten lithological ranks. Mudstone (Rank = 1), silty mudstone (Rank = 2), muddy siltstone (Rank = 3) and siltstone (Rank = 4), fine sandstone (Rank = 5), coarse sandstone (Rank = 6), gravel-bearing fine sandstone (Rank = 7) and gravel-bearing coarse sandstone (Rank = 8), sandy conglomerate (Rank = 9), and conglomerate (Rank = 10) (B) Relationship between χ values and lithological ranks of the lower K1sh Formation in the SK-2 Well. Rank values are the same as (A).
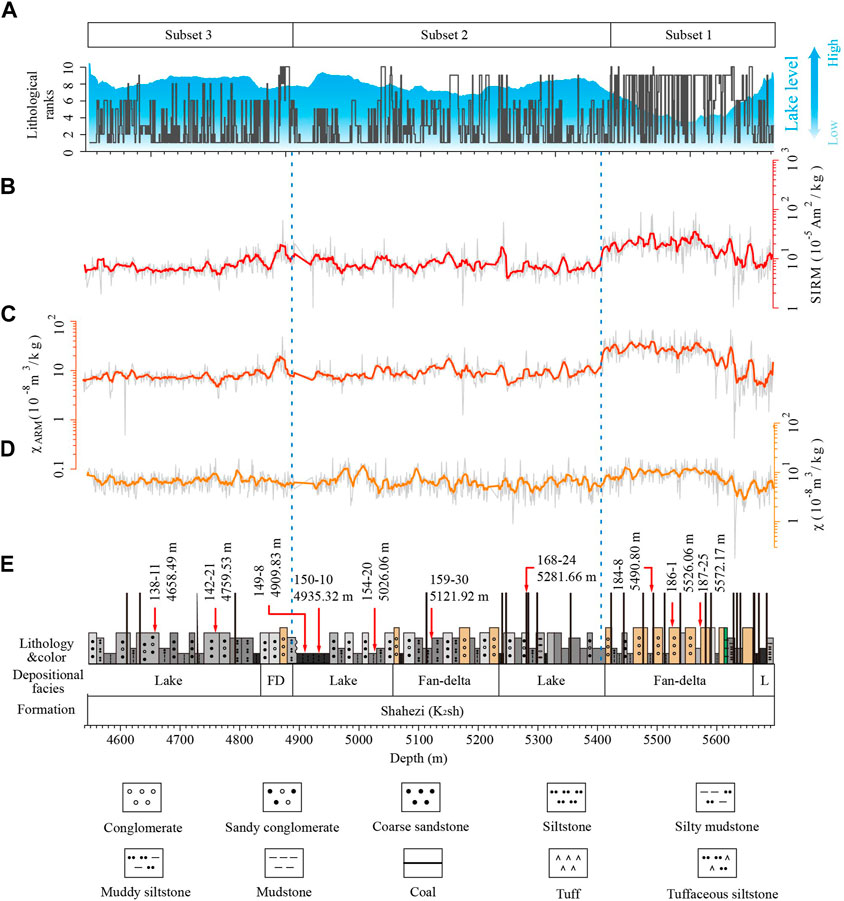
FIGURE 3. Magnetic parameter profiles for sediments of the lower K1sh (4,542–5,694 m) from the SK-2 borehole (A) Lake level fluctuations (the blue shading) are modeled from the variations of lithological ranks (B) SIRM (C) χARM (D) χ (E) Stratigraphy, depositional facies and lithology of the studied strata, with red arrowheads pointing to the corresponding depths of the selected representative samples for rock magnetic experiments. FD: Fan-delta. L: Lake. Depositional facies are modified from Liu et al. (2020). Dashed blue lines divide the succession into Subset 1, Subset 2, and Subset 3.
4 Results
4.1 Magnetic series of the lower K1sh formation
According to the trends of magnetic data combined with lithological ranks, the studied sequence can be divided into three subsets, including Subset 1 extending from 5,695 m to 5,400 m, Subset 2 spanning from 5,400 m to 4,900 m and Subset 3 corresponding to the interval from 4,900 m to 4,542 m (Figure 3).
Subset 1 (5,695 m–5,400 m): The magnetic parameters had the highest values for the entire section. The average values of the three concentration-dependent parameters are 8.24×10⁻⁸ m3/kg for χ (Figure 3D), 17.64×10⁻⁸ m3/kg for χARM (Figure 3C), and 13.94×10⁻⁵Am2/kg for SIRM (Figure 3B) respectively. The values for the upper conglomerates are larger than the bottom mudstones, indicating the magnetic contents in the conglomerate are significantly higher than those in other clastic sedimentary rocks.
Subset 2 (5,400 m–4,900 m): The mean values of χ, χARM and SIRM are 6.67×10⁻⁸ m3/kg, 7.28×10⁻⁸ m3/kg and 6.21×10⁻⁵ Am2/kg respectively. They are comparable to the bottom of Subset 1 and remain steady with periodic fluctuations (Figures 3B–D). While χ and χARM do not exhibit apparent trends (Figures 3C, D), SIRM has a clearly increasing trend (Figure 3B), indicating high coercivity magnetic minerals increases during this interval.
Subset 3 (4,900 m–4,542 m): Mean values of χ, χARM, and SIRM are 6.87×10⁻⁸ m3/kg, 6.55×10⁻⁸ m3/kg and 6.13×10⁻⁵ Am2/kg. The value of χ is comparable to that of Subset 2 and χARM and SIRM are lower than those of Subset 2 (Figures 3B–D). χARM and SIRM show distinctly declining trends with shallowing depth (Figures 3B, C).
4.2 Rock magnetic characteristics
4.2.1 κ-T thermomagnetic curves
The critical temperatures at the peaks and/or inflections exhibited in the κ-T thermomagnetic curves can be used to determine the categories of magnetic minerals contained in the samples (Thompson and Oldfield, 1986; Bloemendal et al., 1988). The magnetic susceptibility (κ) of all samples increases considerably in the cooling curves from 600°C to 400°C and is higher apparently than the peak value in the heating curves (Figures 4A, F, K), implying that the iron-bearing clay minerals (and/or silicate) were converted into magnetite (titanomagnetite) in the high temperature ranging from 600°C to 700°C. The increase of the magnetic susceptibility (κ) of the sample S-150–10 during 200°C–300°C in the heating process can be attributed to the formation of maghemite from some iron hydroxide (Figure 4A). The value of κ descends significantly at a temperature range of 300°C–400°C, which is possibly related to the transformation from maghemite to hematite, and is consistent with the hematite signal above 600°C. The magnetic susceptibility of the samples like S-159–30 decreases slowly with the increase of temperature before 300°C (Figure 4F), which is indicative of the presence of paramagnetic minerals in the samples (Li and Zhang, 2005). The magnetic susceptibility gradually increases from 300°C, reaches the peak value at about 500°C, then drops to the base value at around 580°C. These variations show the Curie temperature of magnetite at 580°C, which may result from the decomposition of iron-bearing paramagnetic minerals transformation into magnetite (Zhu et al., 2001) or the original existence of magnetite. The slight attenuation between 600°C and 700°C suggests the presence of hematite. The magnetic susceptibility values of samples like S-168–24 are one order of magnitude larger compared with other samples and show clear Curie temperature of magnetite at 560°C–600°C (Figure 4K), which indicates the high concentration of magnetite in these samples.
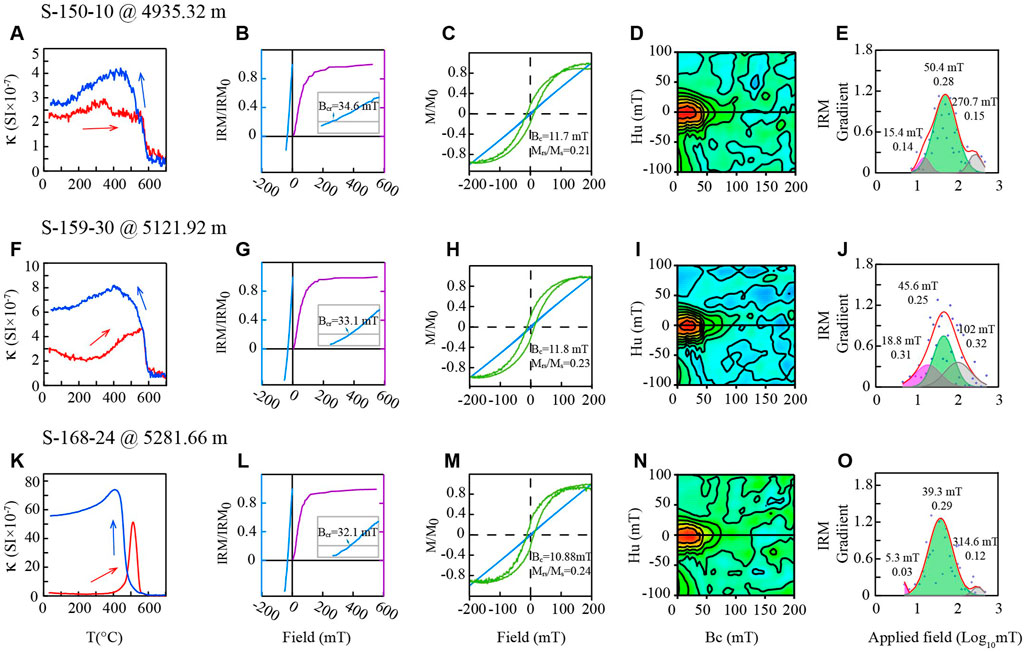
FIGURE 4. Rock magnetic diagnosis of three of the representative samples selected from the lower K1sh (depth for each sample can be seen in FIGURE. 3(A)) (A, F, K) κ-T curves with red (blue) lines indicating heating (cooling) curves (B, G, L) Normalized IRM acquisition curves (purple lines) and reverse demagnetization curves (blue lines) with zooming plots showing Bcr for each sample (C, H, M) Normalized hysteresis loops before (blue lines) and after (green lines) paramagnetic correction measured during room temperature. The maximum values of applied fields are set as 200 mT (D, I, N) FORC diagrams (smoothing factor=10) (E, J, O) IRM decomposition curves (Kruiver et al., 2001; Heslop et al., 2002): red lines are the fitted results of the scattered blue diamonds which denote the gradients of IRM acquisition curves. Magenta, green, and grey shadings represent the maghemite (and/or coarse magnetite), fine magnetite, and hematite, respectively. The B1/2 and DP values of each component have been labeled.
4.2.2 IRM acquisition and reverse demagnetization curves
The IRM acquisition curves and reverse demagnetization curves are usually utilized to estimate the remanence coercivities, which are then used preliminarily to determine the main ferromagnetic minerals of the natural materials (Wu et al., 2013b). The IRM of the majority of the samples, achieves 50% of the SIRM at ∼44 mT (39.4–48.9 mT), 90% of the SIRM at ∼100 mT (93.8–127 mT), and virtually saturation at roughly 200 mT (161–254 mT) (Figures 4B, G, L). Bcr (remanence coercivity) was in the range of 30.5–36 mT (Figures 4B, G, L). Therefore, the main magnetic minerals are low coercivity ferrimagnetic minerals in most of the selected samples.
IRM acquisition curve decomposition is a mathematically statistical method using the linear additivity of the cumulative logarithmic Gaussian distribution of each component in the curve (Robertson and France, 1994) to efficiently distinguish magnetic mineral components (Kruiver et al., 2001; Heslop et al., 2002). We used the Excel workbook file provided by Kruiver (Kruiver et al., 2001) and the Irmunmix program written by Heslop (Heslop et al., 2002) to fit and optimize the first derivative of the IRM acquisition curve. The different B1/2 value (i.e., the abscissa value of the peak), coercivity distribution and SIRM of each of the curves are shown as the criteria to discriminate individual magnetic components contained in the samples. Three components were recognized (Figures 4E, J, O) including component 1: maghemite or coarse magnetite particle (<20 mT mean coercivity), component 2: fine magnetite particle (∼40–60 mT mean coercivity with wide distribution), and component 3: hematite (B1/2 > 100 mT), which is consistent with the κ-T results. Component 3 accounts for only 11% and 4% of the total IRM of the samples S-150–10 and S-168–24 respectively, indicating the predominance of low-coercivity magnetic minerals and few high-coercivity magnetic minerals in the sediments and that high-coercivity magnetic minerals are few. In sample S-159–30, the IRM contribution of component 3 is about 29%. Therefore, low-coercivity minerals coupled with considerable amounts of high-coercivity components make up the magnetic minerals in sediments from this depth.
4.2.3 Hysteresis loops and first order reversal curves (FORCs)
The hysteresis loops, corrected for paramagnetics (green lines in Figures 4C, H, M), provide comprehensive information about the types of magnetic minerals and the states of magnetic domains (particle sizes) (Roberts et al., 2000), which is mainly expressed by the shape of the loops and key data such as saturated magnetization (Ms), saturated remanence magnetization (Mrs), coercivity (Bc), remanence coercivity (Bcr), Mrs/Ms, and Bc/Bcr (Dunlop and Özdemir, 1997). All loops are thin and long in shape, making it clear that the magnetic particles included are relatively coarse with low coercivity (Figures 4C, H, M). In addition, the hysteresis loops of some samples did not close at high field (Figure 4C, M), which may be the consequence of the presence of paramagnetic minerals and diamagnetic components.
As an extension of hysteresis measurements, FORC diagrams are used to reveal the coercivity and domain state of the magnetic particles. Most samples have coercivity distribution between 0–100 mT with peak Hc at 30 mT, and vertical distribution Hu within the range of ±50 mT (Figures 4D, I, N). The common shapes are triangles truncated by y-axis, which suggests that the main magnetic particles in these samples are PSD particles.
4.3 Cyclostratigraphy
4.3.1 Stratigraphic power spectral analysis
Here we present the integrated spectral analyses of mass-specific magnetic susceptibility data, because χ data are closely related to lithologies and sedimentary facies and only this proxy provides the best cycle interpretation in the lower K1sh (detailed information see section 5.1). In the MTM power spectrum of χ data sequence, statistically significant peaks at 113 m, 34 m, 13 m and 6 m sedimentary cycles above 95% confidence level can be distinguished (Figure 5A). The ratio of these cycles 18.8:5.7:2.2:1 is consistent with the spectral peak ratio (18.4:5.7:2.1:1) for the astronomical periods of 405 kyr, 125 kyr, 47 kyr, and 22 kyr presented in the La2004 solution (Figure 8A). This matching preliminarily provides an estimation of SAR of ∼27.20–27.90 cm/kyr. The COCO tests of the χ data suggest the optimal sediment accumulation rates (OSARs) are 21.39 and 27.72 cm/kyr, with null H0 (hypothesis) significance level <0.001 (Figures 5C–E). The ∼28 cm/kyr OSAR makes those cycles identified in depth domain can be interpreted to represent the long eccentricity, short eccentricity, obliquity, and precession cycles, respectively. The frequency shifts in the EHA spectrogram (Figure 5B) are linked to the minor peaks centered around the major peaks found in the MTM spectrogram (Figure 5A), which may be caused by the SAR changes over the stratigraphic domain. This was quantitatively estimated by the eCOCO method, which suggests that the SARs from the lower K1sh Formation most likely varied between 20 and 40 cm/kyr and centered on ∼28 cm/kyr (Figures 5F, G).
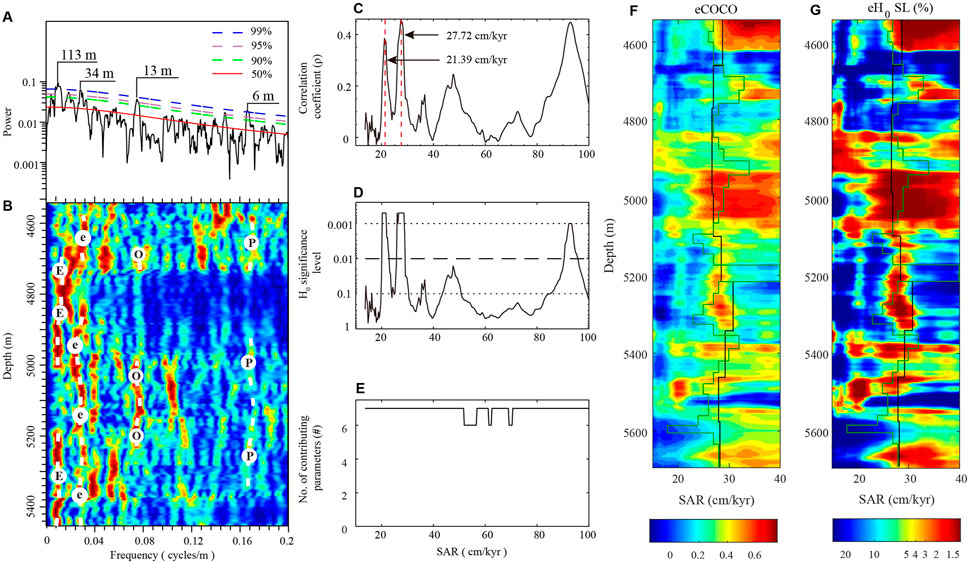
FIGURE 5. Power spectra, COCO and eCOCO analysis for the χ series of the lower K1sh Formation (A) 2π MTM power spectrum of the χ series. The solid red line, dashed green, purple, and blue lines represent the 50%, 90%, 95%, and 99% confidence levels (B) Evolutive harmonic analysis (EHA) results with a sliding window of 120 m and a step rate of 1 m. The red to blue colors represent high to low power normalized to 1. The dashed white lines marked with E, e, O and P show the orbital long eccentricity, short eccentricity, obliquity, and precession cycles, respectively (C–E) COCO analysis of the untuned χ series. The results are shown as the correlation coefficient spectrum (ρ) (C), H0 (null) hypothesis test (D), and the number of contributing astronomical frequencies (#) (E). Tested SARs range from 1 to 100 cm/kyr (F, G) eCOCO analysis of the untuned χ series. The evolutionary ρ and evolutionary H0 (null) hypothesis test are overlapped with SAR curves (black lines) based on 405-kyr tuning and 105-kyr tuning. Tested SARs range from 1 to 40 cm/kyr. The sliding window size is 150 m with a step of 1.0513 m. For both the COCO and eCOCO, the running step of the SAR is 0.28778 cm/kyr and the number of Monte Carlo simulations is 2000.
In addition, MTM spectral analyses were also performed on the magnetic indexes χARM and SIRM (Figures 6B, C) with a larger maximum frequency of 0.4 cycles/m. According to the above OSAR, the results of the power spectral analyses of the three magnetic parameters are shown below.
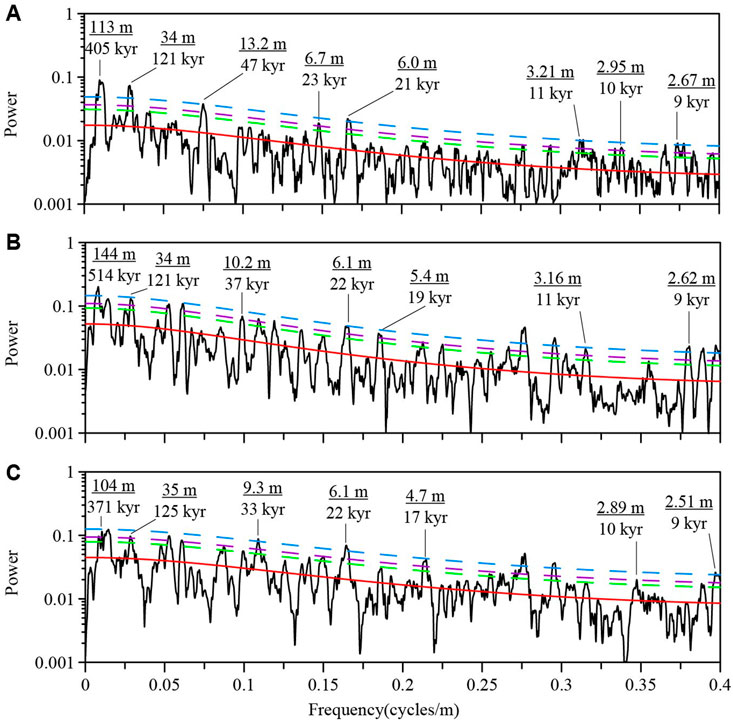
FIGURE 6. 2π MTM power spectra of the (A) χ series (B) χARM, and (C) SIRM series. The meanings of the colors of the solid and dashed curves are the same as those in Figure. 5A. Prominent peaks are labeled with stratigraphic cycles in m and the interpreted periods in kyr.
The power spectrogram of χ shows long eccentricity period at 113 m, short eccentricity at 34 m, obliquities at 13.2 m, precession at 6.7 and 6.0 m, and semi-precession at 2.67–3.21 m (Figure 6A). The MTM spectrum of χARM are likely to reveal 514 kyr at 144 m, short eccentricity at 34 m, obliquity at 10.2 m, precession at 5.4–6.1 m, and semi-precession at 2.62–3.16 m (Figure 6B). The prominent peaks discerned in the SIRM power spectrum at 104 m, 35 m, 9.3 m, 4.7–6.1 m, and 2.51–2.89 m correspond to the 371 kyr, short eccentricity, obliquity, precession, and semi-precession cycles, respectively (Figure 6C). The interpreted 514-kyr cycle observed on the MTM power spectra of χARM series, which is different than the 405-kyr eccentricity cycle, may be related to the variations for the SAR or the frequency decomposition of the eccentricity of the earth (Laskar et al., 2004).
4.3.2 Floating astronomical time scale (FATS) and sediment accumulation rates (SARs) of the lower K1sh formation
Due to the stability of the 405-kyr eccentricity (Laskar et al., 2004) and the feasibility of using the 105-kyr short eccentricity (Wu et al., 2012) as tuning tool throughout the Mesozoic Era, we tuned the χ depth series to the interpreted 405-kyr (Figures 7A, C, D) and 105-kyr cycles (Figures 7D, E, G) respectively. The FATS established by the 405-kyr and 105-kyr tuned series estimate durations of 4,090 kyr and 4,148 kyr, respectively, both of which fall into the range of radiometric times published by Liu et al. (2020) (Figure 1D). Peaks in the 405-kyr tuned χ spectrum are at 1,300 kyr, 405 kyr, 122 kyr, 88 kyr, 48 kyr, 34 kyr, 32 kyr, 22 kyr, 17.4 kyr, 16.5 kyr, ∼12–7.9 kyr periods (Figure 8B). The 105-kyr-tuned χ spectrum has peaks at 1,400 kyr, 105 kyr, 34 kyr, 25 kyr, 24 kyr, 21 kyr, 19 kyr, 17 kyr, ∼13.4–9.8 kyr (Figure 8C). Both the tuned χ spectra are tightly concordant with the early Cretaceous astronomical parameters of long eccentricity (405 kyr), short eccentricity (124 kyr, 95 kyr), obliquity (47 kyr, 37 kyr, 36 kyr, 28 kyr), and precession (22 kyr, 21 kyr, 18 kyr) bands (Figure 8A) (Laskar et al., 2004).
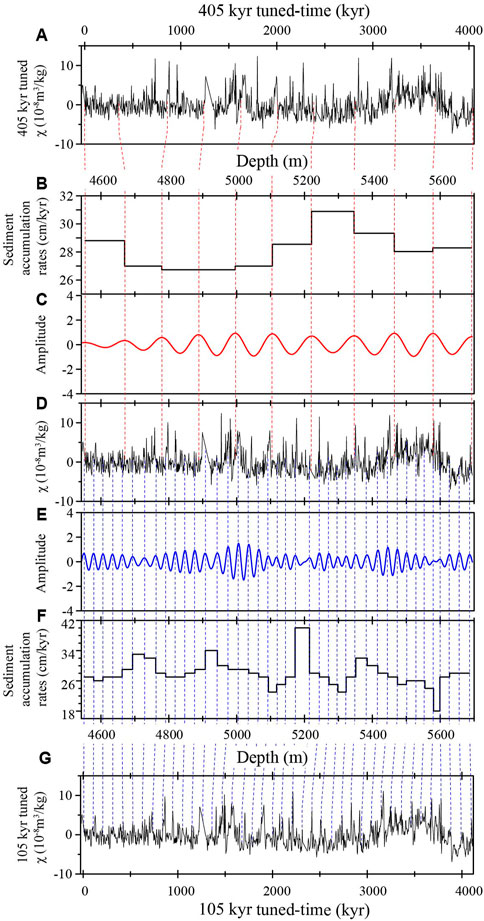
FIGURE 7. Depth-time transitions of the untuned χ series. The untuned χ series (D) were tuned by the 405-kyr signals extracted with bandpass filter of 0.009 ± 0.002 cycles/m (C) and 105-kyr signals extracted with bandpass filter of 0.035 ± 0.007 cycles/m (E) to get the 405-kyr tuned χ series (A) and 105-kyr tuned χ series (G, B, F) show the sedimentation accumulation rates estimated by the 405-kyr and 105-kyr tuning processes.
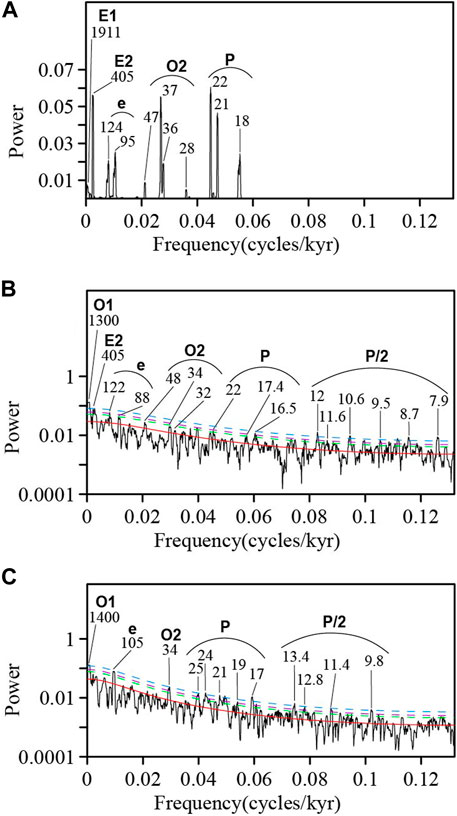
FIGURE 8. 2π MTM spectral analyses for (A) the orbital signals for the La2004 solution (Laskar et al., 2004), over the periods of 110–120 Ma (B) the 405-kyr tuned χ series, and (C) the 105-kyr tuned χ series. E1: the longer eccentricity (∼2 Myr); E2: long eccentricity; e: short eccentricity; O1: the longer obliquity (∼1.2 Myr); O2: obliquity; P: precession; P/2: semi-precession.
The SARs constrained by 405-kyr eccentricity cycles change between 26.7 cm/kyr and 30.9 cm/kyr, with an average of 28.1 cm/kyr (Figure 7B). The SARs analyzed on a scale of 105-kyr eccentricity cycles range from 18 to 40 cm/kyr, with an average of 27.8 cm/kyr (Figure 7F). The high SAR in this study compared with the 6.55 cm/kyr SAR obtained from well SS4 for the K1sh Formation (Liu et al., 2020) may be attributed to the frequent faulting activities in basin center during the Early Cretaceous. The SARs of 28.1 cm/kyr and 27.8 cm/kyr obtained by astronomical tuning (Figures 7B, F) are basically consistent with those obtained by COCO and eCOCO analysis (Figure 5C) of ∼28 cm/kyr, and also falls into the range calculated by radiometric ages (12.14–46.46 cm/kyr) (Figure 1D). These results provide conclusive evidence for the cyclostratigraphic interpretation based on the χ data.
5 Discussion
5.1 Magnetic susceptibility as paleoenvironmental proxy
The statistical analysis aims to discover the correlations between lithology and magnetic susceptibility in our specimens. The lithological ranks were distinguished by the χ values. Except for the sandy conglomerate (rank = 9) showing a normal distribution, all the other lithological ranks show skewed distributions. The χ distributions of mudstone (rank = 1), silty mudstone (rank = 2), fine sandstone (rank = 5), coarse sandstone (rank = 6), gravel-bearing fine sandstone and gravel-bearing coarse sandstone (rank = 7 and 8) are positively skewed, while the χ distributions of muddy siltstone and siltstone (rank = 3 and 4) and conglomerate (rank = 10) are negatively skewed (Figure 2A). This indicates that χ for all lithological ranks is fairly concentrated. Except for the outliers of lithological ranks of 7–10, fine mudstones has the highest χ values, coarse sandstones has the lowest (Figure 2B). This inverse correlation within the range of 1–6 proves that the χ data for the lacustrine faces of the lower K1sh Formation is a reliable and continuous proxy for the lithological ranks, and consequently for paleoenvironmental change.
The sedimentary facies of the investigated K1sh section can be determined as three major development phases (Figure 3): 1) The Subset 1 contains thick conglomerates with higher magnetic parameters over the dark grey mudstones in the bottom, indicating a fan-delta phase evolved from the lake phase due to the strong rifting in SB. 2) The Subset 2 is dominated by lake deposits, which exhibits a humid climate and a weak hydrodynamic environment, with a propensity for shallowing upward in the bottom portion and deepening upward in the upper part. 3) The Subset 3 begins with a minor tectonic activity, which is followed by a lake environment that is shallowing upward. Coal seam intercalations suggest a lake-swamp plain facies. Conglomerates and coarse sands are evidence of advancing fan-delta phases with a decline in base level and lake recession due to increased aridity. In contrast, an expanding lakeshore with a rise in base level and higher humidity produces fine sands, silts, muds, and coal.
The rock magnetic characteristics of the representative samples demonstrate the main magnetic carriers of the lower K1sh Formation are lower coercivity PSD ferrimagnetic magnetite particles and a small amount of high coercivity hematite (Figure 4). The fact that the χARM and SIRM series and the lake level are coherently fluctuating with χ series (Figures 3B–E) suggests that χ is dominated by fine-grained ferrimagnetic magnetite minerals and can be used for the paleoenvironmental changes reconstruction. Since only χ exhibits all astronomical periods on its power spectrum (Figure 6A), χ is ultimately selected as the proxy for the subsequent temporal calibration.
5.2 Astronomically forced paleoclimate and paleoenvironment changes in Early Cretaceous Songliao Basin
Lacustrine sediments provide ideal geologic materials for studying climate cycles caused by orbital forcing. It has been evidenced that Milankovitch cycles, particularly long and short eccentricity cycles can be widely detected in global lacustrine sedimentary records (Kent and Clemmensen, 1996; Kent and Olsen, 1999; Olsen et al., 2003; Wu et al., 2009; 2013a; 2014; Deenen et al., 2010; Li et al., 2017; Xu et al., 2019; Zhang et al., 2019; Du et al., 2020). Olsen et al. (2003) proposed that deep lake facies containing dark shales correspond to the maximum eccentricity in the Newark Basin, North America, while sub-aerial deposition of red mudstones was developed during the low eccentricity period. This agrees with the sedimentary model that the lacustrine/alluvial facies in the Green River Basin coincided with the maximum/minimum eccentricity periods, which was validated by Smith et al. (2010) and Aswasereelert et al. (2013).
Among the multi-proxies used in this study, χ is the best indicator, because it can detect the Milankovitch signals completely, continuously and accurately (Figures 5A, 6A). Two sets of Gaussian bandpass filters for long eccentricity (113 m) and short eccentricity (34 m) were applied to filter χ throughout the study interval (Figure 9A). Coal seams are typically matched with the maximum of short eccentricity cycle, while coarse-grained sediments are matched with the lowest value of long eccentricity cycles (Figure 9A). This proves that the presence of coarse clastic sediments such as sandstones is likely due to low lake level with low rainfall, which generated in the low eccentricity and low insolation periods. The coal deposition occurred during a period of high 105-kyr eccentricity, indicating that the sediment was developed under warm, humid, and vegetated environments with high precipitation and high lake level.
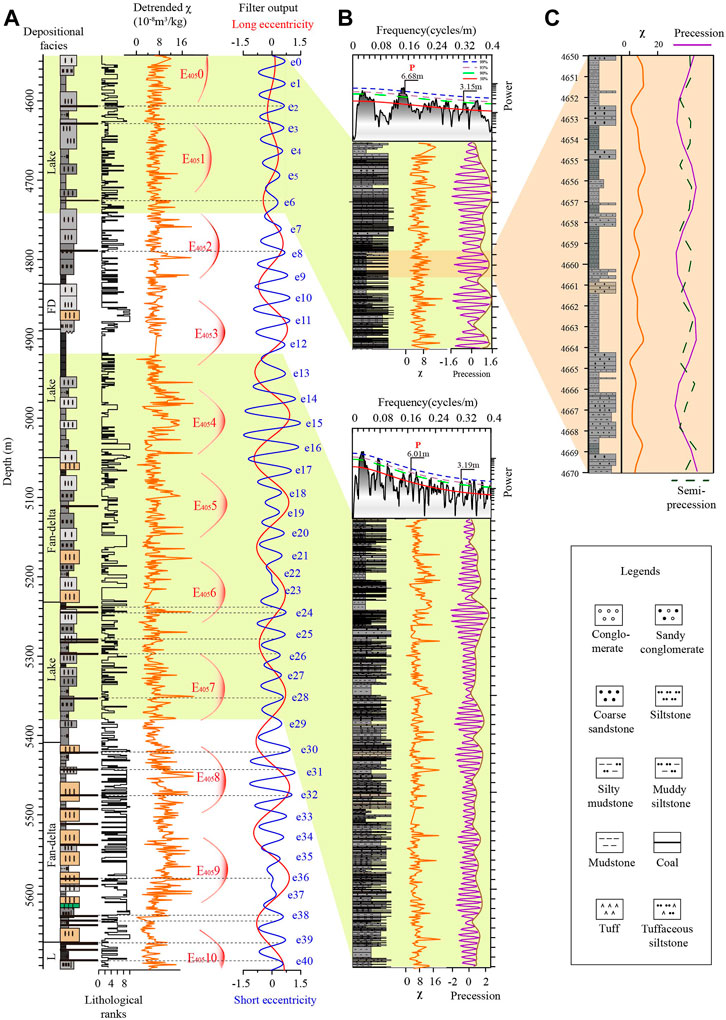
FIGURE 9. (A) Depositional facies, lithological ranks, and χ data in depth domain of the lower K1sh, with the interpreted 405-kyr and 100-kyr cyclic signals. The Gaussian bandpass filters set for the interpreted 405-kyr (red) and 105-kyr (blue) cycles were 0.009 ± 0.002 cycles/m and 0.035 ± 0.007 cycles/m, respectively. Red “E405” represents 405-kyr long eccentricity, blue “e” represents ∼105-kyr short eccentricity (B) Upper part: 2π MTM power spectrum and the precession signals in 4,542–4,740 m interval with its amplitude modulation, the interpreted precession cycles (purple) were extracted with a passband of 0.15 ± 0.007 cycles/m; lower part: 2π MTM power spectrum and the precession signals in 4,918–5,380 m interval with its amplitude modulation, precession cycles (purple) were extracted with a passband of 0.166 ± 0.003 cycles/m (C) The precession and semi-precession cycles of χ data of 4,650–4,670 m interval. Passband width of precession cycles (solid purple) was the same as (B), passband of 0.319 ± 0.003 cycles/m was applied to obtain the semi-precession cycles (dashed green). The yellow shades represent 4,542–4,740 m and 4,918–5,380 m intervals, the sand shades represent 4,650–4,670 m interval. Black dashed lines associate the coal seams with the 105-kyr filtering maximum.
Precession signals with wavelength of 6.68 m and 6.01 m are highly visible between ∼4,740–4,542 m and ∼5,380–4,918 m intervals, respectively (Figure 9B). The AM analyses indicate that ∼4-6 precession cycles were modulated by one envelope cycle, which is consistent with the 5:1 ratio of short eccentricity cycles to precession cycles (Figure 9B). This is in line with the depositional model in the Newark Basin, and suggest that the lake level is forced by precession cycles that is modulated by the short eccentricity cycles (Olsen et al., 2003; Kent et al., 2017), confirming the astronomic origin of the high frequency cycles found in the study interval.
High-resolution laminated interbedded sandstone-mudstone alterations are regularly cycled between 4,650 and 4,670 m in lake deposition facies (Figures 9B, C). This suggests that the seasonality controlled by precession influences summer precipitation and is supposed to be the main driving mechanism for lake level oscillation and paleoenvironment variations (Morrill et al., 2001). When the Earth moves to perihelion at the summer solstice for the Northern Hemisphere, the strong seasonality (i.e., hot summer and cool winter) increases rainfall in summer, which leads to a high lake level that favors mudstone deposition. Alternatively, the perihelion occurs at boreal winter solstice (i.e., aphelion occurs at boreal summer solstice), the weak seasonality favors the deposits of coarse clastic sediments in cool summer.
5.3 Possible origins of the semi-precession cycles
Litho-phase alternations combined with the precession and semi-precession signals (Figure 9C), untuned χ spectrum (Figures 6A, 9B), and tuned χ spectra (Figures 8B, C) all reveal the presence of semi-precession cycles in the interval studied. Semi-precession forcing of lacustrine deposition has already been demonstrated from the Late Triassic-Early Jurassic Newark Basin (Olsen and Kent, 1996) and the early Eocene Green River Basin, North America (Pietras et al., 2003). The semi-precession peaks observed in the 405-kyr and 105-kyr tuned χ spectra (Figures 8B, C) are not observed in the power spectrum of the La2004 solution (Figure 8A). It may indicate that the ∼10-kyr signals are non-linear climatic responses to the Milankovitch insolation forcing during this period. AM analysis was applied to the semi-precession signals derived from the 405-kyr tuned χ series to investigate the non-linear link between the interpreted semi-precession cycle and Milankovitch cycles (Figure 10C). The MTM power spectrum of the AM envelope curve reveals peaks at 23 kyr, 33 kyr, 47 kyr, 55 kyr, 68 kyr, 84 kyr, and 110 kyr (Figure 10E), indicating that precession, obliquity, and eccentricity cycles impacted the semi-precession cycles indirectly. Furthermore, we also performed AM envelope to the precession (Figure 10B) which is regarded as the modulator of semi-precession cycles. The MTM power spectrum of precession AM analysis curve demonstrates that the semi-precession cycles were additionally influenced by ∼400 kyr and ∼1 Myr long eccentricity cycles (Figure 10D).
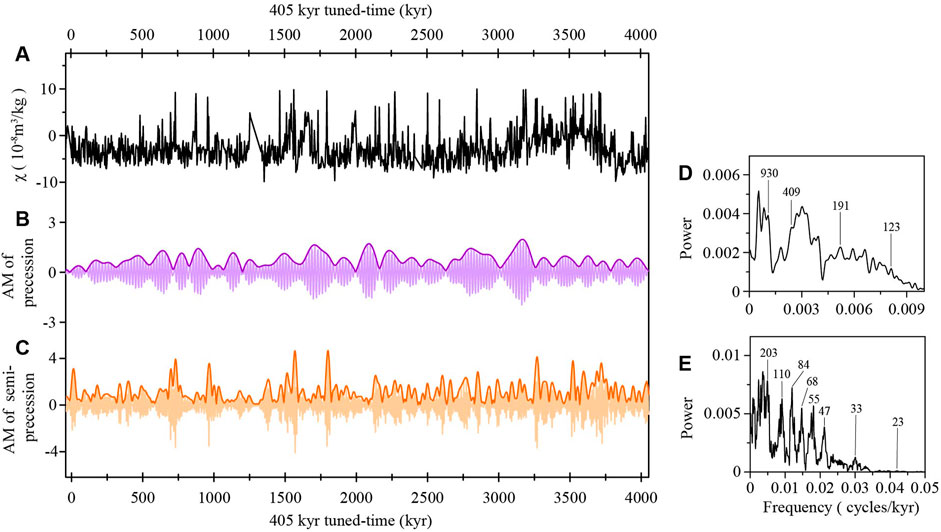
FIGURE 10. Amplitude modulations of the (C) semi-precession and (B) precession signals from the 405-kyr tuned χ series (A), and the corresponding 2π MTM spectra of the individual amplitude modulation curve (D, E).
It is well-known that semi-precession is a rather sensitive signal in tropical regions, which is modulated by precession, as the Sun passes the equator twice annually (Verschuren et al., 2009; Anderson, 2011; Ulfers et al., 2022). Monsoonal amplifications caused by the maximum summer insolation gradient in both hemispheres appear to be the origin of semi-precession forcing in low latitudes (Verschuren et al., 2009; De Vleeschouwer et al., 2012; Jian et al., 2020). However, SB located at the mid-latitudes of the Northern Hemisphere in the Early Cretaceous also captured the semi-precession signals. This supports the theory mentioned by previous research that the heat and energy advective processes play a considerable role in transferring this sub-Milankovitch signal from low latitudes to high latitudes (McIntyre et al., 1989; Short et al., 1991). This causes the tropical pattern to occur in the northern temperate paleoenvironment as well. The flux of magnetic material not only reaches its maximum during precession minima but also intensifies during precession maxima (De Vleeschouwer et al., 2012). Low summer insolation received for northern hemisphere when the Earth moves near perihelion at equinoxes weakens the corresponding rainy season (Berger et al., 2006; Verschuren et al., 2009). We speculate that teleconnections such as atmospheric circulation and ocean current dynamics can explain how this sub-Milankovitch cycle is transmitted from low to high latitudes (Berger and Loutre, 1991; Short et al., 1991; Hagelberg et al., 1994; Arz et al., 1998; Ulfers et al., 2022). Furthermore, the detailed mechanism of climate or whether the semi-precession force is the direct high-latitude reaction still needs more extensive geologic data and model simulation at various sites located at different latitudes.
6 Conclusion
(1) Low coercivity ferrimagnetic magnetite is the dominant magnetic mineral with the minor presence of hematite in sediments of the lower K1sh. Given the prominent relationship between lithological ranks and magnetic susceptibility, the mudstones have higher χ values than sandstones, the differences in magnetic concentrations in the sediments are most likely caused by variations in hydrodynamic conditions (e.g., changes in lake level) caused by climate change. Therefore, magnetic susceptibility can be used as an alternative and reliable proxy for cyclostratigraphic studies to reflect the changes in paleoenvironment and paleoclimate in the Early Cretaceous SB.
(2) Cyclostratigraphic study indicates that the sedimentation environment of the lower K1sh was forced by multiscale astronomical orbital parameters. It suggests that long and short eccentricity controlled the litho-facies, with coarse detrital sediments deposited during the minima of long eccentricity, and coal seams developing during the maximum of short eccentricity. Meanwhile, precession and semi-precession cycles were the potential factors affecting the lake level. In particular, the mudstone-sandstone alternations are most likely controlled by the semi-precession cycles.
(3) The duration of the 4542–5695 m interval of lower K1sh is estimated as 4,090 kyr–4,148 kyr, which is consistent with the radiometric range of 118.2–113.9 Ma, providing a basis for the future correlation of stratigraphic evolution and geological events between marine and land systems. The estimated sedimentary accumulation rate of ∼28 cm/kyr, may support an abundant supply of sediments to the lake basin during the K1sh deposition period.
Data availability statement
The original contributions presented in the study are included in the article/Supplementary Material, further inquiries can be directed to the corresponding author.
Author contributions
HW created the research. SZ measured the data and performed the analyses and modeling. SZ and HW wrote the manuscript. All authors contributed to data interpretation and made important contributions to the final publication.
Funding
This work was supported by the National Key R&D Program of China (Grant No. 2019YFC0605403), the National Natural Science Foundation of China (Grant Nos. 41790451, 41688103 and 41925010), and the 111 project (Grant No. B20011).
Acknowledgments
We sincerely appreciate the editor KPK and two reviewers for their constructive comments that significantly improved the manuscript. We are thankful to WH, RC, and QFG for their suggestions. We also thank XM, CR, HW, XC, YJ, and ZW for their help in the field.
Conflict of interest
The authors declare that the research was conducted in the absence of any commercial or financial relationships that could be construed as a potential conflict of interest.
Publisher’s note
All claims expressed in this article are solely those of the authors and do not necessarily represent those of their affiliated organizations, or those of the publisher, the editors and the reviewers. Any product that may be evaluated in this article, or claim that may be made by its manufacturer, is not guaranteed or endorsed by the publisher.
Supplementary material
The Supplementary Material for this article can be found online at: https://www.frontiersin.org/articles/10.3389/feart.2023.1077787/full#supplementary-material
References
Amiot, R., Wang, X., Zhou, Z., Wang, X. L., Buffetaut, E., Lecuyer, C., et al. (2011). Oxygen isotopes of East Asian dinosaurs reveal exceptionally cold Early Cretaceous climates. Proc. Natl. Acad. Sci. 108 (13), 5179–5183. doi:10.1073/pnas.1011369108
An, D. Z. (2018). Early Cretaceous Sedimentary records and provenance analysis of the upper member of Shahezi formation in Songliao Basin. M.S. thesis. Beijing: China University of Geosciences.
Anderson, R. Y. (2011). Enhanced climate variability in the tropics: A 200 000 yr annual record of monsoon variability from pangea's equator. Clim. Past. 7 (3), 757–770. doi:10.5194/cp-7-757-2011
Arz, H. W., Pätzold, J., and Wefer, G. (1998). Correlated millennial-scale changes in surface hydrography and terrigenous sediment yield inferred from last-glacial marine deposits off northeastern Brazil. Quat. Res. 50 (2), 157–166. doi:10.1006/qres.1998.1992
Aswasereelert, W., Meyers, S. R., Carroll, A. R., Peters, S. E., Smith, M. E., and Feigl, K. L. (2013). Basin-scale cyclostratigraphy of the Green River formation, Wyoming. GSA. Bull. 125 (1-2), 216–228. doi:10.1130/b30541.1
Berger, A., and Loutre, M. F. (1991). Insolation values for the climate of the last 10 million years. Quat. Sci. Rev. 10 (4), 297–317. doi:10.1016/0277-3791(91)90033-Q
Berger, A., Loutre, M. F., and Mélice, J. L. (2006). Equatorial insolation: From precession harmonics to eccentricity frequencies. Clim. Past. 2 (2), 131–136. doi:10.5194/cp-2-131-2006
Bloch, S., Dziewonski, A., and Landisman, M. (1969). A technique for the analysis of transient seismic signals. Bull. Seis. Soc. Am. 59, 427–444. doi:10.1785/bssa0590010427
Bloemendal, J., Lamb, B., and King, J. (1988). Paleoenvironmental implications of rock-magnetic properties of Late Quaternary sediment cores from the eastern equatorial Atlantic. Paleoceanography 3 (1), 61–87. doi:10.1029/PA003i001p00061
Boulila, S., de Rafélis, M., Hinnov, L. A., Gardin, S., Galbrun, B., and Collin, P. Y. (2010). Orbitally forced climate and sea-level changes in the Paleoceanic Tethyan domain (marl–limestone alternations, Lower Kimmeridgian, SE France). Palaeogeogr. Palaeocl. 292 (1-2), 57–70. doi:10.1016/j.palaeo.2010.03.026
Chamberlain, C. P., Wan, X. Q., Graham, S. A., Carroll, A. R., Doebbert, A. C., Sageman, B. B., et al. (2013). Stable isotopic evidence for climate and basin evolution of the Late Cretaceous Songliao basin, China. Palaeogeogr. Palaeocl. 385, 106–124. doi:10.1016/j.palaeo.2012.03.020
De Vleeschouwer, D., Da Silva, A. C., Boulvain, F., Crucifix, M., and Claeys, P. (2012). Precessional and half-precessional climate forcing of Mid-Devonian monsoon-like dynamics. Clim. Past. 8 (1), 337–351. doi:10.5194/cp-8-337-2012
Deenen, M. H. L., Ruhl, M., Bonis, N. R., Krijgsman, W., Kuerschner, W. M., Reitsma, M., et al. (2010). A new chronology for the end-Triassic mass extinction. Earth. Planet. Sc. Lett. 291 (1), 113–125. doi:10.1016/j.epsl.2010.01.003
Dekkers, M. J. (1997). Environmental magnetism: An introduction. Geol. En. Mijnb. 76 (1-2), 163–182. doi:10.1023/a:1003122305503
Du, W., Ji, Y. L., Chen, G., Wu, H., Gao, C. L., Li, S. M., et al. (2020). Cyclostratigraphy and astronomical tuning during the oligocene in the jizhong depression, bohai bay basin, northeastern China. Palaeogeogr. Palaeocl. 554, 109803. doi:10.1016/j.palaeo.2020.109803
Du, X. B., Xie, X. N., Lu, Y. C., Ren, J. Y., Zhang, S., Lang, P. L., et al. (2011). Distribution of continental red paleosols and their forming mechanisms in the late cretaceous Yaojia Formation of the Songliao Basin, NE China. Cretac. Res. 32 (2), 244–257. doi:10.1016/j.cretres.2010.12.010
Dunlop, D. J., and Özdemir, Ö. (1997). Rock magnetism fundamentals and Frontiers. Cambridge: Cambridge University Press.
Ellwood, B. B., Crick, R. E., Hassani, A. E., Benoist, S. L., and Young, R. H. (2000). Magnetosusceptibility event and cyclostratigraphy method applied to marine rocks: Detrital input versus carbonate productivity. Geology 282 (12), 1135–1138. doi:10.1130/0091-7613(2000)028<1135:meacma>2.3.co;2
Feng, Z. Q., Jia, C. Z., Xie, X. N., Zhang, S., Feng, Z. H., and Cross, T. A. (2010). Tectonostratigraphic units and stratigraphic sequences of the nonmarine Songliao basin, northeast China. Basin. Res. 22 (1), 79–95. doi:10.1111/j.1365-2117.2009.00445.x
Feng, Z. Q., Wang, C. S., Graham, S., Koeberl, C., Dong, H. L., Huang, Y. J., et al. (2013). Continental scientific drilling project of cretaceous Songliao Basin: Scientific objectives and drilling technology. Palaeogeogr. Palaeocl. 385, 6–16. doi:10.1016/j.palaeo.2012.03.016
Fu, W., Hou, H. S., Zhang, J. D., Liu, C., Feng, X., and Lu, Z. W. (2019). Structural characteristics of Shahezi Formation beneath the Well SK-2 and its periphery: An analysis of logging and seismic data. Geol. China 46, 1052–1060. doi:10.12029/gc20190507
Gao, R. Q., Qiao, X. Y., and He, C. Q. (1992). Cretaceous microphytoplankton from the Songliao Basin and its depositional environment. Acta. micr. Sin. 9, 111–126.
Gao, R. Q., Zhao, C. B., Qiao, X. Y., Zheng, Y. L., Yan, F. Y., and Wan, C. B. (1999a). Palynology of the cretaceous oil-bearing strata from Songliao Basin. Beijing: Geological Publishing House.
Gao, R. Q., Zhao, C. B., Qiao, X. Y., Zheng, Y. L., Yan, F. Y., and Wang, C. B. (1999b). Cretaceous oil strata palynology from Songliao Basin. Beijing: Geological Publishing House.
Gao, Y., Gao, Y. F., Ibarra, D. E., Du, X. J., Dong, T., Liu, Z. F., et al. (2021a). Clay mineralogical evidence for mid-latitude terrestrial climate change from the latest Cretaceous through the earliest Paleogene in the Songliao Basin, NE China. Cretac. Res. 124, 104827. doi:10.1016/j.cretres.2021.104827
Gao, Y., Ibarra, D. E., Caves Rugenstein, J. K., Chen, J. Q., Kukla, T., Methner, K., et al. (2021b). Terrestrial climate in mid-latitude East Asia from the latest cretaceous to the earliest paleogene: A multiproxy record from the Songliao Basin in northeastern China. Earth-Sci. Rev. 216, 103572. doi:10.1016/j.earscirev.2021.103572
Gao, Y., Ibarra, D. E., Wang, C., Caves, J. K., Chamberlain, C. P., Graham, S. A., et al. (2015). Mid-latitude terrestrial climate of East Asia linked to global climate in the Late Cretaceous. Geology 43 (4), 287–290. doi:10.1130/g36427.1
Gao, Y., Wang, C. S., Wang, P. J., Gao, Y. F., Huang, Y. J., and Zou, C. C. (2019). Progress on continental scientific drilling project of cretaceous Songliao Basin (SK-1 and SK-2). Sci. Bull. 64 (2), 73–75. doi:10.1016/j.scib.2018.12.017
Gutiérrez-Puente, N. A., Barragán, R., and Núñez-Useche, F. (2021). Paleoenvironmental changes and biotic response to AptianAlbian episodes of accelerated global change: Evidence from the Western margin of the proto-north atlantic (central-eastern Mexico). Cretac. Res. 126 (2021), 104883. doi:10.1016/j.cretres.2021.104883
Hagelberg, T. K., Bond, G., and deMenocal, P. (1994). Milankovitch band forcing of sub-Milankovitch climate variability during the Pleistocene. Paleoceanography 9 (4), 545–558. doi:10.1029/94PA00443
Harrison, R. J., and Feinberg, J. M. (2008). FORCinel: An improved algorithm for calculating first-order reversal curve distributions using locally weighted regression smoothing. Geochem. Geophy. Geosy. 9 (5), 1987. doi:10.1029/2008GC001987
Herrle, J. O., Schröder-Adams, C. J., Davis, W., Pugh, A. T., Galloway, J. M., and Fath, J. (2015). Mid-cretaceous high arctic stratigraphy, climate, and oceanic anoxic events. Geology 43 (5), 403–406. doi:10.1130/g36439.1
Heslop, D., Dekkers, M. J., Kruiver, P. P., and Van Oorschot, I. H. M. (2002). Analysis of isothermal remanent magnetization acquisition curves using the expectation–maximization algorithm. Geophys. J. Int. 148 (1), 58–64. doi:10.1046/j.0956-540x.2001.01558.x
Hou, H. S., Wang, C. S., Zhang, J. D., Ma, F., Fu, W., Wang, P. J., et al. (2018). Deep continental scientific drilling engineering project in Songliao Basin:progress in earth science researcha. Geol. China 45 (4), 641–657. doi:10.31035/cg2018036
Huang, Q. H., Wu, H. C., Wan, X. Q., He, H. Y., and Deng, C. L. (2011). New progress of integrated chronostratigraphy of the Cretaceous in Songliao basin. J. Stratigr. 35 (3), 250–257. doi:10.19839/j.cnki.dcxzz.2011.03.002
Jian, Z. M., Wang, Y., Dang, H. W., Lea, D. W., Liu, Z. Y., Jin, H. Y., et al. (2020). Half-precessional cycle of thermocline temperature in the Western equatorial Pacific and its bihemispheric dynamics. Proc. Natl. Acad. Sci. 117 (13), 7044–7051. doi:10.1073/pnas.1915510117
Kent, D. V., and Clemmensen, L. B. (1996). Paleomagnetism and cycle stratigraphy of the triassic fleming fjord and gipsdalen formations of East Greenland. Bull. Geol. Soc. Den. 142 (142), 121–136. doi:10.37570/bgsd-1995-42-11
Kent, D. V., and Olsen, P. E. (1999). Astronomically tuned geomagnetic polarity timescale for the Late Triassic. J. Geophys. Res. Sol. Earth 104 (B6), 12831–12841. doi:10.1029/1999JB900076
Kent, D. V., Olsen, P. E., and Muttoni, G. (2017). Astrochronostratigraphic polarity time scale (APTS) for the Late Triassic and Early Jurassic from continental sediments and correlation with standard marine stages. Earth-Sci. Rev. 166, 153–180. doi:10.1016/j.earscirev.2016.12.014
King, J. W., and Channell, J. E. T. (1991). Sedimentary magnetism, environmental magnestism and magnestostratigraphy. Rev. Geophys. 29, 358–370. doi:10.1002/rog.1991.29.s1.358
Kodama, K. P., Anastasio, D. J., Newton, M. L., Pares, J. M., and Hinnov, L. A. (2010). High-resolution rock magnetic cyclostratigraphy in an Eocene flysch, Spanish Pyrenees. Geochem. Geophy. Geosy. 11 (6), n/a. doi:10.1029/2010gc003069
Kruiver, P. P., Dekkers, M. J., and Heslop, D. (2001). Quantification of magnetic coercivity components by the analysis of acquisition curves of isothermal remanent magnetisation. Earth. Planet. Sc. Lett. 189 (3), 269–276. doi:10.1016/S0012-821X(01)00367-3
Laskar, J., Robutel, P., Joutel, F., Gastineau, M., Correia, A. C. M., and Levrard, B. (2004). A long term numerical solution for the insolation quantities of the Earth. Astron. Astrophys. 428 (1), 261–285. doi:10.1051/0004-6361:20041335
Latta, D. K., Anastasio, D. J., Hinnov, L. A., Elrick, M., and Kodama, K. P. (2006). Magnetic record of Milankovitch rhythms in lithologically noncyclic marine carbonates. Geology 34 (1), 29. doi:10.1130/g21918.1
Li, H. H. (2018). The study on stratigraphic sequence and sedimentary microfacies of the Shahezi Formation based on the long cores of the ICDP scientific drilling borehole in the Songliao Basin (SK-2). M.S. thesis. China: Jilin University.
Li, H. Y., and Zhang, S. H. (2005). Detection of mineralogical changes in pyrite using measurements of temperature-dependence susceptibilities. Chin. J. Geophys-Ch. 48 (6), 1454–1461. doi:10.1002/cjg2.794
Li, H. Y., Zhang, S. H., Wu, H. C., Zhao, K. L., Yang, T. S., and Zhao, L. (2013). Rock magnetic records of the Qingshankou Formation of SK-1 south borehole in Songliao Basin, Northeast China, and their paleoclimate implications. Palaeogeogr. Palaeocl. 385, 71–82. doi:10.1016/j.palaeo.2013.02.007
Li, M. S., Kump, L. R., Hinnov, L. A., and Mann, M. E. (2018). Tracking variable sedimentation rates and astronomical forcing in Phanerozoic paleoclimate proxy series with evolutionary correlation coefficients and hypothesis testing. Earth Planet. Sci. Lett. 501, 165–179. doi:10.1016/j.epsl.2018.08.041
Li, M. S., Zhang, Y., Huang, C. J., Ogg, J., Hinnov, L., Wang, Y. D., et al. (2017). Astronomical tuning and magnetostratigraphy of the upper triassic xujiahe Formation of south China and Newark supergroup of North America: Implications for the late triassic time scale. Earth. Planet. Sc. Lett. 475, 207–223. doi:10.1016/j.epsl.2017.07.015
Liu, H. B., Wang, P. J., Gao, Y. F., Hou, H. S., Yin, Y. K., Li, H. H., et al. (2020a). New data from ICDP borehole SK2 and its constraint on the beginning of the lower cretaceous Shahezi Formation in the Songliao Basin, NE China. Sci. Bull. 66, 411–413. doi:10.1016/j.scib.2020.12.002
Liu, Q. S., Roberts, A. P., Larrasoaña, J. C., Banerjee, S. K., Guyodo, Y., Tauxe, L., et al. (2012). Environmental magnetism: Principles and applications. Rev. Geophys. 50 (4), 393. doi:10.1029/2012RG000393
Liu, W., Wu, H. C., Hinnov, L. A., Baddouh, M. b., Wang, P. J., Gao, Y. F., et al. (2020b). An 11 million-year-long record of astronomically forced fluvial-alluvial deposition and paleoclimate change in the Early Cretaceous Songliao synrift basin, China. Palaeogeogr. Palaeocl. 541, 109555. doi:10.1016/j.palaeo.2019.109555
Matsumoto, H., Kuroda, J., Coccioni, R., Frontalini, F., Sakai, S., Ogawa, N. O., et al. (2020). Marine Os isotopic evidence for multiple volcanic episodes during Cretaceous Oceanic Anoxic Event 1b. Sci. Rep-UK. 10 (1), 12601. doi:10.1038/s41598-020-69505-x
McAnena, A., Flögel, S., Hofmann, P., Herrle, J. O., Griesand, A., Pross, J., et al. (2013). Atlantic cooling associated with a marine biotic crisis during the mid-Cretaceous period. Nat. Geosci. 6 (7), 558–561. doi:10.1038/ngeo1850
McIntyre, A., Ruddiman, W. F., Karlin, K., and Mix, A. C. (1989). Surface water response of the equatorial Atlantic Ocean to orbital forcing. Paleoceanography 4 (1), 19–55. doi:10.1029/PA004i001p00019
Meyers, S. R. (2014). Astrochron: An R package for astrochronology. Avaliable At: https://CRAN.R-project.org/package=astrochron.
Morrill, C., Small, E. E., and Sloan, L. C. (2001). Modeling orbital forcing of lake level change: Lake Gosiute (Eocene), North America. Glob. Planet. Change. 29 (1), 57–76. doi:10.1016/S0921-8181(00)00084-9
Mudelsee, M. (2014). Climate time series analysis: Classical statistical and bootstrap methods. Second ed. New York: Springer.
Okada, H. (2000). Nature and development of cretaceous sedimentary basins in East Asia: A review. Geosci. J. 4 (4), 271–282. doi:10.1007/BF02914036
Olsen, P. E., Kent, D. V., Et-Touhami, M., and Puffer, J. (2003). “Cyclo-, magneto-, and bio-stratigraphic constraints on the duration of the camp event and its relationship to the triassic-jurassic boundary,” in The central atlantic magmatic province: Insights from fragments of pangea (AGU), Washington, DC: Blackwell Publishing Ltd, 7–32. doi:10.1029/136GM02
Olsen, P. E., and Kent, D. V. (1996). Milankovitch climate forcing in the tropics of pangaea during the late triassic. Palaeogeogr. Palaeocl. 122 (1), 1–26. doi:10.1016/0031-0182(95)00171-9
Pei, F. P., Xu, W. L., Yang, D. B., Zhao, Q. G., Liu, X. M., and Hu, Z. C. (2007). Zircon U-Pb geochronology of basement metamorphic rocks in the Songliao Basin. Chin. Sci. Bull. 52 (7), 942–948. doi:10.1007/s11434-007-0107-2
Pietras, J. T., Carroll, A. R., Singer, B. S., and Smith, M. E. (2003). 10 k.y. depositional cyclicity in the early Eocene: Stratigraphic and 40Ar/39Ar evidence from the lacustrine Green River Formation. Geology 31 (7), 593–596. doi:10.1130/0091-7613(2003)031<0593:Kdcite>2.0.Co;2
Pucéat, E., Lécuyer, C., Sheppard, S. M. F., Dromart, G., Reboulet, S., and Grandjean, P. (2003). Thermal evolution of Cretaceous Tethyan marine waters inferred from oxygen isotope composition of fish tooth enamels. Paleoceanography 18 (2), 823. doi:10.1029/2002PA000823
Roberts, A. P., Pike, C. R., and Verosub, K. L. (2000). First-order reversal curve diagrams: A new tool for characterizing the magnetic properties of natural samples. J. Geophys. Res. Sol. Earth 105 (B12), 28461–28475. doi:10.1029/2000JB900326
Robertson, D. J., and France, D. E. (1994). Discrimination of remanence-carrying minerals in mixtures, using isothermal remanent magnetisation acquisition curves. Phys. Earth. Planet. In. 82 (3), 223–234. doi:10.1016/0031-9201(94)90074-4
Short, D. A., Mengel, J. G., Crowley, T. J., Hyde, W. T., and North, G. R. (1991). Filtering of milankovitch cycles by Earth's geography. Quat. Res. 35 (2), 157–173. doi:10.1016/0033-5894(91)90064-C
Shu, P., Ding, R. X., Ji, X. Y., and Qu, Y. M. (2007). SHRIMP zircon geochronology of reservoir volcanic rocks in the Qingshen gas field, Songliao Basin (in Chinese). Acta Petrologica Mineralogica 26 (3), 239–246.
Smith, M. E., Chamberlain, K. R., Singer, B. S., and Carroll, A. R. (2010). Eocene clocks agree: Coeval 40Ar/39Ar, U-Pb, and astronomical ages from the Green River formation. Geology 38 (6), 527–530. doi:10.1130/g30630.1
Thomson, D. J. (1982). Spectrum estimation and harmonic analysis. P. Ieee. 70 (9), 1055–1096. doi:10.1109/PROC.1982.12433
Ulfers, A., Zeeden, C., Voigt, S., Sardar Abadi, M., and Wonik, T. (2022). Half-precession signals in Lake Ohrid (Balkan) and their spatio-temporal relations to climate records from the European realm. Quat. Sci. Rev. 280, 107413. doi:10.1016/j.quascirev.2022.107413
Verosub, K. L., and Roberts, A. P. (1995). Environmental magnetism: Past, present, and future. J. Geophys. Res. 100, 2175–2192. doi:10.1029/94jb02713
Verschuren, D., Sinninghe Damsté, J. S., Moernaut, J., Kristen, I., Blaauw, M., Fagot, M., et al. (2009). Half-precessional dynamics of monsoon rainfall near the East African Equator. Nature 462 (7273), 637–641. doi:10.1038/nature08520
Wang, C. S., Feng, Z. Q., Zhang, L. M., Huang, Y. J., Cao, K., Wang, P. J., et al. (2013). Cretaceous paleogeography and paleoclimate and the setting of SKI borehole sites in Songliao Basin, northeast China. Palaeogeogr. Palaeocl. 385, 17–30. doi:10.1016/j.palaeo.2012.01.030
Wang, D. P., Liu, Z. J., Zhang, L. P., and Lv, C. J. (1995). The palaeoclimate, depositional Cycle and sequence Stratigraphy of Songliao Basin Jilin (in Chinese). China: Jilin University Press.
Wang, P. J., Liu, H. B., Ren, Y. G., Wan, X. Q., Wang, S. X., Qu, X. J., et al. (2017a). How to choose a right drilling site for the ICDP cretaceous continental scientific drilling in the Songliao Basin (SK2), northeast China. Earth. Sci. Front. 24 (1), 216–228. doi:10.13745/j.esf.2017.01.014
Wang, P. J., Liu, W. Z., Wang, S. X., and Song, W. H. (2002). 40Ar/39Ar and K/Ar dating on the volcanic rocks in the Songliao basin, NE China: Constraints on stratigraphy and basin dynamics. Int. J. Earth. Sci. 91 (2), 331–340. doi:10.1007/s005310100219
Wang, P. J., Mattern, F., Didenko, N. A., Zhu, D. F., Singer, B., and Sun, X. M. (2016). Tectonics and cycle system of the Cretaceous Songliao Basin: An inverted active continental margin basin. Earth-Sci. Rev. 159, 82–102. doi:10.1016/j.earscirev.2016.05.004
Wang, P. J., Xie, X. A., Mattern, F., Ren, Y. G., Zhu, D. F., and Sun, X. M. (2007). The cretaceous Songliao Basin: Volcanogenic succession, sedimentary sequence and tectonic evolution, NE China. Acta. Geol. Sin-EngL. 81 (6), 1002–1011. doi:10.1111/j.1755-6724.2007.tb01022.x
Wang, P. J., Zhao, R. L., Meng, Q. A., Qu, X. J., Zhu, D. F., and Gao, Y. F. (2015). The Cretaceous Songliao Basin: Dynamic background from volcanic rift to interior sag basin. Earth. Sci. Front. 22 (3), 99–117. doi:10.13745/j.esf.2015.03.009
Wang, T. T., Wang, C. S., Ramezani, J., Wan, X. Q., Yu, Z. Q., Gao, Y. F., et al. (2022). High-precision geochronology of the early cretaceous Yingcheng Formation and its stratigraphic implications for Songliao Basin, China. Geosci. Front. 13 (4), 101386. doi:10.1016/j.gsf.2022.101386
Wang, Y. D., Tian, N., Jiang, Z. K., Yang, X. J., and Ding, Q. H. (2017b). Recent advances in mesozoic fossil wood studies in China: Diversity variations and palaeoclimate implications. Earth. Sci. Front. 24 (1), 52–64. doi:10.13745/j.esf.2017.01.004
Wang, Y., Zhang, F. Q., Zhang, D. W., Miao, L. C., Li, T. S., Xie, H. Q., et al. (2006). Zircon SHRIMP U-Pb dating of meta-diorite from the basement of the Songliao Basin and its geological significance. Chin. Sci. Bull. 51 (15), 1877–1883. doi:10.1007/s11434-006-2035-y
Weedon, G. (2003). Time-series analysis and cyclostratigraphy. Cambridge: Cambridge University Press.
Wu, H. C., Hinnov, L. A., Zhang, S. H., Jiang, G. Q., Yang, T. S., Li, H. Y., et al. (2022). Continental geological evidence for solar system chaotic behavior in the late cretaceous. GSA. Bull. doi:10.1130/b36340.1
Wu, H. C., Zhang, S. H., Feng, Q. L., Jiang, G. Q., Li, H. Y., and Yang, T. S. (2012). Milankovitch and sub-Milankovitch cycles of the early Triassic Daye Formation, South China and their geochronological and paleoclimatic implications. Gondwana. Res. 22 (2), 748–759. doi:10.1016/j.gr.2011.12.003
Wu, H. C., Zhang, S. H., Hinnov, L. A., Jiang, G. Q., Yang, T. S., Li, H. Y., et al. (2014). Cyclostratigraphy and orbital tuning of the terrestrial upper santonian–lower danian in Songliao Basin, northeastern China. Earth. Planet. Sc. Lett. 407, 82–95. doi:10.1016/j.epsl.2014.09.038
Wu, H. C., Zhang, S. H., Jiang, G. Q., Hinnov, L., Yang, T. S., Li, H. Y., et al. (2013a). Astrochronology of the early turonian–early campanian terrestrial succession in the Songliao Basin, northeastern China and its implication for long-period behavior of the solar system. Palaeogeogr. Palaeocl. 385, 55–70. doi:10.1016/j.palaeo.2012.09.004
Wu, H. C., Zhang, S. H., Jiang, G. Q., and Huang, Q. H. (2009). The floating astronomical time scale for the terrestrial Late Cretaceous Qingshankou Formation from the Songliao Basin of Northeast China and its stratigraphic and paleoclimate implications. Earth. Planet. Sc. Lett. 278 (3-4), 308–323. doi:10.1016/j.epsl.2008.12.016
Wu, H. C., Zhang, S. H., Jiang, G. Q., Yang, T. S., Guo, J. H., and Li, H. Y. (2013b). Astrochronology for the early cretaceous jehol biota in northeastern China. Palaeogeogr. Palaeocl. 385, 221–228. doi:10.1016/j.palaeo.2013.05.017
Xu, K., Chen, H. H., Huang, C. J., Ogg, J. G., Zhu, J. X., Lin, S. Q., et al. (2019). Astronomical time scale of the Paleogene lacustrine paleoclimate record from the Nanxiang Basin, central China. Palaeogeogr. Palaeocl. 532, 109253. doi:10.1016/j.palaeo.2019.109253
Xu, X. T., Shao, L. Y., Eriksson, K. A., Pang, B., Wang, S., Yang, C. X., et al. (2022). Terrestrial records of the early albian ocean anoxic event: Evidence from the fuxin lacustrine basin, NE China. Geosci. Front. 13 (1), 101275. doi:10.1016/j.gsf.2021.101275
Yang, W. B., Niu, H. C., Sun, W. D., Shan, Q., Zheng, Y. F., Li, N. B., et al. (2013). Isotopic evidence for continental ice sheet in mid-latitude region in the supergreenhouse Early Cretaceous. Sci. Rep. 3, 2732. doi:10.1038/srep02732
Yu, Z. Q., He, H. Y., Deng, C. L., Lu, K., Shen, Z. S., and Li, Q. L. (2020). New SIMS U-Pb geochronology for the Shahezi Formation from CCSD-SK-IIe borehole in the Songliao Basin, NE China. Sci. Bull. 65 (13), 1049–1051. doi:10.1016/j.scib.2020.03.039
Zhang, L., Bao, Z. D., Dou, L. X., Wang, H. J., and Ji, Y. (2018). New discovery of red paleosols with calcite and zeolitic rhizoliths in the late cretaceous Yaojia formation, southern Songliao Basin, NE China. Acta. Geol. Sin-EngL. 92 (6), 2462–2463. doi:10.1111/1755-6724.13750
Zhang, Q., Liu, Q. S., and Sun, Y. B. (2020). Review of recent developments in aeolian dust signals of sediments from the North Pacific Ocean based on magnetic minerals. Geol. Mag. 157 (5), 790–805. doi:10.1017/S0016756819000712
Zhang, R., Jin, Z. J., Liu, Q. Y., Li, P., Huang, Z. K., Shi, J. Y., et al. (2019). Astronomical constraints on deposition of the Middle triassic chang 7 lacustrine shales in the ordos basin, central China. Palaeogeogr. Palaeocl. 528, 87–98. doi:10.1016/j.palaeo.2019.04.030
Zhang, X. Z., Qiao, D. W., Chi, X. G., Zhou, J. B., Sun, Y. W., Zhang, F. X., et al. (2011). Late Paleozoic tectonic evolution and oil-gas potentiality in northeastern China (in Chinese). Geol. Bull. China. 30 (2), 205–213. doi:10.3969/j.issn.1671-2552.2011.02.004
Zhou, J. B., Zhang, X. Z., Ma, Z. H., Liu, L., Jin, W., Zhang, M. S., et al. (2009). Tectonic framework and basin evolution in Northeast China. Oil .Gas. Geol. 30 (5), 530–538. doi:10.11743/ogg20090502
Zhu, R. X., Shi, C. D., Suchy, V., Zeman, A., Guo, B., and Pan, Y. (2001). Magnetic properties and paleoclimatic implications of loess-paleosol sequences of Czech Republic. Sci. China. Ser. D. 44 (5), 385–394. doi:10.1007/BF02909777
Keywords: Early Cretaceous, lower Shahezi Formation, Songliao Basin, environmental magnetism, cyclostratigraphy, lacustrine sediments
Citation: Zhang S, Wu H, Zhang S, Yang T, Li H, Fang Q and Shi M (2023) Hierarchical Milankovitch and sub-Milankovitch cycles in the environmental magnetism of the lower Shahezi Formation, Lower Cretaceous, Songliao Basin, northeastern China. Front. Earth Sci. 11:1077787. doi: 10.3389/feart.2023.1077787
Received: 23 October 2022; Accepted: 06 February 2023;
Published: 20 February 2023.
Edited by:
Kenneth Philip Kodama, Lehigh University, United StatesReviewed by:
Zhaoxia Jiang, Ocean University of China, ChinaDaniel R. Franco, National Observatory, Brazil
Copyright © 2023 Zhang, Wu, Zhang, Yang, Li, Fang and Shi. This is an open-access article distributed under the terms of the Creative Commons Attribution License (CC BY). The use, distribution or reproduction in other forums is permitted, provided the original author(s) and the copyright owner(s) are credited and that the original publication in this journal is cited, in accordance with accepted academic practice. No use, distribution or reproduction is permitted which does not comply with these terms.
*Correspondence: Huaichun Wu, d2hjZ2VvQGN1Z2IuZWR1LmNu