 Christoph Kern
 Peter J. Kelly
- United States Geological Survey, Volcano Science Center, Vancouver, WA, United States
Gas emissions from volcanoes occur when volatile species exsolve from magmatic and hydrothermal systems and make their way to the surface. Measurements of emitted gases therefore provide insights into volcanic processes. On 16 July 2021, we made airborne measurements of weak gas plumes emitted from four remote Alaska volcanoes: Iliamna Volcano, Mount Douglas, Mount Martin, and Mount Mageik. Integrated into a small fixed-wing aircraft, a new Imaging Differential Optical Absorption Spectroscopy (DOAS) instrument was used to map the spatial extent of SO2 plumes as they drifted downwind. Contrary to conventional Mobile DOAS instruments, which provide only a single viewing direction, the Imaging DOAS simultaneously measures SO2 column density along 48 individual viewing directions oriented in a swath above or below the aircraft. Each of the individual measurements have a comparable precision and sensitivity to those obtained by conventional instruments. Together, they provide high resolution 2D imagery of the volcanic plumes and allow calculation of limited emission rate time series information. Although zenith-facing DOAS measurements achieve greater accuracy and are performed here, the application of the Imaging DOAS in a nadir-facing setup is also discussed and compared to satellite observations made in similar geometries. Also onboard the aircraft, a suite of electrochemical and optical sensors measured the relative abundances of the six major volcanic volatile species H2O, CO2, SO2, H2S, HCl, and HF as the aircraft passed through the plumes. Mean SO2 emission rates of 90 ± 10, 20 ± 3, and 13 ± 3 t/d were measured at Iliamna Volcano, Mount Douglas, and Mount Martin, respectively. SO2 emissions were below the DOAS detection limit at Mount Mageik but CO2 and H2S could be measured with the in situ sensors. The information gleaned from these measurements was used to assess and compare activity at these volcanoes, all of which were found to be in a state of background degassing but whose emissions pointed to different source conditions ranging from mixed magmatic-hydrothermal to purely hydrothermal in character. Additional measurements at Mount Spurr, Redoubt Volcano, and Augustine Volcano failed to detect the very weak gas concentrations downwind of these persistently degassing vents.
Introduction
The state of Alaska is home to more than 130 volcanoes and volcanic fields, 54 of which have been active since 1700 CE (Cameron et al., 2022a), and hardly a year passes without an eruption (Cameron et al., 2022b). Most of these volcanoes are located along the Alaska-Aleutian arc where the northward-moving Pacific Plate is pushed beneath the North American Plate at a rate of ∼6 cm per year (Syracuse and Abers, 2006). Although most of these volcanoes are in relatively remote locations, they can still pose significant hazards to aviation. More than 60,000 passengers can be expected to be traveling on commercial aircraft in the airspace downwind of Alaska’s active volcanoes on a daily basis (Ewert et al., 2018). Explosive volcanic eruptions can produce ash clouds that, if flown through by jet aircraft, can cause engine damage or failure. Eruptions from volcanoes in the Cook Inlet (Mount Spurr, Redoubt Volcano, Iliamna Volcano, and Augustine Volcano) can have the most severe impacts as these are nearest to Anchorage, Alaska’s largest population center and a major cargo airport hub (Figure 1). For example, a series of eruptions from Redoubt Volcano in 1989–1990 caused airport closures and airline cancellations in Anchorage and on the Kenai Peninsula (Casadevall, 1994), and disrupted air traffic as far away as Texas. Just 2 years later, in 1992, three eruptions of Mount Spurr’s Crater Peak closed the Anchorage airport again and disrupted air traffic as far east as the eastern United States and Canada (Keith, 1995).
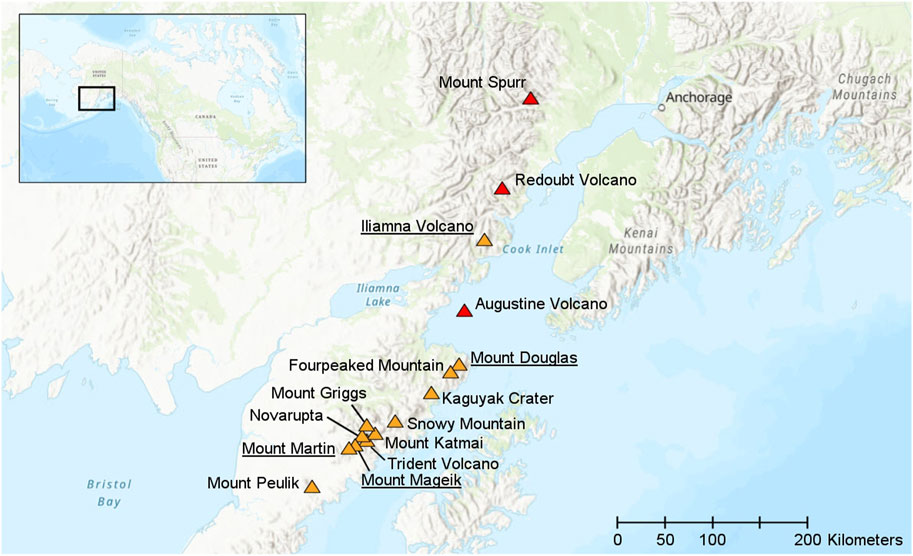
FIGURE 1. “High” (orange) and “Very High” (red) threat volcanoes of the Cook Inlet and northern Alaska Peninsula. Underlined names indicate volcanoes at which gas plumes could be detected on 16 July 2021 using our airborne gas monitoring instrumentation. Threat ranking according to Ewert et al. (2018). Base map from Esri (2022) and its licensors.
Due to these potential hazards, the United States Geological Survey’s (USGS) Alaska Volcano Observatory (AVO) is tasked with monitoring Alaska’s active volcanoes and providing timely information about volcanic activity to stakeholders and the public at large. For this purpose, AVO maintains a network of visual, geophysical, and geodetic monitoring instrumentation on many of the most active volcanoes in the region. However, the harsh environmental conditions and remote nature of many of the volcanoes make maintaining permanent monitoring infrastructure extremely challenging. AVO therefore relies heavily on campaign-type measurements and satellite remote sensing data to compliment observations from sensors on the ground and produce reliable information on volcanic events (Poland et al., 2020). Information on volcanic degassing, in particular, is currently obtained almost entirely through remote sensing observations or manual ground-based or airborne surveys, though efforts are underway to install limited continuous geochemical monitoring on volcanoes where such data are deemed particularly important for eruption forecasting and detection.
Anomalous gas emissions are often the first indicators of volcanic unrest, particularly at “open system” volcanoes at which volatiles exsolved from magma at depth can travel independently to the surface and degas to the atmosphere. Notable examples include the order-of-magnitude increase in sulfur dioxide (SO2) emissions weeks before the 2005 eruption of Santa Ana volcano, El Salvador (Olmos et al., 2007), the anomalous carbon dioxide (CO2) degassing identified ∼6 months prior to the 2009 eruption of Redoubt Volcano, Alaska (Werner et al., 2013), and the increase in CO2 degassing observed weeks to months before the deadly 2019 paroxysms at the ordinarily benign Stromboli volcano, Italy (Aiuppa et al., 2021). Pre-eruptive degassing occurs when magma ascends in a volcanic system, leading to a decrease in pressure and partitioning of dissolved volatile species to a separate fluid phase that can move upward toward the surface (Edmonds and Wallace, 2017). In such cases, the rate at which gases are emitted to the atmosphere, typically given in kg/s or metric tons per day (t/d), tracks the volume of rising magma to first order. Because volatile species have vastly different solubilities in melt, their exsolution occurs at different pressures/depths, with CO2 typically being the first to exsolve at depths >10 km (Wallace et al., 2015), followed by sulfur and water vapor as the magma moves closer to the surface (Edmonds and Wallace, 2017; Werner C. et al., 2020). The relative abundance of these species in volcanic gas emissions therefore provides information on the depth from which they originate (Aiuppa et al., 2007; Burton et al., 2007; de Moor et al., 2016; Werner C. et al., 2020).
Due to their diagnostic utility, volcano observatories are increasingly interested in tracking volcanic gas emission rates and chemical compositions over time (Kern et al., 2022). In some cases, this is accomplished with geochemical monitoring stations permanently installed on active volcanoes. The most common continuous gas monitoring instruments are Scanning Differential Optical Absorption Spectrometers (Scanning DOAS, Galle et al., 2010; Arellano et al., 2021), which measure the SO2 emission rate, and multi-GAS instruments (Aiuppa et al., 2005; Shinohara, 2005), which measure the relative abundance of the major volcanic gas species (H2O, CO2, SO2, and H2S). However, these instruments provide only limited spatial information, making it difficult to study processes like plume heterogeneity, dynamics, or chemical evolution. Additional spatial information can be obtained by mounting DOAS or multi-GAS instruments on mobile platforms such as vehicles or aircraft, but even then, the instruments only provide information at a single location at a given time. Relatively novel SO2 camera technology (Mori and Burton, 2006; Bluth et al., 2007) now allows acquisition of 2D imagery of gas plumes from stationary instruments, thus providing insights into SO2 distributions in the atmosphere. However, these instruments can only measure SO2 and have not been proven to work well on moving platforms.
In this study, we aim to improve the ability to obtain spatially resolved measurements of volcanic gases by introducing a novel Imaging DOAS instrument designed for airborne surveys. As we show in the following sections, this instrument can provide 2D imagery of gas plumes from moving platforms while also capturing the full, moderate-resolution (<1 nm) spectral information required for measuring multiple gas species at high sensitivity.
Materials and methods
A new airborne Imaging DOAS instrument
Measurement principle
Since its first application to volcanic gases approximately 20 years ago (Galle et al., 2002; Edmonds et al., 2003), DOAS has become a standard technique for quantifying SO2 emission rates from volcanoes. DOAS instruments measure the absorption of ultraviolet (UV) radiation by SO2 and, in certain cases, some other plume constituents [e.g., bromine monoxide (BrO), chlorine dioxide (OClO), iodine monoxide (IO), and water vapor (H2O)] (Galle et al., 2002; Bobrowski et al., 2003; Bobrowski et al., 2007; Kern et al., 2017; Schönhardt et al., 2017). By selectively measuring the narrow-band absorbance related to known ro-vibronic transitions of trace gas molecules in the light path, the measurements yield trace gas column densities (Platt and Stutz, 2008). These are typically given in molecules/cm2, ppmm, or for satellite remote sensing observations, Dobson Units (DU, 1 DU = 2.69⋅1016 molecules/cm2).
Most DOAS observations of volcanic plumes use sunlight scattered in the atmosphere as their light source. This affords great flexibility with regards to measurement geometry, as instruments can be aimed in practically any viewing direction and measure the slant column density (SCD, typically given in molecules/cm2) along the line-of-sight. In contrast to in situ measurements that measure trace gas concentrations at a single point in space, the integrative nature of the DOAS measurements allows derivation of emission rates. The SO2 burden in a cross-section of a volcanic plume can be determined by passing the instrument along a traverse above or below the plume, or by scanning through the plume from a fixed location. Multiplication of this burden with the wind speed at plume height then yields the emission rate (Galle et al., 2002; Kern, 2009; Galle et al., 2010).
While conventional DOAS instruments measure the trace gas column density along a single, narrow field of view, Imaging DOAS instruments can provide multi-dimensional images of gas distributions in the atmosphere (Lohberger et al., 2004; Bobrowski et al., 2006; Louban et al., 2009). In the “push-broom” imaging technique, light is coupled into a spectrometer with a 2D detector. While one detector dimension measures the spectrum of incident radiation, the other detector dimension allows multiple spatial pixels to be measured at the same time. In this manner, trace gas column densities along an entire swath of the atmosphere can be measured simultaneously. This swath can then be scanned across an area of interest (e.g., a volcanic plume), thus providing a 2D image of the trace gas column density distribution (Platt et al., 2014). Often used for imaging volcanic gas plumes from space, the Ozone Monitoring Instrument (OMI) and the Tropospheric Monitoring Instrument (TROPOMI) both use the same push-broom technique to capture 2D imagery from low-Earth orbit.
Integration into the AVO airborne gas laboratory
For this study, we implemented an Imaging DOAS system based on a Teledyne Princeton Instruments FERGIE spectrometer (Figure 2). The FERGIE instrument features a variant of a Czerny-Turner spectrograph with an 80.8 mm focal length modified to correct for spherical and field astigmatism (McClure, 2013; McClure, 2014). The spectrograph’s entrance plane is mapped onto a 2D cooled, back-illuminated CCD detector with 256 × 1024 (row × column) pixels. Blazed for maximum efficiency at 300 nm, an echelette grating with 1200 grooves/mm provides diffraction along the detector’s horizontal dimension. Mounted on a rotary stage, the grating can be turned to adjust the captured wavelength range. In the measurements presented here, we recorded the 266–403 nm region. Light is coupled into the system through a fiber bundle with 48 individual fused silica fibers, each with a 50 μm diameter (+10 μm cladding) aligned in a sorted, linear array on either end. One end of the fiber bundle is positioned in the entrance plane of the spectrograph and thus the fiber array itself emulates a 50 μm entrance slit. In this configuration, the spectrometer achieves a spectral resolution of 0.45 nm throughout the detector plane. The other end of the fiber bundle is positioned in the focal plane of a wide-angle object lens with an effective focal length of feff = 6 mm which thereby collects radiation from a swath of 27.2-degree width.
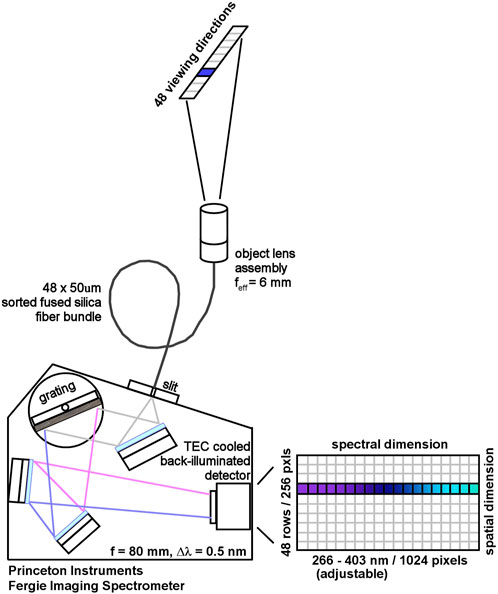
FIGURE 2. Optical design of the airborne Imaging DOAS instrument integrated into the Alaska Volcano Observatory airborne gas laboratory. Scattered sunlight is collected by an object lens assembly and coupled into a linear fiber bundle. The sorted fiber bundle transfers the light into the aircraft and ends in the focal plane of the imaging spectrometer. An adjustable dispersion grating maps the ultraviolet spectrum onto the horizontal dimension of a two-dimensional back-illuminated detector. The spatial swath collected with the fiber bundle is mapped onto the vertical dimension of the detector. The aircraft’s motion scans the swath across the sky, thus providing the second spatial dimension of the imagery (see Figure 5).
The Imaging DOAS was developed in a modular design such that it could easily be installed into various aircraft. For the measurements presented here, we integrated the system into the AVO airborne gas laboratory on board a Cessna Conquest twin-engine aircraft (Figure 3A). For this purpose, an emergency exit door over the starboard wing was modified such that two C-mount telescopes could be mounted in zenith-facing direction adjacent to one another. One of these mounts held the Imaging DOAS wide-angle telescope while the other held a standard, f = 30 mm narrow-beam telescope running to a conventional DOAS instrument used for comparison (see the Supplementary Material for a complete description of the conventional DOAS). Two additional small holes beneath the optical mounts allowed optical fibers attached to the telescopes to enter the aircraft.
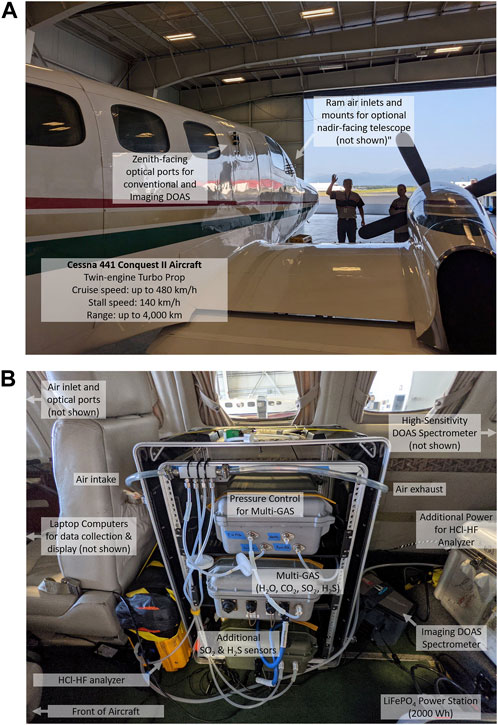
FIGURE 3. The AVO airborne gas lab pictured on board a Cessna Conquest aircraft in July 2021. (A) While circling a volcano at speeds of ∼180 km/h, forward-facing metal inlets at the front of the aircraft divert ram-air into tubing leading to the in situ sensors inside. Farther back, two zenith-facing ports allow integration of C-Mount optical ports, in this case a conventional DOAS telescope and the Imaging DOAS object lens assembly. (B) Inside the aircraft, the in situ gas sensors actively pull air off the ram air manifold. The Imaging DOAS Spectrometer is strapped to the floor just aft of the in situ rack assembly. A fused-silica fiber bundle transmits light in from the external optical port. A second, high-sensitivity DOAS spectrometer is located just off the photo to the right (aft). Photos by Christoph Kern, USGS.
Inside the airplane, the Imaging DOAS was positioned just aft of the sensor package used for measuring plume composition in situ (Figure 3B). For this initial survey, the FERGIE spectrometer was simply strapped to the floor of the aircraft, with the carpeted interior providing some vibration dampening. The required 80 W (maximum) of electrical power were provided by a 2,000 Wh LiFePO4 power station with integrated circuit protection. Data acquisition was performed with a laptop computer running a custom MATLAB application. The spectrometer was set to continuous acquisition mode in which successive CCD images (Figure 4) are acquired with a fixed exposure time (typically 1–2 s) and cached onboard. Using the MATLAB program, the operator can request cached imagery be downloaded to the laptop at the push of a button while the aircraft is not transecting the gas plume. The download occurs through a USB3.0 interface and can take several 10 s of seconds, depending on how much imagery was cached since the last download. Once the download is complete, the illumination conditions are assessed, and the next measurement sequence is automatically initialized with an appropriate exposure time.
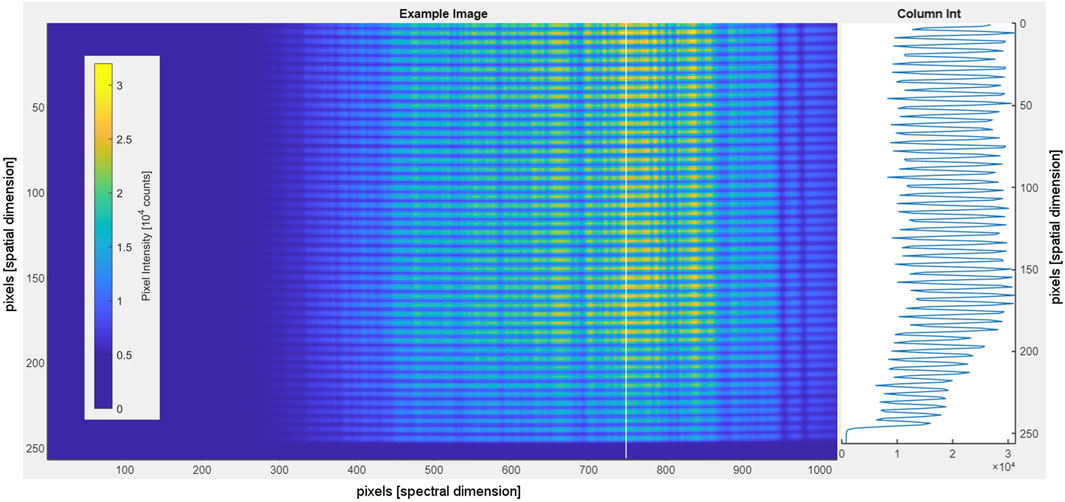
FIGURE 4. Example multispectral image recorded with the airborne Imaging DOAS. Each of the 48 fibers in the bundle produces a spectrum, which is mapped horizontally on the detector. Areas between fibers (cladding) appear as dark rows. The intensity along the white vertical line is plotted at right (in detector counts).
Installed in this manner, the Imaging DOAS instrument measured scattered solar radiation originating from a 27.2-deg swath of sky above the aircraft (Figure 5). The motion of the aircraft then scans this swath across the sky, thus generating 2D images of the overhead trace-gas column densities. The along-track spatial resolution of the images depends on the utilized exposure times, which in turn depend on the lighting conditions. In this study, spectra were recorded at approximately 0.5–1 Hz, which, when combined with the aircraft’s flight speed of approximately 50 m/s (180 km/h) during observation segments, leads to an along-track resolution of 50–100 m. The cross-track resolution depends on the distance between the aircraft and the gas plume, with the pixel width increasing by about 10 m per km plume distance. In this study, our cross-track pixel length was generally around 10–20 m, with the exact size varying with plume and flight altitude.
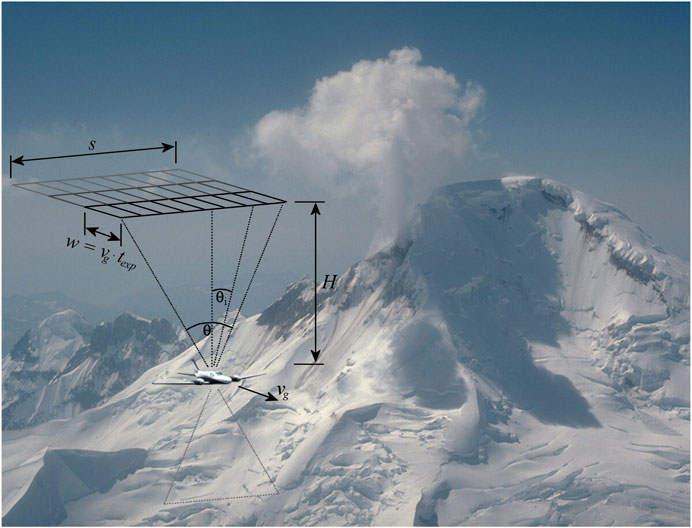
FIGURE 5. Schematic of push-broom imaging DOAS observations performed with a fixed-wing aircraft flying beneath a volcanic gas plume. The swath angle θ is fixed at 27.2 deg. The swath width s thus depends on the distance H between the aircraft and the gas plume. The swath is divided into 48 pixels, corresponding to the 48 fibers in the fiber bundle. The spatial resolution in the flight direction is given by the product of the aircraft’s ground speed vg and the Imaging DOAS exposure time texp (Schönhardt et al., 2015). Indicated in gray, additional optical ports allow nadir-facing observations, but this geometry was not used in the measurements presented here. Photograph of 1986 activity at Iliamna Volcano by R.G. McGimsey, USGS.
Spectral retrieval
Analysis of the recorded Imaging DOAS data first requires a spectral retrieval in which trace gas column densities are derived from the measured radiance spectra. First, we split each recorded 2D CCD image into 48 individual spectra by binning adjacent detector rows such that pixels collecting light from an individual fiber in the linear bundle are combined. This process generates 48 spectra for each acquisition, with each spectrum corresponding to a different viewing angle. While we found the optical resolution and instrument line shape to be remarkably constant and independent of the position on the CCD detector, imperfect alignment of the fiber bundle at the entrance of the spectrometer did lead to a slight variation in the pixel-wavelength calibration between different viewing angles. We therefore treated each of the 48 viewing directions separately in the spectral retrieval, only comparing spectra recorded in a specific viewing direction with others from the same direction.
The spectral retrieval itself follows the standard DOAS methodology (Platt and Stutz, 2008): Each measurement spectrum is corrected for stray light by subtracting the average intensity recorded at wavelengths shorter than 300 nm where the stratospheric ozone (O3) blocks radiation. Then the logarithm is taken. Next, a non-linear least-squares fit is used to fit a model spectrum to the measurement. The model spectrum consists of a linear combination of the logarithm of a clear-sky reference spectrum recorded away from the volcanic gas plume, the trace gas absorption cross-sections of SO2 and ozone (O3) (Bogumil et al., 2003; Vandaele et al., 2009), a Ring correction spectrum to account for the effect of inelastic Raman scattering in the atmosphere (Grainger and Ring, 1962), and a 3rd order polynomial to account for broadband scattering and absorption effects (Platt and Stutz, 2008). A new set of clear-sky spectra was recorded at each volcano, with each viewing direction in the swath using its own reference. The clear-sky measurements were selected by choosing an acquisition close in time and space to the volcanic plume measurements, but which lacked the absorption signature of SO2 in all viewing directions.
Once the best fit between measurement and model spectrum is achieved, the fit coefficients yield the slant column densities (SCDs) of SO2 and O3 relative to those contained in the clear-sky spectrum. For our zenith-facing observations, the vertical column density was then determined by simply accounting for the geometric air mass factor, i.e., each slant column was multiplied by the cosine of the measurement zenith angle θi (see Figure 5). BrO and OClO column densities can be retrieved in an analogous manner from the Imaging DOAS spectra (Gliß et al., 2015), but both were below the instrument’s detection limit during the measurements presented here.
Detection limit
The precision of spectroscopic measurements is limited by shot noise (Platt and Stutz, 2008). Pure shot noise increases with n1/2, where n denotes the number of photons collected. Since the measured radiance signal increases with n, the signal-to-noise ratio increases with n1/2. The precision of a measurement can therefore be improved by increasing the exposure time, co-adding subsequent exposures or, in the case of scattered light measurements, increasing the solid angle from which light is collected in each acquisition. In an Imaging DOAS spectrometer, the latter can be achieved by binning adjacent rows of the CCD detector, sacrificing spatial resolution for increased measurement precision. In practice, care must be taken to only combine measurements of the same trace gas column densities. Co-adding spectra representative of different column densities can have unintended consequences, as the spectra are weighted by their individual light intensities so their sum may not be representative of the average column density in the region of interest.
We assessed the detection limits of our Imaging DOAS system by dividing two clear-sky spectra by one another and taking the logarithm to obtain the optical depth as a function of wavelength. Deviations from 0 in this optical depth spectrum are attributed to noise, as the two spectra recorded the same clear-sky scene. To be detectable, the differential optical depth of a trace gas absorption band
Here,
The detection limit therefore depends on the noise level
We applied this methodology to clear-sky spectra recorded during our airborne survey in the Cook Inlet, Alaska, on 16 July 2021. Taking two spectra with 1-s exposure times recorded at 12:20 local time (corresponding to a solar zenith angle of 40°), we determined the 1-s SO2 detection limit of an individual spatial pixel recorded by our Imaging DOAS system (with 5 detector rows binned to combine light from a single fiber) to be approximately 1.2 × 10¹⁷ molecules/cm2. This corresponds to about 4.5 Dobson Units (DU) or 50 ppmm assuming normal temperature and pressure. Note that this value strongly depends on the UV clear-sky radiance, which is itself dependent on the solar zenith angle, as stratospheric O3 removes UV radiation more efficiently when light passes through the O3 layer obliquely. Hence, this detection limit will improve for measurements made at lower latitudes. Still, the Imaging DOAS detection limit is comparable to that of other consumer-grade spectrometers often used for DOAS applications (Figure 6). Research grade spectrometers with detectors especially sensitive to UV radiation can achieve lower detection limits but lack imaging capabilities, a setup that could be replicated with similar results by binning all detector rows of the FERGIE spectrometer.
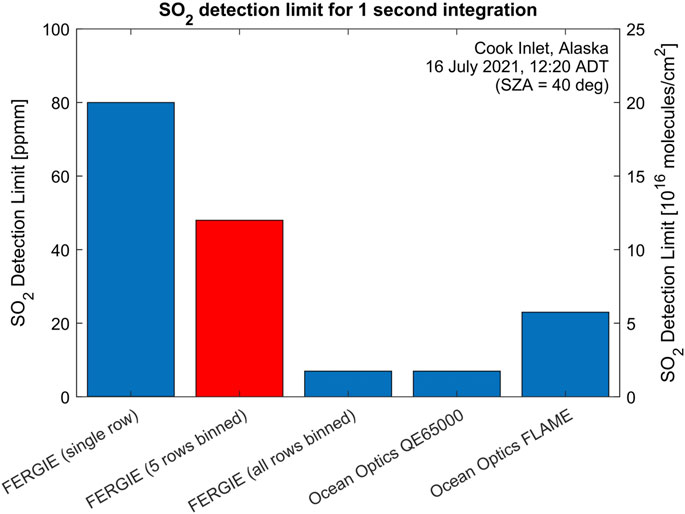
FIGURE 6. SO2 detection limits of the airborne Imaging DOAS (Princeton Instruments FERGIE Spectrometer) compared with two Ocean Optics spectrometers also commonly used by AVO for airborne measurements. The fiber bundle utilized in our setup allows binning of 5 detector rows without loss of spatial information, and this setting was used for the measurements described below. All detection limits were measured at the indicated time except for that of the FLAME spectrometer, which was estimated based on a direct comparison with the QE65000 performed on 6 September 2022 in Vancouver, Washington.
Sensitivity to trace gas plumes
As is the case for all DOAS measurements, the sensitivity of the Imaging DOAS instrument to a gas plume depends not only on instrumental characteristics (see previous section) but also on the effective light path of scattered UV radiation between the Sun and the instrument. DOAS instruments measure the slant column density (SCD) of the trace gases to which they are sensitive. The slant column density is given by the integral of the trace gas concentration cTG along the effective light path L.
Longer effective light paths in the volcanic plume result in higher column densities, regardless of the trace gas concentration inside the plume. This can be problematic if the effective light path is not well known or changes with time. The vertical column density (VCD) provides a more quantitative measure. The VCD is defined as the integral of the trace gas concentration cTG along a straight vertical path Z through the atmosphere, from the ground to space.
The sensitivity of a measurement to a region of interest, in our case the volcanic plume, is then given by the air mass factor (AMF). The AMF is defined as the ratio of the trace gas SCD to its VCD.
AMFs > 1 indicate an enhancement of the light path through the trace gas layer, e.g., due to multiple scattering by aerosols within the plume. AMF values < 1 indicate a shorter light path in the plume, which leads to a diminished sensitivity to the trace gas in question.
For measurements performed with zenith-facing DOAS instruments on moving platforms (typically referred to as “Mobile DOAS”), it is often assumed that the instrument is measuring the VCD directly (AMF = 1). In other words, the instrument is passing beneath the plume, sunlight is scattered in the atmosphere above the plume, and the light passes through it along a straight, vertical line. Strictly speaking, our Imaging DOAS measurements do not fulfill these assumptions because light is collected from a range of angles forming a swath above the aircraft. Therefore, each SCD must be multiplied by the cosine of the measurement zenith angle to obtain a geometrical approximation of the vertical column density (General et al., 2014b). However, as our swath angle θ is 27.2 deg (Figure 5), the maximum measurement zenith angle during level flight is only 13.6 deg, which yields a geometrical correction of less than 3%. This is negligible when compared to the effects of uncertain radiative transfer in and around volcanic plumes (see below). Generally, the simplification that zenith-facing DOAS instruments measure the VCD of trace gases contained in overhead plumes is reasonable for optically thin plumes measured at close range but fails if the plume is measured at long range, if the plume is opaque/optically thick, or if clouds/fog obstruct the instrument’s view of the plume (Millan, 1980; Mori et al., 2006; Kern et al., 2010a, Kern et al., 2013, Kern et al., 2020).
Although the measurements we report in this study were all made using a zenith-facing geometry, our Imaging DOAS can also be run in a nadir-facing configuration. In this case, the aircraft must fly above the volcanic plume and the instrument measures light that has been scattered in the atmosphere beneath it or reflected on the ground, analogous to measurements performed from satellite platforms. The nadir-viewing geometry offers more flexibility in choosing the distance between the aircraft and the plume and thus the across-track spatial resolution of the recorded imagery. Also, in the case of ash-rich plumes, nadir observations avoid the need to fly under or within regions that may contain ash concentrations hazardous to the aircraft’s operation. However, as we will show, the radiative transfer associated with this measurement configuration is more complex than in the zenith-facing geometry, and though the instrument is facing straight down, it is generally not appropriate to assume it is measuring the vertical column density directly (Tack et al., 2019; Schwaerzel et al., 2020).
To investigate the sensitivity of our Imaging DOAS instrument to volcanic plumes, we ran simulations of the radiative transfer at 313 nm in and around an idealized volcanic plume using the 3D Monte Carlo radiative transfer model McArtim (Deutschmann et al., 2011). We configured the model parameters to resemble the conditions we encountered in our measurements from 16 July 2021 (see Section 3). We placed a homogeneous, cylindrical plume of infinite length and 500 m diameter in a clean background atmosphere at various altitudes. At its center, the plume was modeled to have an SO2 vertical column density of 2.5 × 10¹⁷ molecules/cm2, an aerosol optical depth of 0.1, and an aerosol single scatter albedo of 0.9 representative of a sulfate aerosol. An instrument was placed at various altitudes above and beneath the plume, always aimed at the plume center. The full details of the radiative transfer model parameterization for the simulations we ran are given in Supplementary Table S1.
For zenith-facing observations (Figure 7A), the simulations confirmed that our measured SCDs through the optically thin plume approximately matched the VCDs (i.e., AMF ≈ 1). Regardless of plume altitude, AMFs were within 10% of unity if the aircraft was flown no more than 1.2 km below the plume center. Only when the distance between aircraft and plume increased beyond this value did the AMF decrease farther, reaching about 0.7 for measurements made >3 km beneath the plume center. These results did not change significantly when we varied the surface albedo or solar azimuth angle as discussed below, and essentially confirm that our measured SCDs from weak degassing volcanoes in Alaska can be treated as VCDs within an uncertainty of about 10%.
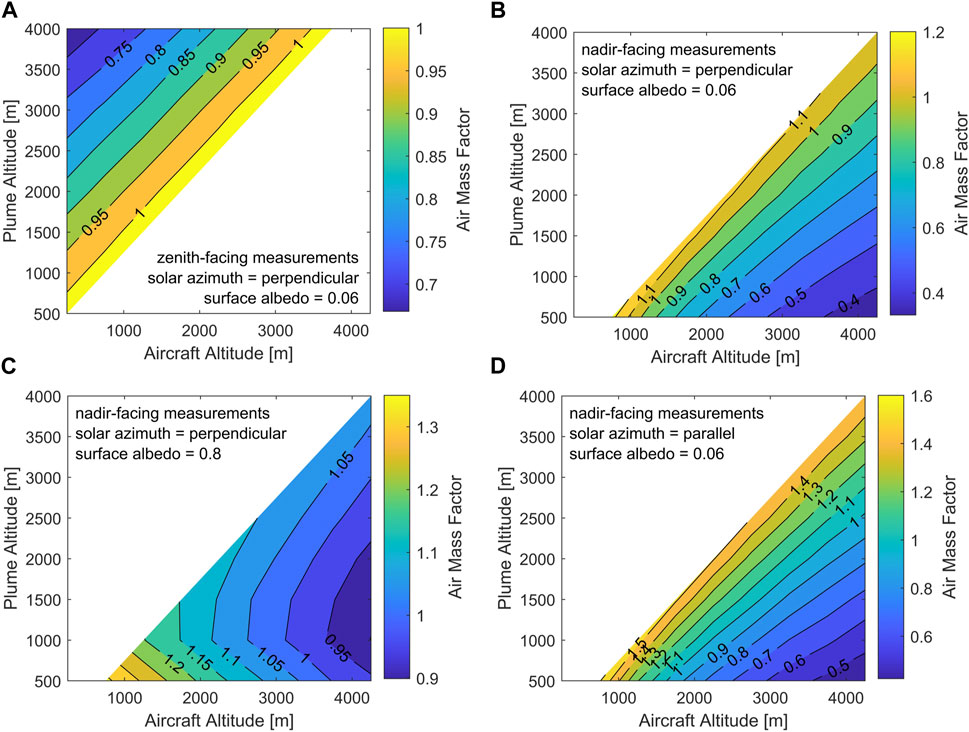
FIGURE 7. Simulated air mass factors (AMFs) for DOAS traverses beneath (A) and above (B–D) an SO2 plume. (A) The sensitivity of zenith-facing measurements decreases slightly with the distance between the aircraft and the plume. (B) When flying over water or snow-free terrain (surface albedo = 0.06), nadir-facing air mass factors decrease about twice as quickly with plume distance as in the zenith-facing case. (C) Looking down at snow or sea ice (surface albedo = 0.8) significantly increases the measurement sensitivity, particularly for low plumes. (D) SO2 column densities may be overestimated if the solar azimuth aligns with the plume propagation direction. See the Supplementary Material for a full description of the radiative transfer model parameters used for the simulations presented here.
If installed in a nadir-facing geometry, the sensitivity of our instrument is expected to be more variable. Figure 7B shows the simulated AMFs for nadir-facing measurements over snow/ice-free terrain with a surface albedo of approximately 0.06 at 313 nm (Kleipool et al., 2008). In this scenario, the AMF decreases more rapidly with distance between aircraft and the plume. As was true for the zenith-facing geometry, SCD and VCD are still within 10% of one another if the aircraft is flown within ∼1 km of the plume’s altitude. However, the AMF decreases to <0.5 if measurements are made 3 km above the plume center. This decrease in sensitivity stems from measured UV radiation being scattered at various altitudes beneath the aircraft, only some of which has passed through the plume on its way to the sensor.
However, the reduced sensitivity of nadir-facing measurements is only true for low surface albedos. Our simulations show a marked increase in AMF if a surface albedo of 0.8 is used (Figure 7C), consistent with the albedo of snow or sea ice (Kleipool et al., 2008). In this situation, the high surface reflectivity means that measured UV radiation is more likely to have been reflected on the ground back toward the instrument, rather than being scattered at various altitudes in the atmosphere. Therefore, most radiation has passed through the plume (at least once) before reaching the spectrometer, regardless of the plume and aircraft altitude. We also note that the detection limit of measurements performed while flying over reflective surfaces is particularly good, as the absolute radiance entering the instrument at 313 nm is expected to be more than twice the value expected during zenith-facing observations.
Finally, we found that 3D effects also play a role when making nadir-facing DOAS measurements of localized SO2 plumes, as has been shown previously for nitrogen dioxide (NO2) measurements in the visible spectral region (Schwaerzel et al., 2020). Figure 7D shows the results of a simulation identical to that shown in Figure 7B, except for the chosen solar azimuth angle. In Figure 7B, the solar azimuth was selected such that sunlight entered the scene perpendicular to the plume axis at a 40-degree solar zenith angle. In Figure 7D, the solar zenith angle remained 40°, but this time light entered the model space at an azimuth parallel to that of the plume axis. This circumstance greatly increases the probability of radiation passing through the plume twice: once on its way down, and again after being scattered up toward the instrument. This leads to AMFs as high as 1.5 for overpasses made in close proximity to volcanic plumes over snow-free terrain (Figure 7D). In fact, we found that AMFs can approach 2 when solar azimuth and plume direction align over snow-covered terrain. In such situations, assuming that SCD ≈ VCD, as we do with our zenith-facing observations, would lead to an overestimation of gas masses or emission rates by almost a factor of 2.
In situ instrumentation
Integration into the AVO airborne gas laboratory
The in situ gas sensing payload of the AVO airborne gas laboratory included two instruments that together measured the six most abundant volcanic gases, H2O, CO2, SO2, hydrogen sulfide (H2S), hydrogen chloride (HCl), and hydrogen fluoride (HF), in real time at 1 Hz resolution. The instruments were secured aft of the passenger seats in the aircraft cabin and supplied sample air from a forward-facing ram air inlet installed in a window blank on the forwardmost-starboard side of the aircraft. Ram air was conveyed by ∼3 m of 0.953 cm inner diameter (ID) Teflon tubing to a manifold mounted in the instrument rack. The manifold outlet was connected to a port near the rear of the aircraft with another length of 0.953 cm ID Teflon tubing to exhaust excess ram air. We did not quantitatively measure the ram air flow rate during this survey, but a similar setup in a slower Piper Navajo aircraft routinely yielded flow rates ∼25 lpm (Kelly et al., 2013), which is much greater than the instruments’ demand. To minimize instrument response times and sorption effects of sticky gases like HCl and HF on tubing, the instruments sampled air from the ram air manifold with short (<50 cm) individual lengths of 0.318 cm ID polyethylene (Bev-a-line IV) tubing.
In situ measurements of H2O, CO2, SO2, and H2S
Since 2009, in situ measurements of H2O, CO2, SO2, and H2S gases during annual fixed-wing gas surveys in Alaska have been accomplished using the VERP system (Volcano Emissions Research Package; Kelly et al., 2013). VERP achieved excellent analytical precision with a typical 1-sigma precision of 0.15 parts-per-million by volume (ppmv) for CO2, 2 parts-per-billion by volume (ppbv) for SO2, and 1 ppbv for H2S, all achieved at 1 Hz sampling rate (Kelly et al., 2013). However, the system was large (60 cm × 51 cm × 84 cm), heavy (>40 kg), and difficult for non-experts to operate. Thus, for this study we attempted to adapt a much smaller (47 cm × 36 cm × 18 cm), lighter (∼10 kg), and easier to use USGS “campaign” multi-GAS instrument to measure H2O, CO2, SO2, and H2S. This model of multi-GAS has been extensively utilized for ground-based and helicopter-borne surveys (Gunawan et al., 2017; Werner et al., 2017, Werner et al., 2020a., Werner et al., 2020a) and has been described previously. Briefly, the multi-GAS was powered by a small, internal 6 Ah LiFePO 4 battery and included an integrated GPS receiver (Garmin GPS 18x LVC), a non-dispersive infrared CO2 and H2O analyzer (LI-COR, Inc., LI-840A, 0–5,000 ppmv for CO2, 0–80,000 ppmv for H2O), and electrochemical SO2 (City Technology, Ltd., T3ST/F, 0–100 ppmv) and H2S sensors (City Technology, Ltd., T3H, 0–100 ppmv). Miniature pressure sensors (Phidgets 1141) measured the pressure in the instrument’s sample line and the ambient pressure inside the aircraft’s cabin. All data were logged at 1 Hz to the multi-GAS datalogger (Campbell Scientific, CR1000) and displayed in real time with a tablet. To mitigate potential analytical problems associated with transient pressure changes in the ram air inlet during aircraft maneuvers and with sampling gases at a broad range of altitudes (ca. 1,300–3,800 m), the multi-GAS was integrated with an experimental pressure control unit set to maintain constant pressure and flow (∼1 lpm) at 650 hPa.
The CO2, SO2, and H2S sensors were calibrated five times in-flight at ambient pressures from 804–686 hPa (∼1,800–3,000 m altitude) using standard gases stored in 25-L capacity tedlar bags (CO2 = 448 ppmv, SO2 = 2.1 ppmv, H2S, = 2.0 ppmv; all gases certified at ±2% accuracy). As part of each calibration, the H2O/CO2 analyzer’s baseline response was checked using small soda lime and anhydrite cartridges to remove H2O and CO2 from ambient air, and the sulfur sensors’ baselines were derived from their responses while sampling clean ambient air. The in-flight random noise (1-sigma at 1 Hz sampling rate) on the H2O, CO2, SO2, and H2S measurements were ±24, ±6.7, ±0.081, and ±0.037 ppmv, respectively. The average baseline-corrected response of each sensor to the five in-flight calibrations was used to scale the raw CO2, SO2, and H2S sensor data, and the measurements’ precision was calculated based on the reproducibility of the calibration tests. Using this method, the overall 1-sigma precision of the CO2, SO2, and H2S measurements during the entire flight were ±1.1%, ±32%, and ±12%, respectively. We note that the CO2, SO2, and H2S measurements collected using the smaller multi-GAS system were approximately 40 times noisier than measurements obtained with the larger VERP system. Expressed in terms of 3-sigma detection limits, the multi-GAS’s CO2, SO2, and H2S detection limits were ±20, ±0.24, and ±0.11 ppmv, respectively, as compared to VERP’s CO2, SO2, and H2S 3 s detection limits of 0.45, 0.006, and 0.003 ppmv. The relatively poor precision of the multi-GAS clearly illustrates the unfavorable analytical tradeoffs for using the much smaller and more convenient multi-GAS analyzer for this type of application.
In situ measurement of HCl and HF
In addition to the multi-GAS, the in situ sensing payload included an “Ultraportable” H2O-HCl-HF analyzer manufactured by Los Gatos Research (LGR), Inc., (Kelly et al., 2017). The LGR instrument is a laser-absorption spectrometry system that measures H2O, HCl, and HF simultaneously using an Off-Axis Integrated Cavity Output Spectroscopy (OA-ICOS) approach (Baer et al., 2002). The instrument contains two tunable diode lasers and a high finesse optical cavity that achieves an effective optical pathlength >3 km through the sample cell, which enables measurement of very low levels of HCl and HF at a high sampling rate (typical 1-sigma precision at 1 Hz sampling rate: HCl < 0.4 ppbv, HF < 0.1 ppbv). The instrument and its external pump require ∼90 W of power, which wwas supplied by two 12 V, 35 Ah lead-acid batteries and a pure sine wave AC inverter. Raw absorption spectra were stored on the instrument’s onboard computer. Digital results in sensible units (i.e., ppmv) were recorded along with time, location, and altitude information from a GPS (Garmin GPS 18x LVC) with a Campbell Scientific CR300-WIFI datalogger and displayed in-flight with a tablet. The GPS timestamp was used to synchronize the LGR output with the multi-GAS data during post-processing.
Results
Due to the hazards associated with potential volcanic eruptions near Anchorage, the AVO attempts to perform airborne gas measurements at high threat volcanoes in the Cook Inlet on at least an annual basis. One such survey was flown on 16 July 2021, with the new Imaging DOAS system integrated into the airborne gas laboratory for the first time, along with the in situ sensor suite described above. Measurements were attempted at 7 volcanoes in the Cook Inlet and northern Alaska Peninsula: Mount Spurr, Redoubt Volcano, Iliamna Volcano, Augustine Volcano, Mount Douglas, Mount Mageik and Mount Martin. Gas emissions were detected at Iliamna Volcano, Mount Douglas, Mount Martin, and Mount Mageik (Figure 1). These measurements are described in more detail below. Note that all reported measurement uncertainties refer to the 1-sigma standard deviation and relative compositions are given as molar ratios.
Iliamna Volcano
General observations
Iliamna Volcano (60.0325°N, 153.0880°W, 3,007 m) is a composite stratovolcano composed of interbedded andesite lava flows and pyroclastic rocks (Miller et al., 1998) located about 225 km southwest of Anchorage, Alaska. Though no historical eruptions have been recorded at Iliamna Volcano, two non-cohesive lahar deposits have been found and dated to <305 years before present (Waythomas et al., 2000). Iliamna Volcano exhibits typical signs of ongoing magmatic activity, with persistent seismic activity and the presence of fumaroles near the summit of the edifice. Airborne measurements performed on a recurring basis since 1990 have documented relatively stable gas emissions with Iliamna Volcano continuously degassing ∼50–100 t/d of SO2 during quiescence (Doukas, 1995; Doukas and McGee, 2007; Werner et al., 2011; Werner et al., 2022). Notable increases to around 500 t/d SO2 occurred in 1996 and 2012 (Roman et al., 2004; Werner et al., 2022), both of which were likely associated with magma movement in the volcano’s plumbing system but did not lead to eruptions (Roman and Power, 2011; Werner et al., 2011).
On 16 July 2021, our airborne gas survey approached Iliamna Volcano at 19:45 UTC. Following our standard procedure, the volcano was first visually surveyed from altitudes greater than its summit elevation to assess overall activity and meteorological conditions. As has been the case in past years, two active fumarole fields on the volcano’s southeast flank at an elevation of about 2,800 m exhibited visible degassing (Figure 8). Light winds out of the north allowed the condensed plumes to rise along the steep walls of the edifice before re-evaporating as they became diluted with background air and, though invisible now, presumably drift south. We next began surveying the atmosphere above the southern sector of the volcano beginning at 3,600 m directly over the fumaroles and successively dropping to as low as 1,300 m altitude at 6 km from the summit as Iliamna Volcano’s topography forced transects to be flown successively farther out as we descended. We then climbed back to >3,000 m and made several more passes through the gas plume to characterize its composition with the in situ sensors.
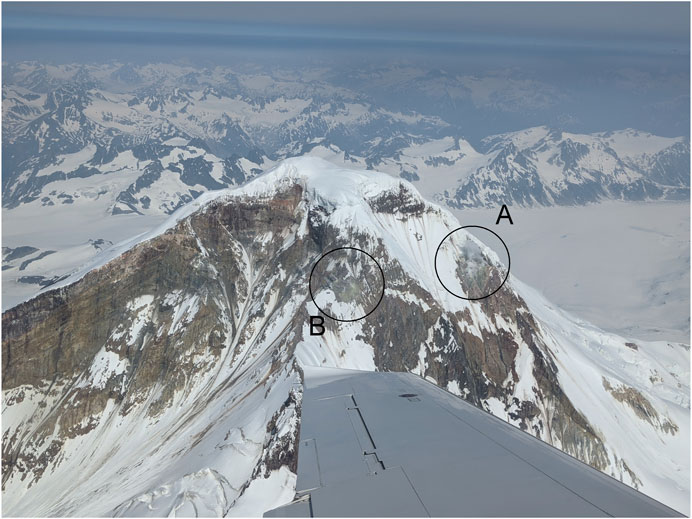
FIGURE 8. Iliamna Volcano viewed from the south on 16 July 2021. The location of the main active fumaroles is indicated (A), as well as that of a secondary, less vigorous fumarole field (B). Photo by Peter Kelly, USGS.
Analysis of the collected remote sensing and in situ sensor data shows that the aircraft passed beneath or through the gas plume a total of 15 times. As indicated by our measurements, the plume drifted south at altitudes between 3,000 and 3,500 m and appeared to rise slightly (toward the upper end of this range) as it moved downwind. The most diagnostic remote sensing data we were able to collect stem from 3 traverses flown beneath the plume (at ∼2,100 m altitude) at distances ranging from 1.3 to 3.0 km from the active fumarole fields. During these traverses, which passed beneath the plume at 20:06, 20:09, and 20:12 UTC, respectively, the Imaging DOAS detected the overhead gas plume. A map of the retrieved SO2 column densities reveals a ∼400 m-wide plume drifting south, then southwest following the ridge along the southern edge of Iliamna Volcano’s Umbrella Glacier (Figure 9). Maximum SO2 column densities of ∼3 × 10¹⁷ molecules/cm2 (∼11 DU) were detected in the plume center. At 3,500 m altitude, this corresponds to approximately 180 ppmm, so maximum SO2 mixing ratios likely exceeded 1 ppm in the plume center, broadly consistent with the in situ measurements (see below).
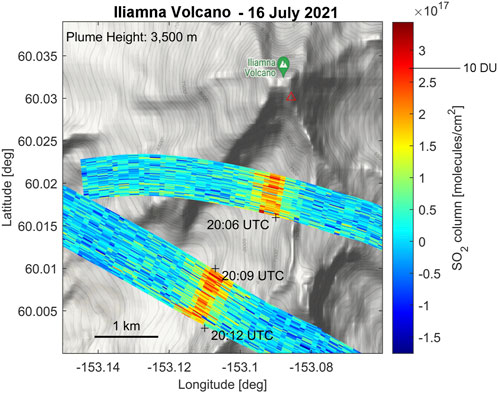
FIGURE 9. Imaging DOAS measurements of SO2 emitted from Iliamna Volcano on 16 July 2021. The volcanic gas plume was clearly identified drifting south of the edifice in three traverses beneath the plume, two of which (12:09, 12:12 UTC) were performed at a similar distance from the vent and thus overlap in the plot. At the time of measurements, SO2 was being emitted from fumaroles on the southeast side of the volcano at a rate of 90 ± 10 t/d. For the purposes of our analysis, we assumed a single source location corresponding to that of the main active fumaroles (see Figure 8), as indicated by a red triangle on the map. The cross-track resolution depends on the distance between the aircraft and the plume. The plume altitude is assumed to be constant at 3,500 m, consistent with the in situ observations. The variable along-track spatial resolution of the imagery stems from the use of a variable acquisition rate in the Imaging DOAS system. Base map: Google.
Wind speed and direction
As described earlier, one of the main advantages of the DOAS technique is that it allows retrieval of gas emission rates. However, this calculation relies on knowledge of the speed at which the plume is traveling downwind. To obtain a robust estimate of plume speed at Iliamna Volcano during our survey, we performed a so-called “wind circle” maneuver in which the aircraft flies a standard turn at constant thrust and altitude while being pushed downwind (Doukas, 2002). Figure 10A shows the GPS location of the aircraft during the 4 complete wind circles flown just southeast of the volcano. Improving upon previous work in which the plume speed was estimated simply from the difference between the highest and lowest measured ground speed (Doukas, 2002), we used the entire dataset to obtain a more reliable result. In ideal conditions, plotting the GPS-determined aircraft ground speed vg as a function of the aircraft course β should yield a cosine function.
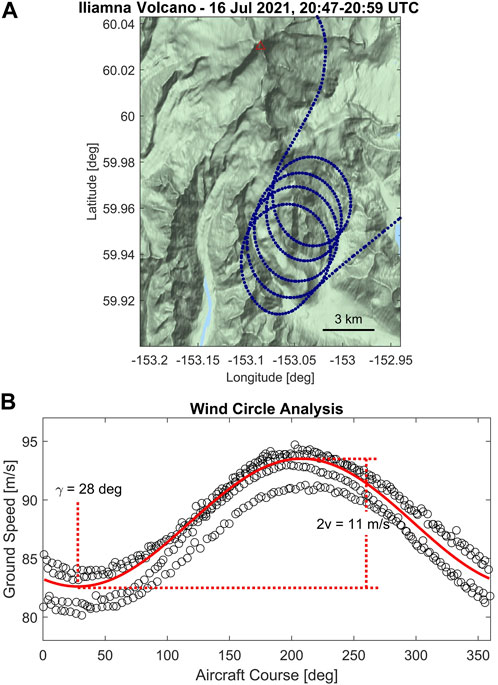
FIGURE 10. The plume speed at each volcano was obtained by flying “wind circles” in which the pilot performs a standard rate turn with constant thrust and altitude. (A) The GPS track of the aircraft shows how it was pushed downwind during the wind circles flown at Iliamna Volcano. Base map: Google. (B) The wind speed v and direction γ can be calculated by fitting a sinusoid to the aircraft ground speed as a function of its course. The course at which the minimum ground speed is realized corresponds to the wind direction. The amplitude of the sinusoid corresponds to the wind speed. Our wind circles at Iliamna Volcano yielded γ = 28 ± 10 deg; v = 5.5 ± 0.5 m/s. The aircraft course and wind direction are both measured in degrees east of true north.
Here, the amplitude of the observed sine wave is given by the wind speed vw, while its phase is determined by the meteorological wind direction γ. The curve is offset from 0 by the aircraft speed relative to the air surrounding it (airspeed, va). Plotting our flight data accordingly and fitting the above cosine function using a least-squares regression varying vw and γ (Figure 10B), we obtain a wind speed of 5.5 ± 0.5 m/s and a wind direction of 28 ± 10 deg for our measurements at Iliamna Volcano. This same procedure was repeated for all other volcanoes at which emission rates were determined during our survey (see Table 1).
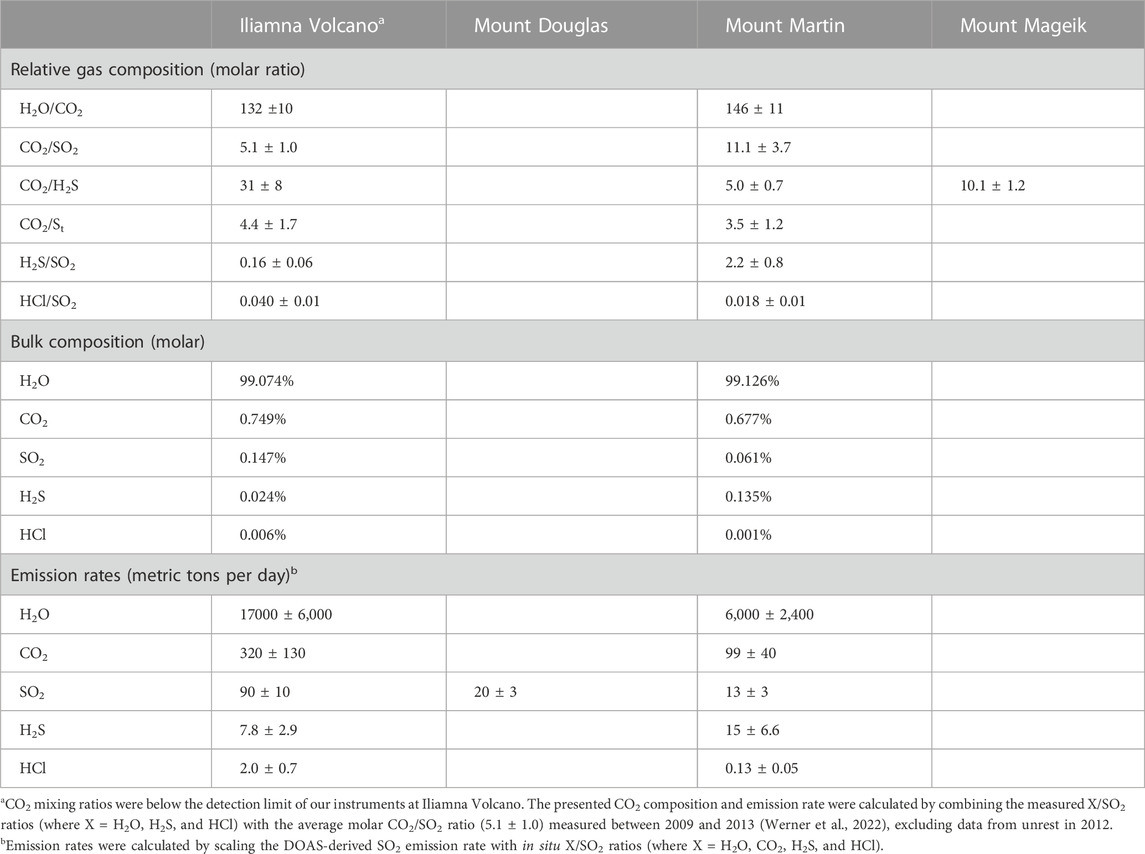
TABLE 1. Gas compositions and emission rates measured during the airborne gas survey on 16 July 2021. “St” refers to total sulfur, which is assumed to be equal to the sum of SO2 and H2S emissions. 1 sigma errors for gas ratios were calculated using the combined analytical and regression error estimates (typical regression error was ∼7.25%). HF concentrations were below the detection limit of the HCl-HF analyzer throughout the survey. Mount Spurr, Redoubt Volcano, and Augustine Volcano are not listed because all species were below the detection limits of our instruments at those locations.
Time series of SO2 emission rates
With the wind information in hand, SO2 emission rates can be retrieved. A conventional DOAS system flown for comparison measured cross-sectional SO2 burdens of 0.196, 0.204, and 0.217 kg/m on the 3 traverses pictured in Figure 9 (see Supplementary Figure S1 for example results from the conventional DOAS traverses). Multiplication with the plume speed yields SO2 emission rates of 1.08, 1.12, and 1.19 kg/s, respectively. These measurements, combined with two additional traverses flown farther downwind yielding slightly lower values (0.91 and 0.98 kg/s), constrained the SO2 emission rate to 1.04 ± 0.1 kg/s or 90 ± 10 t/d, consistent with previous measurements of background degassing at Iliamna Volcano (Doukas, 1995; Doukas and McGee, 2007; Werner et al., 2022).
However, the Imaging DOAS measurements can provide additional information and, as we show below, can even be used to derive limited time series data. Although the signal-to-noise level in each Imaging DOAS viewing direction is somewhat inferior to that of the research-grade conventional DOAS (Figure 6), the imaging spectrometer records spectra along 48 independent tracks corresponding to the 48 fibers in the fiber bundle. When flown beneath the gas plume roughly perpendicular to the wind direction, each of these rows records the cross-sectional SO2 burden at a slightly different distance to the gas vent. In an approach analogous to that used to derive time series information from satellite remote sensing data (Merucci et al., 2011; Theys et al., 2013, Theys et al., 2019; Queißer et al., 2019), cross-sectional SO2 burdens X measured at distance d from a vent correspond to gas emission rates ϕ(t) that occurred Δt = d/vw prior to the measurement time tm.
Here, δ represents the angle between the wind direction and the normal vector of the plane in which the plume cross-section X was measured, and multiplication with the cosine ensures that only the perpendicular component of the wind speed is considered when calculating the emission rate. Using Eq. 7, we can convert the 48 plume cross-sections measured during each Imaging DOAS traverse to a time series of 48 emission rates. Repeating this process for all three transects shown in Figure 9, we obtain a time series of SO2 emission rates spanning ∼6 min from 19:59 to 20:05 UTC on 16 July 2021 (Figure 11A). Note that the second traverse, although recorded 3 min after the first, provides information on the earliest emission rates because this traverse was performed 3 km rather than just 1.3 km downwind of the fumaroles.
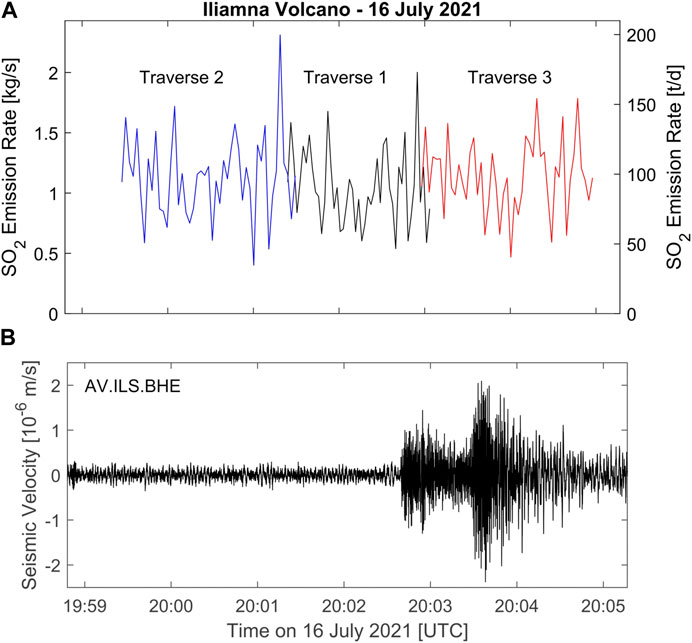
FIGURE 11. (A) Time series of SO2 emission rate from Iliamna Volcano on 16 July 2021. This time series was compiled from the three Imaging DOAS traverses shown in Figure 8. Each viewing direction provides an independent measurement of SO2 burden in the plume cross-section, which, when multiplied by the wind speed (see Figure 9), yields an emission rate (see text for details). (B) Seismic velocity measured at seismic station ILS, approximately 7.5 km southeast of Iliamna Volcano summit. Beginning at 20:02:45, the seismometer measured shaking from a regional earthquake, but this event did not appear to affect degassing. The velocity is filtered above 0.4 Hz to remove long-period noise.
According to the Imaging DOAS results, the mean SO2 emission rate during this brief observation period was 1.11 kg/s (95.6 t/d), and the standard deviation around this mean was 0.32 kg/s (27.4 t/d). The SO2 time series can readily be compared to other volcano monitoring data. As an example, the seismic waveform measured at the AVO seismic station ILS, located about 7.5 km southeast of the volcano, is plotted in Figure 11B. A magnitude 4.0 regional earthquake occurring at 20:01:34 on the Alaska-Aleutian subduction zone 475 km southeast of Iliamna Volcano (see www.earthquake.usgs.gov) caused shaking at the site beginning at 20:02:45, but our data indicate that this event did not have a measurable effect on the SO2 emission rate within the first 2 min after the onset of ground motion.
Gas composition
Additional information on the gases emitted from Iliamna Volcano comes from the suite of in situ sensors contained in the AVO airborne gas laboratory (Table 1). Clear in-plume H2O, SO2, H2S, and HCl peaks were measured at ∼2,875 m altitude and ∼200 m downwind from Iliamna Volcano (ΔH2Omax = 1,900 ppmv, ΔSO2max = 1.0 ppmv, ΔH2Smax = 0.15 ppmv, ΔHClmax = 0.052 ppmv, where Δ = mixing ratio above ambient background), but CO2 could not be resolved above ambient background and HF was not detected. To our knowledge, these are the first reported measurements of H2O and HCl emissions from Iliamna Volcano. Sulfur was present mainly as SO2 (SO2/H2S = 6.1 ± 2.1), similar to typical long-term average values (SO2/H2S = 7.6 ± 2.2, excluding data from unrest in 2012; Werner et al., 2022). The plume composition was water-rich (H2O/St = 580 ± 204, where St represents total sulfur, which is assumed to be emitted exclusively as SO2 or H2S) and HCl-poor (HCl/St = 0.034 ± 0.012) compared to typical high-temperature magmatic gases (global arc-volcanic gas average H2O/St = 69, HCl/St = 0.5; Taran and Zelenski, 2015). The lack of detectable HF was not surprising given that it is usually an order of magnitude less abundant than HCl in emissions from arc volcanoes (Taran and Zelenski, 2015), and the failure to resolve CO2 is also not surprising due to the poor precision of the CO2 analyzer, the relatively low in-plume sulfur mixing ratios, and because Iliamna Volcano’s typical C/S is relatively low (average CO2/SO2 = 5.1 ± 1.0 from 2009 to 2013, excluding data from unrest in 2012; Werner et al., 2022).
Mount Douglas
Mount Douglas (58.8596°N, 153.5351°W, 2,140 m) is an ice-clad stratovolcano at the northern end of the Alaska Peninsula, just south of Kamishak Bay. No historical eruptive activity has been reported at Mount Douglas (Wood and Kienle, 1990), but active degassing occurs from the summit crater which hosts a ∼250 m diameter crater lake (Figure 12A). Observations of activity on 16 July and in August of 2021 (M. Loewen, USGS, written personal communication from 21 February 2023) showed visual degassing occurring on the western margin of the crater lake, and additional gas may also have been emitted through the lake itself.
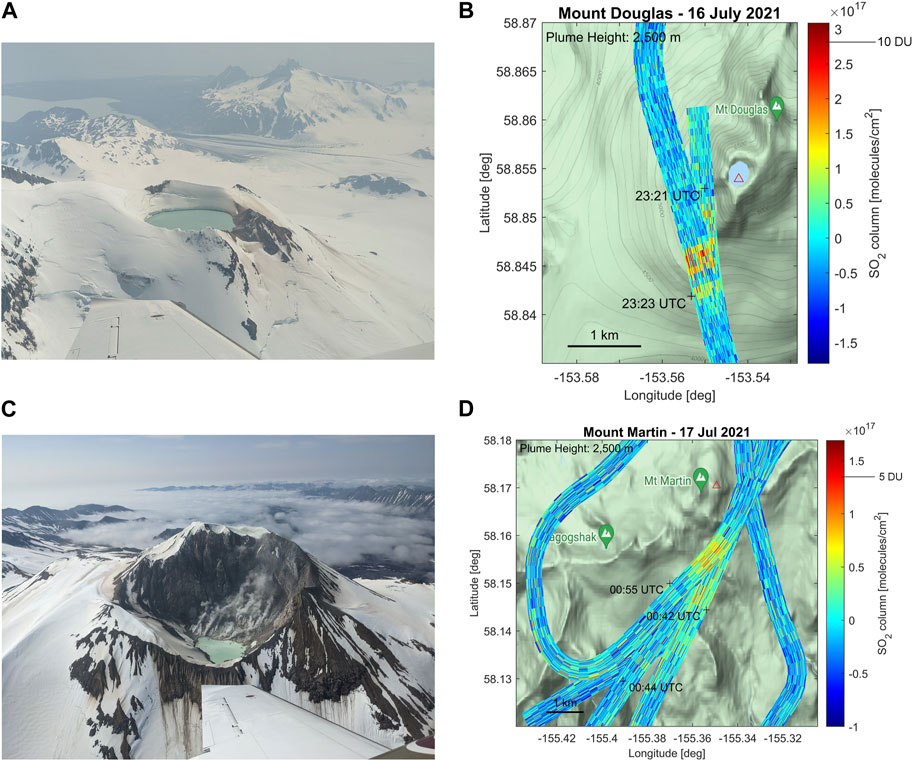
FIGURE 12. (A) Mount Douglas viewed from the northwest during our airborne survey on 16 July 2021. The volcano’s summit crater hosts a lake. Degassing occurs through and along the edges of this lake. (B) Imaging DOAS SO2 column densities retrieved downwind of Mount Douglas. A weak plume was detected southwest of the volcano. (C) Viewed from the southeast in this photo taken during our survey, Mount Martin also hosts a crater lake, but visible degassing occurs from a large fumarole field on its northwest shore. (D) Imaging DOAS SO2 column densities reveal a very weak plume drifting south of the volcano. Both plumes were assumed to have a constant altitude of 2,500 m, consistent with the in situ observations. Note that measurements at Mount Martin were made on the same day as the others, with the 17 July date stamp referring to traverse time in UTC. Photos by Christoph Kern, USGS. Base maps: Google.
Our observation flight on 16 July 2021 approached Mount Douglas from the northeast. After some high-level reconnaissance, we descended to approximately 2,100 m altitude and flew several transects through the plume directly above the west edge of the crater lake. As we flew through the plume, the in situ sensor suite registered some small apparent SO2 peaks (∼0.1 ppmv) but we are not confident in the detections because the peak values were below the sensor’s 3s detection limit (±0.24 ppmv). All other species (H2O, CO2, H2S, HCl, HF) were also below the detection limits of the instruments or were indistinguishable from ambient concentrations.
We proceeded to descend to about 1,600 m and flew two transects beneath the plume which we later realized could clearly be identified in our Imaging DOAS measurements drifting south of the edifice (Figure 12B). Based on wind circles flown immediately after the mapping survey, winds were out of 23 ± 13 deg at 3.6 ± 0.2 m/s. Maximum SO2 column densities in the plume center were ∼2.5 × 10¹⁷ molecules/cm2, and the SO2 emission rate was quantified to 20 ± 3 t/d. Just barely above the detection limit of the Imaging DOAS, this weak plume did not allow for a reliable time series calculation as performed for Iliamna Volcano.
Mount Martin
Mount Martin (58.1692°N, 155.3566°W, 1860 m) is located near the southern end of the Mount Katmai volcanic cluster, just 15 km southwest of the Novarupta vent that famously erupted in June of 1912 (Hildreth and Fierstein, 2002). Mount Martin’s summit cone features a crater that is approximately 300 m in diameter and breached on its southeast side. Vigorous degassing has occurred at Mount Martin since at least 1913 (Griggs, 1922), and although there is no conclusive evidence of an eruption in historical times, visible plumes containing steam, gas, and possibly ash have been observed to rise as high as 600 m above the volcano’s summit vent and extend downwind for up to 20 km (Miller et al., 1998).
Our 16 July 2021 airborne survey approached Mount Martin from the northeast at about 2,000 m altitude. Circling to the southeast side of the volcano offered a clear view of the crater lake and active fumarole field on its northwest shore (Figure 12C). On the day of our survey, emissions from the fumaroles were evident as condensed water plumes drifting upward to the rim of the summit crater. From there on, the plumes became transparent as ambient conditions led to re-evaporation of plume water. We proceeded to fly several plume intercepts directly over the top of the crater, briefly intersecting the volcanic gas plume each time. Our in situ sensor package registered a water-rich (H2O/St ≈ 500) plume (ΔH2Omax = 2,150 ppmv) containing approximately twice as much H2S as SO2 (H2S/SO2 = 2.2 ± 0.8; ΔSO2max = 0.6 ppmv, ΔH2Smax = 1.0 ppmv). Intercepting the gas above the summit of the volcano, CO2 was also detected above the atmospheric background (ΔCO2max = 25 ppm). Behind H2O, CO2 was the second most abundant species, with CO2/St = 3.4 ± 1.1. Finally, HCl was also identified (ΔHClmax = 0.27 ppmv) in the volcanic gas plume though its relative abundance in the plume was low (HCl/SO2 = 0.018 ± 0.01, see Table 1 for details). HF was not detected above the detection limit of the instrumentation.
Following the plume intercepts, we moved farther from the volcano’s summit allowing us to descend to approximately 1,500 m. At this flight level, we performed three traverses beneath the gas plume, which we intersected approximately 1.5 km south of the crater (Figure 12D). At this distance, our DOAS instruments detected overhead SO2 column densities up to 1.1 × 10¹⁷ molecules/cm2 while under the plume center. Again, applying the wind circle technique, winds were determined to be out of 9 ± 7 deg at 1.9 ± 0.2 m/s. Multiplying the DOAS-derived plume cross-sectional SO2 burdens with these values, the volcanic SO2 emission rate was constrained to 0.15 ± 0.03 kg/s (13 ± 3 t/d).
We had previously determined the SO2 detection limit of our Imaging DOAS instrument to be approximately 1.2 × 10¹⁷ molecules/cm2 (see Materials and Methods section). Yet despite the overhead SO2 column densities not exceeding this value at our traverse location, the volcanic plume can be identified in the imagery retrieved from the Imaging DOAS data collected 1.5 km downwind of Mount Martin’s summit (Figure 12D). This is a consequence of the large number of independent measurements collected by the imaging spectrometer and illustrates an advantage of this technique. Even though the SO2 column density derived at each individual pixel does not exceed the noise level, the plume is probed at approximately 250 independent locations during each traverse and the distribution of column densities retrieved in this area is skewed toward higher values than is true for the regions surrounding the gas plume.
Mount Mageik
Mount Mageik (58.1946°N, 155.2544°W, 2,165 m) is a broad, cone-shaped stratovolcano located just 7 km northeast of Mount Martin and resting on the same basement ridge (Miller et al., 1998). Mount Mageik’s summit area consists of four separate volcanic cones. A 350-m-wide phreatic crater on the northeast side of the central cone hosts an acidic crater lake and an active fumarole field. The easternmost cone is a Holocene edifice, but Mount Mageik has no known historical eruptions, and the configuration of the crater has not changed in the last century (Fenner, 1930; Hildreth and Fierstein, 2000).
During our observation flight on 16 July 2021, this crater was the only identifiable source of degassing at Mount Mageik. Bubbles several meters in diameter were observed breaching the lake surface, and a raft of what appeared to be sulfur spherules was seen floating on the water (Supplementary Figure S2). Flying from north to south and vice versa, we performed 6 plume intercepts directly above the crater at an altitude of approximately 2,000 m. The onboard gas sensors registered up to 4 ppm of H2S and 40 ppm CO2 above the atmospheric background. SO2, HCl, and HF remained below the detection limit of the in situ instruments on all transects of the plume, consistent with previous measurements of the bulk plume with multi-GAS and sampling of the fumaroles on the north crater wall performed in 2013 (Lopez et al., 2017).
Other volcanoes included in the airborne survey
Applying the techniques described above, airborne gas measurements were attempted at 3 additional Alaska volcanoes on 16 July 2021. Measurements at Mount Spurr, Redoubt Volcano, and Augustine Volcano failed to detect any volcanic gas species with either the remote sensing or in situ instruments. While quantitative measurements have sometimes been possible at these volcanoes in past years, the ability to measure gases depends not only on the volcanic emission rates but also decisively on the meteorological conditions present during the respective surveys. Although we could not quantify gas emissions at these volcanoes on this flight, visual observations appeared to confirm very low levels of degassing consistent with background activity.
Discussion
Volcanic activity in the Cook Inlet and northern Alaska Peninsula
All volcanoes in the Cook Inlet and northern Alaska Peninsula were exhibiting typical background activity during our 16 July 2021 airborne gas survey. Each of the four volcanoes at which gases were measured (Iliamna Volcano, Mount Douglas, Mount Martin, and Mount Mageik) produced only very weak plumes, with SO2 emission rates of 90 ± 10, 20 ± 3, and 13 ± 3 t/d measured at Iliamna Volcano, Mount Douglas, and Mount Martin, respectively (Table 1). SO2 emissions at Mount Mageik were below the detection limit of our instruments. These comparatively low SO2 emission rates are consistent with a lack of rising, volatile rich magma and, taken together with the gas composition measurements, gas-water-rock interactions which are removing SO2 from the gas stream before it reaches the atmosphere (see below). However, they do indicate a magmatic origin for at least part of the emitted gas at the volcanoes where SO2 was detected.
At Iliaman Volcano, the presence of SO2 and HCl in the plume reveals a clear magmatic origin of the gases (Symonds et al., 2001), but the overall water-rich and HCl-poor character of the plume (Gerlach, 2004) suggests that gases are interacting with groundwaters of either meteoric or magmatic origin on their path to the surface. Chemical reactions involving volcanic gases, water, and rocks remove water-soluble species like SO2 and HCl from the gas phase in a process called “scrubbing” (Symonds et al., 2001), and the removal of S and HCl and addition of non-magmatic H2O could well be contributing to the observed high H2O/St ratio and low HCl/S t ratio.
Mount Douglas also emits measurable SO2, evidence of a magmatic component in the volcanic system. The lack of significant H2S in the gas plume is interesting, as the presence of at least some reduced sulfur gases would be expected in emissions from water-rich systems, as Mount Douglas’s crater lake would appear to imply it is. However, several recent studies have identified some volcanic crater lakes that appear to emit SO2-rich, H2S-poor gases (Shinohara et al., 2015; Tamburello et al., 2015; Gunawan et al., 2017) and attributed this phenomenon to a preferential removal of H2S from the gas stream occurring at low temperatures via the reaction,
This reaction (Mizutani and Sugiura, 1966; Giggenbach, 1987) deposits elemental sulfur Se, a circumstance that is consistent with prior observations of solid material floating on the surface of Mount Douglas’s crater lake (Wood and Kienle, 1990), and might therefore be responsible for the apparent lack of H2S in the Mount Douglas plume.
The gas emissions observed at Mount Martin during our survey are generally consistent with previous observations from a significantly more rigorous gas sampling campaign conducted 10–22 July 2013 (Lopez et al., 2017), with the notable exception of our lower gas emission rate [only 13 ± 3 t (SO2)/d as opposed to the ∼75 t/d reported for 2013]. Also, these are the first reported HCl compositions and emission rates from Mount Martin because its crater was too difficult to access for ground-based sampling in 2013 (Lopez et al., 2017). As the authors of this previous work suggest, the presence of SO2 is consistent with degassing from an active magmatic-hydrothermal system, while the relatively low CO2/St ratio generally indicates degassing from a relatively shallow magma body or one that has been previously depleted in CO2. Overall, Mount Martin appears to host a mixed magmatic-hydrothermal system and tracking gas compositions and emission rates will likely be useful in assessing the relative contributions of the two components over time.
At Mount Mageik, the lack of significant concentrations of acid gases (SO2, HCl, HF) and the relatively high CO2/St ratio (10 ± 1.2) we measured are both typical for degassing of active hydrothermal systems, and we did not find evidence for a distinct magmatic component in the volcano’s emissions during our survey.
Airborne Imaging DOAS offers new possibilities for plume characterization
The Imaging DOAS measurements of weak SO2 plumes emitted from Alaska volcanoes described above allude to the new possibilities for plume characterization that the technique provides. Contrary to conventional airborne Mobile DOAS measurements which only offer 1D transects of overhead gas plumes, the imaging spectrometer allows for 2D mapping of the plumes as they drift downwind. Though all plumes measured as part of this survey were weak, with a maximum SO2 emission rate of only 90 t/d measured at Iliamna Volcano, the gas clouds could still be clearly distinguished from the background at distances exceeding 5 km from the degassing vents. With this sensitivity, the instrument will be able to track more vigorous plumes, e.g., immediately prior to or during eruptive activity, for many tens to hundreds of kilometers downwind, thus providing actionable information to the AVO and other institutions tasked with monitoring the emission rate and atmospheric dispersion of volcano emissions. The ability to derive limited, continuous time series information of gas emission rates for comparison with other monitoring data (e.g., seismic, geodetic, thermal, see Figure 11) is also a novel capability for an airborne remote sensing package and such measurements may help advance the scientific understanding of shallow degassing processes as more such measurements are made. But beyond these concepts, which we were able to demonstrate during our 16 July 2021 survey, the Imaging DOAS provides a few novel capabilities that tie into ongoing related research and are discussed below.
Comparison to satellite measurements
One particularly interesting aspect of the Imaging DOAS data products is that they are directly comparable to satellite observations of trace gas plumes, as both measure the spatial distribution of trace-gas VCDs. The observation geometry of the Imaging DOAS is more flexible, allowing for both zenith and nadir-facing observations. We showed that zenith-facing observations will generally be more accurate due to better constraints on radiative transfer leading to AMFs close to unity. To some degree, they will also avoid the complex 3D radiative transfer effects of nadir-facing geometries (Schwaerzel et al., 2020; Wagner et al., 2022). However, even the AMFs of nadir-facing measurements will typically be better constrained for the airborne imaging when compared to those of satellite measurements, as light dilution/light mixing effects are minimized when the aircraft passes over the plume at shorter distances. Our modeling suggests nadir-imaging clear-sky AMFs in the 0.5–1.5 range (at 313 nm) for SO2 plumes in the lowermost few kilometers of the atmosphere, compared to values ranging from about 0.3 to 3 for the Tropospheric Monitoring Instrument (TROPOMI) on board the Copernicus Sentinel-5 Precursor satellite (Theys et al., 2017). Thus, airborne Imaging DOAS measurements will generally be more accurate and lend themselves to validation studies.
Besides the better constrained instrument sensitivity, another powerful feature of the Imaging DOAS measurements is the greatly enhanced spatial resolution when compared to satellite-based trace gas measurements. The highest quality space-based volcanic SO2 products currently come from the aforementioned TROPOMI instrument, which provides SO2 VCDs at 3.5 km × 5.5 km resolution. This pixel size is only slightly smaller than the 5.5 km × 5.5 km map segment shown in Figure 9. Our map shows a plume with a mean SO2 VCD of approximately 2 × 10¹⁷ molecules/cm2 filling a region that extends about 0.25 km × 5 km. Assuming a similar orientation of the plume in the TROPOMI pixel as in Figure 9, the plume would fill only approximately 6% of the pixel area. Further assuming the pixel illumination is homogeneous (which is reasonable for cloud-free conditions and uncondensed plumes as encountered here), the TROPOMI AMF would thus be reduced to 6% of the AMF for the entire pixel. On the other hand, the pixel size of the Imaging DOAS instrument was smaller than the extent of the plume and therefore our sensitivity did not suffer from this effect.
The TROPOMI instrument passed over Iliamna Volcano at 23:49 UTC on 16 July 2021 (Orbit 19473), approximately 3.5 h after our measurements. Downloaded from the Sentinel-5 Precursor Open Access Data Hub (https://s5phub.copernicus.eu/dhus/#/home), the Level 2 Offline SO2 SCDs derived over the Cook Inlet region in the 312–326 nm range are shown in Supplementary Figure S3. The SO2 SCD immediately south of Iliamna Volcano is not enhanced above the noise of the measurement in this regional sector, which was determined to be 4.1 × 10¹⁶ molecules/cm2 at 3 sigma1. At the time of the satellite overpass, the TROPOMI AMF calculated for the location of Iliamna Volcano was approximately 2. Had the plume filled the entire pixel, the SO2 absorption signal would have been about an order of magnitude above the instrument’s detection limit. However, since the SO2 plume filled only 6% of the pixel, the AMF corresponding to the plume itself was only 0.12, making the TROPOMI SO2 VCD detection limit 3.4 × 10¹⁷ molecules/cm2 (at 3 sigma). Therefore, TROPOMI was not able to detect the weak SO2 degassing from Iliamna Volcano even in these relatively ideal measurement conditions (cloud-free, high surface albedo, close to summer solstice). However, this example demonstrates how high-sensitivity, high-resolution Imaging DOAS data can be used to validate satellite measurements of trace gas plumes from point sources in the future.
Imaging volcanic gases other than SO2
As described in the Material and Methods section, the Imaging DOAS technique enables 2D measurements of trace gas distributions. Two other techniques have recently come into focus that also allow imaging of gas plumes, particularly in the context of measuring volcanic emissions: SO2 cameras use narrow-band optical filters placed in front of UV or IR-sensitive cameras to measure the incident radiance at multiple wavelength bands (McElhoe and Conner, 1986; Mori and Burton, 2006; Bluth et al., 2007). Sensitivity to SO2 comes from comparing radiances at wavelengths corresponding to SO2 absorption bands with those at nearby wavelengths without SO2 absorption (Kern et al., 2010b, Kern et al., 2013; Lübcke et al., 2013). A second method for imaging trace gas distributions uses Fabry-Perot interferometry to slide a transmission comb across the incident spectral radiance (Platt et al., 2014). Careful selection of the interferometer’s optical path length difference and finesse allows the transmission peaks to be alternatingly tuned such that they coincide with periodic trace gas absorption bands and troughs between bands, thereby again allowing a comparison of on and off-band radiance (Kuhn et al., 2014; Fuchs et al., 2021).
Both methods have the advantage that a full 2D image can generally be obtained quite quickly because on and off-band images can either be taken in rapid succession or, in the case of the SO2 camera, simultaneously (if using two detectors). The Imaging DOAS requires scanning the area of interest line by line, which generally takes longer. However, the SO2 camera and Fabry Perot imagers are specifically designed to target an individual trace gas (e.g., SO2 or BrO), with the dispersive elements (optical filters, optical path difference and finesse) customized to maximize sensitivity to this species. The Imaging DOAS, on the other hand, measures the full near-UV spectrum at moderate resolution (0.45 nm in our setup). This enables measurements of numerous volcanic and atmospheric trace gases, including SO2, BrO, OClO, IO, O3, H2O, NO2, nitrous acid (HNO2), formaldehyde (CH2O), glyoxal (C2H2O2), and oxygen dimers (O4).
Though their column densities were below the detection limits of our instrument in the weak plumes encountered during our survey on 16 July 2021, the halogen oxides BrO, OClO, and IO have all been measured in more vigorous volcanic plumes with DOAS instruments (Bobrowski et al., 2003; Theys et al., 2009,Theys et al., 2014; Bobrowski and Giuffrida, 2012; General et al., 2014a; Donovan et al., 2014; Gliß et al., 2015; Schönhardt et al., 2017; Kern and Lyons, 2018). These species are not primarily emitted from volcanoes, but instead are formed from primary volcanogenic emissions in a complex series of chemical reactions that occur as the plume ages and constituents are mixed with background air (Gerlach, 2004; Oppenheimer et al., 2006; Bobrowski et al., 2007; von Glasow, 2010; Kelly et al., 2013; Gutmann et al., 2018). These reactions affect the oxidation capacity of the atmosphere on local to regional scales (von Glasow et al., 2009). Future measurements with our Imaging DOAS instrument will allow us to characterize the spatial distribution of these species in chemically evolving plumes, measurements that could lead to a better understanding of halogen chemistry and thus allow us to better constrain primary volcanic halogen emissions from measurements of these secondary species. Initial studies have already uncovered some interesting findings including a decrease in BrO/SO2 ratios in the months leading up to the 30 June 2012 eruption of Nevado del Ruiz volcano, Colombia (Lübcke et al., 2014), and a 2 to 5-fold increase in BrO/SO2 ratios accompanying Vulcanian to Strombolian transitions in eruptive behaviour at Tungurahua volcano, Ecuador (Warnach et al., 2019). Furthermore, since halogen oxides are accessible to the common scanning DOAS instruments that make up the global Network for Observation of Volcanic and Atmospheric Change [NOVAC (Galle et al., 2010; Arellano et al., 2021); www.novac-community.org], better constraints on plume chemistry and the volcanological implications of changes in halogen emissions would be immediately applicable to the >35 volcanoes monitored in this manner.
The development of such standardized continuous gas monitoring instruments and the expansion of global networks that cover an increasing number of volcanoes will allow us to better measure the gas-geochemical signals associated with the full progression of quiescence to unrest to eruption. The goals are to gain insights into volcanic processes occurring at depth and develop an understanding of the geochemical signatures that can be used to forecast future volcanic events. However, the remote location and harsh environment of many active volcanoes, e.g., those in Alaska, means that this endeavor will necessarily also rely on intermittent campaign observations and satellite remote sensing data. The Imaging DOAS and in situ sensor package described here allow airborne characterization of volcanic degassing at remote vents. These observations can provide geochemical assessments of volcanic systems even during times of weak background degassing and, through comparison and validation, will help refine space-based measurements such that they can better track global volcanic gas emissions.
Conclusion
In this study, we have implemented an Imaging DOAS system specifically for observation of volcanic degassing from airborne platforms. The instrument can be operated either in zenith or nadir-facing geometry, with the zenith-facing measurements providing the highest accuracy due to the well-constrained radiative transfer in the overhead volcanic plumes. However, the nadir-facing geometry offers an improved measurement signal-to-noise ratio and detection limit when observations are made over snow cover, as is often the case for volcanoes in Alaska. Our instrument achieved a single-pixel SO2 detection limit of 1.2 × 10¹⁷ molecules/cm2 (∼50 ppmm) during our zenith-facing measurements in mid-July, but since volcanic plumes are probed in numerous viewing directions simultaneously, these can be detected even at lower column densities (e.g., see the presented results from Mount Martin). The spatial information provided by the Imaging DOAS can be used to assess the heterogeneity of gas abundances in volcanic plumes and track their extent as they propagate downwind. Using our measurements at Iliamna Volcano as an example, we also demonstrate how limited time series information can be derived from airborne Imaging DOAS data. The time series of SO2 emission rates can then readily be compared to other time-resolved geophysical monitoring streams.
In addition to the Imaging DOAS, a suite of in situ sensors was used to characterize the major chemical composition of the volcanic gas plumes. These sensors measured H2O, CO2, SO2, H2S, HCl, and HF, as well as temperature, pressure, and relative humidity in the ambient air as the aircraft intercepted the gas plumes. Gas compositions measured at Iliamna Volcano, Mount Douglas, Mount Martin, and Mount Mageik indicate that gas-water-rock interactions (“scrubbing”) are important to varying degrees at these volcanoes, yet comparisons to CO2-St-HCl compositions from other well-sampled volcanoes show that emissions from Iliamna Volcano and Mount Mageik are most similar to samples collected from lower-temperature fumaroles (ca. < 200°C) as opposed to higher-temperature fumaroles with abundant HCl (Figure 13). Both Iliamna Volcano and Mount Martin have relatively low CO2/St ratios, which suggests that degassing is sustained by relatively shallow magma. At Mount Douglas, gases passing through or around the crater lake appear to be depositing native sulfur via low-temperature Reaction 8, which requires a mixed magmatic-hydrothermal input to the shallow aquifer and/or crater lake. At Mount Mageik, on the other hand, all sulfur emissions occurred in the form of H2S. This, combined with the high CO2/St ratio of about 10, indicates a purely hydrothermal source, with some portion of the sulfur gases possibly being scrubbed from the gas stream by the crater lake.
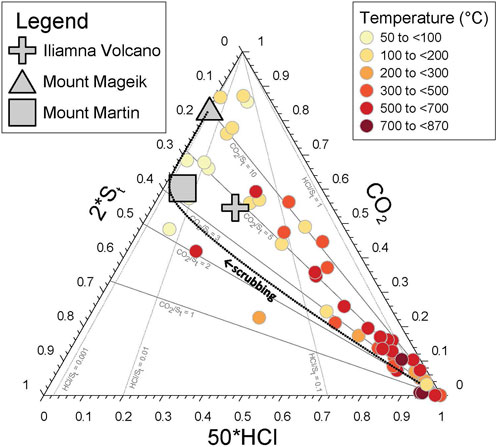
FIGURE 13. Ternary diagram showing CO2-St-HCl compositions of gases from Iliamna Volcano, Mount Mageik, and Mount Martin. Note that the indicated CO2 composition from Iliamna Volcano is based on St and HCl compositions measured in 2021 and the average CO2/SO2 ratio (5.1 ± 1.0) measured between 2009 and 2013 (Werner et al., 2022), excluding data from unrest in 2012. For comparison, filled circles indicate literature gas compositions from four volcanoes (Augustine Volcano, Meakandake, Ruapehu, White Island) where direct samples and vent temperatures were recorded from high-temperature fumaroles proximal to the strongest degassing areas and lower-temperature, distal gas vents (Giggenbach and Sheppard, 1989; Symonds et al., 1992; Christenson, 2000; Shinohara et al., 2011). The curve labelled “scrubbing” illustrates the general compositional trend expected for the evolution of a magmatic gas interacting with near-surface meteoric water. The initial composition of the model gas was 50% CO2, 25% SO2, and 25% HCl, and the solubilities (by mass) in 20°C water at 1 atm were set to 0.172% for CO2, 10.548% for SO2 (Wilhelm et al., 1977), and 73% for HCl (O’Neil, 2013).
By implementing an Imaging DOAS and a suite of in situ sensors on a small, fixed-wing aircraft, we were able to acquire detailed geochemical information on several Alaska volcanoes in a single airborne survey. The information we collected allowed us to characterize the volcanic systems and provided useful information on current activity levels. By comparing future measurements to this baseline, signals associated with a transition of a system towards eruptive activity may be captured ahead of time and assist in hazard assessments and eruption forecasts.
Data availability statement
The datasets presented in this study can be found in online repositories. The names of the repository/repositories and accession number(s) can be found below: Data uploaded to the USGS ScienceBase repository: https://doi.org/10.5066/P9YTK9PE.
Author contributions
CK led the development and integration of the airborne Imaging DOAS instrument. PK led the development and integration of the in situ sensor suite. CK and PK performed the measurements on 16 July 2021 and analyzed the collected data. CK wrote the first draft of the manuscript. PK wrote sections of the manuscript. Both authors contributed to manuscript revision and approved the submitted version.
Funding
The funding for this study was provided by the United States Geological Survey’s Volcano Hazards Program and through Grant/Cooperative Agreement No. G19AC00060 with the State of Alaska Department of Natural Resources.
Acknowledgments
The authors would like to thank Jason Ward, Chuck Werly and the Security Aviation team for their assistance integrating our instruments into the Cessna Conquest aircraft. These measurements would not have been possible without the piloting skills of Jeff McMillan. Thanks to John Lyons for help with retrieving and plotting seismic data for comparison, and to Matt Loewen for providing an internal review of the manuscript. Any use of trade, product, or firm names is for descriptive purposes only and does not imply endorsement by the United States Government.
Conflict of interest
The authors declare that the research was conducted in the absence of any commercial or financial relationships that could be construed as a potential conflict of interest.
Publisher’s note
All claims expressed in this article are solely those of the authors and do not necessarily represent those of their affiliated organizations, or those of the publisher, the editors and the reviewers. Any product that may be evaluated in this article, or claim that may be made by its manufacturer, is not guaranteed or endorsed by the publisher.
Supplementary material
The Supplementary Material for this article can be found online at: https://www.frontiersin.org/articles/10.3389/feart.2023.1088056/full#supplementary-material
Footnotes
1We use a 3-sigma threshold above the noise level to define the instrument detection limit, as suggested by (Theys et al., 2019). We note, however, that our TROPOMI image of the Cook Inlet (Supplementary Figure S3) contains 5785 pixels, 16 of which are expected to fall outside the 3-sigma threshold based on noise statistics alone (false detections). We therefore suggest using a 4-sigma confidence level or higher for a more robust single-pixel detection limit.
References
Aiuppa, A., Bitetto, M., Donne, D. D., Paolo, F., Monica, L., Tamburello, G., et al. (2021). Volcanic CO2 tracks the incubation period of basaltic paroxysms. Sci. Adv. 7, eabh0191. doi:10.1126/sciadv.abh0191
Aiuppa, A., Federicao, C., Giudice, G., and Gurrieri, S. (2005). Chemical mapping of a fumarolic field: La fossa crater, vulcano Island (aeolian islands, Italy). Geophys. Res. Lett. 32, L13309. doi:10.1029/2005GL023207
Aiuppa, A., Moretti, R., Federico, C., Giudice, G., Gurrieri, S., Liuzzo, M., et al. (2007). Forecasting Etna eruptions by real-time observation of volcanic gas composition. Geology 35, 1115. doi:10.1130/G24149A.1
Arellano, S., Galle, B., Apaza, F., Avard, G., Barrington, C., Bobrowski, N., et al. (2021). Synoptic analysis of a decade of daily measurements of SO2 emission in the troposphere from volcanoes of the global ground-based network for observation of volcanic and atmospheric change. Earth Syst. Sci. Data 13, 1167–1188. doi:10.5194/essd-13-1167-2021
Baer, D., Paul, J., Gupta, M., and O’Keefe, A. (2002). Sensitive absorption measurements in the near-infrared region using off-axis integrated-cavity-output spectroscopy. Appl. Phys. B 75, 261–265. doi:10.1007/s00340-002-0971-z
Bluth, G. J. S., Shannon, J. M., Watson, I. M., Prata, A. J., and Realmuto, V. J. (2007). Development of an ultra-violet digital camera for volcanic SO2 imaging. J. Volcanol. Geotherm. Res. 161, 47–56. doi:10.1016/j.jvolgeores.2006.11.004
Bobrowski, N., and Giuffrida, G. (2012). Bromine monoxide/sulphur dioxide ratios in relation to volcanological observations at Mt. Etna 2006–2009. Solid earth. 3, 433–445. doi:10.5194/se-3-433-2012
Bobrowski, N., Hönninger, G., Galle, B., and Platt, U. (2003). Detection of bromine monoxide in a volcanic plume. Nature 423, 273–276. doi:10.1038/nature01625
Bobrowski, N., Honninger, G., Lohberger, F., and Platt, U. (2006). Idoas: A new monitoring technique to study the 2D distribution of volcanic gas emissions. J. Volcanol. Geotherm. Res. 150, 329–338. doi:10.1016/j.jvolgeores.2005.05.004
Bobrowski, N., von Glasow, R., Aiuppa, A., Inguaggiato, S., Louban, I., Ibrahim, O. W., et al. (2007). Reactive halogen chemistry in volcanic plumes. J. Geophys. Res. 112, D06311. doi:10.1029/2006JD007206
Bogumil, K., Orphal, J., Homann, T., Voigt, S., Spietz, P., Fleischmann, O. C., et al. (2003). Measurements of molecular absorption spectra with the SCIAMACHY pre-flight model: Instrument characterization and reference data for atmospheric remote-sensing in the 230–2380 nm region. J. Photochem. Photobiol. A Chem. 157, 167–184. doi:10.1016/S1010-6030(03)00062-5
Burton, M., Allard, P., Mure, F., and La Spina, A. (2007). Magmatic gas composition reveals the source depth of slug-driven strombolian explosive activity. Science 317, 227–230. doi:10.1126/science.1141900
Cameron, C. E., Crass, S. W., and Staff, A. V. O. (2022b). Geologic database of information on volcanoes in Alaska (GeoDIVA). Alaska Div. Geol. Geophys. Surv. Digital Data Ser. 20. doi:10.14509/30901
Cameron, C. E., Schaefer, J. R., and Perreault, J. M. (2022a). Historically active volcanoes of Alaska. Alsk. Div. Geol. Geophys. Surv Misc. Publ. 133 ver. 5 2 sheets doi:10.14509/30851
Casadevall, T. J. (1994). Volcanic ash and aviation safety: Proceedings of the first international symposium on volcanic ash and aviation safety. U. S. Geol. Surv. Bull. 2047, 464. doi:10.3133/b2047
Christenson, B. W. (2000). Geochemistry of fluids associated with the 1995-1996 eruption of Mt. Ruapehu, New Zealand: Signatures and processes in the magmatic-hydrothermal system. J. Volcanol. Geotherm. Res. 97, 1–30. doi:10.1016/S0377-0273(99)00167-5
de Moor, J. M., Aiuppa, A., Avard, G., Wehrmann, H., Dunbar, N., Muller, C., et al. (2016). Turmoil at Turrialba Volcano (Costa Rica): Degassing and eruptive processes inferred from high-frequency gas monitoring. J. Geophys. Res. Solid Earth 121, 5761–5775. doi:10.1002/2016JB013150
Deutschmann, T., Beirle, S., Frieß, U., Grzegorski, M., Kern, C., Kritten, L., et al. (2011). The Monte Carlo atmospheric radiative transfer model McArtim: Introduction and validation of Jacobians and 3D features. J. Quant. Spectrosc. Radiat. Transf. 112, 1119–1137. doi:10.1016/j.jqsrt.2010.12.009
Donovan, A., Tsanev, V., Oppenheimer, C., and Edmonds, M. (2014). Reactive halogens (BrO and OClO) detected in the plume of soufriere hills Volcano during an eruption hiatus. Geochem. Geophys. Geosystems 15, 3346–3363. doi:10.1002/2014GC005419
Doukas, M. P. (1995). A compilation of sulfur dioxide and carbon dioxide emission-rate data from Cook inlet volcanoes (Redoubt, Spurr, Iliamna, and augustine), Alaska during the period from 1990 to 1994. U.S. Geol. Surv, 16. Open-File Rep. 95-55 doi:10.3133/ofr9555
Doukas, M. P. (2002). A new method for GPS- based wind speed determinations during airborne volcanic plume measurements. U.S. Geol. Surv., 1–13. Open-File Rep. 02-395 doi:10.3133/ofr02395
Doukas, M. P., and McGee, K. A. (2007). A compilation of gas emission-rate data from volcanoes of Cook inlet (Spurr, Crater Peak, Redoubt, Iliamna, and augustine) and Alaska Peninsula (Douglas, fourpeaked, griggs, Mageik, Martin, peulik, ukinrek maars, and veniaminof), Alaska, from 1995-2006. U.S. Geol. Surv., 16. Open-File Rep. 2007-1400 doi:10.3133/ofr20071400
Edmonds, M., Herd, R. A., Galle, B., and Oppenheimer, C. M. (2003). Automated, high time-resolution measurements of SO2 flux at Soufriere Hills Volcano, Montserrat. Bull. Volcanol. 65, 578–586. doi:10.1007/s00445-003-0286-x
Edmonds, M., and Wallace, P. J. (2017). Volatiles and exsolved vapor in volcanic systems. Elements 13, 29–34. doi:10.2113/gselements.13.1.29
Ewert, J. W., Diefenbach, A. K., and Ramsey, D. W. (2018). 2018 update to the U.S. Geological survey national volcanic threat assessment. USGS Sci. Investig, 50. Rep. 2018– 5140 doi:10.3133/sir20185140
Fuchs, C., Kuhn, J., Bobrowski, N., and Platt, U. (2021). Quantitative imaging of volcanic SO2 plumes using Fabry-Pérot interferometer correlation spectroscopy. Atmos. Meas. Tech. 14, 295–307. doi:10.5194/amt-14-295-2021
Galle, B., Johansson, M., Rivera, C., Zhang, Y., Kihlman, M., Kern, C., et al. (2010). Network for observation of volcanic and atmospheric change (NOVAC)—a global network for volcanic gas monitoring: Network layout and instrument description. J. Geophys. Res. 115, D05304. doi:10.1029/2009JD011823
Galle, B., Oppenheimer, C., Geyer, A., Mcgonigle, A. J. S., Edmonds, M., and Horrocks, L. (2002). A miniaturised ultraviolet spectrometer for remote sensing of SO2 fluxes: A new tool for volcano surveillance. J. Volcanol. Geotherm. Res. 119, 241–254. doi:10.1016/S0377-0273(02)00356-6
General, S., Bobrowski, N., Pöhler, D., Weber, K., Fischer, C., and Platt, U. (2014a). Airborne I-DOAS measurements at Mt. Etna: BrO and OClO evolution in the plume. J. Volcanol. Geotherm. Res. 300, 175–186. doi:10.1016/j.jvolgeores.2014.05.012
General, S., Pöhler, D., Sihler, H., Bobrowski, N., Frieß, U., Zielcke, J., et al. (2014b). The Heidelberg airborne imaging DOAS instrument (HAIDI) – A novel imaging DOAS device for 2-D and 3-D imaging of trace gases and aerosols. Atmos. Meas. Tech. Discuss. 7, 2187–2257. doi:10.5194/amtd-7-2187-2014
Gerlach, T. M. (2004). Volcanic sources of tropospheric ozone-depleting trace gases. Geochem. Geophys. Geosystems 5, 1–16. doi:10.1029/2004GC000747
Giggenbach, W. F. (1987). Redox processes governing the chemistry of fumarolic gas discharges from White Island, New Zealand. Appl. Geochem. 2, 143–161. doi:10.1016/0883-2927(87)90030-8
Giggenbach, W. F., and Sheppard, D. S. (1989). “Variations in the temperature and chemistry of White Island fumarole discharges 1972–1985,” in The 1976-82 eruption sequence at white Island volcano (whakaari), bay of plenty, New Zealand. Editors B. F. Houghton, and I. A. Nairn (New Zealand Geological Survey bulletin 103), 119–126. Available at: https://shop.gns.cri.nz/b103-pdf/.
Gliß, J., Bobrowski, N., Vogel, L., Pöhler, D., and Platt, U. (2015). OClO and BrO observations in the volcanic plume of Mt. Etna-implications on the chemistry of chlorine and bromine species in volcanic plumes. Atmos. Chem. Phys. 15, 5659–5681. doi:10.5194/acp-15-5659-2015
Grainger, J. F., and Ring, J. (1962). Anomalous fraunhofer line profiles. Nature 193, 762. doi:10.1038/193762a0
Griggs, R. F. (1922). The Valley of ten thousand smokes. Washington, D.C.: National Geographic Society.
Gunawan, H., Caudron, C., Pallister, J., Primulyana, S., Christenson, B., Mccausland, W., et al. (2017). “New insights into Kawah Ijen ’ s volcanic system from the wet volcano workshop experiment,” in Geochemistry and geophysics of active volcanic lakes. Editors T. Ohba, B. Capaccioni, and C. Caudron (Geological Society of London). doi:10.1144/SP437.7
Gutmann, A., Bobrowski, N., Roberts, T. J., Rüdiger, J., and Hoffmann, T. (2018). Advances in bromine speciation in volcanic plumes. Front. Earth Sci. 6. doi:10.3389/feart.2018.00213
Hildreth, W., and Fierstein, J. (2002). Geologic map of the Katmai volcanic cluster, Katmai national park, Alaska. U.S. Geol. Surv. IMAP 2778. doi:10.3133/i2778
Hildreth, W., and Fierstein, J. (2000). Katmai volcanic cluster and the great eruption of 1912. Bull. Geol. Soc. Am. 112, 1594–1620. doi:10.1130/0016-7606(2000)112<1594:KVCATG>2.0.CO;2
Keith, T. E. C. (1995). The 1992 eruptions of Crater Peak vent, Mount Spurr volcano, Alaska. USGS Bull. 2139. doi:10.3133/b2139
Kelly, P. J., Kern, C., Roberts, T. J., Lopez, T., Werner, C., and Aiuppa, A. (2013). Rapid chemical evolution of tropospheric volcanic emissions from Redoubt Volcano, Alaska, based on observations of ozone and halogen-containing gases. J. Volcanol. Geotherm. Res. 259, 317–333. doi:10.1016/j.jvolgeores.2012.04.023
Kelly, P., Sutton, A., Elias, T., Kern, C., Clor, L., and Baer, D. (2017). “Real-time, high frequency (1 Hz), in situ measurement of HCl and HF gases in volcanic plumes with a novel cavity-enhanced, laser-based instrument,” in AGU fall meeting abstracts (new orleans). Available at: https://agu.confex.com/agu/fm17/meetingapp.cgi/Paper/239617.
Kern, C., Aiuppa, A., and de Moor, J. M. (2022). A golden era for volcanic gas geochemistry? Bull. Volcanol. 84, 43–11. doi:10.1007/s00445-022-01556-6
Kern, C., Deutschmann, T., Vogel, L., Wöhrbach, M., Wagner, T., and Platt, U. (2010a). Radiative transfer corrections for accurate spectroscopic measurements of volcanic gas emissions. Bull. Volcanol. 72, 233–247. doi:10.1007/s00445-009-0313-7
Kern, C., and Kelly, P. (2023). Airborne survey of gas emissions from volcanoes in the Cook inlet and northern Alaska Peninsula, 2021. U.S. Geological Survey data release. doi:10.5066/P9YTK9PE
Kern, C., Kick, F., Lübcke, P., Vogel, L., Wöhrbach, M., and Platt, U. (2010b). Theoretical description of functionality, applications, and limitations of SO2 cameras for the remote sensing of volcanic plumes. Atmos. Meas. Tech. 3, 733–749. doi:10.5194/amt-3-733-2010
Kern, C., Lerner, A. H., Elias, T., Nadeau, P. A., Holland, L., Kelly, P. J., et al. (2020). Quantifying gas emissions associated with the 2018 rift eruption of Kīlauea Volcano using ground-based DOAS measurements. Bull. Volcanol. 82, 55. doi:10.1007/s00445-020-01390-8
Kern, C., and Lyons, J. J. (2018). Spatial distribution of halogen oxides in the plume of Mount Pagan volcano, Mariana Islands. Geophys. Res. Lett. 45, 9588–9596. doi:10.1029/2018GL079245
Kern, C., Masias, P., Apaza, F., Reath, K. A., and Platt, U. (2017). Remote measurement of high preeruptive water vapor emissions at Sabancaya volcano by passive differential optical absorption spectroscopy. J. Geophys. Res. Solid Earth 122, 3540–3564. doi:10.1002/2017JB014020
Kern, C. (2009). Spectroscopic measurements of volcanic gas emissions in the ultra-violet wavelength region. Available at: http://www.ub.uni-heidelberg.de/archiv/9574.
Kern, C., Werner, C., Elias, T., Sutton, A. J., and Lübcke, P. (2013). Applying UV cameras for SO2 detection to distant or optically thick volcanic plumes. J. Volcanol. Geotherm. Res. 262, 80–89. doi:10.1016/j.jvolgeores.2013.06.009
Kleipool, Q. L., Dobber, M. R., de Haan, J. F., and Levelt, P. F. (2008). Earth surface reflectance climatology from 3 years of OMI data. J. Geophys. Res. Atmos. 113, D18308–D18322. doi:10.1029/2008JD010290
Kuhn, J., Bobrowski, N., Lübcke, P., Vogel, L., and Platt, U. (2014). A Fabry-Perot interferometer-based camera for two-dimensional mapping of SO2 distributions. Atmos. Meas. Tech. 7, 3705–3715. doi:10.5194/amt-7-3705-2014
Lohberger, F., Hönninger, G., and Platt, U. (2004). Ground-based imaging differential optical absorption spectroscopy of atmospheric gases. Appl. Opt. 43, 4711–4717. doi:10.1364/AO.43.004711
Lopez, T., Tassi, F., Aiuppa, A., Galle, B., Rizzo, A. L., Fiebig, J., et al. (2017). Geochemical constraints on volatile sources and subsurface conditions at MountMount Martin, Mount Mageik, and trident volcanoes, Katmai volcanic cluster, Alaska. J. Volcanol. Geotherm. Res. 347, 64–81. doi:10.1016/j.jvolgeores.2017.09.001
Louban, I., Bobrowski, N., Rouwet, D., Inguaggiato, S., and Platt, U. (2009). Imaging DOAS for volcanological applications. Bull. Volcanol. 71, 753–765. doi:10.1007/s00445-008-0262-6
Lübcke, P., Bobrowski, N., Arellano, S., Galle, B., Garzón, G., Vogel, L., et al. (2014). BrO/SO2 molar ratios from scanning DOAS measurements in the NOVAC network. Solid earth. 5, 409–424. doi:10.5194/se-5-409-2014
Lübcke, P., Bobrowski, N., Illing, S., Kern, C., Alvarez Nieves, J. M., Vogel, L., et al. (2013). On the absolute calibration of SO2 cameras. Atmos. Meas. Tech. 6, 677–696. doi:10.5194/amt-6-677-2013
McClure, J. P. (2013). Anastigmatic imaging spectrograph. Available at: https://patents.google.com/patent/WO2013106307A1.
McClure, J. P. (2014). “The Schmidt-Czerny-Turner spectrograph,” in SPIE opt. Eng. + appl. Proc. Vol. 9189, photonic innov. Solut. Complex environ. Syst. II doi:10.1117/12.2061559
McElhoe, H. B., and Conner, W. D. (1986). Remote measurement of sulfur dioxide emissions using an ultraviolet light sensitive video system. J. Air Pollut. Control Assoc. 36, 42–47. doi:10.1080/00022470.1986.10466043
Merucci, L., Burton, M., Corradini, S., and Salerno, G. G. (2011). Reconstruction of SO2 flux emission chronology from space-based measurements. J. Volcanol. Geotherm. Res. 206, 80–87. doi:10.1016/j.jvolgeores.2011.07.002
Millan, M. (1980). Remote sensing of air pollutants. A study of some atmospheric scattering effects. Atmos. Environ. 14, 1241–1253. doi:10.1016/0004-6981(80)90226-7
Miller, T. P., McGimsey, R. G., Richter, D. H., Riehle, J. R., Nye, C. J., Yount, M. E., et al. (1998). Catalog of the historically active volcanoes of Alaska. U.S. Geol. Surv., 104. Open-File Rep. 98-582 doi:10.3133/ofr98582
Mizutani, Y., and Sugiura, T. (1966). The chemical equilibrium of the 2H2S+SO2=3S+2H2O reaction in solfataras of the nasudake volcano. Bull. Chem. Soc. Jpn. 39, 2411–2414. doi:10.1246/bcsj.39.2411
Mori, T., and Burton, M. (2006). The SO2 camera: A simple, fast and cheap method for ground-based imaging of SO2 in volcanic plumes. Geophys Res. Lett. 33, L24804. doi:10.1029/2006GL027916
Mori, T., Mori, T., Kazahaya, K., Ohwada, M., Hirabayashi, J., and Yoshikawa, S. (2006). Effect of UV scattering on SO2 emission rate measurements. Geophys. Res. Lett. 33, L17315–5. doi:10.1029/2006GL026285
Olmos, R., Barrancos, J., Rivera, C., Barahona, F., López, D. L., Henriquez, B., et al. (2007). Anomalous emissions of SO2 during the recent eruption of Santa Ana volcano, El Salvador, central America. Pure Appl. Geophys. 164, 2489–2506. doi:10.1007/s00024-007-0276-6
O’Neil, M. J. (2013). The merck index: An encyclopedia of chemicals, drugs, and biologicals 15th ed. Cambridge, UK: Royal Society of Chemistry.
Oppenheimer, C., Tsanev, V., Braban, C., Cox, R., Adams, J., Aiuppa, A., et al. (2006). BrO formation in volcanic plumes. Geochim. Cosmochim. Acta 70, 2935–2941. doi:10.1016/j.gca.2006.04.001
Platt, U., Lübcke, P., Kuhn, J., Bobrowski, N., Prata, F., Burton, M., et al. (2014). Quantitative imaging of volcanic plumes — results, needs, and future trends. J. Volcanol. Geotherm. Res. 300, 7–21. doi:10.1016/j.jvolgeores.2014.10.006
Platt, U., and Stutz, J. (2008). Differential optical absorption spectroscopy - Principles and applications. Berlin, Heidelberg: Springer. doi:10.1007/978-3-540-75776-4
Poland, M. P., Lopez, T., Wright, R., and Pavolonis, M. J. (2020). Forecasting, detecting, and tracking volcanic eruptions from space. Remote Sens. Earth Syst. Sci. 3, 55–94. doi:10.1007/s41976-020-00034-x
Queißer, M., Burton, M., Theys, N., Pardini, F., Salerno, G., Caltabiano, T., et al. (2019). TROPOMI enables high resolution SO2 flux observations from Mt. Etna, Italy, and beyond. Sci. Rep. 9, 957–1012. doi:10.1038/s41598-018-37807-w
Roman, D. C., and Power, J. A. (2011). Mechanism of the 1996-97 non-eruptive volcano-tectonic earthquake swarm at Iliamna Volcano, Alaska. Bull. Volcanol. 73, 143–153. doi:10.1007/s00445-010-0439-7
Roman, D. C., Power, J. A., Moran, S. C., Cashman, K. V., Doukas, M. P., Neal, C. A., et al. (2004). Evidence for dike emplacement beneath Iliamna Volcano, Alaska in 1996. J. Volcanol. Geotherm. Res. 130, 265–284. doi:10.1016/S0377-0273(03)00302-0
Schönhardt, A., Altube, P., Gerilowski, K., Krautwurst, S., Hartmann, J., Meier, A. C., et al. (2015). A wide field-of-view imaging DOAS instrument for two-dimensional trace gas mapping from aircraft. Atmos. Meas. Tech. 8, 5113–5131. doi:10.5194/amt-8-5113-2015
Schönhardt, A., Richter, A., Theys, N., and Burrows, J. V. P. (2017). Space-based observation of volcanic iodine monoxide. Atmos. Chem. Phys. 17, 4857–4870. doi:10.5194/acp-17-4857-2017
Schwaerzel, M., Emde, C., Brunner, D., Morales, R., Wagner, T., Berne, A., et al. (2020). Three-dimensional radiative transfer effects on airborne and ground-based trace gas remote sensing. Atmos. Meas. Tech. 13, 4277–4293. doi:10.5194/amt-13-4277-2020
Shinohara, H. (2005). A new technique to estimate volcanic gas composition: Plume measurements with a portable multi-sensor system. J. Volcanol. Geotherm. Res. 143, 319–333. doi:10.1016/j.jvolgeores.2004.12.004
Shinohara, H., Matsushima, N., Kazahaya, K., and Ohwada, M. (2011). Magma-hydrothermal system interaction inferred from volcanic gas measurements obtained during 2003-2008 at Meakandake volcano, Hokkaido, Japan. Bull. Volcanol. 73, 409–421. doi:10.1007/s00445-011-0463-2
Shinohara, H., Yoshikawa, S., and Miyabuchi, Y. (2015). “Degassing activity of a volcanic crater lake: Volcanic plume measurements at the yudamari crater lake, aso volcano, Japan,” in Volcanic lakes. Advances in Volcanology. Editors D. Rouwet, B. Christenson, F. Tassi, and J. Vandemeulebrouck (Berlin Heidelberg), 201–217. doi:10.1007/978-3-642-36833-2_8
Symonds, R. B., Gerlach, T. M., and Reed, M. H. (2001). Magmatic gas scrubbing: Implications for volcano monitoring. J. Volcanol. Geotherm. Res. 108, 303–341. doi:10.1016/S0377-0273(00)00292-4
Symonds, R. B., Reed, M. H., and Rose, W. I. (1992). Origin, speciation, and fluxes of trace-element gases at Augustine volcano, Alaska: Insights into magma degassing and fumarolic processes. Geochim. Cosmochim. Acta 56, 633–657. doi:10.1016/0016-7037(92)90087-Y
Syracuse, E. M., and Abers, G. A. (2006). Global compilation of variations in slab depth beneath arc volcanoes and implications. Geochem. Geophys. Geosystems 7. doi:10.1029/2005GC001045
Tack, F., Merlaud, A., Meier, A. C., Vlemmix, T., Ruhtz, T., Iordache, M. D., et al. (2019). Intercomparison of four airborne imaging DOAS systems for tropospheric NO2 mapping - the AROMAPEX campaign. Atmos. Meas. Tech. 12, 211–236. doi:10.5194/amt-12-211-2019
Tamburello, G., Agusto, M., Caselli, A., Tassi, F., Vaselli, O., Calabrese, S., et al. (2015). Intense magmatic degassing through the lake of Copahue volcano, 2013–2014. J. Geophys. Res. Solid Earth 120, 6071–6084. doi:10.1002/2015JB012160
Taran, Y., and Zelenski, M. (2015). “Systematics of water isotopic composition and chlorine content in arc-volcanic gases,” in The role of volatiles in the genesis, evolution and eruption of arc magmas. Editors G. F. Zellmer, and S. M. Straub (London: Geological Society), 237–262. doi:10.1144/SP410.5
Theys, N., Campion, R., Clarisse, L., Brenot, H., van Gent, J., Dils, B., et al. (2013). Volcanic SO2 fluxes derived from satellite data: A survey using OMI, GOME-2, IASI and MODIS. Atmos. Chem. Phys. 13, 5945–5968. doi:10.5194/acp-13-5945-2013
Theys, N., De Smedt, I., Roozendael, M. V., Froidevaux, L., Clarisse, L., and Hendrick, F. (2014). First satellite detection of volcanic OClO after the eruption of Puyehue-Cordon Caulle. Geophys. Res. Lett. 41, 667–672. doi:10.1002/2013GL058416
Theys, N., De Smedt, I., Yu, H., Danckaert, T., Van Gent, J., Hörmann, C., et al. (2017). Sulfur dioxide retrievals from TROPOMI onboard Sentinel-5 Precursor: Algorithm theoretical basis. Atmos. Meas. Tech. 10, 119–153. doi:10.5194/amt-10-119-2017
Theys, N., Hedelt, P., De Smedt, I., Lerot, C., Yu, H., Vlietinck, J., et al. (2019). Global monitoring of volcanic SO2 degassing from space with unprecedented resolution. Sci. Rep. 9, 2643–2710. doi:10.1038/s41598-019-39279-y
Theys, N., Van Roozendael, M., Dils, B., Hendrick, F., Hao, N., and De Mazière, M. (2009). First satellite detection of volcanic bromine monoxide emission after the Kasatochi eruption. Geophys. Res. Lett. 36, 1–5. doi:10.1029/2008GL036552
Vandaele, A. C., Hermans, C., and Fally, S. (2009). Fourier transform measurements of SO2 absorption cross sections: II. Temperature dependence in the 29 000-44 000 cm-1 (227-345 nm) region. J. Quant. Spectrosc. Radiat. Transf. 110, 2115–2126. doi:10.1016/j.jqsrt.2009.05.006
von Glasow, R. (2010). Atmospheric chemistry in volcanic plumes. Proc. Natl. Acad. Sci. U. S. A. 107, 6594–6599. doi:10.1073/pnas.0913164107
von Glasow, R., Bobrowski, N., and Kern, C. (2009). The effects of volcanic eruptions on atmospheric chemistry. Chem. Geol. 263, 131–142. doi:10.1016/j.chemgeo.2008.08.020
Wagner, T., Warnach, S., Beirle, S., Bobrowski, N., Jost, A., Pukite, J., et al. (2022). Investigation of 3D-effects for UV/vis satellite and ground based observations of volcanic plumes. Atmos. Meas. Tech. Discuss., 1–44. doi:10.5194/amt-2022-253
Wallace, P. J., Kamenetsky, V. S., and Cervantes, P. (2015). Melt inclusion CO2 contents, pressures of olivine crystallization, and the problem of shrinkage bubbles. Am. Mineral. 100, 787–794. doi:10.2138/am-2015-5029
Warnach, S., Bobrowski, N., Hidalgo, S., Arellano, S., Sihler, H., Dinger, F., et al. (2019). Variation of the BrO/SO2 molar ratio in the plume of Tungurahua volcano between 2007 and 2017 and its relationship to volcanic activity. Front. Earth Sci. 7, 1–14. doi:10.3389/feart.2019.00132
Waythomas, C. F., Miller, T. P., and Begét, J. E. (2000). Record of late holocene debris avalanches and lahars at Iliamna Volcano, Alaska. J. Volcanol. Geotherm. Res. 104, 97–130. doi:10.1016/S0377-0273(00)00202-X
Werner, C. a., Doukas, M. P., and Kelly, P. J. (2011). Gas emissions from failed and actual eruptions from Cook Inlet Volcanoes, Alaska, 1989–2006. Bull. Volcanol. 73, 155–173. doi:10.1007/s00445-011-0453-4
Werner, C. A., Kern, C., and Kelly, P. J. (2020a). Chemical evaluation of water and gases collected from hydrothermal systems located in the central Aleutian arc, August 2015. USGS Sci. Investig, 35. Rep. 2020–5043 doi:10.3133/sir20205043
Werner, C., Kelly, P. J., Doukas, M., Lopez, T., Pfeffer, M., McGimsey, R., et al. (2013). Degassing of CO2, SO2, and H2S associated with the 2009 eruption of Redoubt Volcano, Alaska. J. Volcanol. Geotherm. Res. 259, 270–284. doi:10.1016/j.jvolgeores.2012.04.012
Werner, C., Kern, C., Coppola, D., Lyons, J. J., Kelly, P. J., Wallace, K. L., et al. (2017). Magmatic degassing, lava dome extrusion, and explosions from Mount Cleveland volcano, Alaska, 2011-2015: Insight into the continuous nature of volcanic activity over multi-year timescales. J. Volcanol. Geotherm. Res. 337, 98–110. doi:10.1016/j.jvolgeores.2017.03.001
Werner, C., Power, J., Kelly, P., Prejean, S., and Kern, C. (2022). Characterizing unrest: A retrospective look at 20 years of gas emissions and seismicity at Iliamna Volcano, Alaska. J. Volcanol. Geotherm. Res. 422, 107448. doi:10.1016/j.jvolgeores.2021.107448
Werner, C., Rasmussen, D. J., Plank, T., Kelly, P. J., Kern, C., Lopez, T., et al. (2020b). Linking subsurface to surface using gas emission and melt inclusion data at Mount cleveland volcano, Alaska. Geochem. Geophys. Geosystems 21, 1–33. doi:10.1029/2019GC008882
Wilhelm, E., Battino, R., and Wilcock, R. J. (1977). Low-pressure solubility of gases in liquid water. Chem. Rev. 77, 219–262. doi:10.1021/cr60306a003
Keywords: volcanic gases, DOAS, spectroscopy, remote sensing, volatiles, imaging, volcanic plumes, hydrothermal systems
Citation: Kern C and Kelly PJ (2023) Weak degassing from remote Alaska volcanoes characterized with a new airborne imaging DOAS instrument and a suite of in situ sensors. Front. Earth Sci. 11:1088056. doi: 10.3389/feart.2023.1088056
Received: 03 November 2022; Accepted: 19 April 2023;
Published: 05 May 2023.
Edited by:
Nick Varley, University of Colima, MexicoReviewed by:
Simon Carn, Michigan Technological University, United StatesFelipe Aguilera, Catholic University of the North, Chile
Copyright © 2023 Kern and Kelly. This is an open-access article distributed under the terms of the Creative Commons Attribution License (CC BY). The use, distribution or reproduction in other forums is permitted, provided the original author(s) and the copyright owner(s) are credited and that the original publication in this journal is cited, in accordance with accepted academic practice. No use, distribution or reproduction is permitted which does not comply with these terms.
*Correspondence: Christoph Kern, Y2tlcm5AdXNncy5nb3Y=