 Yukari Naka*
 Eiichi Nakakita
- Disaster Prevention Research Institute, Kyoto University, Kyoto, Japan
Herein, climate change projections of localized extreme rainfall associated with the Baiu front (Baiu extreme rainfall) are investigated from June to August in Japan under two representative concentration pathway scenarios (RCP2.6 and RCP8.5) by analyzing the numerical simulations of a 5-km-mesh high-resolution regional climate model (NHRCM05), which gives us the probabilistic future projections by using ensemble simulations, and by conducting Pseudo Global Warming (PGW) experiments for two typical events (Kameoka heavy rainfall in 2012 and Hiroshima heavy rainfall in 2014) with the cloud-resolving model, which enables us to elucidate the mechanisms of future change. The NHRCM05 analysis revealed that the frequency of Baiu extreme rainfall would increase by 1.2-times under RCP2.6 and by ≥ 1.5-times under RCP8.5 compared with the present climate. Moreover, the maximum total rainfall would increase due to global warming. To elucidate the mechanisms of rainfall intensification, the PGW experimental results were analyzed. 2012-Kameoka PGW analysis revealed that the rainfall increasing rate was almost twofold compared to the theoretical Clausius-Clapeyron scaling, which was attributed to a nonlinear effect of intensification of the back-building dynamical structure by the convergence in the lower level and the strengthening of the updraft, resulting in localization of water vapor into the cumulonimbus that cause much more buoyancy. Meanwhile, 2014-Hiroshima event experiments indicated that the rainfall decreased with global warming due to water vapor consumption in upstream areas. However, the PGW of 2014-Hiroshima possibly happened to show a decreasing trend as further NHRCM05 analysis of events similar to 2014-Hiroshima showed an increasing trend in rainfall. This study highlights the importance of predicting future changes by combining results obtained from various methods, including climate model analysis or PGW, with a profound understanding of the implications and feature of each result as well as the fact that disaster prevention and adaptation measures are urgently needed.
1 Introduction
In Japan, quasi-stationary line-shaped rainfall areas frequently occur, causing severe disasters. This line-shaped heavy rainfall system is named “Senjo-Kousuitai” in Japanese because of its characteristic shape (Kato, 2020) and can be hazardous because the rainfall stagnates in almost the same area for a few hours to half a day. Senjo-kousuitai is caused by various weather phenomena such as fronts, cyclones, or typhoons. It recently occurred in a rainy season called the “Baiu” season (June–July), characterized by a stationary front called the “Baiu” front (T’u and Hwang, 1945; Matsumoto et al., 1971; Kato and Goda, 2001) and a large amount of moisture transport from the East China Sea and the periphery flow from the Pacific High. Such senjo-kousuitai associated with the Baiu front (hereafter referred to as Baiu extreme rainfall) have caused considerable damage, including human fatalities, almost annually after approximately the 2010s in Japan and are one of the main factors responsible for causing severe water-related disasters, including landslides, and pluvial and fluvial flooding, particularly in middle-sized river basins compared to large-sized (P. C. et al., 2018). Moreover, its rapid onset impedes accurate forecasting. The recent unprecedented Baiu extreme rainfall is presumed to be caused by global warming (Imada et al., 2020; Kawase et al., 2022). For instance, according to the Automated Meteorological Data Acquisition System (AMeDAS) at the Asakura station (Fukuoka prefecture), the 2017 Northern Kyusyu heavy rainfall event featured the largest 24-h rainfall total and was responsible for killing 70 people (Cabinet Office, 2017). Furthermore, the 2020 Kumamoto heavy rainfall event formed a relatively large-scale rain band associated with the Baiu front. This subsequently triggered extensive flooding, including a large river (Osakada et al., 2020), and resulted in the death of 60 people (Cabinet Office, 2020). Considering the potential threats posed by Baiu extreme rainfall events, it is essential to develop effective means of projecting detailed future changes in Baiu extreme rainfall under climate change due to global warming.
Baiu extreme rainfall mostly represents a line-shaped back-building-type convective system (Bluestein and Jain, 1985; Seko, 2010) which is a localized phenomenon with a complicated hierarchical spatial structure (Ninomiya and Akiyama, 1991; Wakazuki et al., 2006). It has a spatial scale of meso-β (20–200 km) generated by cumulonimbus organization (a spatial scale of meso-γ: 2–20 km) in the presence of warm and humid air inflow from the southern ocean of Japan toward a stationary front (meso-α: 200–2,000 km). The wind in Figure 1 shows the relative vector of the direction of movement of the Baiu extreme rainfall system. Cumulonimbus develops and moves to the leeward side of the mid-level wind, and convergence occurs at a lower level between the downdraft associated with precipitation and low-level inflow. This, subsequently, induces the generation of a new updraft and continuous formation of new cumulonimbus clouds at the back tip of the line-shaped convective system (back-building). Although individual cumulonimbus clouds develop and disappear continuously, the entire rainfall system becomes stationary, thereby causing the formation of a line-shaped accumulated rainfall spatial distribution on the ground. As the Baiu extreme rainfall has highly localized and complicated characteristics, a model simulation with high spatiotemporal resolution is required to estimate its detailed future changes accurately.
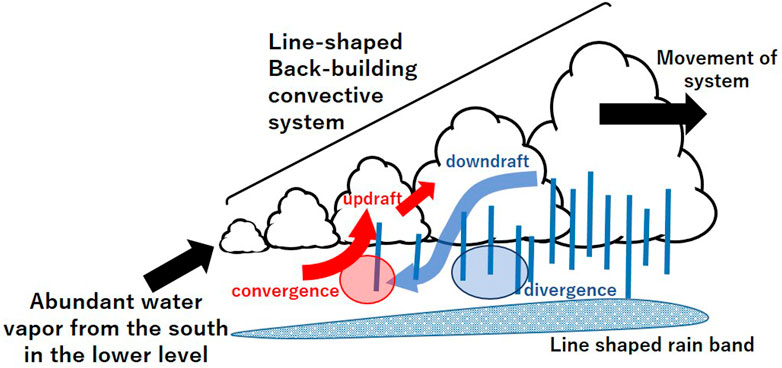
FIGURE 1. Schematic figure of a Back-building convective system. The vectors of updraft (red) and downdraft (blue) show the relative wind to the movement direction of each cumulonimbus.
Numerous previous studies have been conducted to project future changes in heavy rainfall during the Baiu season in Japan, and one of these approaches is the analysis of climate model simulations. The analysis of climate model simulations is mainly a probabilistic approach that uses ensemble simulations because the resolution is not very high. The studies estimated the statistics of future changes in weather events by using the simulations of the atmospheric global climate models (Kitoh and Uchiyama, 2006; Kusunoki et al., 2011; Hirahara et al., 2012; Okada et al., 2017; Endo et al., 2021) or regional climate models (Kanada et al., 2012; Nakakita et al., 2012; Osakada and Nakakita, 2018a; Nakakita and Osakada, 2018) by assuming certain global warming scenarios. Some studies have used regional climate models; Kanada et al. (2012), in particular, demonstrated that the fraction of intense rainfall (>100 mm/day) to total rainfall amounts over western Japan would increase in early July under the future climate. These predictions were made using a non-hydrostatic regional climate model with a 5-km grid spacing (NHRCM05 hereafter), a very high resolution among climate models, under the A1B scenario. The A1B scenario corresponds to an approximately 3°C increase in the global average surface temperature from the pre-industrial period, previously proposed by the Intergovernmental Panel on Climate Change (IPCC) Special Report on Emission Scenarios (SRES; IPCC, 2000). The precipitation output of NHRCM05 features a high spatial resolution (5 km × 5 km) and temporal resolution (30-min interval), consequently opening a window for accurate simulations of localized intense precipitation, such as the Baiu extreme rainfall itself of the meso-β spatial scale (20–200 km). Furthermore, Nakakita et al. (2012) manually selected Baiu extreme rainfall events from the 30-min precipitation distribution of NHRCM05 under a SRES A1B scenario and also revealed increasing trends of Baiu extreme rainfall in early July as well as nationwide in Japan. Based on Nakakita et al. (2012); Nakakita and Osakada (2018); Osakada and Nakakita (2018a) analyzed NHRCM05 under the Representative Concentration Pathways scenario (RCP; IPCC, 2013) with a radiative forcing of 8.5 W/m2 (RCP8.5), corresponding to an approximately 4°C increase in the global average surface temperature from the pre-industrial period. These studies indicated that Baiu extreme rainfall is also initiated in Hokkaido. This was a notable finding, as Hokkaido represents the northern region of Japan, which has never experienced Baiu extreme rainfall under the present climate of NHRCM05. In addition to qualitative analyses of the frequency, quantitative future projections of rainfall amounts were also conducted. Osakada and Nakakita (2018b) analyzed the Baiu extreme rainfall events obtained from NHRCM05 and reported that the maximum accumulated rainfall per heavy rainfall duration would increase in the future climate under RCP8.5.
In addition to climate model-based analyses, some previous studies have applied the pseudo global warming (PGW) experiment to Baiu extreme rainfall events. PGW is one of the methods that evaluate the impact of global warming by simulating a certain weather event (in some cases—the ideal experiment) with a cloud-resolving model under a “pseudo warming” atmospheric condition. Although it is difficult to generalize the PGW results, it enables us to estimate future projections and discuss the mechanisms of future changes from calculated results with a significantly higher spatiotemporal resolution. The “pseudo warming” condition can be created by adding warming increments such as temperature and water vapor to the present climate atmospheric condition as initial and boundary conditions. Several studies have obtained these warming increments from the simulation outputs of climate models. For instance, Hibino et al. (2018) conducted PGW for the 2014 Hiroshima heavy rainfall event under a 4 K warmer condition. They analyzed the offset effects between atmospheric un-stabilization owing to the increase in water vapor and atmospheric stabilization because of the decrease in temperature lapse rate. Meanwhile, Nayak and Takemi (2020) conducted PGW for the 2017 Northern Kyusyu and 2018 July heavy rainfall events under RCP8.5. In both cases, rainfall intensity increased under future climate conditions, and the scaling rate of rainfall intensity to temperature changes differed from that expected from the theoretical relationship. Osakada and Nakakita (2020) also conducted PGW for the 2012 Kameoka heavy rainfall event under RCP8.5 and revealed that the intensification of a back-building dynamical structure is one of the drivers behind the increased rainfall amount of Baiu extreme rainfall in the future climate.
As described above, several studies on the Baiu front and extreme rainfall have been conducted using various approaches. However, the climate model-based approach is difficult to fully analyze the mechanism of future changes because of the relatively coarser resolution, whereas the PGW approach is difficult to generalize its results. Therefore, this study aims to provide reliable predictions of future changes and to investigate the mechanisms of future changes using both approaches. We believe that the two approaches compensate for the shortcomings of both results and that comparing each result allows for a deeper interpretation of the meaning of the results. In addition, while most previous studies were based on a single scenario, we aimed to clarify the relationship between global warming and future changes using multiple scenarios in our analysis.
This study analyzed climate model simulations and PGW experiments under RCP8.5 and RCP2.6 scenarios to estimate reliable and gradual changes in the Baiu extreme rainfall and investigate the mechanisms of future changes. The main objectives of this study were 1) to estimate the future changes in the frequency and intensity of the Baiu extreme rainfall in Japan from the meso-β scale (20–200 km) by analyzing the precipitation simulation of NHRCM05 under RCP2.6 (scenario to prevent the global average surface temperature from rising by more than 2°C) and RCP8.5. The aim of this study was based on that of Osakada and Nakakita 2018a; Osakada and Nakakita 2018b). The second objective of this study was 2) to conduct PGW experiments for two Baiu extreme rainfall events (the 2012 Kameoka and 2014 Hiroshima heavy rainfall events shown in Figures 2A, B) under RCP2.6 and RCP8.5, consequently elucidating future changes and the mechanisms of change. This study was based on the experience of Osakada and Nakakita (2020; 2021). Finally, 3) the results of the NHRCM05 and PGW simulations are compared and discussed comprehensively. The remainder of this study is organized as follows. The analysis of the climate model simulation is described in Section 3. The PGW experiments are presented in Section 4, and the results from both analyses are compared and discussed in Section 5. Finally, section 6 summarizes the findings of this study.
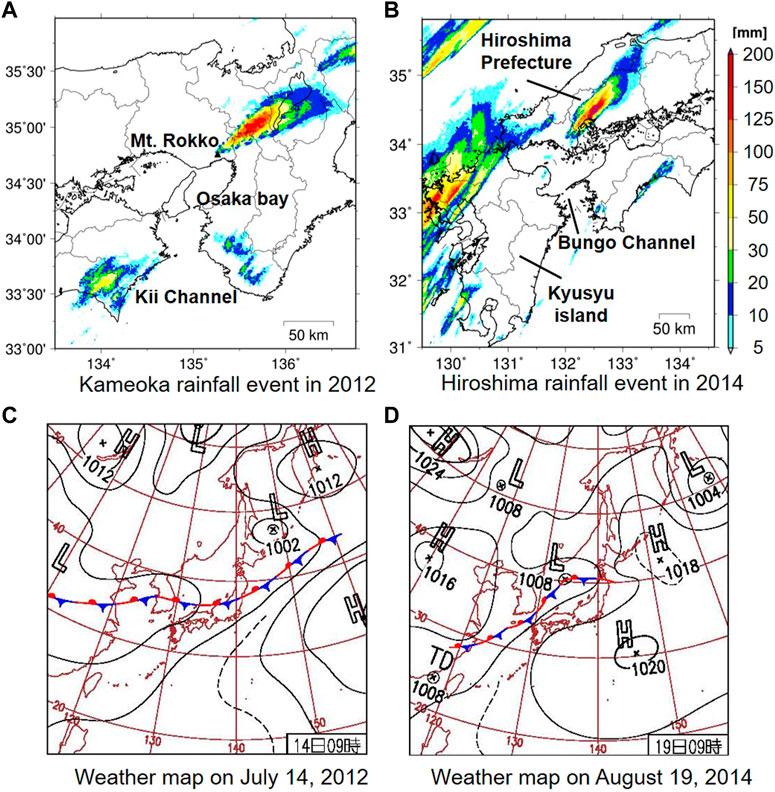
FIGURE 2. The characteristics of target events analyzed in PGW experiments. (A and B) Spatial distribution of JMA-Radar-AMeDAS accumulated rainfall for the 2012-Kameoka event (6-h accumulation from 00:00JST on July 15th to 06:00JST on 15 July 2012) and for the 2014-Hiroshima event (8-h from 21:00JST on August 19th to 05:00JST on 20 August 2014). (C and D) Weather map at 09:00JST on 14 July 2012 and at 09:00 JST on 19 August 2014.
2 Materials and methods
2.1 Climate model simulation-based analysis
The analyzed climate model dataset was computed using a non-hydrostatic regional climate model with 5-km grid spacing, NHRCM05 (Kitoh et al., 2015) under RCP2.6 and RCP8.5. NHRCM05 was generated by dynamical downscaling from the atmospheric global climate model MRI-AGCM3.2S (Mizuta et al., 2012). The NHRCM05 simulation period included 20-year present (1981–2000) and future (2077–2096) climate projections. The ensemble members were represented by two members of the present climate (p1 and p2 hereafter), one of RCP2.6 (rcp26_c0), and four of RCP8.5. The two ensemble members of present climate and four ensemble members of RCP8.5 included sea surface temperature (SST) perturbed ensembles (referred to RCP8.5 members as rcp85_c0–c3) (Mizuta et al., 2014). The information of each dataset is shown Supplementary Table S1. The present climate is simulated based on observation SST from 1980 to 2000 and small perturbation of SST and initial condition is added for p2. For future climate, c1–c3 were created by the cluster analysis of SST change patterns projected by the 28 models in the Coupled Model Intercomparison Project phase 5 (CMIP5) (Taylor et al., 2012). In addition, c0 represents the total mean of 28 models, and the patterns of c0 and c2 are associated with El-Nino. However, c1 is opposite to c2, whereas c3 embraces significant warming in the western North Pacific region. Here, there is a resolution limitation in representing Baiu extreme rainfall which has a spatial scale of meso-β in this dataset, as shown in previous studies (Kato, 2020; Oizumi et al., 2020), and it is undeniable that the dataset of NHRCM05 could miss some localized cases. However, for the purpose of statistical analysis of future trends, Baiu extreme rainfall is defined as a case that meets the following criteria.
The spatiotemporal precipitation distributions of the NHRCM05 datasets were used to manually select the Baiu extreme rainfall from June 1 to August 31 by referring to the criteria listed in Supplementary Table S2 (Nakakita et al., 2012; Nakakita and Osakada, 2018). As Nakakita and Osakada (2018) described, even if a tropical cyclone affects the Baiu front remotely, we selected all Baiu extreme rainfall that is not directly caused by a tropical cyclone. Furthermore, we derived statistics of future changes in the Baiu extreme rainfall. Since some Baiu extreme rainfall can also occur in August (if associated with a stationary front), we included August in the analysis. Baiu extreme rainfall was selected only from land areas, except Okinawa Prefecture, located in the southern region of Japan. This decision was sensible because the Baiu season in Okinawa was approximately 1 month earlier than in other regions (Okada and Yamazaki, 2012). In addition, Okinawa is characterized by a subtropical climate, thereby signifying different characteristics during the Baiu season compared with other regions. Moreover, localized Baiu extreme rainfall often occurs inland due to small triggers, such as topography. In some cases, which were caused by large-scale convergence of the Baiu front, such as the 2020 Kumamoto heavy rainfall event, may have been generated from regions over the sea; however, if a section of the line-shaped rain band also covered land areas, we included these events in the analysis because they can induce severe disasters within these regions. Hence, although an all-encompassing analysis is ideally needed, we analyzed only land areas because of their phenomenological characteristics, and heavy rainfall over land can cause disasters.
To analyze the intensity of the Baiu extreme rainfall, the duration of heavy rainfall and the maximum accumulated rainfall were estimated for all Baiu extreme rainfall events retrieved from NHRCM05, while future changes were also investigated. The following definitions proposed by Osakada and Nakakita (2018b) were used for each index: (i) duration refers to “the duration from the appearance to decay (or move away) of the rainfall area over 50 mm/h, however, the intermittent of up to 2-h can be permitted”; and (ii) accumulated rainfall refers to “the value at one grid cell that records the maximum accumulated rainfall during the duration defined above.” For example, if the heavy rainfall over 50 mm/h starts at 04:30, and it weakened at 05:00 once but intensified over 50 mm/h again on 6:00 and continued to 08:30, then the duration is defined as 4-h as shown in Supplementary Figure S1. The 2-h limitation can be explained by the necessity to maintain consistency with the extraction criteria of the Baiu extreme rainfall, as shown in Supplementary Table S2. On this basis, we analyzed intermittent periods of up to 2 h. Moreover, we manually checked and estimated the duration of events as we focused on the stagnation of the entire rainfall system itself. Therefore, one grid shifts of a rainfall area over 50 mm/h did not necessarily imply that the entire rainfall system had shifted.
To verify the NHRCM05 output quantitatively, 14 observational Baiu extreme rainfall events in Japan were also analyzed using surface composite rainfall data from the eXtended RAdar Information Network (XRAIN). The analyzed observational events are listed in Supplementary Table S3. XRAIN is operated by the Ministry of Land, Infrastructure, Transport, and Tourism of Japan and was installed in 2010 as a weather radar network. XRAIN covers major urban areas in Japan with X-band polarimetric radars, which can effectively retrieve accurate rain rates. Moreover, C-band polarimetric radars that can embrace larger areas, compared with X-band radar, have been combined with the evolutionally developed XRAIN since 2016 to achieve a new accurate observational network with a spatially wide measurement footprint (Yamaji et al., 2016). XRAIN data are characterized by a high spatial resolution (250 m × 250 m) and temporal resolution (1-min interval). In our analysis, we calculated the average estimates from XRAIN data spatiotemporally to match the NHRCM05 resolution. We then assessed the duration and accumulated rainfall in the same manner as for the NHRCM05 events.
2.2 PGW-based analysis
This subsection describes the data and experimental settings of the PGW numerical experiments. PGW experiments were applied to the Kameoka rainfall event that occurred in Kameoka City, Kinki region in July 2012 (2012-Kameoka event hereafter), and the Hiroshima rainfall event that occurred in Hiroshima City, Chugoku region in August 2014 (2014-Hiroshima event hereafter). Both were typical Baiu extreme rainfall events in Japan. The details of each event are described in Section 4. For PGW, we used the Cloud Resolving Storm Simulator (CReSS) version 3.4.3 (Tsuboki and Sakakibara, 2002), a cloud-resolving, non-hydrostatic, quasi-compressible atmospheric model designed for highly accurate simulations of meso-scale phenomena. In particular, we applied version 3.4.3, which considers the falling velocity of cloud particles. The horizontal resolution was set to 500 m for the 2012-Kameoka event and 1,000 m for the 2014-Hiroshima event. Both events were somewhat localized, with some surrounding rainfall disturbances around the 2014-Hiroshima event. Accordingly, we set a broader calculation area for the 2014-Hiroshima event with a coarser resolution than those for the 2012-Kameoka event. Hibino et al. (2018) conducted the numerical simulation with 500-m resolution for 2014-Hiroshima event, and Oizumi et al. (2020) also showed the effectiveness of 250-m resolution simulation for 2014-Hiroshima event. However, our aim was to represent Baiu extreme rainfall in all experiments including the PGW experiments (Osakada and Nakakita, 2021), and to evaluate the effects of global warming on the event. Moreover, since even 1000-m resolution is sufficient to simulate mesoscale convective systems (Prein et al., 2021), then we conducted the PGW experiments simulation with 1000-m resolution for 2014-Hiroshima event. In particular, the vertical resolution was set to an average of 250 m with stretching in all experiments. The grid point value (GPV) analysis data of the Meso-Scale Model of the Japan Meteorological Agency (JMA) were utilized as the atmospheric initial and boundary values, whereas the boundary data with a 3 h resolution were considered. The daily mean SST from JMA NEAR-GOOS was used as the SST boundary condition. The other main experimental designs are presented in Supplementary Table S4, and Figures 3B, C shows the calculation area for each experiment.
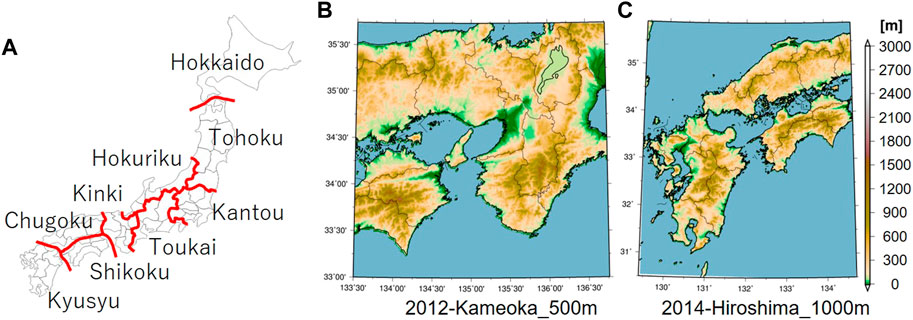
FIGURE 3. (A) The name of region in Japan, (B and C) calculation area of the simulations with CReSS for the 2012-Kameoka event and 2014-Hiroshima event.
We also added global warming increments to the initial and boundary values of the climate experiments. Consequently, the MRI-AGCM3.2S outputs under RCP8.5 and RCP2.6 scenarios were utilized. Although some ensemble members for the present and RCP8.5 future climate have been previously introduced, our study calculated and used the warming increments between the mean SST ensemble results of rcp85_c0 and the present climate p1. The variables for the increment included the monthly mean three-dimensional water vapor mixing ratio, potential temperature, and horizontal distribution of SST to consider thermodynamic changes. It was calculated as the future change between the 25-year mean values of rcp85_c0 and rcp26_c0 future climate (2075–2099) and p1 (1979–2003). For the 2012-Kameoka event, climate data in July were utilized, whereas the data in August were applied for the 2014-Hiroshima event experiments as the global warming increment. Although an identical atmospheric pattern will never occur in the future, PGW enables us to assess how global warming will have an impact on a specific event if the same event occurs under the future climate. In addition, because the model simulation is allowed to evolve dynamically during an event, the resulting changes caused by thermodynamic changes can also include dynamical changes (Lackmann, 2013).
To elucidate the mechanisms of future changes obtained from the PGW experiments, we focused on the dynamic structure of a back-building system, as shown in Figure 1, and the water vapor supply from the south. The dynamic structure of a series of cumulonimbus clouds is important for the precipitation process, resulting in rainfall on the ground. In addition, rainfall would not occur without an abundant supply of water vapor from the south, and the back-building system would not be maintained. Therefore, these two elements are essential for considering the mechanisms of future changes in the Baiu extreme rainfall. The convergence and updraft were analyzed as indices representing the dynamical structure, and convective available potential energy (CAPE) was analyzed as an index representing the water vapor supply. CAPE represents the buoyancy energy an air parcel can gain when it is adiabatically lifted. Fundamentally, the larger the value, the more water vapor exists at a lower level and the more unstable the atmosphere.
3 Future changes in the Baiu extreme rainfall through analysis of NHRCM05
3.1 Frequency
First, we analyzed future changes in the frequency of the Baiu extreme rainfall obtained from the NHRCM05. Figure 4A shows the occurrence points of all Baiu extreme rainfall events in Japan for each 20-year climate period. Figure 4B illustrates the frequency of occurrence in each region.
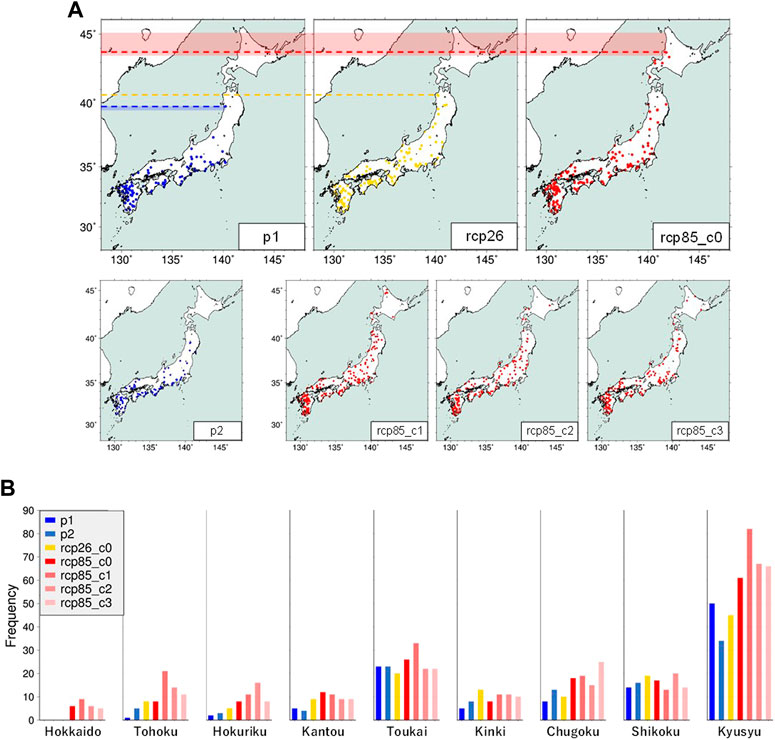
FIGURE 4. (A) Occurrence point and (B) occurrence frequency of Baiu extreme rainfall for 20 years projected by NHRCM05 in the present climate and future climate under RCP2.6 (rcp26_c0) and RCP8.5 scenarios. rcp85_c0, c1, c2, and c3 (p1 and p2) denote individual ensemble members of future (present) experiment with different SST change patterns. The SST patterns in rcp85_c0 and rcp85_c2 are similar to the observed interannual variation pattern of ENSO and the pattern of rcp85_c1 is an opposite characteristic to rcp85_c2. rcp85_c3 has larger warming in the western North Pacific. The dashed lines in (A) represent the northernmost area of Baiu extreme rainfall for each climate and the shades for the present climate and RCP8.5 future climate indicate the width of the northernmost for ensemble members. (B) represents the occurrence frequency in each Japanese region shown in Figure 3A.
The nationwide frequency of the Baiu extreme rainfall for 20 years was estimated to be 108 occurrences for p1, 106 for p2, 129 for rcp26_c0, 164 for rcp85_c0, 210 for rcp85_c1, 180 for rcp85_c2, and 170 for rcp85_c3. Notably, the frequency of Baiu extreme rainfall events was projected to increase gradually by approximately 1.2 times under RCP2.6 and at least 1.5 times under RCP8.5. The regional trend analysis indicated that the Baiu extreme rainfall will be initiated in Hokkaido according to all the ensembles under RCP8.5; however, it will not occur in RCP2.6. This finding further suggests that the Baiu extreme rainfall might not occur in Hokkaido if the global average surface temperature is constrained within the 2°C limit of warming. Moreover, the frequency of Baiu extreme rainfall in northern Japan (the Tohoku and Hokuriku areas) will increase with global warming. However, the frequency of Baiu extreme rainfall is somewhat ample even under the present climate in eastern and western Japan (the Toukai, Chugoku, Shikoku and Kyusyu areas) as shown in Figure 4B, and the gradual increase in these areas is not as significant as in northern Japan. Specifically, the frequency of extreme Baiu rainfall will gradually increase with global warming; however, this increase will not be uniform across Japan.
Figure 5 shows the half-monthly seasonal changes in the frequency of occurrence from June to August. Over 75% of all ensemble members under the RCP8.5, the scenario projected that the frequency of Baiu extreme rainfall would increase during the entire period, excluding late July, and significantly increase in early July and early August. Notably, this finding is consistent with previous studies that reported an increase in intense rainfall in early July (Kanada et al., 2012; Nakakita et al., 2012). Moreover, numerous recent observational Baiu extreme rainfall events in Japan occurred in early July (e.g., 5 July 2017, Northern Kyushu heavy rainfall; 5 July 2018, Western Japan heavy rainfall event; 4 July 2020, Kumamoto heavy rainfall event; 3 July 2021, Kanto heavy rainfall event). Notably, the recent observational trends correspond to future projections.
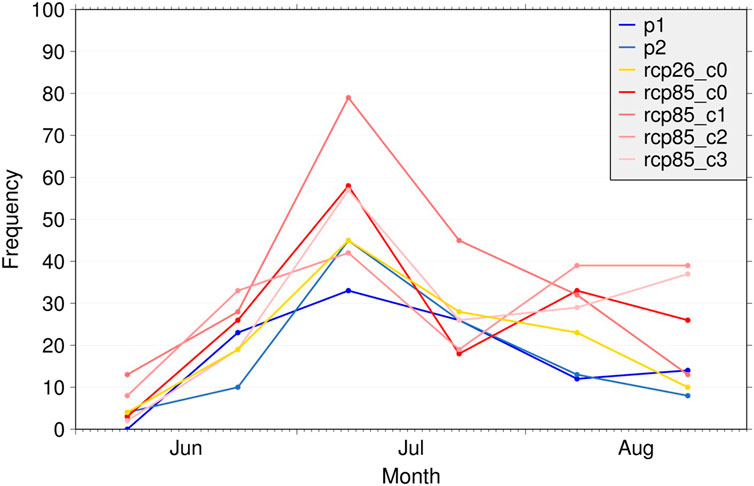
FIGURE 5. Seasonal changes in the occurrence frequency of Baiu extreme rainfall for the present climate (p1 and p2) and future climate under RCP2.6 and RCP8.5 (c0, c1, c2 and c3) for each half month from June to July.
3.2 Duration-accumulated rainfall
The duration and accumulated rainfall of the Baiu extreme rainfall obtained from the NHRCM05 and XRAIN are shown in Figure 6A, and the histogram and log-normal distribution function fitted to the events of 2- and 2.5-h duration (solid line) and of 2- to 4-h duration (dashed line) is shown in Figure 6B (only log-normal distribution function for the cases of 2- to 4-h duration). The reason why we only fitted the function to only the short-duration events in Figure 6B is that the number of samples decreased as the duration increased (especially for rcp26_c0 and p1-p2) then the goodness of fit was poor. As reported by Osakada et al. (2020), the future climate under RCP8.5 exhibits a statistically significant increase in accumulated rainfall per duration, while the future change under RCP2.6 is challenging to analyze statistically because of the small sample size of the Baiu extreme rainfall from a single ensemble. Thus, in this study, we elucidated the future changes in the distribution as a whole.
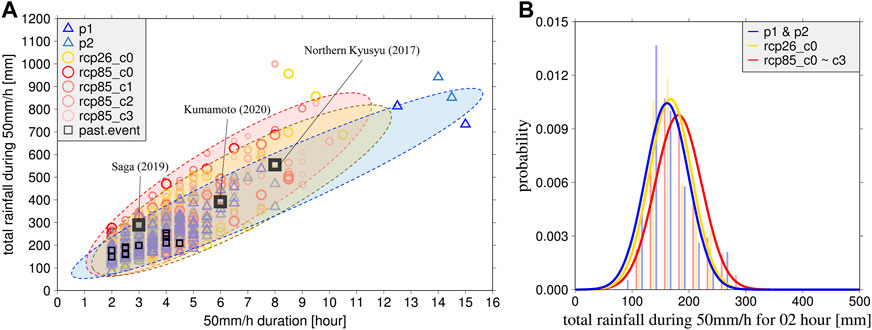
FIGURE 6. (A) Future changes in Baiu extreme rainfall (over 50 mm/h) in terms of duration and accumulated amount and (B) histogram and log-normal probability distribution fitted to accumulated amount which have 2- and 2.5-h duration (solid lines) and have 2- to 4-h duration (dashed lines). Shown are events projected by NHRCM05 present (blue triangles), future under RCP2.6 (yellow circles) and future under RCP8.5 (red circles) experiments (20-year each). Individual ensemble members of the RCP8.5 experiments (c0, c1, c2 and c3) and present experiments (p1 and p2) are distinguished with different opacity in (A). Past real events picked up from XRAIN are denoted with black squares, and the dotted ellipse in (A) schematically highlights the future changes in each climate, not an optimized ellipse.
First, the XRAIN plots indicate that NHRCM05 can realistically reproduce the observed Baiu extreme rainfall via simulation in Figure 6A, and the distribution of rcp26_c0 was in the middle of that of rcp85_c0–c3 and p1–p2 for 2- and 2.5-h duration cases of Figure 6B (solid lines), exhibiting a gradual increase in accumulated rainfall. For the cases for 2- to 4-h with dashed lines in Figures 6A, B gradual change is also seen in the tail of the distribution although there is no clear change compared to the case for 2- and 2.5-h because of the small sample size especially for rcp26_c0. Moreover, the maximum amount of total accumulated rainfall in each duration shown in Figure 6A will gradually increase from p1–p2 to rcp26_c0 and to rcp85_c0–c3. The small sample size makes it impossible to robustly discuss the gradual changes for long-duration cases, however we believe that the same trend should be found for long-duration cases if we can get the large sample of events. In addition to the future changes, the recently discerned observational events, such as the 2017-Northern Kyusyu, 2019-Saga, and 2020-Kumamoto events, were relatively extreme regarding accumulated rainfall compared with the present climate of NHRCM05. However, they may turn to “normal” events in the future climate, indicating that these recent observational events may have already been affected by global warming. This finding indicates that as global warming is exacerbated, the frequency and rainfall amount of the Baiu extreme rainfall will gradually increase. However, the Baiu extreme rainfall duration did not exhibit an increasing trend under RCP2.6 or RCP8.5. Supplementary Figure S2 shows the spatial distribution of the accumulated rainfall for these four long-duration events in the present climate. Osakada and Nakakita (2018a) noted the effect of cyclonic disturbances, such as typhoons, for three out of four events in the Tokai area on the Pacific Sea side. Moreover, Hoshino et al. (2018) reported that future trends exhibit shortened heavy rainfall durations. However, the absence of long-duration Baiu extreme rainfall must be explained under future climate conditions, considering the impact of typhoons on Baiu extreme rainfall and geographical characteristics.
3.3 Summary and discussion of NHRCM05 analysis
Overall, the analysis of NHRCM05 simulations revealed gradual increasing trends for the frequency and rainfall amount of the Baiu extreme rainfall from the present to the future climate under the RCP2.6 and RCP8.5 scenarios. Furthermore, many Baiu extreme rainfall events obtained from ensemble members of NHRCM05 (although the RCP2.6 simulation has only one ensemble) showed the same trend, indicating reliable future changes. Moreover, the addition of the RCP2.6 scenario analysis elucidated the future trend of the Baiu extreme rainfall due to global warming. Meanwhile, similarities between future trends and observational events, such as the frequent occurrence in early July and increased accumulated rainfall in recent events, may imply that global warming has already begun to elicit changes in the Baiu extreme rainfall, and serious mitigating actions might be urgently needed in a warming world.
However, certain characteristics, such as regional or seasonal variations, were also revealed that do not necessarily change uniformly with global warming. In particular, future seasonal changes in the Baiu frontal zone are highly uncertain. For instance, Endo et al. (2021) indicated a lack of consensus on the projection of the Baiu frontal rainfall in July and August based on ensemble projections using a 60 km atmospheric general circulation model. In addition, future changes in the SST spatial pattern throughout the tropics may affect rainfall during the Baiu season around Japan (Okada et al., 2017). Therefore, the seasonal transition of the Baiu frontal zone remains an open issue for climate change research. Although most such studies have described uncertainties regarding the transition of the Baiu front (not extreme rainfall), the seasonal change in the Baiu extreme rainfall should be interpreted with caution. To elucidate the relationship between the degree of global warming and the Baiu extreme rainfall and to increase confidence in future change projections, it is necessary to increase the number of ensembles of RCP2.6 scenario experiments and RCP8.5.
4 Pseudo global warming (PGW) experiments
In this section, we explore the future changes in the Baiu extreme rainfall in more detail, as well as the mechanisms underlying these potential changes, by conducting PGW experiments for the typical Baiu extreme rainfall events that have occurred in the past.
4.1 2012-Kameoka Baiu extreme rainfall event
4.1.1 Characteristics of the 2012-Kameoka event
The 2012-Kameoka event was a typical Baiu extreme rainfall event of the back-building type (Osakada and Nakakita, 2020). The Baiu stationary front remained over the Sea of Japan from July 14 to 15, and a line-shaped convective system started to occur at Mt. Rokko in Kobe, located far south of the Baiu front, from around 00:00 JST on July 15. This event caused fluvial flooding and landslides in Kameoka City. Figure 2C shows the weather map of JMA at 09:00 JST on July 14, while Figure 2A illustrates the spatial distribution of JMA Radar-AMeDAS accumulated 6 h of total rainfall (00:00 JST on July 15–06:00 JST on July 15). Notably, the 2012-Kameoka event was characterized by a southerly wind from the Kii Channel into Osaka Bay toward the Baiu front located in the Sea of Japan in the north, which continuously supplied water vapor to the area in which the Baiu extreme rainfall occurred. In addition, cumulonimbus clouds were repeatedly generated from Mt. Rokko and formed a line-shaped rain band.
4.1.2 Future changes in rainfall
We conducted PGW experiments for the 2012-Kameoka event under scenarios RCP2.6 and RCP8.5. Figure 7 shows the spatial distribution of 6 h accumulated rainfall from 00:00 JST to 06:00 JST on July 15, accounting for the primary period when the Baiu extreme rainfall occurred in the present climate experiment, PGW under RCP2.6, and RCP8.5. The relative frequency distributions of rainfall intensity and 6 h accumulated rainfall from 00:00 JST and 06:00 JST are shown in Figure 8. Note that the analysis area of relative frequency was 135˚E–136.5˚E longitude and 34.5°N–35.5°N latitude. The final estimate was derived as a percentage of the total number of meshes in the study area.
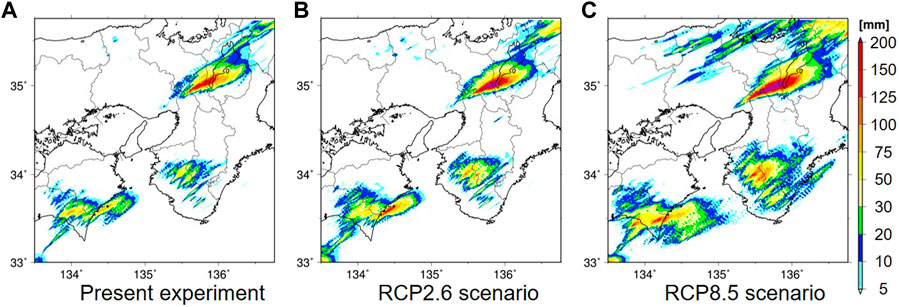
FIGURE 7. Spatial distribution of 6-h accumulated rainfall amount simulated with CReSS (Cloud Resolving Storm Simulator) for the 2012-Kameoka event from 00:00JST to 06:00JST on July 15th. (A) Present climate experiment, (B) pseudo global warming experiment under RCP2.6, and (C) pseudo global warming experiment under RCP8.5 scenario.
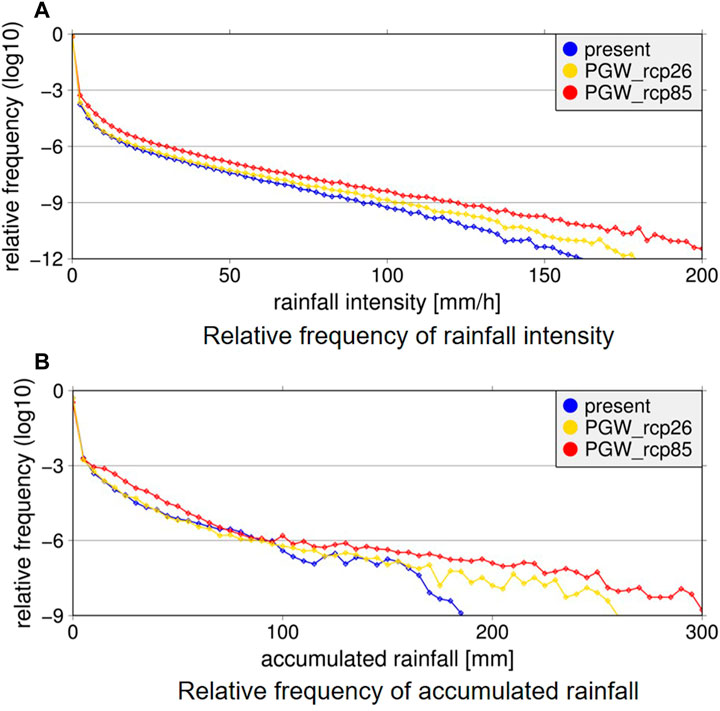
FIGURE 8. Relative frequency distribution of (A) rainfall intensity and (B) 6-h accumulated rainfall for the PGW experimental results for the 2012-Kameoka event. Analyzed area is 135˚E ∼ 136.5˚E longitude and 34.5˚N ∼ 35.5˚N latitude; analyzed period is from 00:00JST to 06:00JTS on July 15th.
The observation shown in Figure 2A recorded 190 mm as the maximum total rainfall, which was well represented in the present experiment in Figure 7A recorded 197 mm as the maximum total rainfall. In addition, the PGW experiments reflected a line-shaped rain band. In the RCP2.6 experiment, the size of the entire rainfall area, including the weak rainfall area, did not significantly differ from that of the present climate experiment; however, the maximum total rainfall was 272 mm, approximately 1.38 times that of the present experiment. In the RCP8.5 experiment, the entire rainfall area, including the weak rainfall area, was also larger than that of the present climate experiment, as well as the maximum total rainfall, which was 329 mm and 1.67 times that of the present experiment. These future changes were identified (Figure 8B), while the relative frequencies of accumulated rainfall for the weak rainfall amount (<100 mm) were relatively the same between the present climate and the RCP2.6 experiment. Moreover, the relative frequency of accumulated rainfall for the entire rainfall amount increased in RCP8.5. Figure 8 also shows that rainfall intensity and total rainfall gradually increased with global warming.
Figure 9 shows that the duration over 50 mm/h and the accumulated rainfall results during the duration of the PGW experiments overlay those in Figure 6A. The XRAIN plot for only the 2012-Kameoka event is shown. The duration and accumulated rainfall were calculated based on the same definitions as for the Baiu extreme rainfall events obtained from NHRCM05. Notably, we identified a representation of the observations in the present experiment. The PGW results revealed a gradual increase in the duration and accumulated rainfall. This gradual increase in accumulated rainfall obtained from PGW is consistent with the NHRCM05 analysis results described in Section 3.2. Furthermore, the same result as that of NHRCM05, implying the cumulus convective parameterization applied, was obtained from the PGW experiments using the cloud-resolving model CReSS without parameterization (Tsuboki and Sakakibara, 2002). This similarity indicates the robustness of the reported result that the rainfall amount of the Baiu extreme rainfall gradually increases as global warming intensifies. However, NHRCM05 showed the decreasing trend of duration while this PGW showed the increase trend of duration. This discrepancy regarding future changes in duration should be elucidated in future studies.
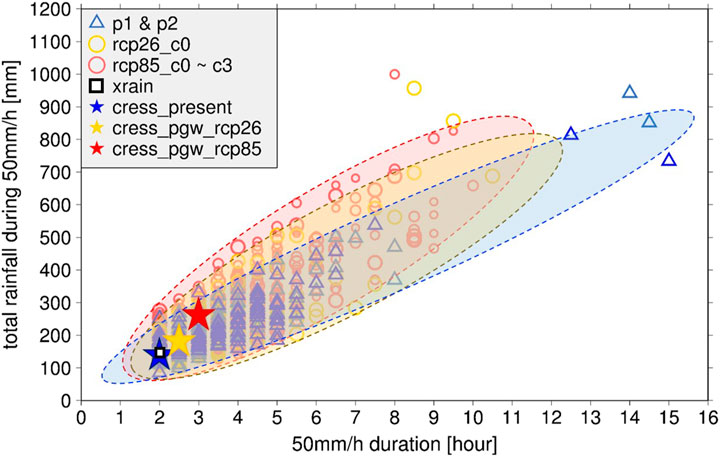
FIGURE 9. Future changes in Baiu extreme rainfall (over 50 mm/h) in terms of duration and accumulated amount obtained from NHRCM05 and PGW experiment for 2012-Kameoka. Shown are events projected by NHRCM05 present (blue triangles), future under RCP2.6 (yellow circles), future under RCP8.5 (red circles) experiments (20-year each), and the results of PGW present (blue star), RCP2.6 (yellow star), and RCP8.5 (red star). White square represents the observation by XRAIN. Individual ensemble members of the RCP8.5 experiments (c0, c1, c2 and c3) and present experiments (p1 and p2) are distinguished with different opacity.
4.1.3 Clausius-Clapeyron scaling
Next, focusing on the reliable future increasing trend of the total rainfall amount, we compared the future changing rate of rainfall obtained from PGW with the Clausius–Clapeyron scaling. The Clausius–Clapeyron (hereafter CC) equation theoretically formalizes the relationship between the saturated water vapor pressure (the water-holding capacity of the atmosphere) and atmospheric temperature. The CC equation indicates that the saturated water vapor pressure increases by approximately 7% as the temperature increases by 1 K. Considering the findings of Trenberth et al. (2003), we anticipated that rainfall intensity would follow this CC scaling of approximately 6%–7%. In climate change research, numerous studies have compared future changes in extreme precipitation with this CC scaling (Ban et al., 2015; Prein et al., 2017; Nakakita et al., 2020).
In this study, we compared the changing rate of rainfall with the surface temperature change in the atmosphere due to global warming. To explore the period when the precipitation process did not affect temperature, the temperature increase was defined as the change in area-averaged surface temperature at the initial calculation time between the present and PGW experiments. Two indices of rainfall—maximum rainfall intensity and maximum accumulated rainfall—were compared with CC scaling. We selected the following area for analysis:135˚E–136.5˚E longitude and 34.5˚N–35.5˚N latitude. In this area, a line-shaped convective system was evident. We applied the analysis to the 00:00 JST–06:00 JST period. Thus, the index of maximum rainfall intensity was defined as the value of one grid to which the maximum intensity during the period was recorded. Furthermore, the area-averaged accumulated rainfall was defined as the area-averaged 6 h accumulated rainfall. The results are shown in Figure 10, where Figure 10A illustrates the result for maximum rainfall intensity and Figure 10B displays the result for the maximum 6 h accumulated rainfall.
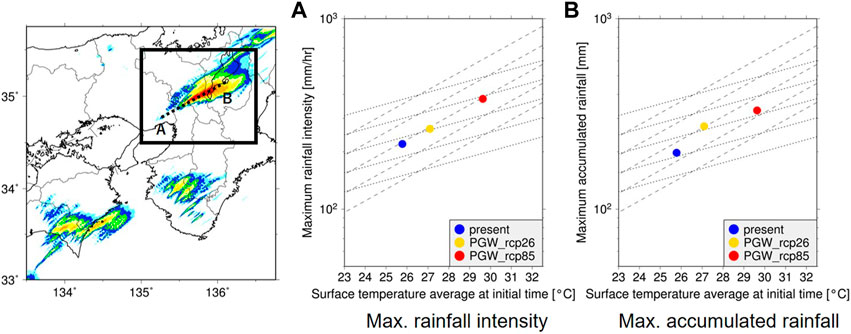
FIGURE 10. The changing rate of rainfall with the surface temperature change in atmosphere for 2012-Kameoka PGW experiments. (A) Maximum rainfall intensity within the area and duration from 00:00JST to 06:00JST on July 15th and initial area-averaged surface temperature. (B) Maximum 6-h accumulated rainfall from 00:00JST to 06:00JST on July 15th and initial area-averaged surface temperature simulated with CReSS experiments for 2012-Kameoka event. Analyzed area is 135˚E ∼ 136.5˚E longitude and 34.5˚N ∼ 35.5˚N latitude. The dotted lines represent Clausius-Clapeyron scaling (7%) and the dashed lines represent the twice Clausius-Clapeyron scaling (14%). The blue color represents the present climate experiment and the yellow (red) color represents PGW under RCP2.6 (RCP8.5) scenario.
The increasing rate of rainfall due to global warming was substantially higher than the CC scaling for both indices, while the rate of increase was nearly in accordance with the two-fold CC scaling. These results indicate that the Baiu extreme rainfall in PGW yielded more rainfall than theoretically expected from the increase in the water-holding capacity of the atmosphere in the future climate. This effect, namely, the rainfall changes in response to temperature changes exceeding the CC scaling, is referred to as Super Clausius-Clapeyron scaling and has been previously shown in other studies (Lenderink and Meijgaard, 2008; Liu et al., 2009; Singleton and Toumi, 2013; Nakakita et al., 2020). In the next section, we analyze the mechanism of Super Clausius-Clapeyron scaling by elucidating future changes in the dynamical structure of the line-shaped convective system of the Baiu extreme rainfall from the cumulonimbus cloud formation perspective.
4.1.4 Dynamical effect
In this analysis, we focused on the dynamic organizing structure of the Baiu extreme rainfall, reflected by the indices of convergence and updraft in the same way as that shown by Osakada and Nakakita (2020). Figure 1 shows that a new cumulus cloud at the tip of the back-building rain band is formed with an updraft generated by convergence at the lower level. Therefore, convergence and updraft are important dynamic indices for the maintenance of the Baiu extreme rainfall. As this structure was particularly prominent along the major axis direction of the line-shaped rain band, we analyzed the convergence and updraft in the vertical cross-section between AB (Figure 10). Our analysis also included spatial information on the structure of the Baiu extreme rainfall. The relative frequency of convergence was analyzed only for the area at altitudes <1 km to elucidate the convergence between the downdraft and inflow at the lower level. The relative frequency of the updraft was analyzed from the surface to an altitude of approximately 15 km, which represented the top altitude of the simulation. The analysis period for both indices was from 00:00 to 06:00 JST (July 15).
Figures 11A, B shows that the convergence in the lower level and the updraft was gradually enhanced with global warming. This result indicates the future dynamic changes, where the Baiu extreme rainfall structure will intensify as a group of cumulonimbus. Furthermore, strengthening the lower level convergence further exacerbates the new updraft, promoting the formation and development of new cumulus clouds. In addition, Figure 11C shows that the amount of condensation was also gradually increased, indicating that the enhanced updraft may have affected strong water vapor inflow into cumulonimbus, further potentially accelerating raindrop formation. It was assumed that a higher increasing rate of rainfall, compared with the theoretically derived estimate from the CC equation, can be realized by this non-linear effect to localize the water vapor around the surrounding into the cumulonimbus. This effect has been demonstrated by Osakada and Nakakita (2020) following the completion of a PGW experiment only under the RCP8.5 scenario. However, in this study, the addition of the PGW experiment under the RCP2.6 scenario can quantitatively describe the relationship between the strength of the global warming effect and the enhancement of the organized structure of the Baiu extreme rainfall. Furthermore, the PGW method can be used to analyze in detail the mechanism of future changes due to global warming.
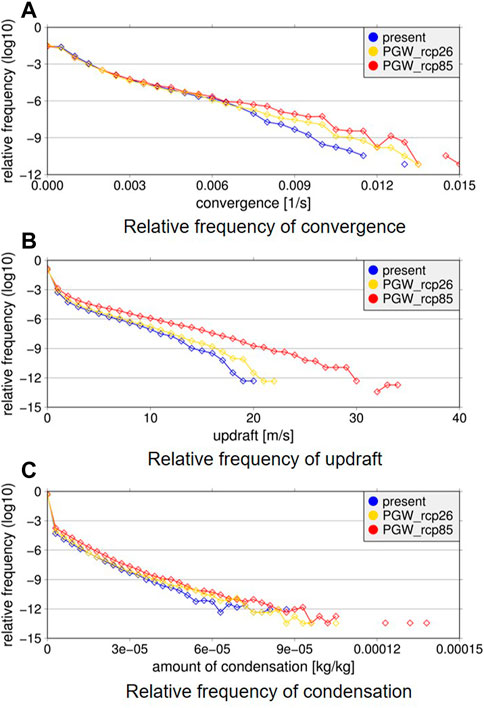
FIGURE 11. Relative frequency distribution of (A) convergence, (B) updraft, and (C) condensation for the PGW experimental results for the 2012-Kameoka event. Analyzed area is between AB cross section shown in Figure 10; analysis period is from 00:00JST to 06:00 JST on July 15th. The relative frequency of convergence was calculated less than 1 km and that of updraft and condensation was calculated less than about 15 km.
4.2 2014-Hiroshima Baiu extreme rainfall event.
4.2.1 Characteristics of the 2014-Hiroshima event
PGW experiments were conducted for the 2014-Hiroshima event, another typical Baiu extreme rainfall event of back-building type (similar to the 2012-Kameoka event). The stationary front remained over the Sea of Japan from August 19 to 20, and a line-shaped convective system started to occur from around 00:00 JST on August 20 in Hiroshima City, far south of the front. This stationary front is called an “Akisame” front in Japanese, which means an autumn front emerging from the end of August. However, as mentioned in Section 2, the Baiu extreme rainfall sometimes occurs in this period and is associated with the “Akisame” stationary front. Therefore, this study refers to it as the Baiu extreme rainfall. This record-breaking event killed more than 70 people through a massive landslide; Figure 2D shows the weather map of JMA at 09:00 JST on August 19, Figure 2B shows the JMA Radar-AMeDAS accumulated 8 h of total rainfall (21:00 JST on August 19–05:00 JST on August 20). The 2014-Hiroshima event was characterized by a southerly wind from the Bungo Channel flowing toward the stationary front in the north, which continuously supplied abundant water vapor to the area where the Baiu extreme rainfall occurred. Moreover, cumulonimbus occurred repeatedly and was structured to form a line-shaped rain band.
4.2.2 Future changes in rainfall
Figure 12 shows the spatial distribution of 8 h accumulated rainfall from 21:00 JST on August 19 to 05:00 JST on August 20 for the present climate experiment, PGW under RCP2.6 and RCP8.5. Intriguingly, as the warming scenario increased, the target line-shaped rain band gradually weakened, while the rainfall around the upstream area, such as south of Hiroshima and Northern Kyusyu Island, significantly increased. It indicated that while there is a clear increase in rainfall over a large area under warming conditions, there can be a decrease in local rainfall associated with individual line-shaped convective systems. This finding contrasts with that of the 2012-Kameoka event. Although a line-shaped convective system was identified in each experiment, it gradually weakened as the degree of warming increased. Accordingly, we suggest that it is not a result of a model calculation- or setting-related errors but rather the effects of global warming on the atmospheric conditions causing this decreasing trend in Baiu extreme rainfall. In addition, the rainfall in the northern Kyushu region appears to be a line-shaped rainfall in terms of accumulated rainfall, however it was not an “isolated line-shaped convective system” such as 2014-Hiroshima event, therefore, we analyzed the mechanism of the rainfall decrease in the Hiroshima area in this paper.
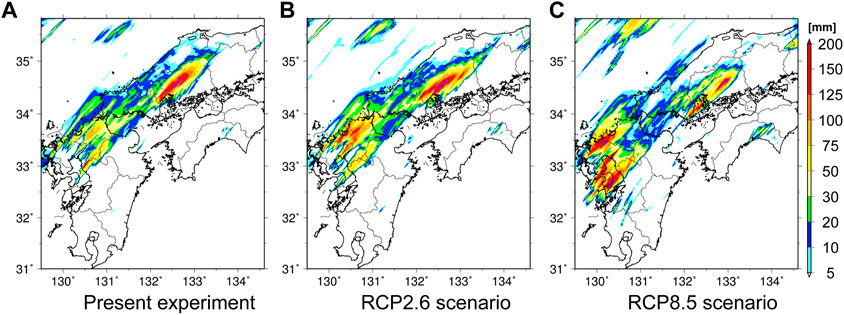
FIGURE 12. Spatial distribution of 8-h accumulated rainfall simulated with CReSS (Cloud Resolving Storm Simulator) for the 2014-Hiroshima event from 21:00JST on 19th August to 05:00JST on 20th August. (A) Present climate experiment; (B) pseudo global warming experiment under the RCP2.6 scenario, and (C) pseudo global warming experiment under RCP8.5 scenario.
Hibino et al. (2018) also conducted PGW experiments for the 2014-Hiroshima event and showed that future extreme precipitation, such as the 2014-Hiroshima event, is not intensified, which is the same trend as our results, although some experimental settings, such as the simulation model, calculation area, and variables added as warming increments, differed from this study. They discussed the results from the perspective of atmospheric stabilization owing to temperature increases in the future climate. In this study, we expand the calculation area compared with Hibino et al. (2018) to reduce the effect of the calculation boundary and discuss our PGW results from the perspective of water vapor transportation.
4.2.3 Effect of water vapor supply
In this subsection, we calculated CAPE expressed by the following equation:
where T is the temperature of the environment, and T′ is the temperature of an air parcel. LFC (Level of Free Convection) refers to the altitude at which the temperature of the environment matches the temperature of the lifted air parcel adiabatically and above which the air parcel can ascend only by buoyancy (free convection). LNB (Level of Neutral Buoyancy) is the altitude at which the temperature of the environment matches again that of an air parcel lifting in a free convection zone and above which the sink forces act on the air parcel. CAPE is one of the key atmospheric indices for evaluating atmospheric instability and water vapor supply to the Baiu extreme rainfall area. These variables were calculated for the 2014-Hiroshima event experiments to investigate the drivers behind the gradual decrease in the Baiu extreme rainfall under the PGW settings.
Figures 13A, B shows the time series of the spatial distribution of CAPE (shade), surface water vapor flux (arrow), and the rainfall intensity (contour), however, only the figures for the present climate and RCP8.5 scenarios, where the differences were clear, are shown here. As can be seen in Figure 13, it is clearly seen that the line-shaped rain band that started at 21:30 in the present climate experiment persists as an isolated convective system in the abundant supply of CAPE and water vapor. In contrast, in the experiment under the RCP8.5 scenario, although the line-shaped convection system started to develop at 20:00, CAPE was consumed by the rainfall areas located upstream of the system and advected from the northern Kyushu region. Furthermore, the rainfall area advected from the west merged into the line-shaped convection system at around 22:00, and the line-shaped convective system is no longer maintained as a system. In other words, line-shaped convection systems can persist in a stable environmental field without being disturbed by surrounding disturbances. However, in the PGW experiments under RCP8.5, the environmental field were disturbed by the rainfall that developed because of global warming in the upstream area (in the northern Kyushu region and over the Bungo channel) of the line-shaped convection system, and it was found that the heavy rainfall could not be maintained as a line-shaped convection system.
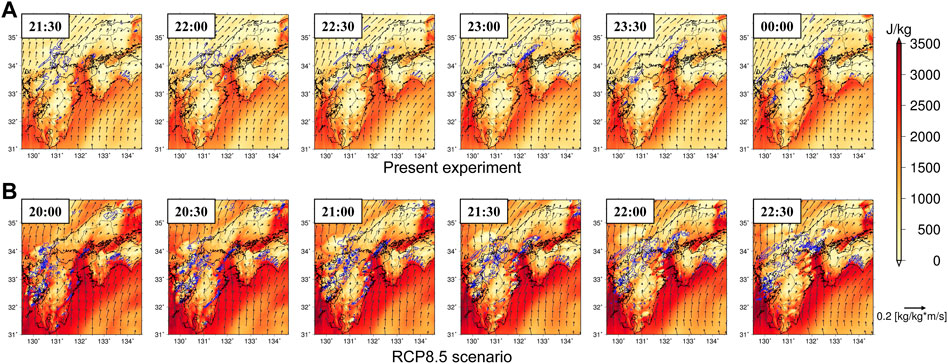
FIGURE 13. Spatial distribution of Convective Available Potential Energy (CAPE; shade), surface water vapor flux (arrow), and rainfall intensity (contour) simulated in the (A) present experiment, (B) PGW experiments under RCP8.5 for the 2014-Hiroshima event.
Figure 14 shows the changing rate of rainfall with the surface temperature change in atmosphere like the same as Figure 10. Since the amount of CAPE and water vapor inflow will increase in the future climate as shown in Figure 13, the maximum rainfall intensity increased in the RCP8.5 scenario, although it did not increase significantly in the RCP2.6 scenario. However, as mentioned above, the line-shaped convective system could no longer be sustained under the future climate, resulting in a decreasing trend in duration and total rainfall.
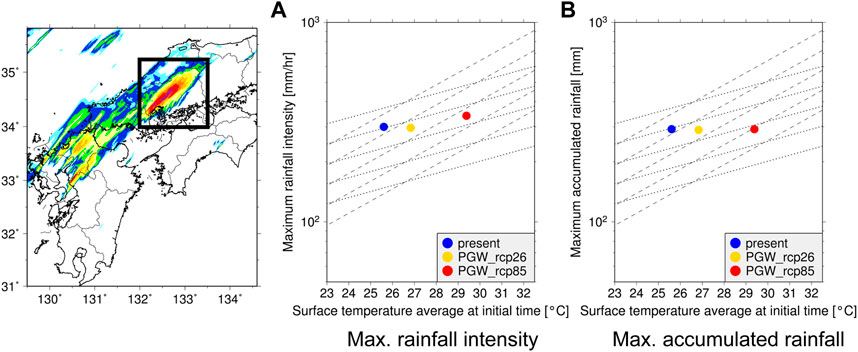
FIGURE 14. The changing rate of rainfall with the surface temperature change in atmosphere for 2014-Hiroshima PGW experiments. (A) Maximum rainfall intensity within the area and duration from 21:00JST on August 19th to 05:00JST on August 20th and initial area-averaged surface temperature. (B) Maximum 8-h accumulated rainfall from 21:00JST on August 19th to 05:00JST on August 20th and initial area-averaged surface temperature simulated with CReSS experiments for 2014-Hiroshima event. Analyzed area is 132.0˚E ∼ 133.5˚E longitude and 34.0˚N ∼ 35.25˚N latitude. The dotted lines represent Clausius-Clapeyron scaling (7%) and the dashed lines represent the twice Clausius-Clapeyron scaling (14%). The blue color represents the present climate experiment and the yellow (red) color represents PGW under RCP2.6 (RCP8.5) scenario.
4.2.4 Discussion of PGW analysis—comparison between NHRCM05 and PGW
The NHRCM05 and 2012-Kameoka PGW analyses revealed that the accumulated amount of extreme Baiu rainfall during an intense rainfall duration gradually increased with the progression of global warming. This increase in rainfall amount is a prominent future trend, as all ensemble members of NHRCM05 showed the same trend. Meanwhile, the 2014-Hiroshima PGW experiments revealed that the rainfall amount did not necessarily increase, thus raising the following question: “Does the Baiu extreme rainfall in the Hiroshima area really exhibit the inherent characteristics of future changes in rainfall and indicate that a significant increase will not occur under future climate owing to more rainfall upstream area?” Alternatively, “Does this PGW experiment only result in future climate conditions in which rainfall does not substantially increase in the Hiroshima area?” We argue that such questions are essential for future change prediction research, as climate model analysis and PGW are the most frequently used methods for estimating future changes in extreme weather events.
We further explored and discussed the Baiu extreme rainfall that occurred in NHRCM05, such as the 2014-Hiroshima event, and compared them with the PGW results to examine the characteristics of future changes. Therefore, we selected the Baiu extreme rainfall events that occurred in the Hiroshima area in NHRCM05. We referred to two qualitative criteria that represent the important characteristics of the 2014-Hiroshima event:1) water vapor is supplied from the Bungo Channel to the Hiroshima area, and 2) convergence of the Baiu front is located north of Hiroshima, and the line-shaped rain band is not forced by large-scale convergence. The number of future Baiu extreme rainfall events, with similar characteristics to the 2014-Hiroshima event in the NHRCM05 20-year period, was two for p1, six for p2, one for rcp26_c0, two for rcp85_c0, four for rcp85_c1 and rcp85_c2, and six for rcp85_c3. In particular, we compared the events that occurred only in the present climate experiments (p1 and p2) and RCP8.5 experiments (rcp85_c0–c3), which had multiple samples similar to the 2014-Hiroshima event.
Figure 15 shows the composite of accumulated rainfall for the Baiu extreme rainfall events, similar to 2014-Hiroshima that occurred in NHRCM05. In this subsection, the accumulated rainfall is the same as that defined in Figure 6A. Figure 15 shows not only the increase in rainfall in the northern Kyushu area, but also the increase in rainfall for the target rainfall in Hiroshima, indicating that these NHRCM05 analysis do not fully agree with those of the PGW results regarding the Baiu extreme rainfall in the Hiroshima area. Hence, our PGW calculation may have shown one of decreasing scenarios for the Baiu extreme rainfall in the Hiroshima area, although rainfall over a large area was increased, since only one simulation was performed in this PGW. However, the large sample obtained from NHRCM05 shows an increase in heavy rainfall in the Hiroshima area too, which does not necessarily mean that the rainfall area will move from Hiroshima to the Kyushu region or that the heavy rainfall in Hiroshima will weakened in the future climate, as was the case in the PGW results.
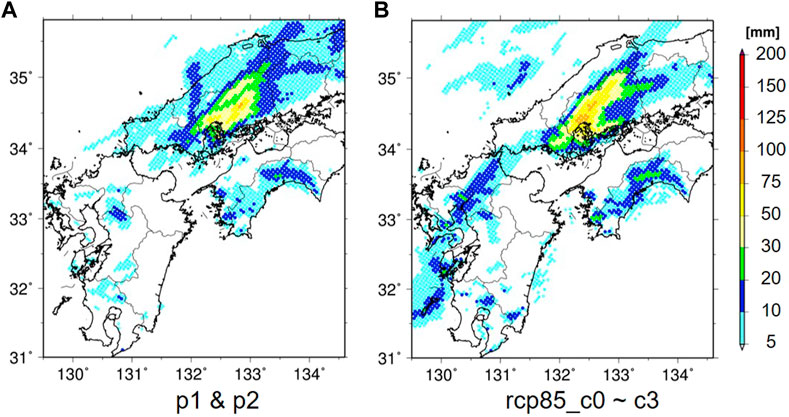
FIGURE 15. Composited accumulated rainfall distribution that occurred around Hiroshima area in NHRCM05 for (A) present climate (p1 and p2) and (B) future climate under the RCP8.5 scenario (rcp85_c0 ∼ c3).
5 Discussion
As observed above, the frequency of the Baiu extreme rainfall increased in NHRCM05 and extreme rainfall became stronger with warming in NHRCM05 and the PGW of the 2012-Kameoka event. However, the PGW of the 2014-Hiroshima event, the same back-building rainstorm as the 2012-Kameoka event, showed that the Baiu extreme rainfall gradually weakened with warming. There were cases where NHRCM05 and PGW showed common and different future changes.
Considering the difference between the analysis of the climate model and PGW experiments. From the analysis of climate model simulations, we can obtain ensemble climate predictions (Figure 15 represents the ensemble mean spatial distribution of Baiu extreme rainfall events similar to 2014-Hiroshima), while PGW represents future changes for only one event. Moreover, we primarily analyzed future nationwide trends in Japan using the NHRCM05 simulation, whereas PGW typically focuses on a specific event, although this is a similar difference from the ensemble concept. Therefore, in terms of ensemble members and the number of samples, there is a possibility that the Baiu extreme rainfall just happened to show a decreasing trend in the Hiroshima area in our PGW calculation. However, PGW is an important and necessary tool for the analysis of detailed localized weather event mechanisms; thus, it should be used with a comprehensive understanding of the meaning and features of the PGW results. In addition, we believe it is important to conduct PGW ensemble experiments (not by creating an ensemble by applying small perturbations to the same event but by conducting experiments on multiple similar events) to estimate future changes more reliably.
This study elucidated an insightful future change trend by comparing the results of NHRCM05 and PGW experiments. However, we indicated that exploring the mechanism of the Baiu extreme rainfall is necessary, including the conditions under which it occurs, persists, and causes large amounts of rainfall. Finally, it is important to understand whether the differences in future changes, such as those observed in the 2012-Kameoka and 2014-Hiroshima events, are universal.
6 Summary and conclusion
This study analyzed regional climate model simulations and PGW experiments under scenarios RCP8.5 and RCP2.6 to estimate the future gradual changes in the Baiu extreme rainfall. A comprehensive analysis by climate model- and PGW-based methods allowed us to compensate for the shortcomings of each result and interpret deeper the meaning of the results. Moreover, the addition of RCP2.6 scenario analysis to previous studies (Osakada and Nakakita, 2018a; Osakada and Nakakita 2018b; Osakada and Nakakita2020; Nakakita and Osakada, 2018) helped to elucidate the relationship between the degree of global warming and future changes in the Baiu extreme rainfall.
According to the NHRCM05 simulation analysis, the frequency of the Baiu extreme rainfall tends to gradually increase with global warming, increasing by 1.2 times under the RCP2.6 scenario and ≥1.5 times under the RCP8.5, compared with the present climate. The rainfall amount of the Baiu extreme rainfall will also gradually increase as well as the frequency, while the recent observational extreme events may have already been affected by global warming. These results offer reliable future trends since they are consistent across all the NHRCM05 ensemble members. According to the PGW analysis, analysis of the 2012-Kameoka event revealed that the rate at which rainfall will increase is nearly twofold the theoretical Clausius-Clapeyron scaling, which can be attributed to the intensification of the back-building dynamical structure to localize water vapor into the cumulonimbus. Alternatively, the PGW of the 2014-Hiroshima event showed no significant increase in the Baiu extreme rainfall as the water vapor was consumed in the upstream area. However, these results may have only shown a decreasing trend, as events similar to the 2014-Hiroshima event obtained from the NHRCM05 simulation showed an increasing trend in rainfall abundance.
Collectively, the findings of this study indicate that, as global warming gradually progresses, the frequency of extreme rainfall and related disasters will gradually increase in Japan, including the damage caused by these disasters. Furthermore, this study indicates that disaster prevention and adaptation measures are urgently needed, as disasters will occur even in areas such as northern Japan that have rarely experienced such extreme rainfall disasters. Meanwhile, it is necessary to increase the reliability of these predictions by increasing the number of NHRCM05 ensemble climate model analyses under many warming scenarios. Simultaneously, it is important to conduct ensemble experiments on many PGW cases to correctly interpret the results. In future studies, the challenge is to identify the necessary and sufficient conditions for the occurrence and maintenance of the Baiu extreme rainfall. In addition, it is essential to investigate whether the future changes we obtained are coincident or inevitable from the viewpoint of phenomenal mechanisms while also clarifying what result is universal and which can be altered by global warming as a phenomenal mechanism.
Data availability statement
The original contributions presented in the study are included in the article/Supplementary Material, further inquiries can be directed to the corresponding author.
Author contributions
YN: conceptualization, methodology, model and data analysis, writing―original draft, writing―review and editing, and visualization. EN: conceptualization, methodology, writing―review and editing. All authors listed have made a substantial, direct, and intellectual contribution to the work and approved it for publication.
Funding
This work was supported by the Integrated Research Program for Advancing Climate Models (TOUGOU Program): Area Theme D “Integrated Hazard Prediction,” Grant Number JPMXD0717935498, from the Ministry of Education, Culture, Sports, Science and Technology (MEXT), Japan, and by JSPS KAKENHI Grant Number 21K20449.
Acknowledgments
The simulation using regional climate model data were carried out by Meteorological Research Institute in TOUGOU Program. The PGW numerical experiments in this study were carried out on EN Laboratory’s Super-Computer System in Disaster Prevention Research Institute, Kyoto University.
Conflict of interest
The authors declare that the research was conducted in the absence of any commercial or financial relationships that could be construed as a potential conflict of interest.
Publisher’s note
All claims expressed in this article are solely those of the authors and do not necessarily represent those of their affiliated organizations, or those of the publisher, the editors and the reviewers. Any product that may be evaluated in this article, or claim that may be made by its manufacturer, is not guaranteed or endorsed by the publisher.
Supplementary material
The Supplementary Material for this article can be found online at: https://www.frontiersin.org/articles/10.3389/feart.2023.1093543/full#supplementary-material
References
Ban, N., Schmidli, J., and Schär, C. (2015). Heavy precipitation in a changing climate: Does short-term summer precipitation increase faster? Geophys. Res. Lett. 42, 1165–1172. doi:10.1002/2014GL062588
Bluestein, H. B., and Jain, M. H. (1985). Formation of mesoscale lines of pirecipitation: Severe squall lines in Oklahoma during the spring. J. Atmos. Sci. 42, 1711–1732. doi:10.1175/1520-0469(1985)042<1711:FOMLOP>2.0.CO;2
Cabinet Office (2020). A Report on damages by the heavy rain event of july 2020. Available at: http://www.bousai.go.jp/updates/r2_07ooame/pdf/r20703_ooame_38.pdf (Accessed November 2, 2020).
Cabinet Office (2017). A Report on damages by the northern Kyusyu heavy rain event of july 2017. Available at: http://www.bousai.go.jp/fusuigai/kyusyu_hinan/pdf/dai1kai/siryo2.pdf (Accessed October 10, 2017).
Endo, H., Kitoh, A., Mizuta, R., and Ose, T. (2021). Different future changes between early and late summer monsoon precipitation in East Asia. J. Meteorol. Soc. Jpn. 99, 1501–1524. doi:10.2151/jmsj.2021-073
Hibino, K., Takayabu, I., Wakazuki, Y., and Ogata, T. (2018). Physical responses of convective heavy rainfall to future warming condition: Case study of the Hiroshima event. Front. Earth Sci. 6. doi:10.3389/feart.2018.00035
Hirahara, S., Ohno, H., Oikawa, Y., and Maeda, S. (2012). Strengthening of the southern side of the jet stream and delayed withdrawal of Baiu season in future climate. J. Meteorol. Soc. Jpn. 90, 663–671. doi:10.2151/jmsj.2012-506
Hoshino, T., Yamada, T. J., Inatsu, M., Sato, T., Kawase, H., and Sugimoto, S. (2018). Analysis of spatiotemporal characteristics of heavy rainfall under historical and warmer climate conditions using a large-ensemble dataset(d4PDF). J. JSCE Ser. B1. 74, I_13–I_18. doi:10.2208/jscejhe.74.5_I_13
Imada, Y., Kawase, H., Watanabe, M., Arai, M., Shiogama, H., and Takayabu, I. (2020). Advanced risk-based event attribution for heavy regional rainfall events. npj Clim. Atmos. Sci. 3, 37. doi:10.1038/s41612-020-00141-y
IPCC (2000). “Special Report on emissions scenarios,” in A special report of working group III of the intergovernmental Panel on climate change (Cambridge, UK: Cambridge University Press), 570.
Kanada, S., Nakano, M., and Kato, T. (2012). Projections of future changes in precipitation and the vertical structure of the frontal zone during the Baiu season in the vicinity of Japan using a 5-km-mesh regional climate model. J. Meteorol. Soc. Jpn. 90A 90A, 65–86. doi:10.2151/jmsj.2012-A03
Kato, T., and Goda, H. (2001). Formation and maintenance processes of a stationary band-shaped heavy rainfall observed in Niigata on 4 August 1998. J. Meteorol. Soc. Jpn. 79, 899–924. doi:10.2151/jmsj.79.899
Kato, T. (2020). Quasi-stationary band-shaped precipitation systems, named “senjo-kousuitai”, causing localized heavy rainfall in Japan. causing localized heavy rainfall Jpn. J. Meteorol. Soc. Jpn. 98, 485–509. doi:10.2151/jmsj.2020-029
Kawase, H., Watanabe, S., Hirockawa, Y., and Imada, Y. (2022). Timely event attribution of extreme precipitation in Japan: An example of heavy rainfall in July 2020. Bull. Am. Meteorol. Soc. 103, S118–S123. doi:10.1175/BAMS-D-21-0192.1
Kitoh, A., Ose, T., and Takayabu, I. (2015). Dynamical downscaling for climate projection with high-resolution MRI AGCM-RCM. J. Meteorol. Soc. Jpn. 94A, 1–16. doi:10.2151/jmsj.2015-022
Kitoh, A., and Uchiyama, T. (2006). Changes in onset and withdrawal of the East Asian summer rainy season by multi-model global warming experiments. J. Meteorol. Soc. Jpn. 84, 247–258. doi:10.2151/jmsj.84.247
Kusunoki, S., Mizuta, R., and Matsueda, M. (2011). Future changes in the East Asian rain band projected by global atmospheric models with 20-km and 60-km grid size. Clim. Dyn. 37, 2481–2493. doi:10.1007/s00382-011-1000-x
Lackmann, G. M. (2013). The south-central U.S. flood of May 2010: Present and future. J. Clim. 26, 4688–4709. doi:10.1175/JCLI-D-12-00392.1
Lenderink, G., and Meijgaard, E. V. (2008). Increase in hourly precipitation extremes beyond expectations from temperature changes. Nat. Geosci. 1, 511–514. doi:10.1038/ngeo262
Liu, S. C., Fu, C. B., Shiu, C. J., Chen, J.-P., and Wu, F. T. (2009). Temperature dependence of global precipitation extremes. Geophys. Res. Lett. 36, L17702. doi:10.1029/2009GL040218
Matsumoto, S., Ninomiya, K., and Yoshizumi, S. (1971). Characteristic features of “Baiu&rdquo; front associated with heavy rainfall. J. Meteorol. Soc. Jpn. 39, 267–281. doi:10.2151/jmsj1965.49.4_267
Mizuta, R., Arakawa, O., Ose, T., Kusunoki, S., Endo, H., and Kitoh, A. (2014). Classification of CMIP5 future climate responses by the tropical sea surface temperature changes. Sola 10, 167–171. doi:10.2151/sola.2014-035
Mizuta, R., Yoshimura, H., Murakami, H., Matsueda, M., Endo, H., Ose, T., et al. (2012). Climate simulations using MRI-agcm3.2 with 20-km grid. J. Meteorol. Soc. Jpn. 90A 90A, 233–258. doi:10.2151/jmsj.2012-A12
Nakakita, E., Hashimoto, G., and Osakada, Y. (2020). An influence of atmospheric stabilization and water vapor invasion on characteristics of guerrilla-heavy rainfall under climate change, 63B. Uji, Japan: Kyoto University, 241–271. (in Japanese).
Nakakita, E., Miyake, T., Kim, K., and Konoshima, L. (2012). Fundamental study on future change of localized heavy rainfall during Baiu due to climate change using a regional climate model. J. Jpn. Soc. Civ. Eng. B1. 68, 427. (in Japanese). doi:10.2208/jscejhe.68.i_427
Nakakita, E., and Osakada, Y. (2018). Estimation of future changes in the heavy rainfall and atmospheric characteristics in Baiu season under climate change. J. JSCE Ser. B1. 74, I_139–I_144. (in Japanese). doi:10.2208/jscejhe.74.I_139
Nakatani, T., and Misumi, R. (2018). Hydrological simulation of small river basins in northern Kyushu, Japan, during the extreme rainfall event of July 5–6, 2017. J. Disaster Res. 13, 396–409. doi:10.20965/jdr.2018.p0396
Nayak, S., and Takemi, T. (2020). Clausius-Clapeyron scaling of extremely heavy precipitations: Case studies of the July 2017 and July 2018 heavy rainfall events over Japan. J. Meteorol. Soc. Jpn. 98, 1147–1162. doi:10.2151/jmsj.2020-058
Ninomiya, K., and Akiyama, T. (1991). Multi-scale features of Baiu, the summer monsoon over Japan and the East asia. J. Meteorol. Soc. Jpn. 70, 467–495. doi:10.2151/jmsj1965.70.1b_467
Oizumi, T., Saito, K., Duc, L., and Ito, J. (2020). Ultra-high resolution numerical weather prediction with a large domain using the K computer. Part 2: The case of the Hiroshima heavy rainfall event on August 2014 and dependency of simulated convective cells on model resolutions. J. Meteorol. Soc. Jpn. 98 (6), 1163–1182. doi:10.2151/jmsj.2020-060
Okada, Y., Takemi, T., Ishikawa, H., Kusunoki, S., and Mizuta, R. (2017). Future changes in atmospheric conditions for the seasonal evolution of the Baiu as revealed from projected AGCM experiments. J. Meteorol. Soc. Jpn. 95, 239–260. doi:10.2151/jmsj.2017-013
Okada, Y., and Yamazaki, K. (2012). Climatological evolution of the Okinawa Baiu and differences in large-scale features during may and June. J. Clim. 25, 6287–6303. doi:10.1175/JCLI-D-11-00631.1
Osakada, Y., and Nakakita, E. (2021). Analysis on the impact of ambient disturbances on pseudo global warming results for line-shaped convective system and atmospheric indices. J. Jpn. Soc. Civ. Eng. B1 77, I_1255–I_1260. doi:10.2208/jscejhe.77.2_I_1255
Osakada, Y., and Nakakita, E. (2018a). Future change of occurrence frequency of Baiu heavy rainfall and its linked atmospheric patterns by multiscale analysis. Sola 14, 79–85. doi:10.2151/sola.2018-014
Osakada, Y., and Nakakita, E. (2018b). Future changes of “Baiu heavy rainfall duration and accumulated precipitation” using the regional climate model verified with past real heavy rainfall events. J. JSCE Ser. B1. 74, I_19–I_24. (in Japanese). doi:10.2208/jscejhe.74.5_I_19
Osakada, Y., and Nakakita, E. (2020). Multi-scale analysis on pseudo global warming experiment for back-building rainfall based on different resolutions. J. Jpn. Soc. Civ. Eng. B1. 76, I_1–I_6. (in Japanese). doi:10.2208/jscejhe.76.2_i_1
Osakada, Y., Nakamura, A., and Nakakita, E. (2020). Statistical analysis of future changes in Baiu heavy rainfall duration and accumulated rainfall considering its spatiotemporal characteristics. J. Jpn. Soc. Civ. Eng. B1. 76, I_7–I_12. (in Japanese). doi:10.2208/jscejhe.76.2_i_7
Prein, A. F., Liu, C., Ikeda, K., Trier, S. B., Rasmussen, R. M., Holland, G. J., et al. (2017). Increased rainfall volume from future convective storms in the US. Nat. Clim. Change. 7, 880–884. doi:10.1038/s41558-017-0007-7
Prein, A. F., Rasmussen, R. M., Wang, D., and Giangrande, S. E. (2021). Sensitivity of organized convective storms to model grid spacing in current and future climates. Philos. Trans. A Math. Phys. Eng. Sci. 379, 20190546. doi:10.1098/rsta.2019.0546
Seko, H. (2010). Study of the shapes and maintenance mechanisms of meso-β scale line-shaped precipitation systems in the middle-latitudes. J. Meteorol. Soc. Jpn. 62, 1–74. (in Japanese).
Singleton, A., and Toumi, R. (2013). Super-Clausius-Clapeyron scaling of rainfall in a model squall line. Q. J. R. Meteorol. Soc. 139, 334–339. doi:10.1002/qj.1919
IPCC (2013). “2013: The physical science basis,” in Contribution of working group I to the fifth assessment report of the intergovernmental Panel on climate change climate change. Editors T. F. Stocker, D. Qin, G. K. Plattner, M. Tignor, S. K. Allen, J. Boschunget al. (Cambridge, UK, and New York: Cambridge University Press), 1535. https://www.ipcc.ch/report/ar5/wg1/.
Taylor, K. E., Stouffer, R. J., and Meehl, G. A. (2012). An overview of CMIP5 and the experiment design. Bull. Am. Meteorol. Soc. 93, 485–498. doi:10.1175/BAMS-D-11-00094.1
Trenberth, K. E., Dai, A., Rasmussen, R. M., and Parsons, D. B. (2003). The changing character of precipitation. Bull. Am. Meteorol. Soc. 84, 1205–1218. doi:10.1175/BAMS-84-9-1205
Tsuboki, K., and Sakakibara, A. (2002). “Large-scale parallel computing of cloud resolving storm simulator,” in Lect. Notes comput. Sci. ISHPC 2022. Shimasaki high performance computing. Editors H. P. Zima, K. Joe, M. Sato, and Y. Seo (Berlin, Heidelberg: Springer), 2327, 243–259.
T’u, C. W., and Hwang, S. S. (1945). The advance and retreat of the summer monsoon in China. Bull. Am. Meteorol. Soc. 26, 9–22. doi:10.1175/1520-0477-26.1.9
Wakazuki, Y., Tsuboki, K., and Takeda, T. (2006). Periodic evolution of multiscale precipitation systems developed within a Baiu frontal cloud cluster. J. Meteorol. Soc. Jpn. 84, 497–518. doi:10.2151/jmsj.84.497
Keywords: line-shaped organized convective system, Baiu front, regional climate model, pseudo global warming, ensemble
Citation: Naka Y and Nakakita E (2023) Comprehensive future projections for the line-shaped convective system associated with Baiu front in Japan under RCP scenarios using regional climate model and pseudo global warming experiments. Front. Earth Sci. 11:1093543. doi: 10.3389/feart.2023.1093543
Received: 09 November 2022; Accepted: 11 May 2023;
Published: 22 May 2023.
Edited by:
Hans Von Storch, Helmholtz Zentrum Hereon, GermanyReviewed by:
Mariko Oue, Stony Brook University, United StatesKenta Sueki, Japan Meteorological Agency, Japan
Copyright © 2023 Naka and Nakakita. This is an open-access article distributed under the terms of the Creative Commons Attribution License (CC BY). The use, distribution or reproduction in other forums is permitted, provided the original author(s) and the copyright owner(s) are credited and that the original publication in this journal is cited, in accordance with accepted academic practice. No use, distribution or reproduction is permitted which does not comply with these terms.
*Correspondence: Yukari Naka, bmFrYS55dWthcmkuMnpAa3lvdG8tdS5hYy5qcA==