 Peicong Wu
 Zheng Ling
 Hailun He
- 1Key Laboratory of Climate, Resources and Environment in Continental Shelf Sea and Deep Sea of Department of Education of Guangdong Province, College of Ocean and Meteorology, Guangdong Ocean University, Zhanjiang, China
- 2Southern Marine Science and Engineering Guangdong Laboratory (Zhuhai), Zhuhai, China
- 3State Key Laboratory of Satellite Ocean Environment Dynamics, Second Institute of Oceanography, Ministry of Natural Resources, Hangzhou, China
As a kind of weather phenomenon with destructive wind and heavy rainfall, tropical cyclones (TCs), especially the landing TCs, can cause severer economic damage and losses of life. Philippines is one of the countries mostly affected by Tropical cyclones (TCs). Based on the best-track TC data and global atmospheric and oceanic reanalysis data, the present paper investigates the isolated and combined effects of two intraseasonal oscillations, the Madden-Julian oscillation (MJO) and the quasi-biweekly oscillation (QBWO), on landfall of TCs in the Philippines during boreal summer (May-September) in 1979-2019. The results show that both the MJO and the QBWO can significantly affect the frequency, landfall intensity, location, and translation speed of TCs that make landfall in the Philippines. During the convective (non-convective) phases of the MJO and the QBWO, more (less) frequent and stronger (weaker) TCs make landfall in the Philippines. This is due to the increased (decreased) frequency of TCs formation in the NWP and environmental factors in the region east of the Philippines that are favorable (unfavorable) for the development of TCs. With the northward propagation of the convective signals of the MJO and QBWO, the Western Pacific Subtropical High (WPSH) shifts eastward, and the steering flow is unfavorable for westward movement of NWP TCs. This, in turn, causes a northward shift in the landfall locations and a decrease in the translation speed of TCs. These results are helpful for the prediction of the TCs affecting the Philippines.
1 Introduction
The Philippines is located in the western boundary of the northwestern Pacific (NWP), the most active region of tropical cyclone (TC) activity in the world. This makes the Philippines the country mostly affected by TCs. Every year on average, 18 TCs affect the Philippines and 3.6–6 TCs make landfall in the Philippines (Takagi and Esteban, 2016; Corporal-Lodangco and Leslie, 2017). These landfalling TCs bring very strong winds, heavy rains and storm surges, which cause loss of life and considerable economic damage in the Philippines (Warren, 2016).
The TCs affecting the Philippines have been widely studied (Lyon and Camargo, 2009; Corporal-Lodangco et al., 2016; Corporal-Lodangco and Leslie, 2016; Warren, 2016). Kubota and Chan (2009) found that the TC Landfall Frequency in the Philippines (TLFP) has a significant interdecadal variation. Prior to 1939, this variability had a period of about 32 years, but after 1945 the period has decreased to about 10–22 years. Kubota and Chan found that the decadal variation of the TLFP was related to the different phases of ENSO and the Pacific decadal oscillation (PDO). During the negative phase of the PDO, more (fewer) TCs made landfall in the Philippines in El Niño (La Niña) years. However, during the positive phase of PDO, the difference in TLFP frequency between El Niño and La Niña years is not obvious. Corporal-Lodangco and Leslie (2017) showed that the annual variation of TLFP was affected by El Niño/Southern Oscillation (ENSO). They found that the TLFP decreases in El Niño years, while it increases (decreases) from April to June and October to December (from January to March and July to September) in La Niña years. Cinco et al. (2016) analyzed the TCs affecting the Philippines during 1951–2013 and found that there was a slight decreasing trend in the number of landfalling TCs in the Philippines, which has become more pronounced over the last two decades.
Landfall intensity is an important factor for the disaster prevention. Previous studies have shown that the intensity of TC landing in the Philippines was affected by several factors. Takagi and Esteban (2016) conducted a case analysis of two Super Typhoons (STY) that made landfall in the Philippines: STY Haiyan and STY Zeb. They found that the abnormally high sea surface temperature (SST) around the Philippines was the main reason for the extreme development of these two TCs into STYs. Choi et al. (2015) analyzed changes in TC intensity over the past 62 years (1951–2012) by calculating the annual average minimum central pressure of TCs that affected the Philippines between July to September. Their results showed that the middle atmospheric humidity, lower atmospheric temperature and SST are all important factors driving the generation and intensification of TCs.
The NWP is affected by two intraseasonal oscillations, the Madden-Julian oscillation (MJO), with a period of about 30–60 days (Madden and Julian, 1971), and the quasi-biweekly oscillation (QBWO), with a period of about 10–20 days (Krishnamurti and Bhalme, 1976). Previous studies have shown that these intraseasonal oscillations can significantly affect the genesis, motion and intensity of TCs over the NWP (Kim et al., 2008; Mao and Wu, 2010; Huang et al., 2011; Li and Zhou, 2013a; Yoshida et al., 2014; Zhao et al., 2015a; Zhao et al., 2015b; Kikuchi, 2021; Nakano et al., 2021). Li and Zhou (2013b) further found that both the MJO and the QBWO significantly affect the TC landfall frequency in China, the Philippines, Korea and Japan. In addition, other factors, such as landfall location, landfall intensity and translation speed are important for the degree of damage caused by the landfalling TCs. In the present study, a comprehensive analysis of the impact of the MJO and the QBWO on the characteristics of landfalling TCs in the Philippines is conducted.
2 Data and methodology
2.1 Data
The best track data of TCs was obtained from the Japan Meteorological Agency. This data records at 6-h intervals the track of tropical cyclones with maximum intensity levels reaching tropical storm and above. It includes location, minimum central pressure, maximum sustained wind speed and other meteorological variables.
The atmospheric datasets were obtained from the European Centre for Medium Range Weather Forecasts (ECMWF). The dataset version used in the present study is the fifth generation ECMWF analysis data (ERA5, Hersbach et al., 2023). The variables used in the present study are divergence at 200 hPa, geopotential height at 500 hPa, relative humidity from 500 to 700 hPa, winds from 200 to 850 hPa. The temporal and spatial resolutions of the ERA5 dataset are 6h and 0.25° × 0.25°, respectively.
Daily outgoing longwave radiation (OLR) is obtained from U.S. National Oceanic and Atmospheric Administration (NOAA) (Liebmann and Smith, 1996), with a spatial resolution is 2.5° × 2.5°. All the above datasets cover the time period May to September of each year from 1979 to 2019.
2.2 Determination of phase of the MJO and QBWO
To get the phase of MJO and QBWO, we firstly used a Gaussian filter to get the 10–20 days and 30–60 days filtered OLR. Then an empirical orthogonal function (EOF) analysis is applied to the 10–20 days and 30–60 days filtered OLR to get the dominant modes of the MJO and the QBWO, as done in previous studies (Kim et al., 2008; Huang et al., 2011; Li and Zhou, 2013a). Using the first two principal components, the MJO and QBWO modes are divided into 8 phases, as was done by Jia and Yang (2013). In order to emphasize the propagation characteristics of MJO and QBWO around the Philippines, a region of 0°–30°N, 100°–170°E is chosen in the present study for performing the EOF analysis, instead of adopting a meridional range of 15°S–15°N as in Wheeler and Hendon (2004).
3 Results
As shown in Figure 1, convective signals (i.e., negative OLR anomalies) of the MJO appear to the south of the Philippines in phase 5 and then propagate northeastward during phases 6, 7, 8 and 1, which affects most regions of South China Sea and the Philippines. In phase 2, convective and non-convective signals (i.e., positive OLR anomalies) dominate the northern and southern Philippines, respectively. In phases 3-5, non-convective signals of the MJO cover most of Philippines. With respect to the QBWO, the convective signals appear to the southeast of the Philippines during phase 1 and then propagate northwestward. These convective signals affect most of the Philippines and the South China Sea during phases 2–4, and then affect the northern Philippines and the southern coast of China during phase 5. The non-convective signals of the QBWO appear over the southeastern Philippines in phase 5, dominate the Philippines during phases 6–8, affect the northern Philippines during phase 1 and no longer affect the Philippines during phase 2. Based on the above characteristics of the MJO and QBWO, the phases of the MJO and QBWO are divided to two groups: convective and non-convective. Convective phases include phases 1, 6–8 of the MJO and phases 2–5 of the QBWO when convective signals are close to the Philippines, while non-convective phases include the phases 2–5 of the MJO and phases 1, 6–8 of the QBWO when non-convective signals are close to the Philippines.
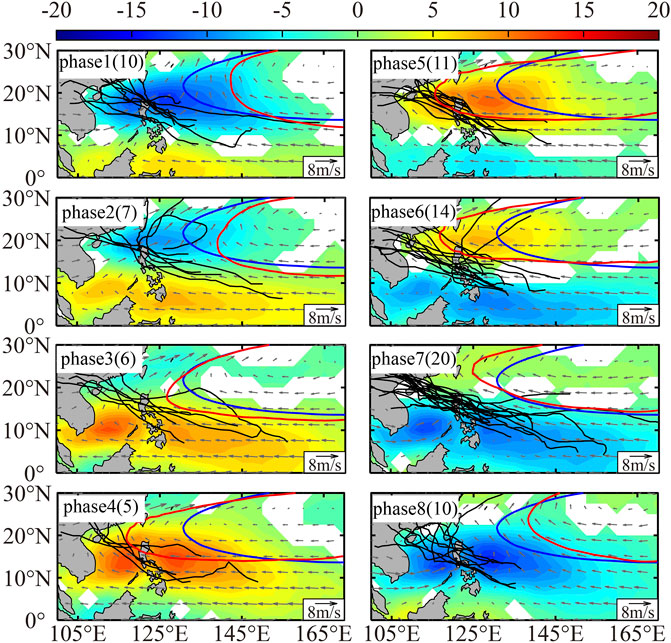
FIGURE 1. The composite OLR anomalies (color, W m−2), tracks of TCs (black lines), location of western Pacific subtropical high and 300–850 hPa mass weighted steering flow (vector, m s−1) in each phase of the MJO. Blue curves denote the location of the climatological 5,870 geopotential height at 500 hPa, and the red curves denote the location of the 5,870 geopotential height at 500 hPa in each phase of the MJO. Numbers in brackets are number of the landfalling TCs in each phase of the MJO. The phase that the TC belongs to is determined by the landfalling day.
Knowledge of the frequency, landfall intensity, location and translation speed of the TCs are important for the disaster prevention. The impact of the MJO and the QBWO on these factors and the mechanisms behind the behavior are systematically discussed below.
3.1 Frequency
Among the 610 TCs that formed in the NWP (excluding the TCs that formed in the South China Sea), 83 made landfall in the Philippines (excluding Batanus Island and other small islands to the north of Luzon Island) during summer (May-September) between 1979–2019. As shown in Table 1, the number of Philippines landfalling TCs shows significant variation in the different phases of the MJO and the QBWO. With respect to the MJO, up to 20 TCs made landfall in the Philippines during phase 7, while only 5 TCs made landfall in the Philippines during phase 4. More (less) TCs made landfall in Philippines during the convective (non-convective) phase of the MJO. There were 54 TCs that made landfall in the Philippines during the convective phases (phases 1, 6–8), while only 29 TCs made landfall in the Philippines during the MJO’s non-convective phases (phases 2–5). With respect to the QBWO, the number of TCs that made landfall in the Philippines reaches its maximum during phases 3 (25 TCs) and its minimum during phase 7 (2 TCs). There were 65 TCs that made landfall in the Philippines during the QBWO’s convective phases (phases 2–5), while only 18 TCs made landfall in the Philippines in its non-convective phases (phases 1, 6–8). The ratio between the number of landfalling TCs during the QBWO’s convective phases and its non-convective phases (about 3.61) is nearly twice of that of the MJO (about 1.86), indicating that the modulation of the number of TCs that made landfall in the Philippines is much stronger in the QBWO. As shown in Table 1, the number of days in each phase of the MJO and the QBWO are different. To better evaluate the impact of the MJO and the QBWO on the frequency of the Philippines landfalling TCs, the daily landfall rate (DLR, the number of landfalling TCs divided by the duration of each phase) is used hereafter in this study. In generally, the variation of the DLR is similar to the number of landfalling TCs, which is larger (smaller) during convective (non-convective) phases of the MJO and the QBWO. The DLR shows that the landfall activity is significantly enhanced (suppressed) in phase 7 (4) of the MJO and phases 2–3 (7–8) of the QBWO.
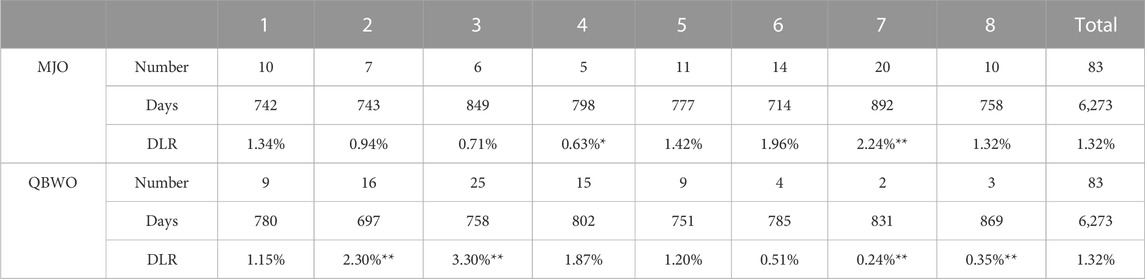
TABLE 1. Number of Philippines landfalling TCs, duration and daily landfall Rate (DLR) in each phase of the MJO and the QBWO. The number of TCs in each phase is determined by the day when each TC made landfall in the Philippines. The entries followed by one and two asterisks (*) are statistically significant at the 90% and 95% confidence level, respectively. The phase that the TC belongs to is determined by the landfalling day.
Previous studies have shown that the Western Pacific Subtropical High (WPSH) has a great influence on the motion of TCs that form in the NWP(Chen, 2009; Li and Zhou, 2013b; Wang and Wang, 2013; Choi et al., 2015; Ling et al., 2015). When the WPSH shifts westward (eastward), the steering flow favors the westward propagation (recurving northward) of NWP TCs. As shown in Figures 1, 2, with the northward propagation of convective (non-convective) signals of the MJO and the QBWO, the WPSH shifts eastward (westward). Although the WPSH shifts more eastward during MJO phases 1,2,8 and QBWO phases 2, 3, 4, more TCs make landfall in the Philippines (Table 1) during these phases. This is because more NWP TCs formed during these or previous phases when the convective signals of the MJO and the QBWO were located over the NWP (Table 2). As shown in Table 2, a total of 266 TCs formed during phases1, 2, 8 of the MJO, and 270 TCs formed during phases 2, 3, 4 of the QBWO. The ratio between the number of Philippine landfalling TCs and the total number of NWP TCs in each phase shows that a lower (higher) proportion of NWP TCs made landfall in the Philippines when the position of the WPSH was more eastward (westward), except during phases 2 and 3 of the QBWO. The reason for this was that the genesis locations of NWP TCs were closer to the Philippines during these phases. As shown in Table 2, the mean longitude of the western Pacific tropical cyclones was 138.9oE and 140.4°E during phases 2 and 3 of the QBWO, respectively, which were significantly westward of the mean genesis longitude of the NWP TCs at 143.6°E.
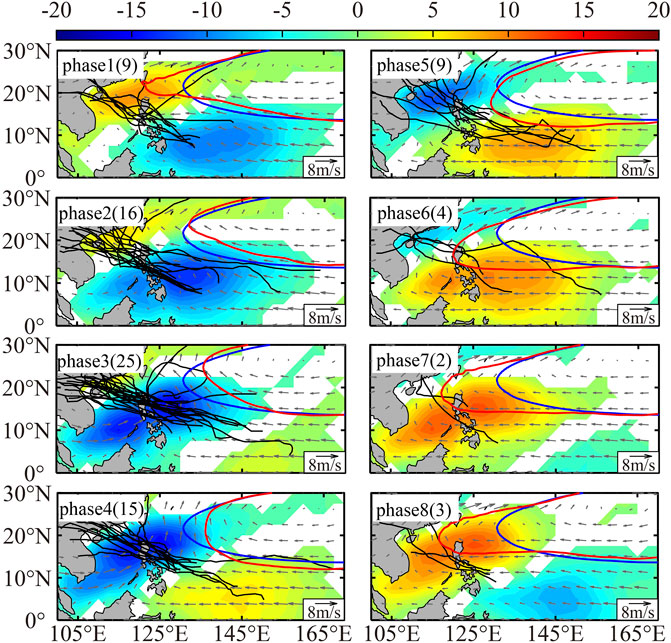
FIGURE 2. The same as Figure 1, but for the QBWO.
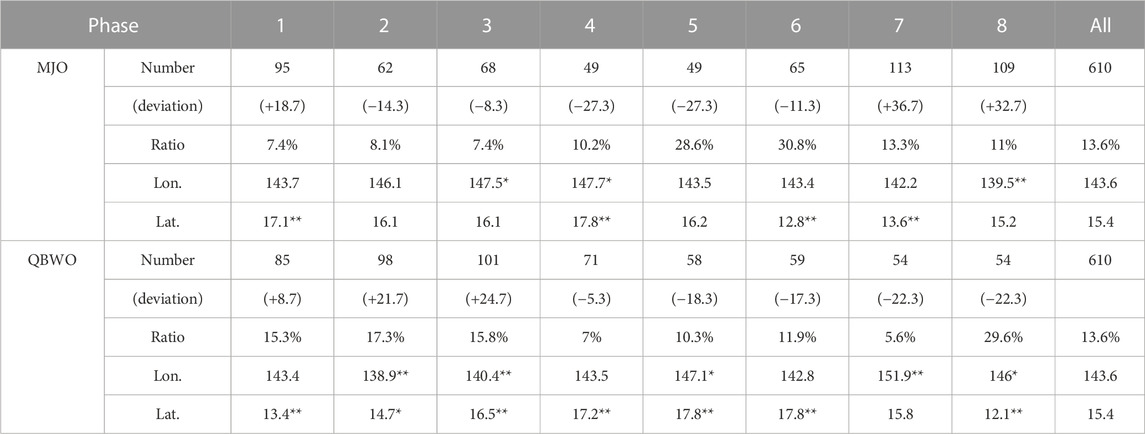
TABLE 2. The number, genesis location of TCs and ratio between the landfalling TCs and total number of NWP TCs during each phase of the MJO and the QBWO in the NWP. The phase that the TC belongs to is determined by the TC genesis day. Entries followed by one and two asterisks are statistically significant at the 90% and 95% confidence level, respectively.
Figure 3 shows the combined effects of the MJO and the QBWO on the number of TCs that made landfall in the Philippines. Among the 83 landfalling TCs, 44 TCs made landfall in the Philippines during the active phases of both the MJO and the QBWO (Figure 3A), while only 8 TCs made landfall in the Philippines during the inactive phases of both the MJO and the QBWO (Figure 3D). As shown in Figures 3B, C, the number of Philippine landfalling TCs was 21 (10) during the convective (non-convective) phases of the QBWO and the convective (non-convective) phases of the MJO. These results reveal that both the MJO and the QBWO have great impact on the frequency of TCs making landfall in the Philippines. The number of TCs during the convective MJO and non-convective QBWO phases is nearly equal to the number of TCs during both non-convective phases of the MJO and QBWO, which indicates that the frequency of Philippine landfalling TCs is significantly suppressed during the inactive phases of the QBWO. This confirms that the modulation of the frequency of Philippine landfalling TCs by the QBWO is stronger than that by the MJO.
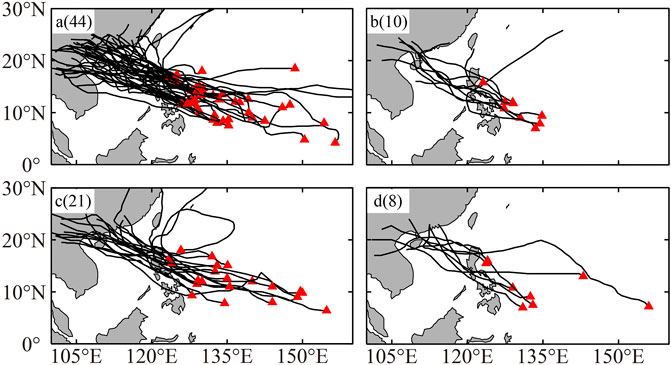
FIGURE 3. Tracks (black lines) and number (numbers in brackets) of Philippines landfalling TCs as a function of the phases of the MJO and the QBWO. Red triangles represent the location of tropical cyclogenesis. (A) Convective phases of both the MJO and the QBWO; (B) convective phases of the MJO and non-convective phases of the QBWO; (C) convective phases of the QBWO and non-convective phases of the MJO; (D) non-convective phases of both the MJO and the QBWO. The phase that the TC belongs to is determined by the landfalling day.
3.2 Landfall location
Considering the geography of the Philippines, the latitude of TC landfall is used to represent the landfall location of a TC. As shown in Figure 4, the range of average landfall latitude was 13.4°N-17.0°N during different MJO phases and 12.2°N-16.7°N during different QBWO phases. For the MJO, the landfall latitude gradually moves southward during phases 1–4 and then shifts northward during MJO phases 1, 6, 7, 8. For the QBWO, the landfall latitude shifts northward during phases 1–4 and southward during phases 6–8. The variation in landfall latitude is consistent with the movement of the WPSH. Figure 4 shows the longitude of the westward extending pole of the WPSH. It is obvious that when the WPSH shifts westward (eastward), the landfall latitude shifts southward (northward). With the northward propagation of convective signals during phases 1–4 of the QBWO and phases 1, 6–8 of the MJO (Figures 1, 2), the WPSH gradually shifts eastward, leading to a northward shift of the landfall latitude. In phases 2–5 of the MJO and phases 5–8 of the QBWO, the WPSH extends westward when the non-convective signals dominate the region around the Philippines (Figures 1, 2), resulting in a southward shift of the landfall latitude. In addition, the north-south shift of the landfall location may also be affected by the location of cyclogenesis. As shown in Table 1, the latitude of TC genesis gradually shifts northward following the northward propagation of the convective signals of the MJO and the QBWO, which can also lead to a northward shift of the landfall location.
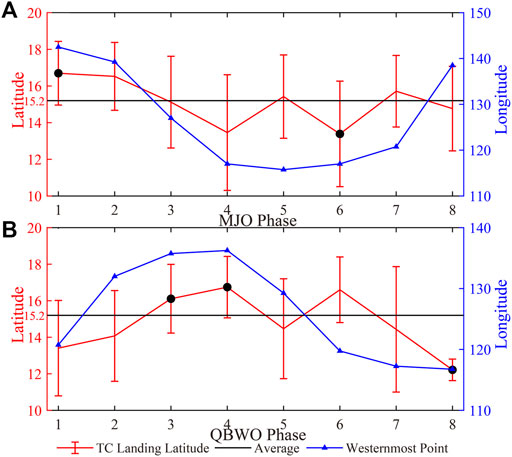
FIGURE 4. The mean latitude and its standard deviation (red lines) of landfalling TCs in each phase of the MJO (A) and the QBWO (B). The blue line indicates the westward extension of the pole of the WPSH. The black dots indicate results that are statistically significant at the 95% level. The phase that the TC belongs to is determined by the landfalling day.
3.3 Landfall intensity
The TC dataset from the Japanese Meteorological Agency only provides the maximum wind speeds exceeding 35 knots, therefore the minimum central pressure was chosen to represent TC intensity. As shown in Figure 5, the landfall intensity is stronger (weaker) in phases 1, 3, 7 (2, 4, 5, 6, 8) of the MJO and phases 3, 4, 5, 8 (1, 2, 6, 7) of the QBWO. Generally, the landfall intensity was stronger (weaker) during the convective (nonconvective) phases, which is clearly seen during the different QBWO phases. The development of a TC is affected by several factors, and the anomalies of these factors during the convective and non-convective phases are examined in Figures 6, 7. During the convective (non-convective) phases of the MJO and the QBWO, the anomalous relative vorticity at 850 hPa, divergence at 200 hPa and relative humidity at 500 hpa were positive (negative), which is favorable (unfavorable) for the development of TCs. The vertical wind shear between 200 and 850 hPa was positive (negative), which is unfavorable (favorable) for the development of TCs. However, the magnitude of the anomalous vertical wind shear is small (less than 1 m/s) in most of the region east of Philippines.
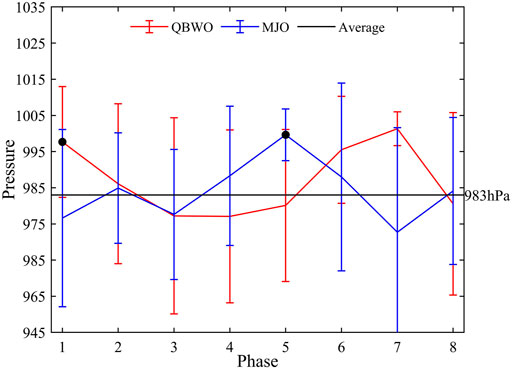
FIGURE 5. The mean minimum central pressure and its standard deviation of the Philippine landfalling TCs during different phases of the MJO (blue line) and the QBWO (red line). The black dots indicate pressures that exceed the 95% confidence level based on a Student's t-test. The phase that the TC belongs to is determined by the landfalling day.
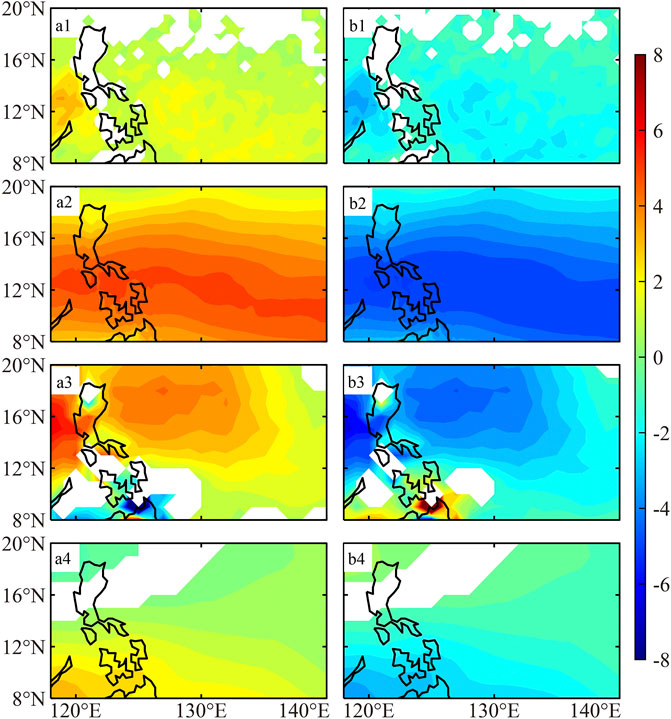
FIGURE 6. Composite anomalies of the (A1,B1) divergence at 200 hPa (10−6s−1), (A2,B2) relative humidity at 500–700 hPa (%), (A3,B3) relative vorticity at 850 hPa (10−6s-1), (A4,B4) vertical wind shear at 200-850 hPa (m s−1) during (A) convective and (B) non-convective phases of the MJO. Only values exceeding 95% confidence level are plotted.
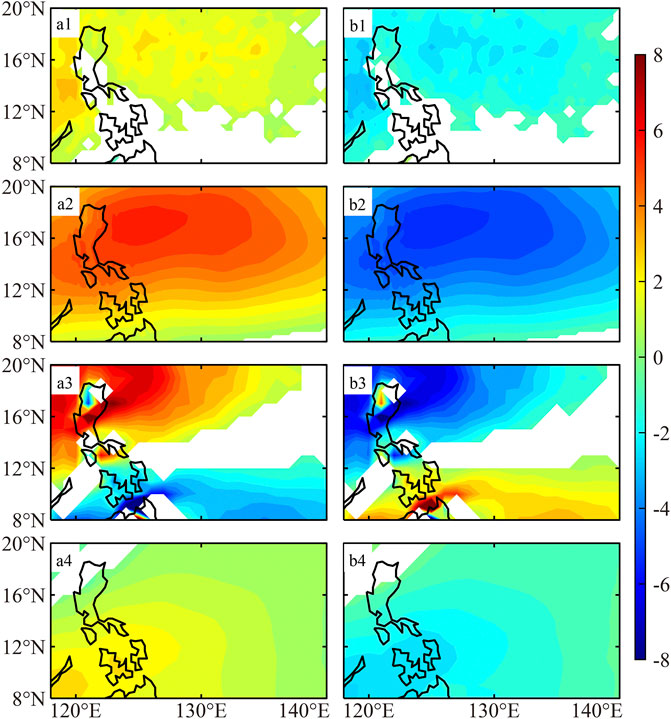
FIGURE 7. Composite anomalies of the (A1,B1) divergence at 200 hPa (10–6s–1), (A2,B2) relative humidity at 500–700 hPa (%), (A3,B3) relative vorticity at 850 hPa (10–6s-1), (A4,B4) vertical wind shear at 200-850hPa (m s–1) during (A) convective and (B) non-convective phases of the QBWO. Only values exceeding 95% confidence level are plotted.
Besides the atmospheric conditions, the ocean thermal condition is also crucial to TC development. Figure 8 shows the SST anomaly (SSTa) in the convective and non-convective phases of MJO and QBWO. As shown in Figures 8A, B, the SSTa is negative (positive) in the southern (southern) region of the NWP in the convective (non-convective) phases of MJO. The magnitude of SSTa in the region east of Philippines are the smallest. To QBWO, the SSTa is negative (positive) in the convective (non-convective) phases (Figures 8A1, B1), which is unfavorable (favorable) for the development of the TCs. However, the magnitude of the SSTa in the convective and non-convective phases of MJO and QBWO is small (less than 0.2°C) in most regions. And the SST is above 29°C, which is favorable for TC development. Though the anomalies of the vertical wind shear and SSTa are unfavorable (favorable) for TC development, the magnitude of the anomalies is small. Consequently, the landfall intensity is stronger (weaker) during convective (non-convective) phases as a result of the combined effects of the above atmospheric and oceanic factors.
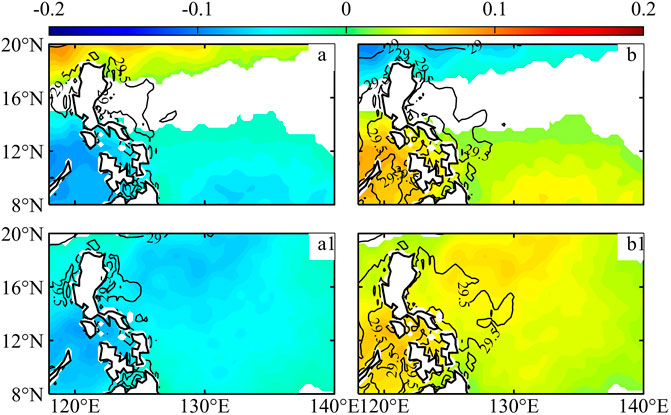
FIGURE 8. Composite anomalies of the SST (color, °C) and SST (black lines, °C) during (A,A1) convective and (B,B1) non-convective phases of the MJO (first line) and QBWO(second line). Only values exceeding 95% confidence level are plotted.
As mentioned above, the landfall intensity is not as clearly stronger (weaker) during the convective (non-convective) phases of the MJO as they are for the QBWO. There are two possible reasons for this difference. One is the propagation direction of the intraseasonal signals. The propagation direction of the QBWO signals is consistent with the motions of TCs, while that of the MJO is contrary to the motions of the TCs. This would significantly affect the interaction time between the TCs and the favorable conditions introduced by the intraseasonal signals. Another reason is the duration of storm development (time between genesis and landfall). As shown in Table 3, the time between genesis and landfall of TCs landing in the Philippines during MJO phases 2, 3 are 4.1 days and 3.8 days, respectively, while those during phases 6 and 8 are only 1.6 and 1.7 days. Shorter time between the genesis and the landfall means that the TCs have a very short time to develop, resulting in relatively weak landfall intensities during phases 6, 8 of the MJO. This also provides an explanation for why the landfall intensity during some less favorable non-convective phases is slightly stronger than that during more favorable convective phases. For the QBWO, the time between the genesis and landfall are longer (shorter) during convective (non-convective) phases, so the fact that landfall intensity is stronger (weaker) in convective (non-convective) phases is more readily apparent.

TABLE 3. The time between the genesis and landfall of TCs in each phase of the MJO and the QBWO. Entries followed by one or two asterisks are statistically significant at the 90% and 95% confidence, respectively.
3.4 Translation speed at time of landfall
Translation speed at the landfall time can significantly affect the impact duration and the integrated precipitation over the Philippines. As shown in Figure 9, the mean translation speed for TCs making landfall in the Philippines is about 6.6 m/s. The translation speed during the different MJO phases shows a regular variation, with increases during phases 1, 2, 3 of the MJO, and a gradual decrease from phase 3 to phase 8. For the QBWO, the translation speed is faster (slower) than the mean value during phases 2, 3, 4, 7 (1, 5, 6, 8). While the translation speed reaches a large maximum (9.5 m/s) during phase 7 of QBWO, it should be noted that there were only two TCs that made landfall in the Philippines during this phase (Table 1). During the convective phases of both the MJO and the QBWO (phases 2–5 of the QBWO and phases 6, 7, 8, 1 of the MJO), the translation speed tends to be slower.
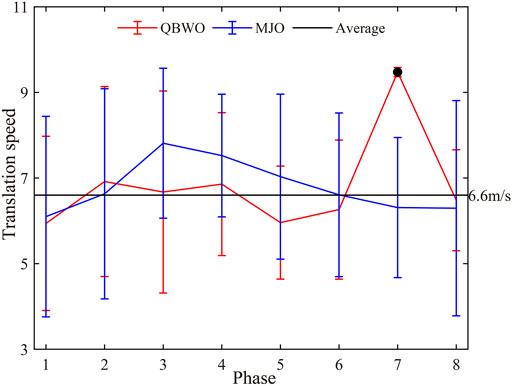
FIGURE 9. The mean translation speed (ms−1) and its standard deviation of the TCs that made landfall in the Philippines during each phase of the MJO (blue line) and the QBWO (red line). The black dot indicates results that are statistically significant at the 95% confidence level. The phase that the TC belongs to is determined by the landfalling day.
Translation speed is significantly affected by the steering flow. Figure 10 shows the anomalous steering flow at different latitudes in the region to the east of the Philippines (122°E–125°E) during different phases of the MJO and the QBWO. The steering flow is defined as the mass-weighted mean flow between 300 and 850 hPa (Holland, 1983). For the MJO, anomalous westerlies (easterlies) dominate the region to the east of the Philippines during convective (non-convective) phases. Anomalous southerlies (northerlies) appear during phases 1 and 2 (phases 3-8) of the MJO, but their amplitude is much weaker than the zonal winds. For the QBWO, anomalous westerlies and southerlies (easterlies and northerlies) dominate the region to the east of Philippines during the convective (non-convective) phases, with the meridional winds lagging the zonal winds by one phase. Since TCs landfalling in the Philippines take westward or northwestward trajectories, anomalous easterlies and southerlies (westerlies and northerlies) favors the acceleration (deceleration) of these TCs. With the northward propagation of the convective signals of the MJO and the QBWO, anomalous westerlies spread from the south to the north, leading to a deceleration of the translation speed (Figure 8), although anomalous southerlies favor the acceleration of TCs. During non-convective phases, anomalous easterlies also spread from the south to the north, but the translation speed does not show a clear acceleration tendency. This may be the result of the fewer number of TCs that made landfall in the Philippines during these phases.
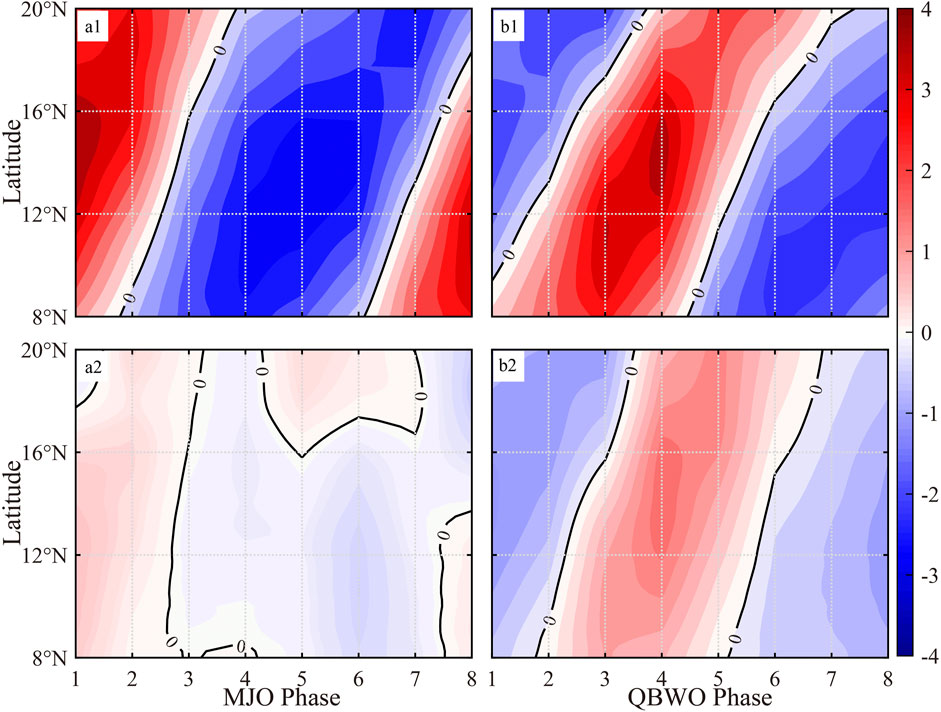
FIGURE 10. Composite anomalies of (A1,B1) zonal and (A2,B2) meridional winds (ms−1) during different phases of the MJO (left column) and the QBWO (right column) in the region to the east of the Philippines (8°N-20°N, 122°E-125°E).
4 Conclusion and discussion
In the present study, the effects of the MJO and the QBWO on TCs that made landfall in the Philippines were investigated. The results show that more (less) TCs landfall in the Philippines during the convective (non-convective) phases of the MJO and the QBWO. This resulted from the fact that more (less) TCs were generated, and the locations of tropical cyclogenesis were closer to (farther away from) the Philippines, although the WPSH shifted eastward (westward). Compared to the MJO, the effect of the QBWO on the number of TCs that made landfall in Philippine is more significant. The ratio of the number of Philippine landfalling TCs between the convective and non-convective phases of the QBWO is about twice of that of the MJO. During the convective (non-convective) phases of the MJO and the QBWO, the WPSH moves eastward (westward), resulting in a northward (southward) shift in landfall locations in the Philippines. Generally, the landfall intensity is stronger (weaker) during the convective phase (non-convective phase), resulting from an environment that is favorable (unfavorable) for the development of TCs. This behavior is more pronounced during the different phases of the QBWO. There are two reasons for this: one is that the propagation direction of the QBWO is consistent with that of the TCs, while the propagation direction of the MJO is counter to that of the TCs. Another reason is the time between the genesis and landfall of TCs is longer (shorter) during the convective (non-convective phases) of QBWO giving the TCs more (less) time to intensify, while the time between the genesis and landfall during some convective phases of the MJO is much shorter than that in some non-convective phases of the MJO. The translation speed of the landfalling TCs in the Philippines is also modulated by the MJO and the QBWO. During the convective phases, abnormal westerlies dominate the region to the east of Philippines and spread from the south to the north, which is conducive to the deceleration (acceleration) of the landfalling TCs. While there is not a clear acceleration tendency during non-convective phases, even though abnormal easterlies prevail in the region to the east of Philippines, this may be an artifact from the scarcity of TCs make landfall in the Philippines during these phases.
In addition to the TCs from the NWP, some TCs that formed in the South China Sea (SCS) also made landfall in the Philippines. As shown in Table 4, there were only 7 SCS TCs that made landfall in the Philippines in boreal summer between 1979 and 2019. All 7 landfall events occurred during phases 1, 7, 8 of the MJO and phases 3, 4, 5 of the QBWO. This is because the eastward motion of TCs originating in the SCS is controlled by intraseasonal oscillations (Yang et al., 2015; Ling et al., 2016; Ling et al., 2020). In the convective phases, the WPSH shifts eastward, and the steering flow is favorable for the eastward movement of the SCS TCs. Although the number of TCs from the SCS that made landfall in the Philippines is much less than those from the NWP, the genesis location of the SCS TCs is closer to the Philippines, which leads to a rapid landfall after tropical cyclogenesis.
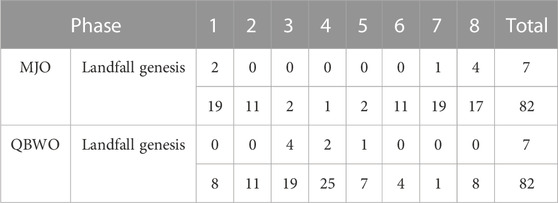
TABLE 4. The total number of SCS TCs and the number that made landfall in the Philippines during each phase of the MJO and the QBWO. The phase that the TC belongs to is determined by the landfalling day.
Data availability statement
Publicly available datasets were analyzed in this study. This data can be found here: http://www.jma.go.jp/jma/jma-eng/jma-center/rsmc-hp-pub-eg/besttrack.html. https://cds.climate.copernicus.eu/cdsapp#!/dataset/. http://www.esrl.noaa.gov/psd/.
Author contributions
Conceptualization: ZL, HH and PW. Methodology: ZL, HH and PW. Software: PW and ZL. Formal analysis: PW. Writing- Original draft: PW and ZL. Writing- Reviewing and Editing: ZL and PW. Visualization: PW and ZL. All authors listed have made a substantial, direct, and intellectual contribution to the work and approved it for publication.
Funding
This study was supported by Guangdong Provincial College Innovation Team Project (2019KCXTF021), First-class Discipline Plan of Guangdong Province (080503032101, 231420003) and Oceanic Interdisciplinary Program of Shanghai Jiao Tong University (SL2020MS030).
Acknowledgments
The Japan Meteorological Agency best track TC dataset was downloaded from http://www.jma.go.jp/jma/jma-eng/jma-center/rsmc-hp-pub-eg/besttrack.html. The ERA-5 data were downloaded from https://cds.climate.copernicus.eu/cdsapp#!/dataset/. The OLR data were downloaded from http://www.esrl.noaa.gov/psd/.
Conflict of interest
The authors declare that the research was conducted in the absence of any commercial or financial relationships that could be construed as a potential conflict of interest.
Publisher’s note
All claims expressed in this article are solely those of the authors and do not necessarily represent those of their affiliated organizations, or those of the publisher, the editors and the reviewers. Any product that may be evaluated in this article, or claim that may be made by its manufacturer, is not guaranteed or endorsed by the publisher.
References
Chen, G. (2009). Interdecadal variation of tropical cyclone activity in association with summer monsoon, sea surface temperature over the Western North Pacific. Chin. Sci. Bull. 54 (8), 1417–1421. doi:10.1007/s11434-008-0564-2
Choi, K.-S., Kim, B.-J., Kang, S.-D., and Kim, H.-D. (2015). Interannual variation of the Philippines affecting tropical cyclone intensity and its possible causes. Theor. Appl. Climatol. 122 (1-2), 295–301. doi:10.1007/s00704-014-1281-1
Cinco, T. A. d. G., Ortiz, R. G., Delfino, A. M. D., Lasco, R. J. P., Hilario, R. D., Juanillo, F. D., et al. (2016). Observed trends and impacts of tropical cyclones in the Philippines. J Int. J. Climatol. A J. R. Meteorological Soc. 36, 4638–4650. doi:10.1002/joc.4659
Corporal-Lodangco, I., and Leslie, L. (2016). Cluster analysis of philippine tropical cyclone climatology: Applications to forecasting. J. Climatol. Weather Forecast. 4. doi:10.4172/2332-2594.1000152
Corporal-Lodangco, I. L., and Leslie, L. M. (2017). Climatology of philippine tropical cyclone activity: 1945-2011. Int. J. Climatol. 37 (9), 3525–3539. doi:10.1002/joc.4931
Corporal-Lodangco, I. L., Leslie, L. M., and Lamb, P. J. (2016). Impacts of ENSO on philippine tropical cyclone activity. J. Clim. 29 (5), 1877–1897. doi:10.1175/jcli-d-14-00723.1
Hersbach, H., Bell, B., and Berrisford, P. (2023). ERA5 hourly data on pressure levels from 1940 to present. Copernicus Climate Change Service (C3S) Climate Data Store (CDS). doi:10.24381/cds.bd0915c6
Holland, G. J. (1983). Tropical cyclone motion: Environmental interaction plus a beta effect. J. Appl. Meteorol 15, 1252–1264. doi:10.1175/1520-0469(1983)040<0328:TCMEIP>2.0.CO;2
Huang, P., Chou, C., and Huang, R. (2011). Seasonal modulation of tropical intraseasonal oscillations on tropical cyclone geneses in the western north pacific. J. Clim. 24 (24), 6339–6352. doi:10.1175/2011jcli4200.1
Jia, X., and Yang, S. (2013). Impact of the quasi-biweekly oscillation over the Western North Pacific on East Asian subtropical monsoon during early summer. J. Geophys. Research-Atmospheres 118 (10), 4421–4434. doi:10.1002/jgrd.50422
Kikuchi, K. (2021). The boreal summer intraseasonal oscillation (BSISO): A review. J. Meteorological Soc. Jpn. 99 (4), 933–972. doi:10.2151/jmsj.2021-045
Kim, J.-H., Ho, C.-H., Kim, H.-S., Sui, C.-H., and Park, S. K. (2008). Systematic variation of summertime tropical cyclone activity in the Western north Pacific in relation to the madden-julian oscillation. J. Clim. 21 (6), 1171–1191. doi:10.1175/2007jcli1493.1
Krishnamurti, T. N., and Bhalme, H. N. J. J. o. t. A. S. (1976). Oscillations of a monsoon system. Part I. Observational aspects. Obs. Asp. 33 (10), 1937–1954. doi:10.1175/1520-0469(1976)033<1937:ooamsp>2.0.co;2
Kubota, H., and Chan, J. C. L. (2009). Interdecadal variability of tropical cyclone landfall in the Philippines from 1902 to 2005. Geophysical Research Letters. 36. doi:10.1029/2009gl038108
Li, R. C. Y., and Zhou, W. (2013a). Modulation of western north pacific tropical cyclone activity by the ISO. Part I: Genesis and intensity. J. Clim. 26 (9), 2904–2918. doi:10.1175/jcli-d-12-00210.1
Li, R. C. Y., and Zhou, W. (2013b). Modulation of western north pacific tropical cyclone activity by the ISO. Part II: Tracks and landfalls. J. Clim. 26 (9), 2919–2930. doi:10.1175/jcli-d-12-00211.1
Liebmann, B., and Smith, C. A. J. B. A. M. S. (1996). Description of a complete (interpolated). Outgoing Longwave Radiat. Dataset 77, 1275–1277.
Ling, Z., Wang, G., and Wang, C. (2015). Out-of-phase relationship between tropical cyclones generated locally in the South China Sea and non-locally from the Northwest Pacific Ocean. Clim. Dyn. 45 (3-4), 1129–1136. doi:10.1007/s00382-014-2362-7
Ling, Z., Wang, Y., Wang, G., and He, H. (2020). Impact of intraseasonal oscillations on the activity of tropical cyclones in summer over the South China sea: Nonlocal tropical cyclones. Front. Earth Sci. 8. doi:10.3389/feart.2020.609776
Ling, Z., Wang, Y., and Wang, G. (2016). Impact of intraseasonal oscillations on the activity of tropical cyclones in summer over the South China sea. Part I: Local tropical cyclones. J. Clim. 29 (2), 855–868. doi:10.1175/jcli-d-15-0617.1
Lyon, B., and Camargo, S. J. (2009). The seasonally-varying influence of ENSO on rainfall and tropical cyclone activity in the Philippines. Clim. Dyn. 32 (1), 125–141. doi:10.1007/s00382-008-0380-z
Madden, R. A., and Julian, P. R. J. J. o. A. S. (1971). Detection of a 40-50 Day oscillation in the zonal wind in the tropical pacific. J. Atmos. Sci. 28, 702–708. doi:10.1175/1520-0469(1971)028<0702:doadoi>2.0.co;2
Mao, J., and Wu, G. (2010). Intraseasonal modulation of tropical cyclogenesis in the Western north pacific: A case study. Theor. Appl. Climatol. 100 (3-4), 397–411. doi:10.1007/s00704-009-0195-9
Nakano, M., Vitart, F., and Kikuchi, K. (2021). Impact of the boreal summer intraseasonal oscillation on typhoon tracks in the Western North Pacific and the prediction skill of the ECMWF model. Geophys. Res. Lett. 48 (9), e2020GL091505. doi:10.1029/2020GL091505
Takagi, H., and Esteban, M. (2016). Statistics of tropical cyclone landfalls in the Philippines: Unusual characteristics of 2013 typhoon haiyan. Nat. Hazards 80 (1), 211–222. doi:10.1007/s11069-015-1965-6
Wang, C., and Wang, X. (2013). Classifying El Nino modoki I and II by different impacts on rainfall in southern China and typhoon tracks. J. Clim. 26 (4), 1322–1338. doi:10.1175/jcli-d-12-00107.1
Warren, J. F. (2016). “Philippine Typhoons since the seventeenth century,” in Natural hazards and peoples in the Indian ocean world: Bordering on danger. Editors G. Bankoff, and J. Christensen (New York: Palgrave Macmillan US), 105–141.
Wheeler, M. C., and Hendon, H. H. J. M. W. R. (2004). An all-season real-time multivariate MJO index: Development of an index for monitoring and prediction. Mon. Weather Rev. 132 (8), 1917–1932. doi:10.1175/1520-0493(2004)132<1917:aarmmi>2.0.co;2
Yang, L., Du, Y., Wang, D., Wang, C., and Wang, X. (2015). Impact of intraseasonal oscillation on the tropical cyclone track in the South China Sea. Clim. Dyn. 44 (5-6), 1505–1519. doi:10.1007/s00382-014-2180-y
Yoshida, R., Kajikawa, Y., and Ishikawa, H. (2014). Impact of boreal summer intraseasonal oscillation on environment of tropical cyclone genesis over the western north pacific. Sola 10, 15–18. doi:10.2151/sola.2014-004
Zhao, H., Jiang, X., and Wu, L. (2015a). Modulation of northwest pacific tropical cyclone genesis by the intraseasonal variability. J. Meteorological Soc. Jpn. 93 (1), 81–97. doi:10.2151/jmsj.2015-006
Keywords: Philippines, tropical cyclones, Madden-Julian oscillation, quasi-biweekly oscillation, western Pacific subtropical high
Citation: Wu P, Ling Z and He H (2023) The effects of intraseasonal oscillations on landfalling tropical cyclones in the Philippines during the boreal summer. Front. Earth Sci. 11:1106291. doi: 10.3389/feart.2023.1106291
Received: 23 November 2022; Accepted: 10 May 2023;
Published: 23 May 2023.
Edited by:
Sheng Chen, Chinese Academy of Sciences (CAS), ChinaReviewed by:
Chunsong Lu, Nanjing University of Information Science and Technology, ChinaLi Tao, Nanjing University of Information Science and Technology, China
Copyright © 2023 Wu, Ling and He. This is an open-access article distributed under the terms of the Creative Commons Attribution License (CC BY). The use, distribution or reproduction in other forums is permitted, provided the original author(s) and the copyright owner(s) are credited and that the original publication in this journal is cited, in accordance with accepted academic practice. No use, distribution or reproduction is permitted which does not comply with these terms.
*Correspondence: Zheng Ling, bGluZ3pAZ2RvdS5lZHUuY24=