 Yukun Deng
 Yingying Yao
 Yufeng Zhao
 Dongliang Luo
 Bin Cao
 Xingxing Kuang
 Chunmiao Zheng
- 1Institute of Global Environmental Change, Xi’an Jiaotong University, Xi’an, China
- 2State Key Laboratory of Frozen Soil Engineering, Northwest Institute of Eco-Environment and Resources, Chinese Academy of Sciences, Lanzhou, China
- 3National Tibetan Plateau Data Center, Institute of Tibetan Plateau Research, Chinese Academy of Sciences, Beijing, China
- 4State Environmental Protection Key Laboratory of Integrated Surface Water-Groundwater Pollution Control, School of Environmental Science and Engineering, Southern University of Science and Technology, Shenzhen, China
- 5EIT Institute for Advanced Study, Ningbo, China
The Himalayan and Tibetan Plateau (TP) region serves as the “Asian water tower”. Yarlung Zangbo basin (YZB) is one of most important major rivers originating from TP sustaining billions of lives in the downstream alluvial plain. Climate change has impacted the hydrological cycle in this alpine region; however, the temporal and spatial trends of runoff and the water balance has not been quantified adequately. Here, we have optimized the snowmelt module of the Soil and Water Assessment Tool (SWAT) for the YZB to quantify the historical and future variability in the runoff, snowmelt water, and water balance components. According to the results of the Coupled Model Intercomparison Project Five and Six (CMIP5 and CMIP6) the future precipitation (2020–2099) projected by the CMIP6 will increase by 2.7% when compared to historical reference (1980–2019), while the precipitation will increase by 10.2% when projected by the CMIP5. The increase in average air temperature (2.4°C) projected by CMIP6 exceeds that of CMIP5 (1.9°C). The runoff between 2020 and 2050 will decrease by −12.7% compared with historical reference, and it will further decline by −9.2% during 2060 and 2099. Based on the average results of CMIP5 and CMIP6, the water balance deficit will increase primarily due to an increase in evaporation of 42.4%, whereas snowmelt (−32.1%), water yield (−9.4%), soil water (−19.8%), and groundwater recharge (−17.8%) will decrease. Long-term water balance evaluation implicates that middle and upper reaches will face a higher risk of drought, implying a potential threat to the sustainability of grassland ecosystems upstream.
1 Introduction
The Himalayan and Tibetan Plateau (TP) region is a critical headwater region for most major Asian rivers, including the Yellow River, Yangtze River, Mekong River, Salween River, Irrawaddy, Brahmaputra, Indus, and Ganges. These major rivers play a vital role in providing water for drinking, irrigation, and ecosystem balance for vast downstream alluvial plains (Immerzeel et al., 2010; Huang et al., 2018). Moreover, the surface runoff generated by steep topography in the TP generates sufficient water supply to deliver more than one-third of the hydropower energy in the region to meet the soaring energy demand of Asian countries (Pandit, 2013; Schwanghart et al., 2016; Farinotti et al., 2019; Qin et al., 2021). However, the average annual snow cover in the TP region decreased by one-third at a rate of nearly 1% per year from 1966 to 2001, inevitably affecting the buffering role of snow in controlling river discharge and related environmental processes (Rikiishi and Nakasato, 2006; Deng et al., 2017). Rivers originating in the Himalayas depend heavily on summer seasonal snow melting (Kulkarni et al., 2010). Therefore, it is necessary to predict the long-term changes in runoff, considering the alterations in snow melting under changing climatic conditions, to understand the hydrological cycle and water resource management in the Himalayas.
The TP is a very sensitive region under global warming for its hydrological response has been amplified by global climate change, potentially triggering cascading effects on the carbon cycle. In the past several decades, the climate has undergone profound changes that have altered long-term water balance, thereby increasing uncertainty about water availability and environmental conditions. The temperature has increased at a rate of 0.50°C–0.67°C/decade since 1980, and precipitation has slightly intensified at a rate of 0.98–16.84 mm/decade since the early 1960s (Zhang D. et al., 2013; Yin et al., 2013; Kuang and Jiao, 2016). The warming trend of the TP exceeds the global average (0.32°C/decade), while its increase in precipitation falls behind the global average (15.35 mm/decade) (Zhang D. et al., 2013). As climate warming intensifies, the rate of snow loss continues to accelerate (Yao et al., 2012). Climate and hydrological variations in the Southwest TP have also been studied previously. Wang et al. (2021) pointed out that the contribution of snowmelt to runoff in the YZB is greater than that of glaciers, and the contribution of snowmelt gradually increases from the upstream to the downstream. Using the topographic and linear correction data of 262 rain gauge from China Meteorological Administration (CMA) and Global Land Data Assimilation System (GLDAS), Sun and Su (2020) reconstructed the daily precipitation between 1961 and 2016 dataset with a spatial resolution of 10 km. Global climate models from the fifth and sixth phases of the Coupled Model Intercomparison Project (CMIP5 & CMIP6) predict that the TP warming trend in the 21st century might range from 0.47°C to 0.73°C/decade and 0.45°C–0.92°C/decade, respectively, with the magnitude of increase dependent on different emission paths (Su et al., 2013; Su et al., 2016; Zhang et al., 2021). With the connection between water and energy, this long-term climate change will necessitate the inclusion of water balance components, including water yield (the sum of surface runoff, lateral runoff, and baseflow), evaporation, soil water, and groundwater recharge response, and their detailed quantification, in the effective planning and implementation of water measures (Knobloch et al., 2014; Zhang Y. Q. et al., 2015; Chen R. et al., 2018). In the future climate scenario, if the precipitation in the Lhasa River Basin in the north Himalayas remains unchanged, the runoff might decrease by 5%–35%, and if the precipitation in the Tamor River Basin in the east Himalayas decreases, the runoff might be reduced by more than 8.5% (Bhatta et al., 2019; Tian et al., 2020). However, previous studies had certain limitations: 1) previous analyses focused on water balance at tributary or sub-basin scales, while spatial and temporal variations of hydrological processes at the regional scale are insufficiently characterized; 2) previous studies overlooked the dynamic changes of snowmelt water and water balance components, and; 3) although updated CMIP6 projections provide a better future climate scenario than CMIP5, the long-term water balance differences for the TP between CIMP 5 and 6 have yet to be quantified.
To address these goals, we have optimized the snowmelt module of the SWAT to quantify mountain runoff, snowmelt water, and water balance variations for the YZB area. The water balance consists of evaporation (ET), soil water content (SW), groundwater recharge (GW_RCHG), and water yield (WYLD) under one historical period (1980–2019) and two future periods (near future [NF]: 2020–2059; far future [FF]: 2060–2099). We also divide the YZB into three areas for statistical analysis: upstream, midstream, and downstream. The YZB is an important water resource and hydroelectricity-generating region; it is also a relatively densely populated region on the TP. The hydrological process in the YZB is very sensitive to temperature and precipitation changes, which affect the thawing dynamics of snow-covered areas and the annual and interannual runoff characteristics (Xu et al., 2019). Our findings are relevant to hydrological simulations of alpine regions and the study of cryosphere hydrological processes in the YZB under climate change. Our findings will benefit water resource allocation and management in transboundary river basins in the region.
2 Materials and methods
2.1 Study area
The YZ is the largest alpine river in China, originating from the Jiemayangzong Glacier in the northern Himalayas and flowing to the Bay of Bengal. The YZB in China crosses the southern edge of the Tibetan Plateau (Figure 1) (28°N–31°17′N; 82°E−97°07′E). The YZB lies between the TP and Himalayas and is the upstream segment of the Brahmaputra Basin. The total area of the YZB is 240,000 km2; the main river flows for 2057 km. The average elevation is approximately 4500 m, with topography extending from above 7,000 m to below 150 m above sea level from upstream in the central Himalayas to the downstream Grand Canyon in the eastern Himalayas, respectively.
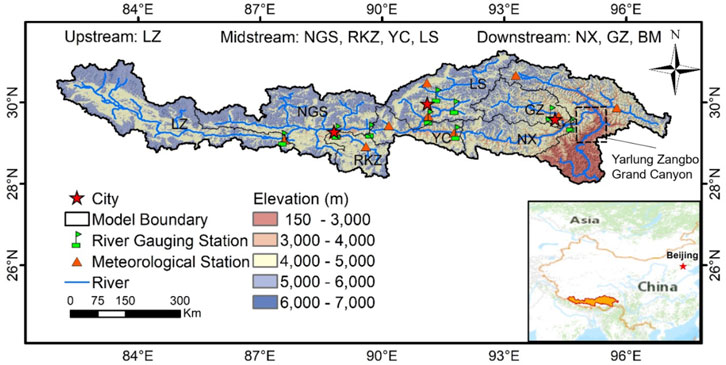
FIGURE 1. Map of the study area.
The YZB has a plateau monsoon temperate semi-arid climate, with an annual average temperature varying between 4.7°C and 8.3°C, with a difference between day and night of 14.7°C–20.9°C (Liu et al., 2019). The annual mean temperature showed a significant upward trend of 0.28°C/decade from 1961 to 2005, which was most pronounced in winter and autumn (You et al., 2007). The annual average precipitation in the study area ranges from 270 to 900 mm, with a mean of 488 mm, based on daily precipitation data from the China Meteorological Administration.
This study focuses on seven main sub-basins of YZB: Lazi (LZ) in the upper reaches, Nugesha (NGS), Rikaze (RKZ), Yangcun (YC), and Lhasa (LS) in the middle reaches, and Nuxia (NX) and Gengzhang (GZ) in the lower reaches. The middle and lower basins of YZB contain major cities and areas of increased population density, such as Rikaze, Lhasa, and Linzhi, whose population accounts for approximately one-third of the total Tibetan population and is the core area of economic and social development. Although the outlet of the YZB is Pasighat downstream of Yarlung Zangbo Grand Canyon (Wang et al., 2022a), and the streamflow records are not available. Thus, the station of NX is primarily as outlet to in the hydrological model for quantifying the water balance in this study.
2.2 Data
We collected elevation, land use, and soil texture data to characterize the topography and land surface conditions (Table 1). The resolution of the digital elevation model (DEM) was 90 m, and the slope in degrees was calculated from the DEM with the same resolution. We summarized the topography and climate characteristics of seven sub-basins in Table 2. Land use primarily included six categories: cultivated land, forest, pasture, water area, urban land, and bare land. The pasture covered the largest area, up to 50.93%, followed by bare land (17.7%) and forest (14.69%). The soil dataset in the study area was obtained from the Cold and Arid Regions Scientific Data Center (http://westdc.westgis.ac.cn/). Soil data with 1 km resolution provides soil characteristics, including soil depth, moist bulk density, organic carbon content, available water capacity, and saturated hydraulic conductivity. During the study period, there were 15 types of soil textures in the YZB, and thin layer soil was the main type, accounting for 74.23% of the total area, while other soil textures accounted for less than 10% or even 1%.
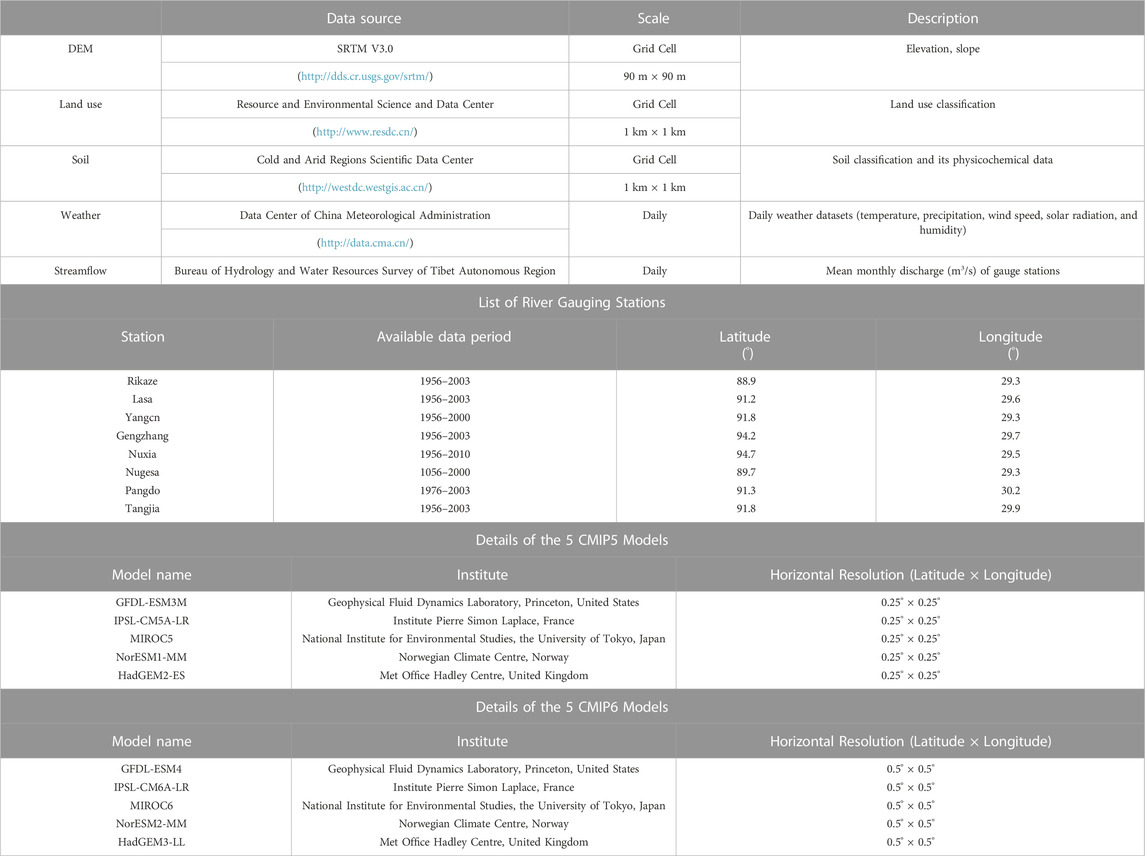
TABLE 1. Data source description.
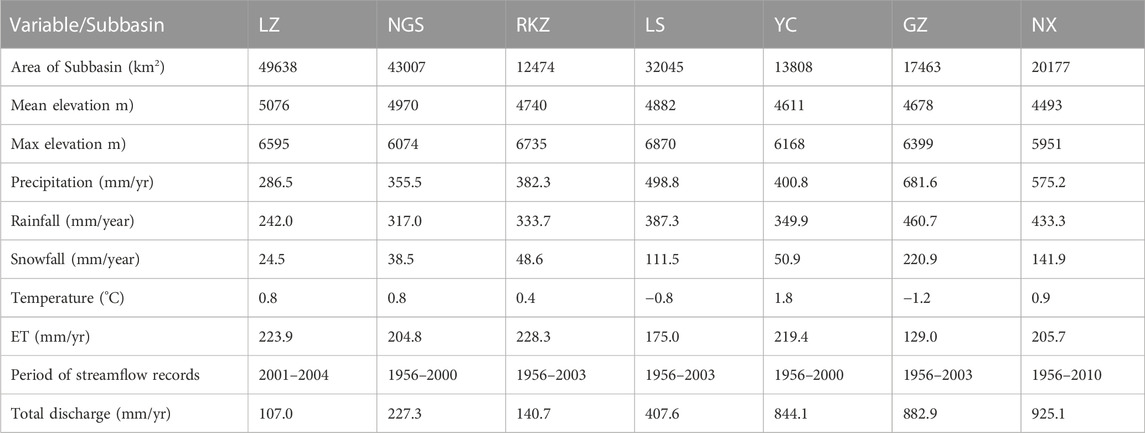
TABLE 2. Summary of drainage subbasins of YZB.
2.2.1 Meteorological and hydrological data
Field meteorological observations from ten weather stations in the YZB between 1951 and 2016 were collected from the Data Center of the China Meteorological Administration (http://www.cma.gov.cn/2011qxfw/2011qsjgx/), including daily minimum temperature, daily maximum temperature, daily precipitation, solar radiation, and wind speed, as shown in Figure 1. The observed runoff data were collected from nine hydrological stations across the YZB from 1961 to 2003, as shown in Table 1.
2.2.2 Climate data
We used five general circulation models (GCMs) under three representative concentration pathways (RCP2.6, RCP4.5, and RCP8.5) of CMIP5 and the corresponding five general circulation models under three shared socio-economic pathways (SSP126, SSP245, and SSP585) of CMIP6 to analyze the impact of climate change on hydrological progress. These models have been demonstrated to have reasonable applicability to the TP region (Chen and Frauenfeld, 2014; Sun et al., 2015; Chan et al., 2016; Zhang et al., 2017). The model data of CMIP5 can be obtained from the National Data Center for Tibetan Plateau Science (Pan et al., 2020; Zhang and Pan, 2020), and the model data of CMIP6 can be sourced from the open website (https://esgf-node.llnl.gov/projects/esgf-llnl/). The details of each GCM are shown in Table 1.
The bias correction (Hawkins et al., 2013; Räty et al., 2014) was used to calibrate the deviation of the GCMs output data. We calculated the deviation coefficient between the monthly scale observation data of the control period and the monthly scale GCMs data of the control period. We then applied it to the future climate data of the GCMs to improve the applicability of the GCMs data in the study area (Su et al., 2016).
For the deviation-corrected precipitation (p) equation:
For the temperature (T):
where subscript
2.3 Hydrological model optimization
2.3.1 Model setup and simulation
The SWAT model is a process-based and semi-distributed river basin model developed by the Agricultural Research Center of the United States Department of Agriculture (Arnold et al., 2012). The SWAT model integrated with the snow package has been applied in alpine regions to simultaneously and continuously simulate long-term hydrological and chemical migration processes, as well as agricultural management measures in the basin (Arnold and Fohrer, 2005). The SWAT model has been successfully utilized to study hydrological fluxes in alpine regions dominated by glaciers and snow cover worldwide (Troin and Caya, 2014; Zhang et al., 2016; Omani et al., 2017; Dhami et al., 2018).
The hydrological process was calculated within each hydrological response unit (HRU) based on the water balance equation. Then the total hydrological process of the sub-basins was obtained by summation (Pang et al., 2020). The water balance equation is as follows (Neitsch et al., 2011):
where
River networks were generated using the DEM data, which was provided by NASA’s Shuttle Radar Terrain Mission (SRTM), and then the study area was divided into 229 sub-basins according to river networks. The data of slope, soil, and land use were superimposed in the model, and 3089 HRUs were generated based on sub-basins as the minimum calculation units of the SWAT model. Meteorological data input from 1951 to 2016, including temperature, precipitation, wind speed, humidity, and solar radiation, were processed as the forcing data for the model. The streamflow data from eight streamflow gauging stations from 1961 to 2000 were used to calibrate and validate the model. Based on the geographical, environmental characteristics and related hydrological model studies in the Himalayan regions (Bannwarth et al., 2015; Bala et al., 2018; Dibaba et al., 2020), 19 sensitive parameters that significantly influence model outputs were selected, including those related to surface runoff, groundwater, topography, evaporation, and soil flow (Table 3). We used the Sequential Uncertainty Fitting version 2 (SUFI-2) algorithm in SWAT-Calibration Uncertainty Program (CUP) to optimize the 19 sensitive parameters.
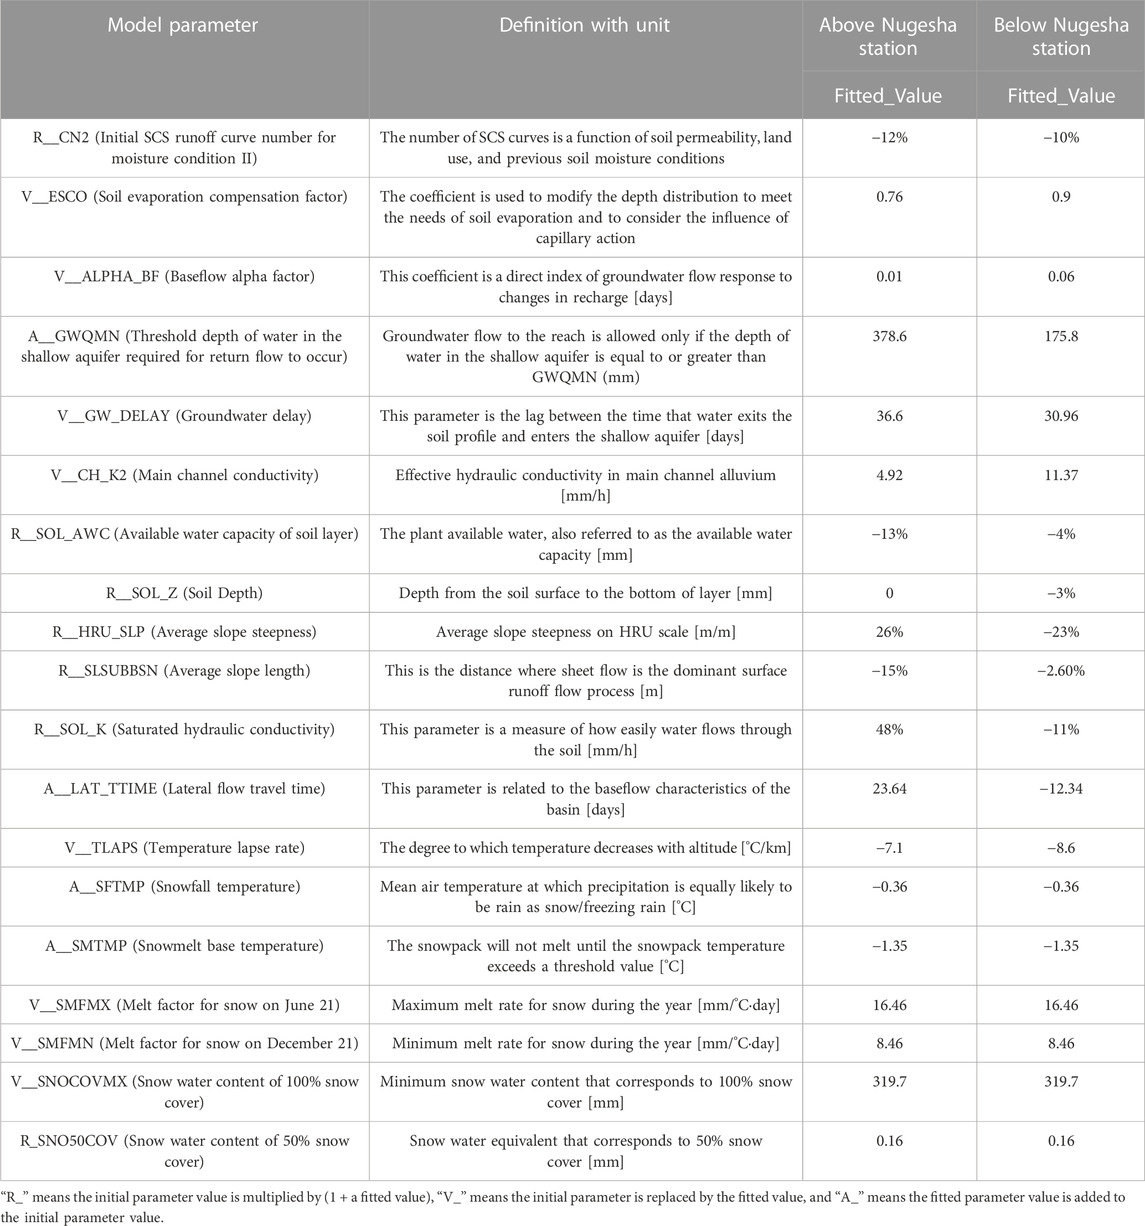
TABLE 3. Sensitive parameters for the Yarlung Zangbo River Basin.
2.3.2 Snowmelt module of SWAT
The snow module of the SWAT mainly included snow accumulation and snow-melting processes. Snow accumulation is mainly controlled by the daily average temperature and critical temperature, the latter of which is the tipping point that identifies liquid rain or snow. Snow melting is estimated based on the temperature index, calculated by air and snow temperature, snow-melting rate, and snow area. For the snow process, precipitation and snowfall were distinguished by setting the critical temperature. If the average daily temperature was less than the critical temperature, precipitation was identified as snowfall, which was stored on the surface as snow accumulation; otherwise, it was identified as precipitation. The balance formula of the snow mass is represented as (Neitsch et al., 2011):
where
The amount of snow melting can be calculated as a linear function between the average maximum snow temperature and the user-defined snow-melting threshold (Neitsch et al., 2011):
where
2.3.3 Model performance evaluation
The model evaluation indicators of the Nash–Sutcliffe efficiency coefficient (NSE), percentage bias (PBIAS), and coefficient of determination (R2) were used to evaluate the model performance (Moriasi et al., 2007; Gupta et al., 2009; Zhang Y. G. et al., 2015); these are the most widely used evaluation criteria. The NSE is between negative infinity and 1, and the model is normally regarded as very good when the NSE is greater than 0.65 (Foglia et al., 2009). PBIAS is used as an indicator of underestimation or overestimation and is expressed as a percentage (Gupta et al., 1999). A negative PBIAS indicates a slight underestimation of the model-generated value relative to the measured value. In general, when NSE >0.5 and PBIAS = ± 25%, the model performance is satisfactory. The R2 value is between 0 and 1, representing the proportion of the total variance in the measured data. The closer the simulated data are to 1, the better the model performance is (Rahman et al., 2012). The expressions of these three model evaluation indicators are as follows (Moriasi et al., 2007; Dhami et al., 2018):
where
In alpine regions, streamflow measurements are regarded as a good indicator and often as the only accessible datasets to evaluate the performance of hydrological models (White et al., 2011; Pervez and Henebry, 2015; Liu et al., 2016; Dhami et al., 2018; Bhatta et al., 2019). We used the monthly streamflow data collected from the eight hydrological stations (Lhasa, Nugesha, Pangduo, Rikaze, Tangjia, Yangcun, Gengzhang, and Nuxia, shown in Figure 1) to calibrate the model parameters and validate the accuracy of the model. The streamflow measurements from Nugesha station in the upper reaches and Nuxia station in the lower reaches were two major outlets along the main river. Monthly streamflow records from Nugesha and Nuxia were used to calibrate the model between 1961 and 1980. The model was validated between 1981 and 2010 based on the streamflow of Nuxia to constrain the water balance of the whole model domain. The streamflow measurements from the other six hydrological stations along tributaries were further calibrated and validated to constrain water balance for each sub-basin based on its whole streamflow records. To initialize the natural background conditions of the study area using the SWAT model, 1951–1960 was set as the spin-up period.
3 Results
3.1 Calibration and validation
The period 1961 to 2000 was selected to maintain uniformity in the middle and lower stream as shown in Figure 2. The NSE was 0.84 and 0.81, PBIAS was −11.3 and 12.1, and R2 was 0.85 and 0.91 in the calibration and validation periods for Nugesha station. For the Nuxia station, the NSE was 0.88 and 0.93, PBIAS was −23.1 and −13.6, and R2 was 0.95 in the calibration and validation periods, respectively. Good agreement was obtained between simulated and observed streamflow for calibration and validation period based on averaged NSE and R2. By validating the total runoff simulation with over 50 years of observed streamflow data in the outlet station of Nuxia, the reliability of the simulation was demonstrated. Model validation is well performed at each sub-basin with the NSE over 0.8 to constrain runoff and water balance in the sub-basin. Despite the lack of recent streamflow data for validation, the calibrated model can adequately predict the interannual variability and spatial distribution of water balance in the basin. Our results indicate that SWAT with the snow package can fully characterize long-term runoff variations, despite its slightly delayed response to peak flow under extreme precipitation, and this condition is also mentioned in previous alpine studies (Tong et al., 2015; Bajracharya et al., 2018; Sarah et al., 2021; Shukla et al., 2021).
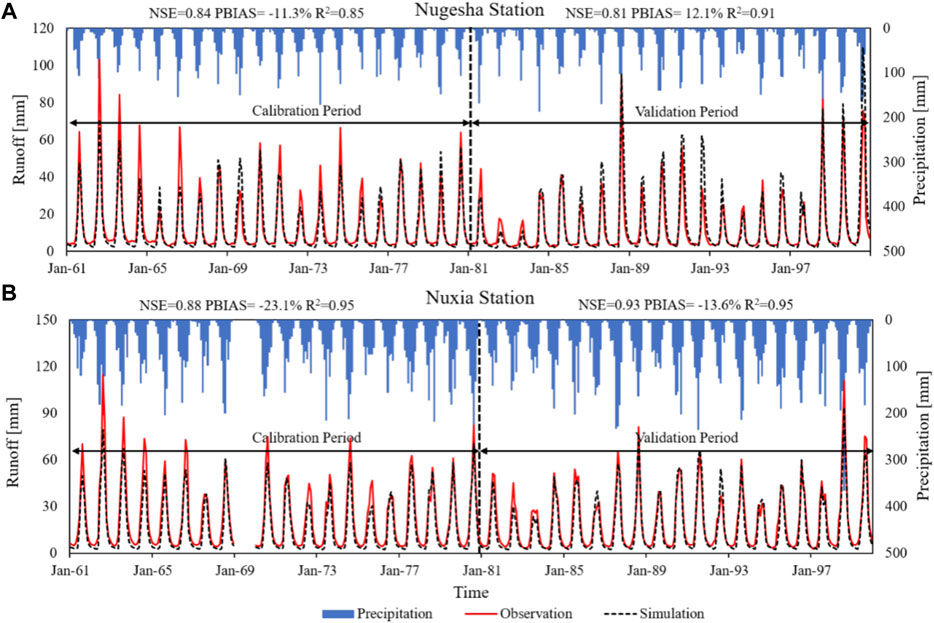
FIGURE 2. Calibration and validation of average monthly runoff [(A). Nugesha Station; (B). Nuxia Station].
3.2 Hydrological responses to projected climate changes
3.2.1 Projected changes in runoff and snowmelt
We firstly qualified the temporal and spatial variability in climatic drivers, including annual and monthly precipitation and temperature in the upstream, midstream, downstream, and YZB in the historical period (1980–2019). Accordingly, five models of CMIP5 and CMIP6 are predicted under three radiation scenarios (CMIP5: RCP2.6, RCP4.5, RCP8.5; CMIP6: SSP126, SSP245, SSP585), and the responses of hydrological processes to climate change at annual scales in the NF (2020–2059) and FF (2060–2099) periods, respectively. As shown in Figure 3A, in the historical period, the annual average precipitation in the YZB was 488.7 mm/yr, varying from 278.5 mm/yr in the upstream to 425.0 mm/yr in the midstream and 720.8 mm/yr in the downstream. As shown in Figure 4A, the annual precipitation has a slightly increasing trend YZ, and the precipitation mainly occurs in June, July, and August. The future precipitation change results are shown in Figures 5A, 6A. In the NF, the mean annual precipitation will increase by 30.8 mm (6.3%), 33.4 mm (6.8%), and 37.2 mm (7.6%) under the three scenarios (RCP2.6, RCP4.5, RCP8.5) of CMIP5, while the range of change under the three scenarios (SSP126, SSP245, SSP585) of CMIP6 is −15.1 mm (−3.1%), −20.8 mm (−4.3%) and −21.4 mm (−4.4%). Accordingly, in the FF, the annual precipitation of CMIP5 will increase by 29.0 mm (5.9%), 59.7 mm (12.2%), 108.4 mm (22.2%), and the annual precipitation of CMIP6 will increase by 16.1 mm (3.3%), 22.8 mm (4.7%), and 97.2 mm (19.9%), respectively. The total precipitation is composed of snowfall in solid form and rainfall in liquid form, where snowfall accounted for 22% of total precipitation during HIS (1980–2019), but only 18% and 12% during NF (2020–2059) and FF (2060–2099). The spatial comparison shows that the future precipitation of CMIP5 in the downstream region is significantly higher than that of CMIP6.
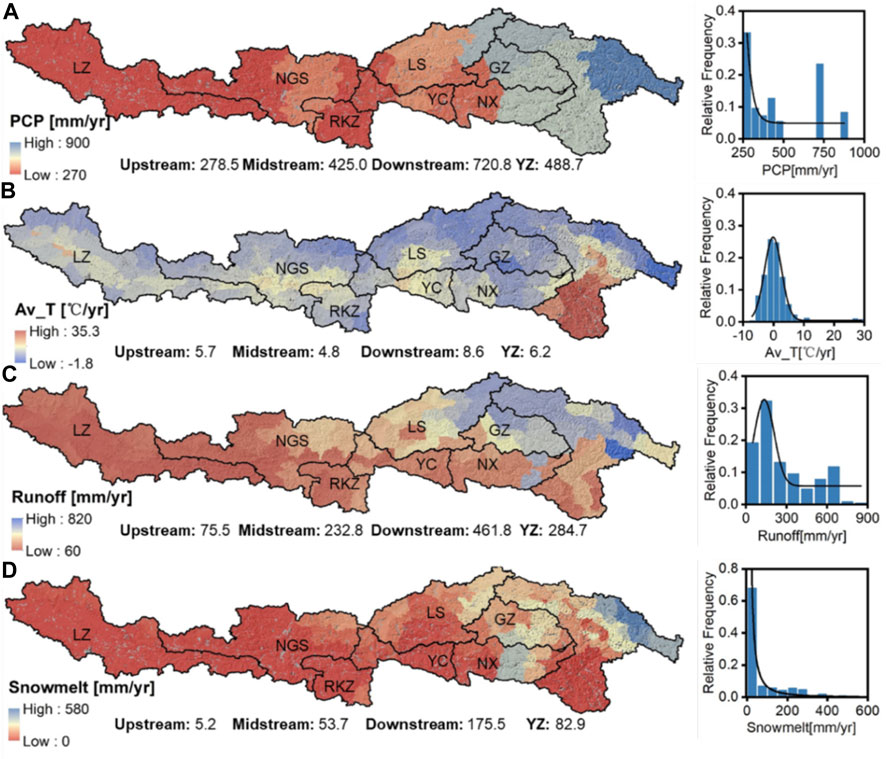
FIGURE 3. Spatial distribution of (A) precipitation (PCP), (B) average temperature (Av_T), (C) runoff, and (D) snowmelt in the historical period (1980–2019).
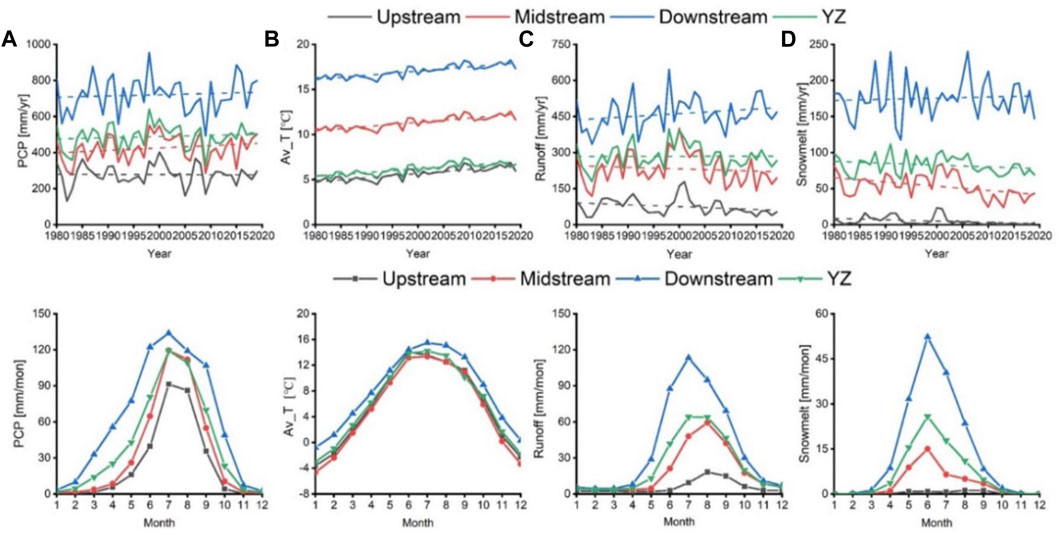
FIGURE 4. Temporal distribution of (A) precipitation (PCP), (B) average temperature (Av_T), (C) runoff, and (D) snowmelt at annual and monthly scales in the historical period (1980–2019).
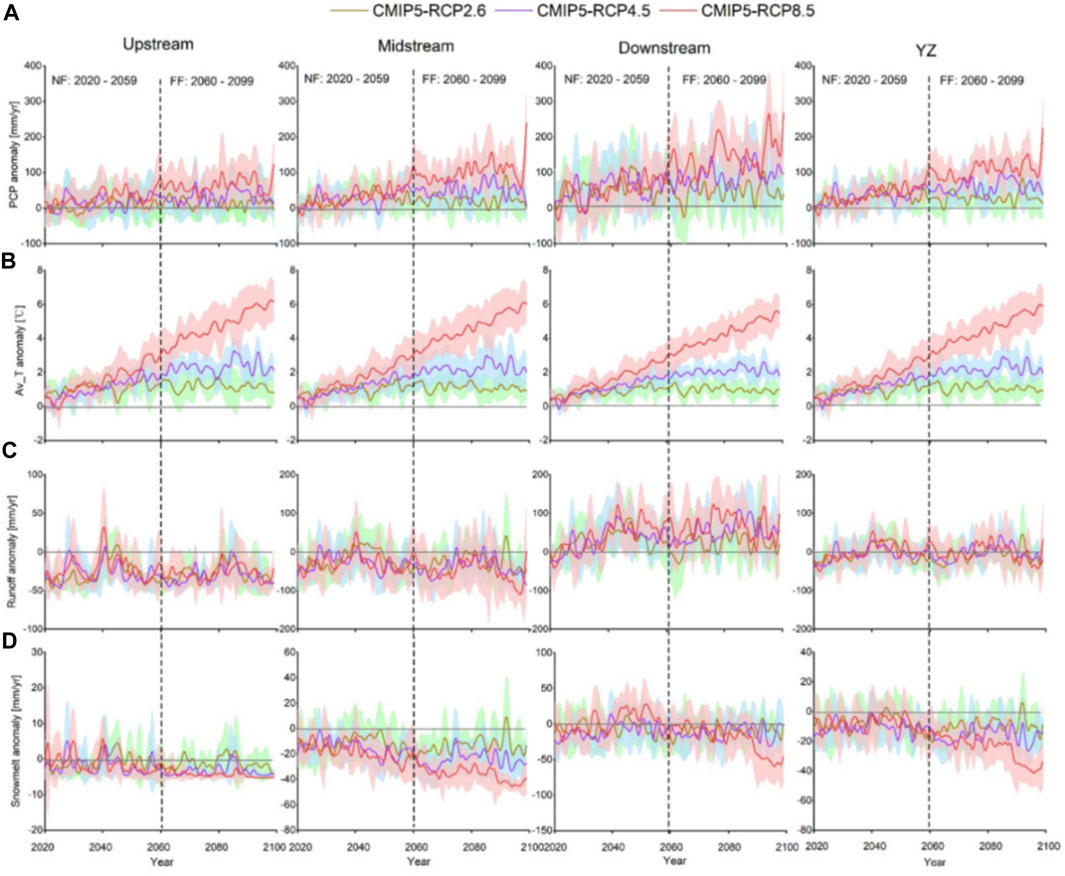
FIGURE 5. The anomalous statistics from the historical multi-year average of (A) average annual precipitation, (B) average temperature (Av_T), (C) runoff, and (D) snowmelt in the upstream, midstream, downstream, and YZB in the near future (NF: 2020–2059) and far future (FF: 2060–2099) under three different scenarios of CMIP5 (RCP2.6, RCP4.5, RCP8.5).
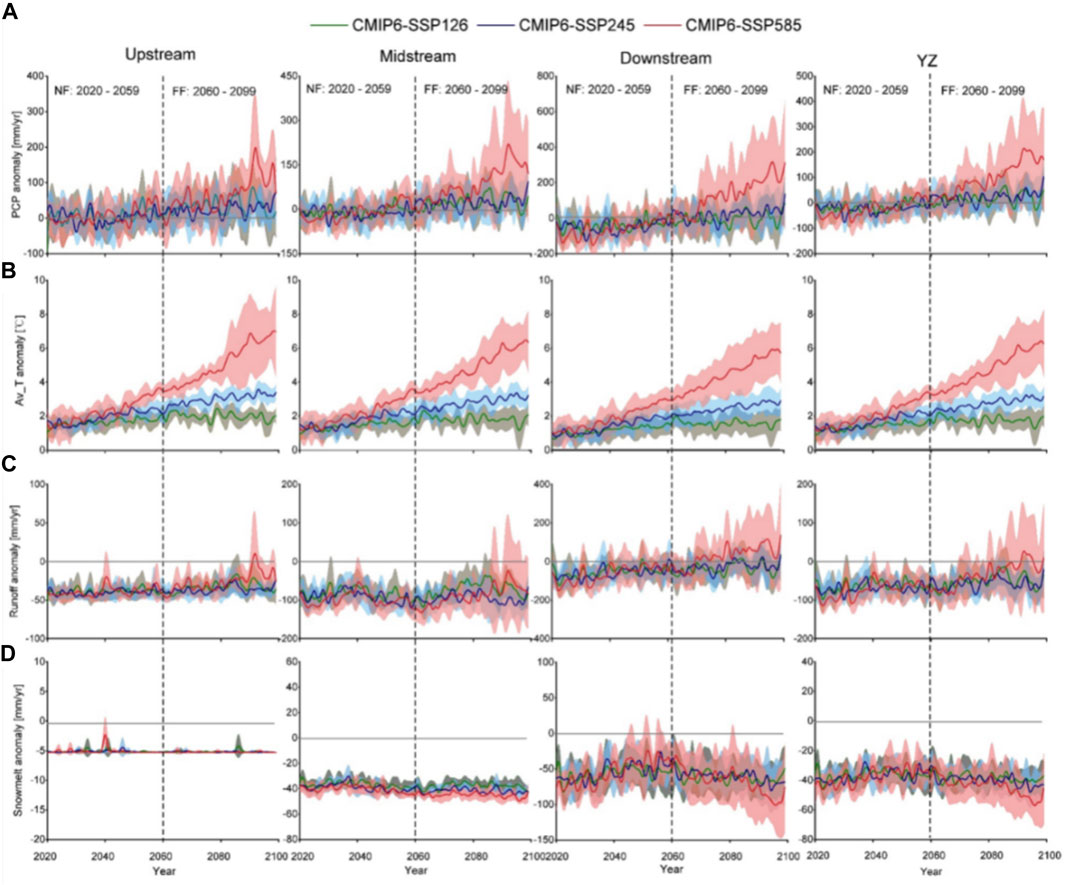
FIGURE 6. The anomalous statistics from the historical multi-year average of (A) average annual precipitation, (B) average temperature (Av_T), (C) runoff, and (D) snowmelt in the upstream, midstream, downstream, and YZB in the near future (NF: 2020–2059) and far future (FF: 2060–2099) under three different scenarios of CMIP6 (SSP126, SSP245, and SSP585).
As shown in Figure 3B, the annual average temperature in the YZB during the historical period was 6.2°C, with the highest temperature in the downstream (8.6°C), followed by the upstream (5.7°C) and the lowest temperature in the midstream (4.8°C). In the historical period, the annual mean temperature kept rising in the upper, middle, and lower reaches of YZ (Figure 4B). In the future, the annual mean temperature is expected to continue to rise (Figures 5B, 6B). In the NF, the annual mean temperature increases under three scenarios of CMIP5 were 0.9°C, 1.1°C, and 1.5°C, respectively, while the increases under three scenarios of CMIP6 were 1.4°C, 1.6°C, and 2.1°C, respectively. Accordingly, in the FF, the average temperature of CMIP5 will increase by 1.1°C, 2.2°C, and 4.5°C, respectively, and the average temperature of CMIP6 will increase by 1.8°C, 2.7°C, and 4.7°C, respectively. The future temperature projected by CMIP6 is higher than that of CMIP5.
Based on the well-calibrated model, we obtain the spatial and temporal dynamic characteristics of runoff under three representative concentration pathways (RCP2.6, RCP4.5, and RCP8.5) of CMIP5 and three shared socio-economic pathways (SSP126, SSP245, and SSP585) in two future periods (NF: 2020–2059 and FF: 2060–2099) and one historical period (1980–2019). In the historical period, the average annual runoff in the YZB was 284.7 mm/yr, and it increased from the upstream region (75.5 mm/yr) to the midstream (232.8 mm/yr) and downstream (461.8 mm/yr) regions in an order consistent with spatial precipitation (Figure 3C). During the historical period, the runoff in the upstream and midstream showed a decreasing trend, while the runoff in the downstream showed an increasing trend (Figure 4C). In the NF, the annual average runoff will change by −3.4 mm (−1.2%), −5.3 mm (−1.9%) and −2.6 mm (−0.9%), respectively, relative to the historical period, under the five modes of CMIP5, while the runoff will decrease by −63.2 mm (−22.2%), −69.7 mm (−24.5%) and −73.1 mm (−25.7%), respectively, under the CMIP6. In the FF, the annual average runoff variation is −8.5 mm (−3%), −3.8 mm (−1.3%), −1.5 mm (−0.5%) under the CMIP5, and that in CMIP6 is −51.5 mm (−18.1%), −57.4 mm (−20.2%), −33.5 mm (−11.8%) (Figures 5C, 6C). This is because the temperature rise of CMIP6 in the future is higher than that of CMIP5, and the precipitation increase is lower than that of CMIP5. Moreover, the variation of runoff in different sub-basins expectedly differs. In CMIP5, compared with the historical period, the annual average runoff in the upper and middle basins will decrease by −27.9 to −21.9 mm (−37.0% to −29.0%) and −28.9 to −19.9 mm (−12.4% to −8.5%), respectively, while the average annual runoff in the downstream will increase by 29.5 mm–38.7 mm (6.4%–8.4%), respectively. This trend will be further intensified in FF. This is because the increase in precipitation will not be enough to offset the increase in evaporation caused by rising temperatures in the upstream and midstream of the basin. In contrast, the increase in precipitation will play a major role downstream. In the CMIP6 models, the annual average runoff of each region is lower than the historical value. This is due to decreased precipitation in CMIP6 and rising temperature resulting in an inadequate water supply for runoff.
It can be seen from Figures 3D, 4D that from 1980 to 2019, the amount of snowmelt in the study area was 82.9 mm/year, which showed a downward trend and accounted for 21.87% of the annual runoff. According to previous studies, the sum of meltwater from snow and glaciers usually ranged from 10% to 35% for the entire Yarlung Zangbo Basin, however, the glaciers contribute only about 3.5% for the area above Nuxia station (Bookhagen and Burbank, 2010; Immerzeel et al., 2010; Zhang L. et al., 2013; Lutz et al., 2014; Su et al., 2016; Chen et al., 2017; Wang et al., 2021). Due to the difference in the distribution in snow cover and temperature, the snowmelt varied from 5.2 mm/yr in the upper reaches to 53.7 mm/yr and 175.5 mm/yr in the middle and down basins, indicating that the snowmelt contribution to runoff increases from upstream to downstream. The occurrence of snowmelt water is concentrated in June. Under the RCP2.6, RCP4.5 and RCP8.5 scenarios of CMIP5, snowmelt will decrease by −8.0 mm (−9.7%), −10.6 mm (−12.9%), and −8.1 mm (−9.8%), respectively. It will be significantly reduced by −9.9 mm (−12.0%), −15.9 mm (−19.3%), −24.3 mm (−30.1%) in FF. However, for the CMIP6, the snowmelt water decreased more than according to CMIP5, to −36.4 mm (−44.2%), −37.1 mm (−45.0%), and −37.4 mm (−45.3%) in NF and decreased more in FF (Figures 5D, 6D). These results indicate that the contribution of snowmelt to runoff will decrease due to reduced snowfall and increased evaporation under a warmer climate.
3.2.2 Future changes in water balance
Water balance indicates the mechanism of hydrological processes in the watershed (Dhami et al., 2018). Detailed quantification and prediction of regional long-term water balance is a prerequisite for effective planning and implementation of water-loss management measures (Knobloch et al., 2014). The water balance equation has been described in detail in Section 2.3.1. The sum of Qsurf, Qlat, and Qgw is the water yield (WYLD), which can be considered the available streamflow at the basin outlet. The sum of Qgw and Wseep is the amount flowing to shallow and deep groundwater aquifers. SW is the soil water content and plays an important role in agricultural production and land management. ET (evaporation) and Wseep (percolation) represent the amount of water that exits the water circulation system, and p (precipitation) represents the amount of water that flows into the system.
As shown in Figures 7A, 8A, the average annual evaporation (ET) of the YZB in the historical period (1980–2019) was 176.5 mm/yr, accounting for 36.1% of precipitation. ET in all basins showed an increasing trend, and the concentration occurred in July and August. As shown in Figures 9A, 10A, in NF, with the increased precipitation and temperature, under the RCP2.6, RCP4.5, and RCP8.5 scenarios of CMIP5, the annual average ET of YZ will rise by 38.7 mm (21.9%), 44.7 mm (25.3%), and 53.0 mm (30.0%), respectively, while the amount of change in the three scenarios of CMIP6 will be 58.3 mm (33.0%), 61.7 mm (34.9%), and 68.5 mm (38.8%), respectively. In FF, the increase in ET will be more pronounced, with CMIP5 changing at 42.9 mm (24.3%), 75.9 mm (43%), 131.3 mm (74.4%), and CMIP6 changing by 77.2 mm (43.7%), 94.4 mm (53.5%) and 149.5 mm (84.7%). ET is on the rise in all regions. The reason for this result is that increased precipitation provides more water to the ET, and the increase in temperature drives water evaporation.
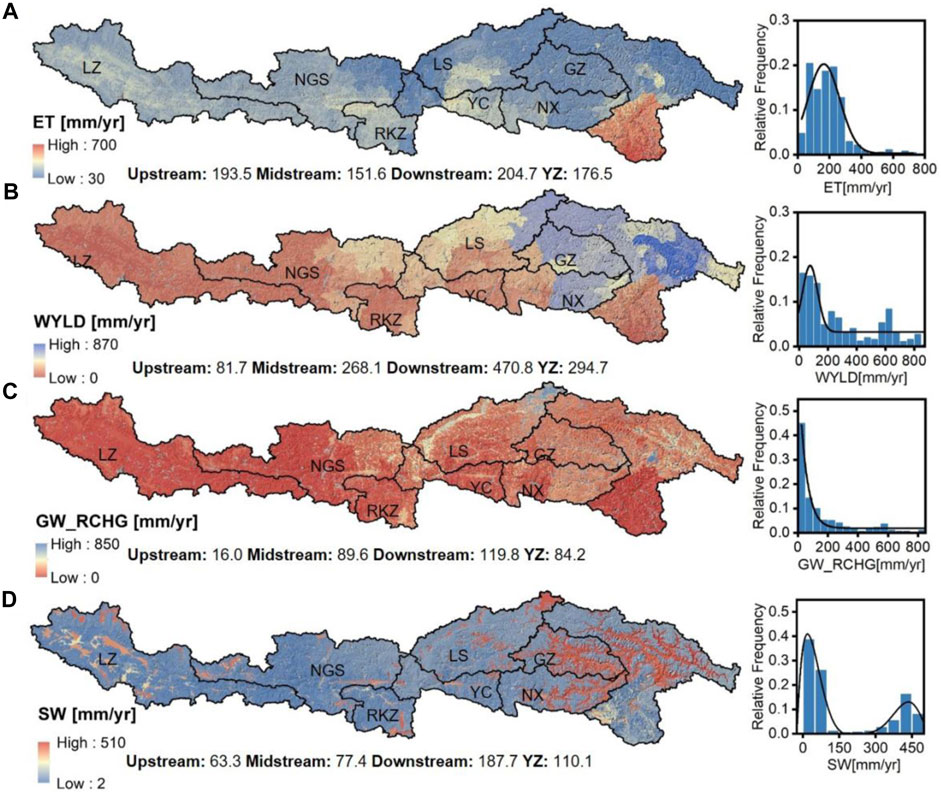
FIGURE 7. Spatial distribution of (A) evaporation (ET), (B) water yield (WYLD), (C) groundwater recharge (GW_RCHG), and (D) soil water content (SW) in the historical period (1980–2019).
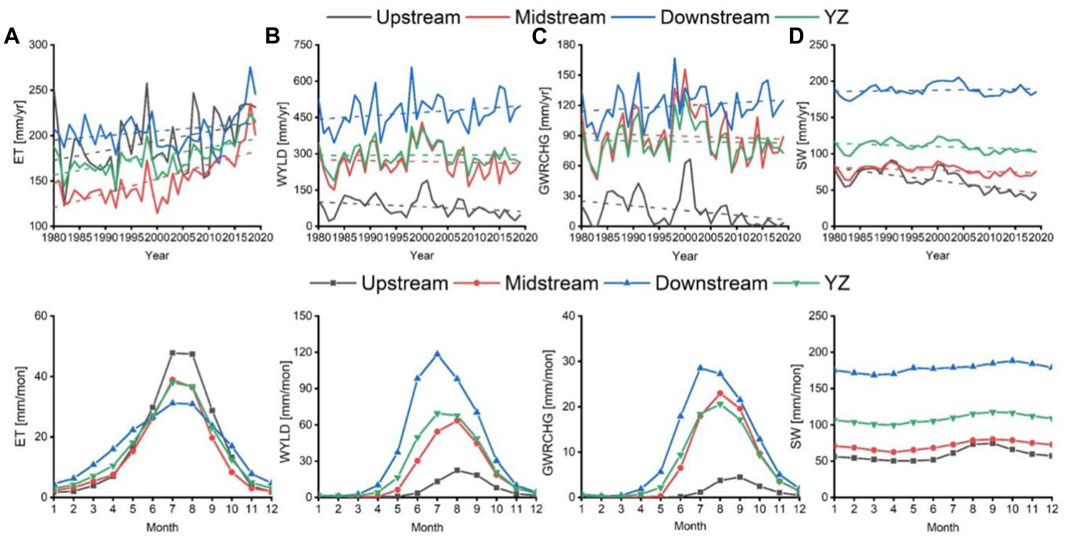
FIGURE 8. Temporal distribution of (A) evaporation (ET), (B) water yield (WYLD), (C) groundwater recharge (GW_RCHG), and (D) soil water content (SW) at annual and monthly scales in the historical period (1980–2019).
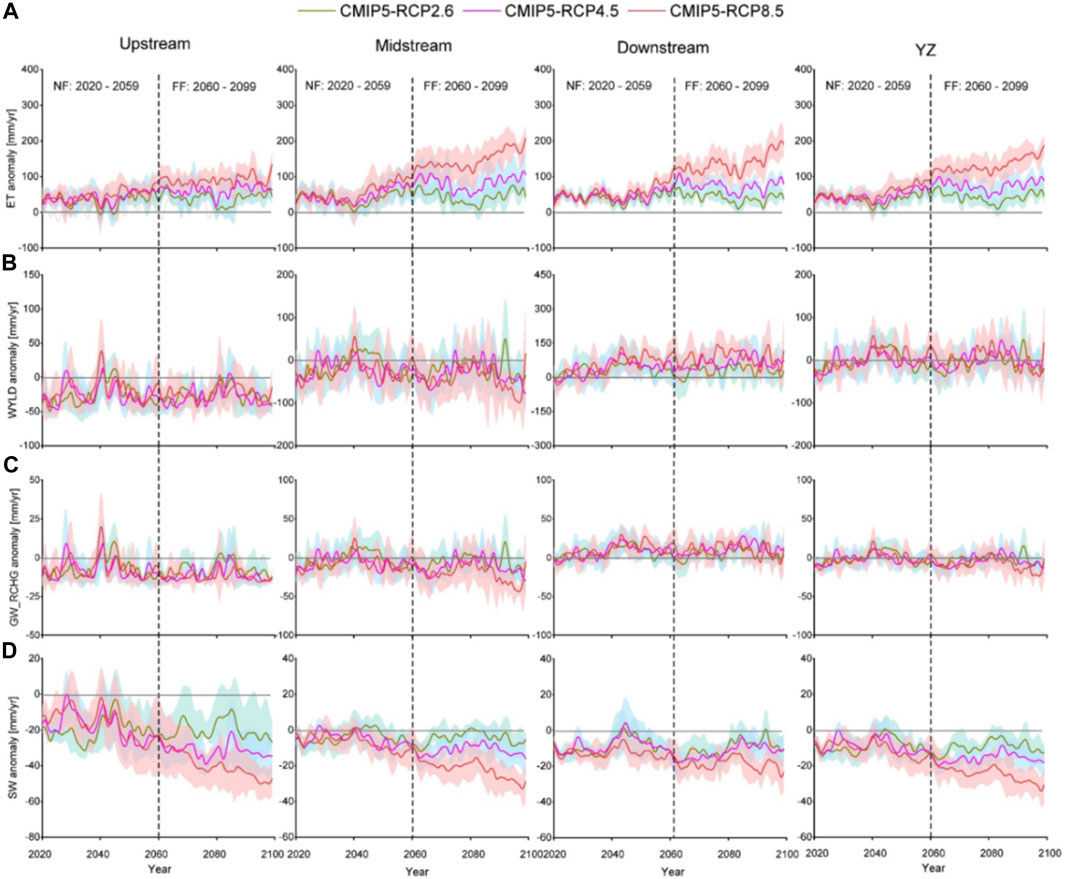
FIGURE 9. The anomalous statistics from the historical multi-year average of (A) evaporation (ET), (B) water yield (WYLD), (C) groundwater recharge (GW_RCHG), and (D) soil water content (SW) in the upstream, midstream, downstream and YZB in the near future (NF: 2020–2059) and far future (FF: 2060–2099), under three different scenarios of CMIP5 (RCP2.6, RCP4.5, RCP8.5).
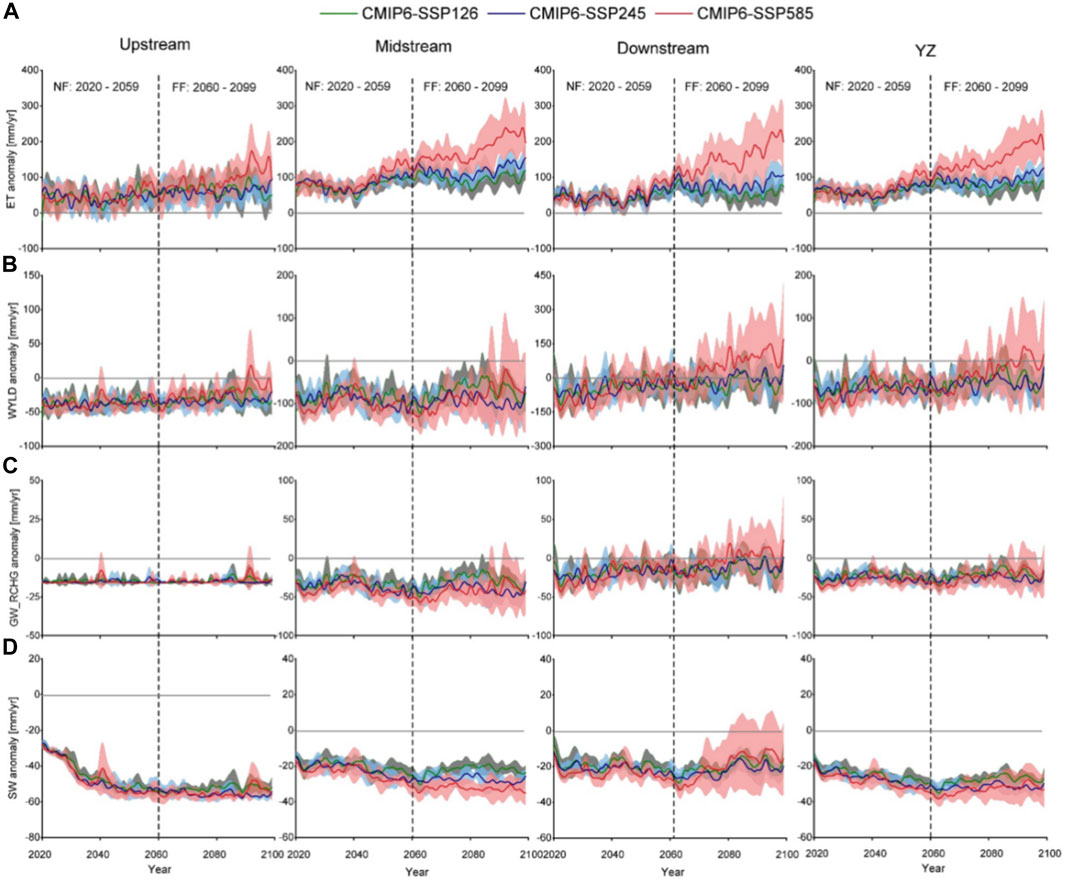
FIGURE 10. The anomalous statistics from the historical multi-year average of (A) evaporation (ET), (B) water yield (WYLD), (C) groundwater recharge (GW_RCHG), and (D) soil water content (SW) in the upstream, midstream, downstream and YZB in the near future (NF: 2020–2059) and far future (FF: 2060–2099), under three different scenarios of CMIP6 (SSP126, SSP245, SSP585).
As for water yield (WYLD), as shown in Figures 7B, 8B, the average annual water yield of the YZB from 1980 to 2019 was 294.7 mm/yr, concentrated in June, July, and August. WYLD in the upstream, midstream, and downstream regions is 81.7 mm/yr, 268.1 mm/yr, and 470.8 mm/yr, respectively. In the future, under the climate change conditions of RCP2.6, RCP4.5 and RCP8.5, the total water production of YZ will slightly change, at −0.8 mm (−0.7%), −2.5 mm (−0.8%), 0.4 mm (0.1%), while the variation in SSP126, SSP245 and SSP585 scenarios will be −60.0 mm (−20.4%), −66.4 mm (−22.5%), −69.7 mm (−23.7%) (Figures 9B, 10B). Spatially, for CMIP5, the multi-year average WYLD in both the upstream and midstream regions will foreseeably decrease, while the downstream will increase, while for CMIP6, the WYLD will decrease in all regions.
Groundwater recharge (GW_RCHG) is the amount of water flowing into the groundwater system, calculated as the sum of the base flow and percolation to the deep aquifer. As shown in Figures 7C, 8C, the average annual GW_RCHG value of the historical period is 84.2 mm/yr, showing a slight downward trend as a whole, and the changing trend of each watershed is similar to that of WYLD. Future GWRCHG changes are shown in Figures 9C, 10C. Under the RCP2.6, RCP4.5, and RCP8.5 of CMIP5, the recharge to groundwater will be reduced by −0.6 mm (−0.7%), −1.8 mm (−2.1%), and −1.9 mm (−2.3%), respectively, with a significant increase in temperature. The reduction will be further strengthened in FF. Compared with CMIP5, the reduction trend of CMIP6 is more evident, in the three scenarios of SSP126, SSP245 and SSP585, groundwater recharge will be reduced by −23.7 mm (−28.1%), −26.2 mm (−31.1%), −28.4 mm (−33.7%) in NF, and −21 mm (−24.9%), −25.5 mm (−30.3%), −24.3 mm (−28.9%) in FF. Spatially, the GW_RCHG in the upstream and midstream regions shows a downward trend, while that downstream shows an upward trend, likely because the upstream and middle reaches are greatly affected by temperature, and the downstream is primarily driven by precipitation.
The spatial and temporal distribution of SW in the historical period is shown in Figures 7D, 8D, respectively. The average annual SW in the YZ region is 110. mm/yr, showing a slight downward trend. Spatially, it increases sequentially from upstream to downstream. In the YZB, SW will be reduced by −8.8 mm (−8.0%), −8.6 mm (−7.8%), −10.5 mm (−9.5%) in NF, and will be continuously reduced by −9.7 mm (−8.8%), −15.8 mm (−14.3%), −24.3 mm (−22.1%) in FF, respectively. The upstream decline will be the largest, followed by the middle reaches, and the downstream decline will be the smallest. For CMIP6, the decline in SW is more pronounced and it will be −31.7 mm (−28.8%), −33.1 mm (−30.1%), −28.0 mm (−25.4%) in NF and −28.0 mm (−25.4%), −26.6 mm (−24.2%), −28.1 mm (−25.5%) in FF (Figures 9D, 10D). These results indicate that the water retention capacity of the soil in the future study area will be adversely affected.
4 Discussion
4.1 Temporal and spatial variability in runoff
Our simulations show that runoff is highly variable between the upper and lower streams, and the upstream runoff was only 17% of the downstream runoff. In the future, the runoff in the upper reaches will further decline because of rising temperatures not being enough to buffer increasing precipitation, while the runoff in the lower reaches before NX will increase due to heavier precipitation under the CMIP5 climate scenarios. This finding is consistent with previous runoff projections in the southern Himalayan rivers (Gain et al., 2011; Xu et al., 2019; Wang et al., 2021). Furthermore, the difference in hydrogeological setting (i.e., lithology and soil properties), landscapes, and land cover between the upper and lower streams augmented runoff variations (Decker, 2015; Guo et al., 2020). The topography of the upper stream is flatter than that of the lower stream, with >87% of the former area covered by grass, which results in an increase in ET when temperatures rise. The topography of the lower stream is steep with high mountain ranges, which favors the increased production of runoff, particularly during the summer monsoon period (Yao et al., 2021). Based on our results, it appears that climate change will exacerbate changes in water availability. Specifically, future snowmelt runoff will be reduced by more than 40% in the middle and lower reaches, equivalent to a reduction of 9% in water supply from rivers. According to the China statistical year book for 2021, the total urban water supply in Tibet Autonomous Region is 0.15 billion m3. Increasing urbanization is expected to increase this amount, and future runoff variations may affect the availability of water resources. It is also expected that the construction of water projects within the YZB will facilitate the regulation of runoff variations caused by climate change. The hydropower system of YZB brings an estimated 33.7%–75.0% increase in hydropower productivity each month, and the minimum flow during the dry season can be increased (Lyu et al., 2023).
4.2 Impacts of climate change on water balance
We quantified water balance, which is composed of precipitation and evaporation, water yield, groundwater recharge, and soil water content of the entire YZB, indicating that more inflow from precipitation for the whole hydrological system will be consumed by evaporation rather than contributing to runoff, implying that rising temperatures have a greater impact on water balance than increasing precipitation in northern Himalayan. This is consistent with previous findings that global warming likely caused significant changes in the water cycle of cold mountain catchments (Xu et al., 2020). Soil water content can be used as a good indicator to evaluate the degree of dryness and wetness (Chakraborty et al., 2013; Li and Huang, 2021). On the Tibetan Plateau, the soil water content is reduced by 22%–34% at 0–80 cm depth, resulting in moderately and even severely degraded vegetation (Pan et al., 2017). Our predictions indicate that the soil water content in the upper reaches of the YZB will decrease by more than 20% under the high emission scenarios of CMIP5 and CMIP6. The upper reaches region with vast grassland are likely to suffer severe degradation in the future. Our study provides important evaluations of hydrological changes in alpine rivers in the Himalayan and Tibetan regions and suggests an adaptive management plan for water resources in the future.
4.3 Hydrological response differences between CMIP5 and CMIP6 scenarios
Our results show that the hydrological responses under CMIP5 and CMIP6 scenarios differ significantly. Runoff changes under CMIP5 were relatively stable, while CMIP6 showed a significant decline, and CMIP6 had stronger spatial heterogeneity, indicating higher drought risk under CMIP6, which was consistent with the research results of Ukkola et al. (2020) and Chen and Yuan (2021). This is mainly because the temperature rises rapidly under the CMIP6 scenario, which promotes the evaporation of water vapor, rendering water loss more likely. The rapid temperature rise also reduces snowfall, bringing forward the increase/decrease inflection point of snowmelt water. At the same time, the precipitation increase of CMIP6 is relatively small, and even the precipitation in the NF is lower than the historical average, so the runoff supply is insufficient.
Such different climate scenarios also lead to varying responses of water balance elements in the future. Table 4 summarizes the amounts of these hydrological components and the proportion of precipitation in three scenarios, historical and future CMIP5 and CMIP6, respectively. In the future scenario, it can be found that CMIP6 has a larger rate of evaporation and a smaller proportion of water production and groundwater recharge in the future water balance relative to CMIP5. This is due to the difference in future precipitation and temperature changes of CMIP6. Differences between CMIP5 and CMIP6 climate scenarios are also related to other factors, such as model selection, downscaling, deviation correction, etc.
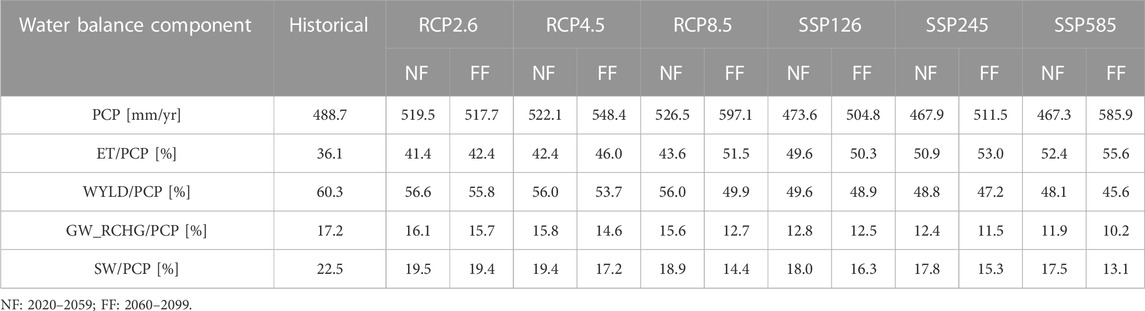
TABLE 4. Water balance component statistics, including inflow precipitation and outflow evaporation, water yield, groundwater recharge, soil water content, and their percentages of precipitation in historical, CMIP5 (RCP2.6, RCP4.5, RCP8.5), and CMIP6 (SSP126, SSP245, SSP585) scenarios in NF and FF.
4.4 Future climate change will cause the cryosphere to decline
As the climate warms, our results suggest that the temperature will experience a significant increase in the future, which will greatly promote the ablation and retreat of the cryosphere. The results of Nie et al. (2016)and Ji et al. (2020) show that glaciers, snow depth and seasonally frozen ground depth will decrease in the future at rates of −0.597 km2/a −0.74 mm/10a and 2.50 cm/a, respectively, which will lead to an increase in their contribution to runoff. The projected runoff from snow meltwater implicates that the maximum contribution from the ice circle will be reached around 2060. After the tipping point, YZB will be replaced by a hydrological process pattern dominated by precipitation. Marazi and Romshoo (2018) found that, in the Kashmir region, climate change is leading to a significant depletion of river valley runoff as a result of glacier depletion; if the observed pattern of glacier declines and climate change continues in the future, it will further deplete runoff and have a serious impact on water supply for different uses in the region. Accordingly, we also indicate that rainfall will increase its contribution to runoff, whereas snow and glacier melt will decrease its contribution. In the future, this could pose a huge risk for droughts and floods.
4.5 Limitations and implications
Model uncertainty arises both from uncertainties within the input data and from the characterization of physical processes across models. In this study, the evaporation simulated by SWAT is smaller than that simulated by remote sensing products (Wang et al., 2022b; Ma et al., 2022) and the evaporation simulation error is positively correlated with the precipitation bias. The reason for this is that due to the constraint of runoff data, a large (small) precipitation will result in a large (small) evaporation. In terms of groundwater, as SWAT simulates the groundwater recharge to deep aquifers, the obtained results are 15%–20% smaller than those estimated from numerical groundwater models (Yao et al., 2021).
The projections for future hydrological regimes may be biased by climate data drivers. Current global climate models perform differently in high-altitude alpine regions. We adopted five CMIP5 and CMIP6 GCMs, which were validated in similar regions to improve the simulations. However, uncertainties due to climate data drivers as well as factors inherent in the SWAT model persist according to global climate models, posing challenges for alpine studies (Alemohammad et al., 2015; Vu et al., 2018). Moreover, the lack of streamflow records in the downstream regions from Nuxia station in which glacier meltwater dominates runoff limits water balance simulations, increasing the uncertainty of managing water resources. Hydrological models of alpine regions should involve more independent data for validation.
The TP, as the roof of the world, is not only a key area significantly affected by climate change but also an important water supply and ecological protection barrier in Asia (Chen X. N. et al., 2018; Han, 2018). In order to quantitatively study the long-term hydrological processes in this region, we applied the SWAT model combined with the snowmelt module to provide a new model for quantifying runoff dynamics in high mountain areas with extensive snow cover in other parts of the world. The long-term distribution of water balance elements reflects the unique water-energy cycle and ecological conservation capacity of alpine regions. It provides more targeted insights to advance water resource regulation and environmental restoration.
Furthermore, the quantification of runoff and water balance forms the premise of studying the feedback effect of other factors on the hydrological cycle in alpine regions, such as glacier and permafrost degradation processes, to further understand the interaction between surface water systems and groundwater systems in these alpine regions (Kurylyk et al., 2014; Yao et al., 2021). The results of this study will be of significance for managers and policymakers to devise and implement strategies to sustainably use water-energy resources and highlight the role of ecological barriers in alpine regions.
5 Conclusion
In this study, we evaluated the responses of hydrological processes in the YZB using a physics-based semi-distributed SWAT hydrological model driven by the composite projections of five CMIP5 GCMs under RCP2.6, RCP4.5, and RCP8.5 scenarios and five CMIP6 GCMs under SSP126, SSP245, and SSP585. We quantified the variability in the runoff, snowmelt water, and water balance components in one historical period (1980–2019) and two future periods (NF: 2020–2059 and FF: 2060–2099) on annual and monthly scales. The main findings are summarized as follows.
1) The hydrological model, which was constrained by an observed runoff between 1961 and 2000, performed well in the monthly runoff simulation; however, the simulated peak value of runoff during the validation period (1980–2000) had a certain degree of deviation due to technical limitations of the SWAT model.
2) The predicted future climate showed that precipitation and temperature would increase by 5.9%–22.2% and 0.9°C–4.5°C in CMIP5 and -3.1%–19.9% and 1.4°C–4.7°C in CMIP6, respectively, between 2020 and 2099 compared with the historical multi-year average. These climate changes will affect the spatiotemporal distribution of water resources. Regarding annual runoff, a decrease of −0.9% to −25.7% is expected in the NF and a reduction of −0.5% to −20.2% in the FF. In the future, the contribution of snowmelt water to runoff will decrease. Non-etheless, evident spatiotemporal variabilities were observed in runoff changes from the upstream to downstream regions.
3) Future warming and humidification will significantly alter runoff, as well as the water balance structure. The annual evaporation will increase by 21.9%–84.7% between 2020 and 2099 because of the rising temperature, while the average groundwater recharge and SW in the YZB will decrease by −0.7% to −33.7% and −7.8% to −30.1%, respectively. In both CMIP5 and CMIP6, water yields from upstream and midstream will decrease significantly, implying that the study area will face the risk of drought in the future. Meanwhile, there will also be a risk of flooding in that part of the stream because of the increased variability in precipitation in the lower stream.
In this study, we evaluated and quantified the dynamic responses to future climate change of runoff, snowmelt water, and water balance components (including evapotranspiration, water yield, groundwater recharge, and SW of northern Himalayan rivers. This study helps fill the scientific gap in the quantitative analysis of the hydrological spatiotemporal distribution, considering the snowmelt process. The alpine region is an important source of freshwater, hydropower, and irrigation water resources in Asia. This work shall serve as a reference to formulate and implement effective water resource strategies, regulation policies, and allocation schemes in the alpine region.
Data availability statement
The original contributions presented in the study are included in the article/Supplementary Material, further inquiries can be directed to the corresponding author.
Author contributions
Conceptualization, YY; methodology, YD and YY; resources, YY; writing—original draft preparation, YD and YY; writing—review and editing, YD, YY, YZ, XK, DL, BC, and CZ; funding acquisition, YY. All authors have read and agreed to the published version of the manuscript.
Funding
This work was supported by the National Natural Science Foundation of China (NSFC) research program (grant numbers: 92047202 and 41901023).
Acknowledgments
The Bureau of Hydrology and Water Resources of Tibet Autonomous Region, the Data Center of China Meteorological Administration, the Resource and Environmental Science and Data Center, the Cold and Arid Regions Scientific Data Center, and the National Tibetan Plateau Data Center provided data support. Thanks to the editors and reviewers for their constructive suggestions and insightful comments that have improved the quality of this paper.
Conflict of interest
The authors declare that the research was conducted in the absence of any commercial or financial relationships that could be construed as a potential conflict of interest.
Publisher’s note
All claims expressed in this article are solely those of the authors and do not necessarily represent those of their affiliated organizations, or those of the publisher, the editors and the reviewers. Any product that may be evaluated in this article, or claim that may be made by its manufacturer, is not guaranteed or endorsed by the publisher.
References
Alemohammad, S. H., McColl, K. A., Konings, A. G., Entekhabi, D., and Stoffelen, A. (2015). Characterization of precipitation product errors across the United States using multiplicative triple collocation. Hydrology Earth Syst. Sci. 19, 3489–3503. doi:10.5194/hess-19-3489-2015
Arnold, J. G., and Fohrer, N. (2005). SWAT2000: Current capabilities and research opportunities in applied watershed modelling. Hydrol. Process. 19, 563–572. doi:10.1002/hyp.5611
Arnold, J., Moriasi, D., Gassman, P., Abbaspour, K., White, M., Srinivasan, R., et al. (2012). SWAT: Model use, calibration, and validation. Trans. ASABE 55, 1491–1508. doi:10.13031/2013.42256
Bajracharya, A. R., Bajracharya, S. R., Shrestha, A. B., and Maharjan, S. B. (2018). Climate change impact assessment on the hydrological regime of the Kaligandaki Basin, Nepal. Sci. Total Environ. 625, 837–848. doi:10.1016/j.scitotenv.2017.12.332
Bala, S. K., Islam, G. M. T., Hasan, M. A., Fahad, M. G. R., Billah, M., Mohammed, K., et al. (2018). Hydrological response to climate change of the Brahmaputra basin using CMIP5 general circulation model ensemble. J. Water Clim. Change 9, 434–448. doi:10.2166/wcc.2017.076
Bannwarth, M. A., Hugenschmidt, C., Sangchan, W., Lamers, M., Ingwersen, J., Ziegler, A. D., et al. (2015). Simulation of stream flow components in a mountainous catchment in northern Thailand with SWAT, using the ANSELM calibration approach. Hydrol. Process. 29, 1340–1352. doi:10.1002/hyp.10268
Bhatta, B., Shrestha, S., Shrestha, P. K., and Talchabhadel, R. (2019). Evaluation and application of a SWAT model to assess the climate change impact on the hydrology of the Himalayan River Basin. Catena 181, 104082. doi:10.1016/j.catena.2019.104082
Bookhagen, B., and Burbank, D. W. (2010). Toward a complete Himalayan hydrological budget: Spatiotemporal distribution of snowmelt and rainfall and their impact on river discharge. J. Geophys. Res. 115, F03019. doi:10.1029/2009jf001426
Chakraborty, A., Seshasai, M. V. R., Murthy, C. S., and Rao, S. V. C. K. (2013). Assessing early season drought condition using AMSR-E soil moisture product. Geomatics Nat. Hazards Risk 4, 164–186. doi:10.1080/19475705.2012.689779
Chan, D., Wu, Q. G., Jiang, G. X., and Dai, X. L. (2016). Projected shifts in Köppen climate zones over China and their temporal evolution in CMIP5 multi-model simulations. Adv. Atmos. Sci. 33, 283–293. doi:10.1007/s00376-015-5077-8
Chen, L., and Frauenfeld, O. W. (2014). A comprehensive evaluation of precipitation simulations over China based on CMIP5 multimodel ensemble projections. J. Geophys. Res. Atmos. 119, 5767–5786. doi:10.1002/2013jd021190
Chen, R., Wang, G., Yang, Y., Liu, J., Han, C., Song, Y., et al. (2018). Effects of cryospheric change on alpine hydrology: Combining a model with observations in the upper reaches of the hei river, China. J. Geophys. Res. Atmos. 123, 3414–3442. doi:10.1002/2017jd027876
Chen, S., and Yuan, X. (2021). CMIP6 projects less frequent seasonal soil moisture droughts over China in response to different warming levels. Environ. Res. Lett. 16, 044053. doi:10.1088/1748-9326/abe782
Chen, X., Long, D., Hong, Y., Zeng, C., and Yan, D. (2017). Improved modeling of snow and glacier melting by a progressive two-stage calibration strategy with GRACE and multisource data: How snow and glacier meltwater contributes to the runoff of the Upper Brahmaputra River basin? Water Resour. Res. 53, 2431–2466. doi:10.1002/2016wr019656
Chen, X. N., Long, D., Liang, S. L., He, L., Zeng, C., Hao, X. H., et al. (2018). Developing a composite daily snow cover extent record over the Tibetan Plateau from 1981 to 2016 using multisource data. Remote Sens. Environ. 215, 284–299. doi:10.1016/j.rse.2018.06.021
Decker, M. (2015). Development and evaluation of a new soil moisture and runoff parameterization for the CABLE LSM including subgrid-scale processes. J. Adv. Model. Earth Syst. 7, 1788–1809. doi:10.1002/2015ms000507
Deng, H., Pepin, N. C., and Chen, Y. (2017). Changes of snowfall under warming in the Tibetan Plateau. J. Geophys. Res. Atmos. 122, 7323–7341. doi:10.1002/2017jd026524
Dhami, B., Himanshu, S. K., Pandey, A., and Gautam, A. K. (2018). Evaluation of the SWAT model for water balance study of a mountainous snowfed river basin of Nepal. Environ. Earth Sci. 77, 21. doi:10.1007/s12665-017-7210-8
Dibaba, W. T., Demissie, T. A., and Miegel, K. (2020). Watershed hydrological response to combined land use/land cover and climate change in highland Ethiopia: Finchaa catchment. Water 12, 1801. doi:10.3390/w12061801
Farinotti, D., Round, V., Huss, M., Compagno, L., and Zekollari, H. (2019). Large hydropower and water-storage potential in future glacier-free basins. Nature 575, 341–344. doi:10.1038/s41586-019-1740-z
Foglia, L., Hill, M. C., Mehl, S. W., and Burlando, P. (2009). Sensitivity analysis, calibration, and testing of a distributed hydrological model using error-based weighting and one objective function. Water Resour. Res. 45, W06427. doi:10.1029/2008wr007255
Gain, A. K., Immerzeel, W. W., Weiland, F. C. S., and Bierkens, M. F. P. (2011). Impact of climate change on the stream flow of the lower Brahmaputra: Trends in high and low flows based on discharge-weighted ensemble modelling. Hydrology Earth Syst. Sci. 15, 1537–1545. doi:10.5194/hess-15-1537-2011
Guo, X. M., Wang, L., Ma, F., Tankpa, V., Jiang, X. F., and Li, Z. (2020). Pathway analysis to quantify the relationship between runoff and meteorological factors in re-identifying seasonality throughout the Ashi River watershed, Northeast China. Theor. Appl. Climatol. 143, 1047–1061. doi:10.1007/s00704-020-03474-z
Gupta, H. V., Kling, H., Yilmaz, K. K., and Martinez, G. F. (2009). Decomposition of the mean squared error and NSE performance criteria: Implications for improving hydrological modelling. J. Hydrology 377, 80–91. doi:10.1016/j.jhydrol.2009.08.003
Gupta, H. V., Sorooshian, S., and Yapo, P. O. (1999). Status of automatic calibration for hydrologic models: Comparison with multilevel expert calibration. J. Hydrologic Eng. 4, 135–143. doi:10.1061/(asce)1084-0699(1999)4:2(135)
Han, L. X. (2018). Viewing the sustainable development of the qinghai-tibet plateau from water resources system. IOP Conf. Ser. Earth Environ. Sci. 170, 032083. doi:10.1088/1755-1315/170/3/032083
Hawkins, E., Osborne, T. M., Ho, C. K., and Challinor, A. J. (2013). Calibration and bias correction of climate projections for crop modelling: An idealised case study over Europe. Agric. For. Meteorology 170, 19–31. doi:10.1016/j.agrformet.2012.04.007
Huang, Q., Long, D., Du, M., Zeng, C., Qiao, G., Li, X., et al. (2018). Discharge estimation in high-mountain regions with improved methods using multisource remote sensing: A case study of the upper Brahmaputra river. Remote Sens. Environ. 219, 115–134. doi:10.1016/j.rse.2018.10.008
Immerzeel, W. W., van Beek, L. P. H., and Bierkens, M. F. P. (2010). Climate change will affect the asian water towers. Science 328, 1382–1385. doi:10.1126/science.1183188
Ji, F., Fan, L., Andrews, C. B., Yao, Y., and Zheng, C. (2020). Dynamics of seasonally frozen ground in the Yarlung Zangbo River Basin on the qinghai-tibet plateau: Historical trend and future projection. Environ. Res. Lett. 15, 104081. doi:10.1088/1748-9326/abb731
Knobloch, A., Guth, N., and Klingel, P. (2014). Automated water balance calculation for water distribution systems. Procedia Eng. 89, 428–436. doi:10.1016/j.proeng.2014.11.208
Kuang, X. X., and Jiao, J. J. (2016). Review on climate change on the Tibetan Plateau during the last half century. J. Geophys. Res. Atmos. 121, 3979–4007. doi:10.1002/2015jd024728
Kulkarni, A. V., Rathore, B. P., Singh, S. K., and Ajai, (2010). Distribution of seasonal snow cover in central and Western Himalaya. Ann. Glaciol. 51, 123–128. doi:10.3189/172756410791386445
Kurylyk, B. L., MacQuarrie, K. T. B., and McKenzie, J. M. (2014). Climate change impacts on groundwater and soil temperatures in cold and temperate regions: Implications, mathematical theory, and emerging simulation tools. Earth-Science Rev. 138, 313–334. doi:10.1016/j.earscirev.2014.06.006
Li, X. Z., and Huang, W. R. (2021). How long should the pre-existing climatic water balance be considered when capturing short-term wetness and dryness over China by using SPEI? Sci. Total Environ. 786, 147575. doi:10.1016/j.scitotenv.2021.147575
Liu, H., Li, X., Xiao, J., and Yao, Z. (2019). Variations of wind erosion climatic erosivity in the Yarlung Zangbo River Basin during 1961-2015. Sci. Geogr. Sin. 39 (4), 688–695.
Liu, J., Liu, T., Bao, A., De Maeyer, P., Feng, X., Miller, S. N., et al. (2016). Assessment of different modelling studies on the spatial hydrological processes in an arid alpine catchment. Water Resour. Manag. 30, 1757–1770. doi:10.1007/s11269-016-1249-2
Lutz, A., Immerzeel, W., Shrestha, A. B., and Bierkens, M. (2014). Consistent increase in High Asia's runoff due to increasing glacier melt and precipitation. Nat. Clim. Change 4, 587–592. doi:10.1038/nclimate2237
Lyu, H., Tian, F., Zhang, K., and Nan, Y. (2023). Water-energy-food nexus in the Yarlung tsangpo-brahmaputra River Basin: Impact of mainstream hydropower development. Impact mainstream hydropower Dev. 45, 101293. doi:10.1016/j.ejrh.2022.101293
Ma, N., Zhang, Y. J. A., and Meteorology, F. (2022). Increasing Tibetan Plateau terrestrial evapotranspiration primarily driven by precipitation. Agric. For. Meteorol. 317, 108887. doi:10.1016/j.agrformet.2022.108887
Marazi, A., and Romshoo, S. A. (2018). Streamflow response to shrinking glaciers under changing climate in the Lidder Valley, Kashmir Himalayas. J. Mt. Sci. 15, 1241–1253. doi:10.1007/s11629-017-4474-0
Moriasi, D. N., Arnold, J. G., Van Liew, M. W., Bingner, R. L., Harmel, R. D., and Veith, T. L. (2007). Model evaluation guidelines for systematic quantification of accuracy in watershed simulations. Trans. Asabe 50, 885–900. doi:10.13031/2013.23153
Neitsch, S. L., Arnold, J. G., Kiniry, J. R., and Williams, J. R. (2011). Soil and water assessment Tool theoretical documentation version 2009 .College station: Texas Water Resources Institute.
Nie, N., Zhang, W. C., and Deng, C. (2016). Responses of water resource of the Yarlung Zangbo River Basin to climate changes and glacier-snow fluctuations in recent years. IOP Conf. Ser. Earth Environ. Sci. 46, 012042. doi:10.1088/1755-1315/46/1/012042
Omani, N., Srinivasan, R., Smith, P. K., and Karthikeyan, R. (2017). Glacier mass balance simulation using SWAT distributed snow algorithm. Hydrological Sci. J. 62, 546–560. doi:10.1080/02626667.2016.1162907
Pan, T., Hou, S., Wu, S., Liu, Y., Liu, Y., Zou, X., et al. (2017). Variation of soil hydraulic properties with alpine grassland degradation in the eastern Tibetan Plateau. Hydrology Earth Syst. Sci. 21, 2249–2261. doi:10.5194/hess-21-2249-2017
Pan, X. D., Zhang, L., and Huang, C. L. (2020). Future climate projection in northwest China with RegCM4.6. Earth Space Sci. 7, e2019EA000819. doi:10.1029/2019ea000819
Pang, J. Z., Zhang, H. L., Xu, Q. X., Wang, Y. J., Wang, Y. Q., Zhang, O. Y., et al. (2020). Hydrological evaluation of open-access precipitation data using SWAT at multiple temporal and spatial scales. Hydrology Earth Syst. Sci. 24, 3603–3626. doi:10.5194/hess-24-3603-2020
Pervez, M. S., and Henebry, G. M. (2015). Assessing the impacts of climate and land use and land cover change on the freshwater availability in the Brahmaputra River basin. J. Hydrology Regional Stud. 3, 285–311. doi:10.1016/j.ejrh.2014.09.003
Qin, C., Wu, B., Wang, G., and Wang, G. (2021). Spatial distributions of at-many-stations hydraulic geometry for mountain rivers originated from the qinghai-tibet plateau. Water Resour. Res. 57. doi:10.1029/2020wr029090
Rahman, K., Maringanti, C., Beniston, M., Widmer, F., Abbaspour, K., and Lehmann, A. (2012). Streamflow modeling in a highly managed mountainous glacier watershed using SWAT: The upper rhone river watershed case in Switzerland. Water Resour. Manag. 27, 323–339. doi:10.1007/s11269-012-0188-9
Räty, O., Räisänen, J., and Ylhäisi, J. S. (2014). Evaluation of delta change and bias correction methods for future daily precipitation: Intermodel cross-validation using ENSEMBLES simulations. Clim. Dyn. 42, 2287–2303. doi:10.1007/s00382-014-2130-8
Rikiishi, K., and Nakasato, H. (2006). Height dependence of the tendency for reduction in seasonal snow cover in the Himalaya and the Tibetan Plateau region, 1966–2001. Ann. Glaciol. 43, 369–377. doi:10.3189/172756406781811989
Sarah, S., Shah, W., and Ahmed, S. (2021). Modeling and comparing streamflow simulations in two different montane watersheds of Western himalayas. Groundw. Sustain. Dev. 15, 100689. doi:10.1016/j.gsd.2021.100689
Schwanghart, W., Worni, R., Huggel, C., Stoffel, M., and Korup, O. (2016). Uncertainty in the himalayan energy–water nexus: Estimating regional exposure to glacial lake outburst floods. Environ. Res. Lett. 11, 074005. doi:10.1088/1748-9326/11/7/074005
Shukla, S., Jain, S. K., and Kansal, M. L. (2021). Hydrological modelling of a snow/glacier-fed Western Himalayan basin to simulate the current and future streamflows under changing climate scenarios. Sci. Total Environ. 795, 148871. doi:10.1016/j.scitotenv.2021.148871
Su, F. G., Duan, X. L., Chen, D. L., Hao, Z. C., and Cuo, L. (2013). Evaluation of the global climate models in the CMIP5 over the Tibetan plateau. J. Clim. 26, 3187–3208. doi:10.1175/jcli-d-12-00321.1
Su, F., Zhang, L., Ou, T., Chen, D., Yao, T., Tong, K., et al. (2016). Hydrological response to future climate changes for the major upstream river basins in the Tibetan Plateau. Glob. Planet. Change 136, 82–95. doi:10.1016/j.gloplacha.2015.10.012
Sun, H., and Su, F. (2020). Precipitation correction and reconstruction for streamflow simulation based on 262 rain gauges in the upper Brahmaputra of southern Tibetan Plateau. J. Hydrology 590, 125484. doi:10.1016/j.jhydrol.2020.125484
Sun, Q. H., Miao, C. Y., and Duan, Q. Y. (2015). Comparative analysis of CMIP3 and CMIP5 global climate models for simulating the daily mean, maximum, and minimum temperatures and daily precipitation over China. J. Geophys. Res. Atmos. 120, 4806–4824. doi:10.1002/2014jd022994
Tian, P. P., Lu, H. W., Feng, W., Guan, Y. L., and Xue, Y. X. (2020). Large decrease in streamflow and sediment load of qinghai–Tibetan plateau driven by future climate change: A case study in Lhasa River Basin. Catena 187, 104340. doi:10.1016/j.catena.2019.104340
Tong, S. T. Y., Liu, A. J., and Goodrich, J. A. (2015). Climate change impacts on nutrient and sediment loads in a midwestern agricultural watershed. J. Environ. Inf. 9, 18–28. doi:10.3808/jei.200700084
Troin, M., and Caya, D. (2014). Evaluating the SWAT's snow hydrology over a Northern Quebec watershed. Hydrol. Process. 28, 1858–1873. doi:10.1002/hyp.9730
Ukkola, A. M., De Kauwe, M. G., Roderick, M. L., Abramowitz, G., and Pitman, A. J. (2020). Robust future changes in meteorological drought in CMIP6 projections despite uncertainty in precipitation. Geophys. Res. Lett. 47, e2020GL087820. doi:10.1029/2020gl087820
Vu, T. M., Raghavan, S. V., Liong, S.-Y., and Mishra, A. K. (2018). Uncertainties of gridded precipitation observations in characterizing spatio-temporal drought and wetness over Vietnam. Int. J. Climatol. 38, 2067–2081. doi:10.1002/joc.5317
Wang, L., Cuo, L., Luo, D., Su, F., Ye, Q., Yao, T., et al. (2022a). Observing multi-sphere hydrological changes in the largest river basin of the Tibetan Plateau. Bulletin of the American Meteorological Society.
Wang, L., Han, S., Tian, F., Li, K., Li, Y., Tudaji, M., et al. (2022b). The evaporation on the Tibetan Plateau stops increasing in the recent two decades. J. Geophys. Res. Atmos. 127, e2022JD037377. doi:10.1029/2022jd037377
Wang, Y., Wang, L., Zhou, J., Yao, T., Yang, W., Zhong, X., et al. (2021). Vanishing glaciers at southeast Tibetan plateau have not offset the declining runoff at Yarlung Zangbo. Geophys. Res. Lett. 48, e2021GL094651. doi:10.1029/2021gl094651
White, E. D., Easton, Z. M., Fuka, D. R., Collick, A. S., Adgo, E., McCartney, M., et al. (2011). Development and application of a physically based landscape water balance in the SWAT model. Hydrol. Process. 25, 915–925. doi:10.1002/hyp.7876
Xu, R., Hu, H. C., Tian, F. Q., Li, C., and Khan, M. Y. A. (2019). Projected climate change impacts on future streamflow of the Yarlung Tsangpo-Brahmaputra River. Glob. Planet. Change 175, 144–159. doi:10.1016/j.gloplacha.2019.01.012
Xu, Z. C., Cheng, L., Luo, P., Liu, P., Zhang, L., Li, F. P., et al. (2020). A climatic perspective on the impacts of global warming on water cycle of cold mountainous catchments in the Tibetan plateau: A case study in Yarlung Zangbo River Basin. Water 12, 2338. doi:10.3390/w12092338
Yao, T. D., Thompson, L., Yang, W., Yu, W. S., Gao, Y., Guo, X. J., et al. (2012). Different glacier status with atmospheric circulations in Tibetan Plateau and surroundings. Nat. Clim. Change 2, 663–667. doi:10.1038/nclimate1580
Yao, Y. Y., Zheng, C. M., Andrews, C. B., Scanlon, B. R., Kuang, X. X., Zeng, Z. Z., et al. (2021). Role of groundwater in sustaining northern himalayan rivers. Geophys. Res. Lett. 48, e2020GL092354. doi:10.1029/2020gl092354
Yin, Y., Wu, S., Zhao, D., Zheng, D., and Pan, T. (2013). Modeled effects of climate change on actual evapotranspiration in different eco-geographical regions in the Tibetan Plateau. J. Geogr. Sci. 23, 195–207. doi:10.1007/s11442-013-1003-0
You, Q., Kang, S. C., Wu, Y. H., and Yan, Y. P. (2007). Climate change over the Yarlung Zangbo River Basin during 1961–2005. J. Geogr. Sci. 17, 409–420. doi:10.1007/s11442-007-0409-y
Zhang, D., Huang, J., Guan, X., Chen, B., and Zhang, L. (2013). Long-term trends of precipitable water and precipitation over the Tibetan Plateau derived from satellite and surface measurements. J. Quantitative Spectrosc. Radiat. Transf. 122, 64–71. doi:10.1016/j.jqsrt.2012.11.028
Zhang, J. Y., Lun, Y. R., Liu, L., Liu, Y. X., Li, X., and Xu, Z. X. (2021). CMIP6 evaluation and projection of climate change over the Tibetan plateau. J. Beijing Normal Univ. Nat. Sci. 2022 58, 77–89. doi:10.12202/j.0476-0301.2021114
Zhang, L., and Pan, X. D. (2020). Future climate projection of China based on regcm4.6 (2007-2099). National Tibetan Plateau Data Center.
Zhang, L., Su, F., Yang, D., Hao, Z., and Tong, K. (2013). Discharge regime and simulation for the upstream of major rivers over Tibetan Plateau. J. Geophys. Res. Atmos. 118, 8500–8518. doi:10.1002/jgrd.50665
Zhang, Y. G., Su, F. G., Hao, Z. C., Xu, C. Y., Yu, Z. B., Wang, L., et al. (2015). Impact of projected climate change on the hydrology in the headwaters of the Yellow River basin. Hydrol. Process. 29, 4379–4397. doi:10.1002/hyp.10497
Zhang, Y., Hirabayashi, Y., Liu, Q., and Liu, S. Y. (2017). Glacier runoff and its impact in a highly glacierized catchment in the southeastern Tibetan plateau: Past and future trends. J. Glaciol. 61, 713–730. doi:10.3189/2015jog14j188
Zhang, Y. Q., Engel, B., Ahiablame, L., and Liu, J. M. (2015). Impacts of climate change on mean annual water balance for watersheds in Michigan, USA. U. S. A. Water 7, 3565–3578. doi:10.3390/w7073565
Keywords: climate change, Yarlung Zangbo basin, streamflow, snowmelt, water balance
Citation: Deng Y, Yao Y, Zhao Y, Luo D, Cao B, Kuang X and Zheng C (2023) Impact of climate change on the long-term water balance in the Yarlung Zangbo basin. Front. Earth Sci. 11:1107809. doi: 10.3389/feart.2023.1107809
Received: 25 November 2022; Accepted: 07 March 2023;
Published: 23 March 2023.
Edited by:
Mathias Bavay, WSL Institute for Snow and Avalanche Research SLF, SwitzerlandReviewed by:
Sharad Kumar Jain, Indian Institute of Technology Roorkee, IndiaHiroyuki Hirashima, National Research Institute for Earth Science and Disaster Resilience, Japan
Copyright © 2023 Deng, Yao, Zhao, Luo, Cao, Kuang and Zheng. This is an open-access article distributed under the terms of the Creative Commons Attribution License (CC BY). The use, distribution or reproduction in other forums is permitted, provided the original author(s) and the copyright owner(s) are credited and that the original publication in this journal is cited, in accordance with accepted academic practice. No use, distribution or reproduction is permitted which does not comply with these terms.
*Correspondence: Yingying Yao, eWFveXkyN0B4anR1LmVkdS5jbg==
†Present Address: Yukun Deng, PowerChina Northwest Engineering Corporation Limited, Xian, China