 Li Lin
 Yuanben Zhang2
 Zongji Wang
 Xiongfei Liu
 Qianqian Wang
- 1School of Optics and Photonics, Beijing Institute of Technology, Beijing, China
- 2Key Laboratory of Network Information System Technology (NIST), Aerospace Information Research Institute, Chinese Academy of Sciences, Beijing, China
Introduction: The stereo matching technology of satellite imagery is an important way to reconstruct real world. Most stereo matching technologies for satellite imagery are based on depth learning. However, the existing depth learning based methods have the problems of holes and matching errors in stereo matching tasks.
Methods: In order to improve the effect of satellite image stereo matching results, we propose a satellite image stereo matching network based on attention mechanism (A-SATMVSNet). To solve the problem of insufficient extraction of surface features, a new feature extraction module based on triple dilated convolution with attention module is proposed, which solves the problem of matching holes caused by insufficient extraction of surface features. At the same time, compared with the traditional weighted average method, we design a novel cost-volume method that integrates attention mechanism to reduce the impact of matching errors to improve the accuracy of matching.
Results and discussion: Experiments on public multi-view stereo matching dataset based on satellite imagery demonstrate that the proposed method significantly improves the accuracy and outperforms various previous methods. Our source code is available at https://github.com/MVSer/A-SATMVSNet.
1 Introduction
3D reconstruction is a key process to restore the geometry of real world. The 3D reconstruction technology of real scenes has been developed extensively, and they all have unique advantages and disadvantages in specific scenes. According to the way of obtaining input data, 3D reconstruction technology can be divided into active reconstruction and passive reconstruction. Active reconstruction technology uses hardwares to directly obtain the geometric information of the shot scene, to obtain the depth information of the target scene. Passive reconstruction technology uses cameras to obtain some images to reconstruct the target scene. Compared with active 3D reconstruction, the camera equipment used in passive reconstruction technology has the advantages of low energy consumption and no direct contact with the real scene. In addition, with the popularity of digital cameras and smart phone lenses, the cost of camera hardware has decreased significantly over the past decade. This means that most people can have a camera and can contribute data to visual databases around the world. Organizing and using these rich and diverse photo data, and reconstructing high-precision, real three-dimensional models, has a very wide range of application scenarios. Thus, how to reconstruct the real world via multi-stereo matching is a big challenge that has brought much attention in recent years.
There are many classic methods in multi-view stereo matching based on handcrafted algorithms. These methods can be divided into 4 categories according to the format of output 3D model: voxel-based method, triangular mesh surface based method, point cloud based method and depth map based method (Seitz et al., 2006).
The voxel based algorithm divides the 3D space into discrete voxel grids, and judges whether voxels belong to the target scene surface by calculating the multi-view photometric consistency metric, so as to realize the reconstruction of the 3D scene (Seitz and Dyer, 1999; Kutulakos and Seitz, 2000). Collins (1996) divided several equidistant planes parallel to the camera plane in the camera space of the reference picture, and divided each plane into a grid. This method back projects the feature points of the multi-view camera into 3D space, and determines whether the plane grid belongs to the scene surface by calculating the number of back projection rays in the plane grid area. Although the representation is slightly different from the voxel grid, this method basically establishes the rudiment of voxel division, but is limited by the computer hardware level of that year, it can only divide the three-dimensional space by dividing the plane first, and then dividing the plane into grids. However, since the voxel partition itself is a kind of spatial discretization, the 3D model reconstructed by voxel based multi-view stereo vision algorithm inevitably has discrete errors. In addition, voxels often occupy a higher storage space, and are stored in limited memory or video memory.
Multi-view stereo vision algorithm based on triangular mesh surface first initializes a shape close to the real object, which is usually obtained by calculating the visible hull (Laurentini, 1994). Esteban and Schmitt (2004) proposed to optimize the mesh shape by using texture photometric consistency constraints and contour constraints. Hiep et al. (2009) first gridded the initial point cloud, and then repaired the grid according to detail restoration, adaptive resolution and photometric consistency. Zaharescu et al. (2010) proposed a mesh evolution framework based on the self intersection elimination algorithm, which can solve the problem that surface intersection cannot be fused in the iterative optimization process of triangular meshes. In this framework, triangular meshes are optimized based on multi-view photometric consistency constraints. Triangular meshes are easy to store and render, and especially suitable for visual computing. However, algorithms based on triangular meshes often require a better initial shape.
Multi-view stereo vision algorithm based on point cloud directly outputs point cloud 3D model. In order to densify the output point cloud, these methods often use propagation strategies to propagate good matching relationships or 3D points to the neighborhood space. Furukawa and Ponce (2009) used Harris Corner (Harris and Stephens, 1988) and Difference of Gaussian (Pitas, 2000) for feature matching to obtain initial sparse point cloud, and constructed and optimized block model on each point based on multi-view photometric consistency. Because point clouds are reconstructed directly in 3D space, and the distribution of point clouds is not as regular as pixels and voxels, it is difficult for point cloud based 3D reconstruction algorithms to use GPU parallelism to accelerate, which indirectly limits the performance and performance of such methods.
Multi-view stereo vision algorithm based on depth map estimates depth map or even normal vector map for each input image according to multi-view information, and then converts it into point cloud or triangular grid model through depth map fusion strategy. In the multi-view stereo vision algorithm based on depth map, the stereo matching process usually adopts the idea of patch match. Block matching was first proposed by Barnes et al. (2009). Its core idea is to first randomly initialize the matching relationship between the pixels of two photos, and then repeatedly spread the matching relationship with high matching degree to the neighborhood for optimization. Bleyer et al. (2011) first applied the idea of block matching to the field of binocular stereo vision matching, which regards rectangular pixel blocks in block matching as projections of square blocks in 3D space, and can be deformed according to projection transformation rules, and the matching search domain is the projection transformation under polar geometry. Galliani et al. (2015) improved the neighborhood propagation mode of block matching, enabling it to be parallelized on the GPU, greatly increasing the operation efficiency of the algorithm.
In recent years, deep convolutional neural networks (DCNNs) have been applied to multi-view stereo matching. In comparison with handcrafted algorithms, deep learning-based methods learn features automatically and can obtain low error rates. Early learning based multi-view stereo vision algorithms are all based on voxels. The SurfaceNet proposed in Ji et al. (2017) learned the weighted average probability of each voxel on the scene surface according to multiple groups of photos. Voxels with a probability greater than a certain threshold were identified as on the scene surface to reconstruct the three-dimensional model of the target scene. However, SurfaceNet is a voxel-based deep learning method, which consumes a lot of memory, thus its reconstruction model can only express limited scenes.
Similar to handcrafted based methods, deep learning based multi-view stereo matching via depth map is the best and most popular research direction in this field. DeepMVS (Huang et al., 2018) is the first network to obtain the depth map based on deep learning. DeepMVS divides a number of front parallel planes in front of the reference camera, and then transforms the projection of multi-view photos onto these planes. The depth neural network is used to extract and aggregate the multi-view information, and regularize the cost volume to estimate the probability of the reference picture pixels in each plane, so as to achieve depth map estimation. The MVSNet (Yao et al., 2018) first uses the U-Net network to extract the feature map of multi-view photos and project and transform it to the front parallel planes of multiple reference cameras, and then estimates the depth map by constructing a 3D cost volume on the front parallel planes and using 3D convolution neural network to regularize it. To improve the effectiveness of MVSNet, the R-MVSNet was proposed (Yao et al., 2019). R-MVSNet constructed 2D cost map and used sequential regularization instead of 3D cost volume and 3D convolutional neural network regularization, which improved the scalability of the network to a certain extent. However, the quality of its network output depth map is slightly worse than MVSNet, and the final reconstruction point cloud is better than MVSNet only by using the variational depth map repair algorithm to repair the depth map. The PVA-MVSNet (Yi et al., 2020) fills the area of high resolution stereo matching errors by building a pyramid structure to aggregate low resolution reliable depth estimates, and improves the reconstruction quality through adaptive perspective aggregation. The MVSNet-based multi-stereo matching methods are the mainstream in current study. To improve the accuracy and completion, a cascade network with a multiple cost volume aggregation module is proposed Li et al., 2022b. Zhang et al. (2023) explicitly infered and integrated the pixel-wise occlusion information in the MVSNet via the matching uncertainty estimation. Attention module and Transformer are the hot spots in current study, thus a few algorithms based on attention and transformer were proposed Liao et al. (2022); Weilharter and Fraundorfer, 2022; Li et al., 2022a; Wan et al., 2022; Wang et al., 2022; Jia et al., 2022; Ding et al., 2022.
However, the large-scale reconstructed scene via the current attention based MVSNet is inaccurate and incomplete. To further improve the effect on multi-view stereo matching, in this study, we propose a novel attention-aware multi-view stereo network based on satellite imagery, namely, A-SATMVSNet. To solve the problem of insufficient extraction of surface features, a new feature extraction module based on triple dilated convolution with attention module is proposed, which solves the problem of matching holes caused by insufficient extraction of surface features. At the same time, compared with the traditional weighted average method, we design a novel cost-volume method that integrates attention mechanism to reduce the impact of matching errors to improve the accuracy of matching. Experiments on public multi-view stereo matching dataset based on satellite imagery demonstrate that the proposed method significantly improves the highest accuracy and outperforms various previous methods.
We explicitly state our original contributions as follows:
1. We propose a new feature extraction module based on triple dilated convolution with attention model to solve the problem of insufficient extraction of surface feature;
2. Compared with traditional weighted average method, we propose a novel const-volume method that integrates attention mechanism to reduce the impact of matching errors to improve the accuracy in matching stage;
3. We achieve a new state-of-the-art on public multi-view stereo matching dataset based on satellite imagery.
The remainder of this paper is organized as follows. Section 2 presents the components of our proposed A-SATMVSNet. Section 3 reports the extensive experimental results and evaluates the performance of the proposed method. Section 4 presents the discussion. Finally, Section 5 provides the conclusions and hints at plausible future research.
2 Materials and methods
2.1 Problem definition
In the satellite MVS task, our goal is to use an end-to-end coarse-to-fine framework to predict the height map H by leveraging the matching relationship between N − 1 adjacent views and the corresponding camera parameters. First of all, we extract the image features
2.2 Overview of the proposed framework
Our proposed A-SATMVSNet is an trainable framework, which consists of two import parts: feature extraction and cost volume construction. As shown in Figure 1, the N input images
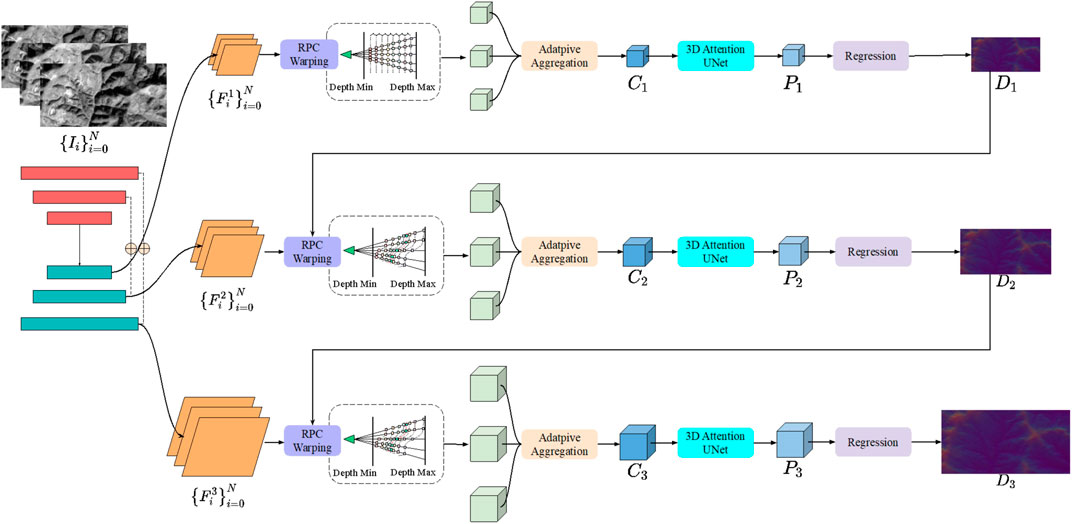
FIGURE 1. The framework of the proposed A-SATMVSNet.
2.3 Attention-aware multi-scale feature extraction module
In this section, we mainly describe the proposed attention-aware multi-scale feature extraction module. There are many popular feature extraction modules such as UNet-based (Ronneberger et al., 2015; Isensee et al., 2018; Li et al., 2018; Oktay et al., 2018; Huang et al., 2020), feature pyramid network-based (Lin et al., 2017; Kim et al., 2018; Seferbekov et al., 2018; Zhao et al., 2021), resnet-based (He et al., 2016; Targ et al., 2016; Szegedy et al., 2017; Bharati et al., 2021), etc. All the above feature extraction modules perform well in multi-view stereo matching tasks. In our study, we propose a new feature extraction module based on (Cheng et al., 2020) where it is combined with an attention module. The basic module consists of an encoder and a decoder with skip connection. The module outputs a three-scale feature pyramid whose size is {1/16, 1/4, 1} of the input satellite image size, and the number of feature channels is 32, 16, and 8 respectively. In the encoder part, an attention module is designed. The attention module and feature extraction layer in encoder and decoder part are shown in Figure 2.
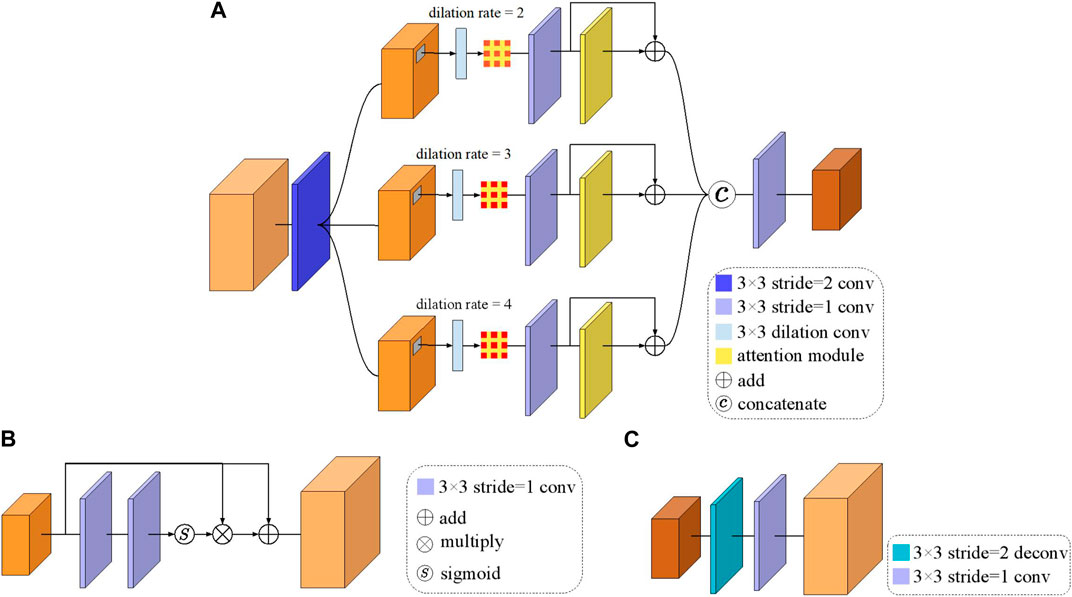
FIGURE 2. The architecture of the proposed feature extraction module. (A) Represents the architecture of the detailed feature extraction layer in encoder network with attention module. (B) Represents the architecture of the attention module. (C) Is the decoder network.
Figure 2A shows the architecture of the detailed feature extraction layer in encoder network with attention module. First, a convolution layer with 3 × 3 kernel size is used to extract features. After that, the feature map is sent to three different dilated convolution layers with dilation rate of 2, 3 and 4 respectively. Then, all the three output feature maps are sent to a 3 × 3 convolution layer with an attention module. Finally, the three output feature maps are concatenated to generate a new feature map, as the final feature map. The formulation of our triple dilate convolution is defined as follow:
where ⊗ represents the multiply operation, ⊙ denotes the element-wise product, wi represents the ith weights of dilate convolution.
Figure 2B shows the architecture of the attention module. The input feature map is defined as Fin. Two convolution layers with a kernel of 3 × 3 are employed to generate further features
Figure 2C is the architecture of the decoder network, which consists of a deconvolution layer with a kernel size of 3 × 3, stride size of 2 and a convolution layer with a stride size of 1.
2.4 Rational polynomial camera model (RPC)
The rational polynomial camera model (RPC) is extensively used in satellite imagery processing, which connects the image points and corresponding world coordinate points with cubic rational polynomial coefficients (Gao et al., 2021). We define the world coordinates as
In multi-view stereo matching task via satellite imagery, the RPC model is a widely used geometric model, which can provide a high accuracy to the rigorous sensor model (RSM) (Tao and Hu, 2001).
2.5 Differentiable RPC warping
Currently, most state-of-the-art MVS methods warp the source views to a reference view to obtain per-view matching feature volumes by a homography matrix and a set of fronto-parallel depth hypotheses planes D. The definition of the differentiable homography based pin-hole camera model is as bellow:
where T and K denote camera extrinsic and intrinsic respectively. Compared with pin-hole camera model, the cubic rational polynomial camera (RPC) model is widely used in satellite domain, which has the advantage than all camera models, e.g., projective, affine and the linear pushbroom. A matrix alone cannot formulate the warping of the RPC model due to its complexity. In this regard, SatMVS proposes a rigorous and efficient RPC warping module that is fundamentally a high-order tensor transformation, which is fundamental to the structure of SatMVS. Using a set of hypothetical height planes in the world coordinate system, the RPC warping module projects images from different views to the reference view, instead of the fronto-parallel planes of a reference view, because the RPC model does not include explicit physical parameters for defining the front of a camera.
Firstly, SatMVS transforms the ternary cubic polynomial by using cubic polynomials to a quaternion cubic homogeneous polynomial
Extendedly, the formulation of the RPC model with a set of points is defined as bellow:
where
2.6 Feature volume adaptive aggregation
Previous methods usually aggregate the feature volumes to a cost volume by leveraging the cost metric (Hiep et al., 2009). The common practice is to use the variance-based cost metric (CM) to average N − 1 feature volumes. CM considers that the confidence values of the corresponding pixels between the corresponding feature volumes of each view are equally important. The formulation of variance-based cost metric is defined as bellow:
where
Therefore, as illustrated in Figure 3, we design an adaptive feature volume aggregation module to calculate an aggregation weighting volume for each feature volume to achieve unequally confidence aggregation. The definition of our module is defined as Eq. 5:
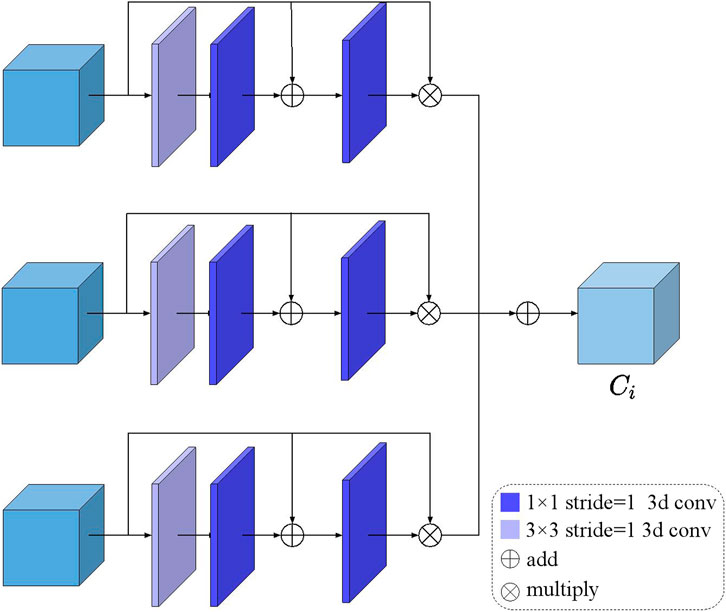
FIGURE 3. Illustration of the proposed adaptive feature volume aggregation module.
In this way, pixels that may cause the matching errors are suppressed, i.e., the confidences corresponding to pixels are allocated the lower weight, while those with critical feature information are given higher weight. We also formulate our adaptive feature volume aggregation module as follows:
where ⊙ denotes Hadamard multiplication and ω(…) is the pixel-wise attention maps adaptively yielded according to per-view cost volumes.
2.7 Cost volume regularization
Cost volume regularization (regression to obtain height map) can be seen as a segmentation problem and is handled using the UNet commonly used for semantic segmentation tasks. Therefore, similar to the UNet-shape network used by the previous methods for cost volume regularization, we adopt a similar multi-stage 3D UNet to aggregate neighboring information from a large receptive field, which is composed of three stages (downsample, bottleneck, upsample). First, in the downsampling stage, we leverage the ordinary convolution to obtain the intermediate volume
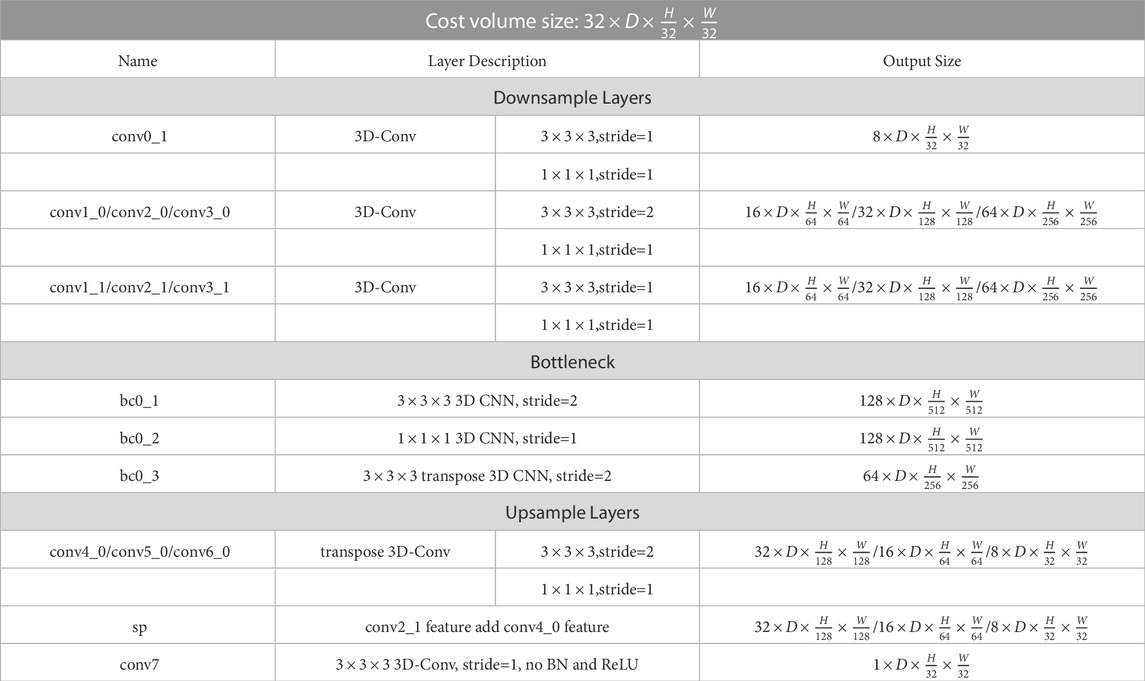
TABLE 1. The detailed architecture of the 3D UNet. Each convolutional layer represents a block of convolution, batch normalization (BN) and ReLU; “sp” means skip connection; “H” and “W” denote the height and width of the reference image, respectively.
2.8 Implementation detail
2.8.1 Training
Our A-SATMVSNet is implemented using PyTorch, which is trained on TLC SatMVS training dataset for evaluation on TLC SatMVS testing dataset. The preprocessing strategies and selection of input views follow common strategies in a representative previous work (Gao et al., 2021). We train and validate our model on the TLC SatMVS training set and evaluating set respectively. In the training process, we set the input image resolution to 768 × 384, and the number of training views to N = 3. The hypothetical height planes of our framework are set as {64, 32, 8}. We optimize our model for 16 epochs with Adam optimizer, meanwhile, the learning rate is set as 0.001. Besides, we set the batch size as 4 and train our model on 4 NVIDIA GTX 2080 GPU devices. We adopt the metrics (MAE, RMSE, <2.5m, <7.5m, Comp and Runtime) provided by the SatMVS to evaluate the quality of the height maps obtained by our model.
2.8.2 Testing
We test on TLC SatMVS testing dataset with our best result. And we set the adjacent image number N = 3, the image resolution as 768 × 384, and the hypothetical height places for testing as {64, 32, 8}.
2.8.3 Evaluation metrics
We adopt four common metrics to eval the quantitative results of the final height maps.
1. MAE: the mean absolute error, i.e., the mean of the L1 distance over all pixels between the GT height map and predicted height map.
2. RMSE: the root-mean-square-error, i.e., the standard deviation of the residuals between the GT height and predicted height map.
3. <2.5 m, <7.5 m: percentage of all pixels with L1 distance errors below the 2.5m and 7.5m thresholds.
4. Comp: percentage of all pixels with valid height values in the final height map.
2.9 Experimental dataset
In this paper, we adopt the TLC SatMVS dataset proposed by SatMVS. The TLC SatMVS dataset consists of the triple-view images, and the height maps, which are generated by projecting the GT DMS with the corresponding RPC parameters of TLC cameras, which are mounted by Ziyuan-3 (ZY-3) satellite, as shown in Figure 4. And the GT DSMs are obtained from high-accuracy LiDAR observations and ground control point (GCP)-supported photogrammetric software. The dataset consists of 5,011 image patches with resolution 768 × 384.
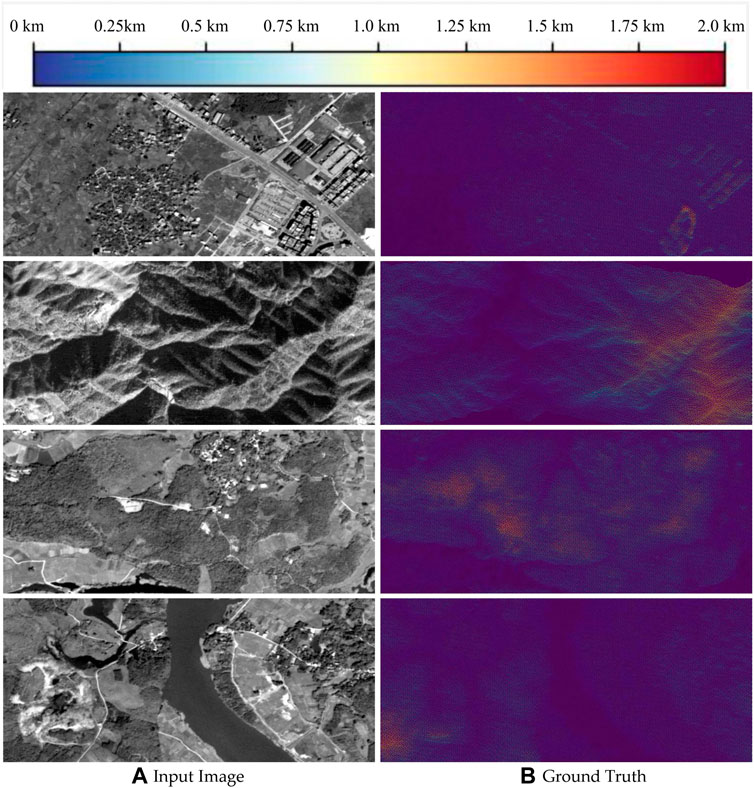
FIGURE 4. Samples of TLC SatMVS dataset. (A) Represents the sample of input images in the dataset. (B) Represents the Ground Truth depth maps corresponding to the input images.
3 Results
3.1 Evaluation on the TLC SatMVS dataset
Figure 5 shows the visualization results of the proposed method on TLC SatMVS Dataset. We restore the depth map from three images. It can be seen that in mountainous areas with large topographic relief, this method has certain effect on depth estimation of multi-view remote sensing images, which verifies the effectiveness of this method.
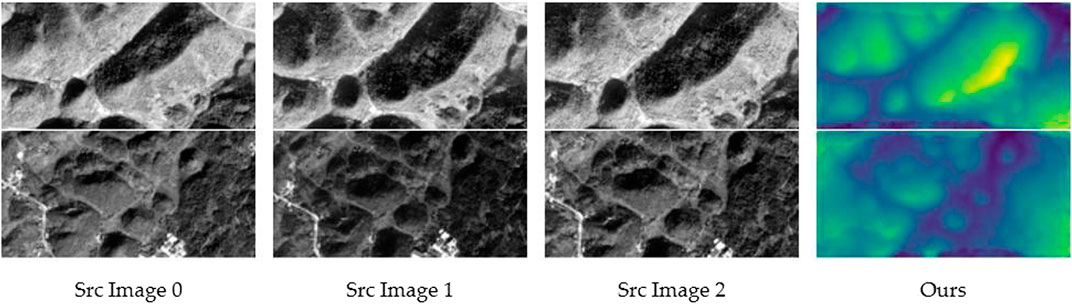
FIGURE 5. Visualization results of the proposed methods on TLC SatMVS Dataset.
Table 2 shows the quantitative results on TLC SatMVS Dataset. We compare with traditional and deep learning based MVS methods for satellite images to demonstrate the effectiveness of our model. We have the following observations: 1) We can observe that our method achieves the best among current state-of-the-arts methods in the metrics (MAE:1.597, RMSE:2.036, <2.5m:82.68, Comp:84.32). 2) For traditional MVS method which adopts the pin-hole camera model, e.g., adapted COLMAP, our model outperforms it in all metrics (MAE, RMSE,
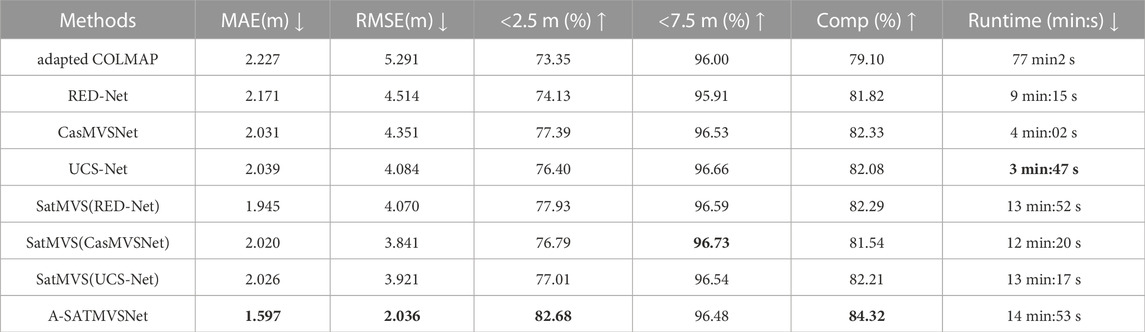
TABLE 2. Quantitative results of the different MVS methods on the TLC SatMVS dataset. The proposed SatMVS with RPC warping implements three different learning-based MVS methods for height inference. Numbers in bold indicate the best results.
Figure 6 shows the visualization results of different compared methods on TLC SatMVS dataset. It can be seen that the details of the SatMVS(CasMVSNet) method at the corners are seriously missing. However, the results of the method in this paper are more realistic at detail, which are closer to the truth value.
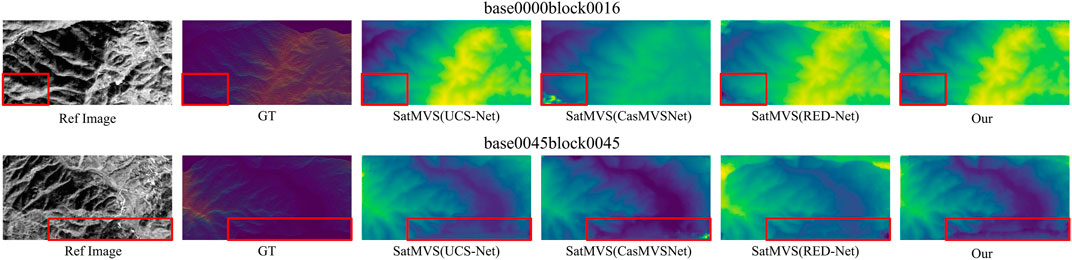
FIGURE 6. Visualization results of different compared methods. The differences are highlighted via red boxes in the results.
The graph representations of MAE, RMSE,
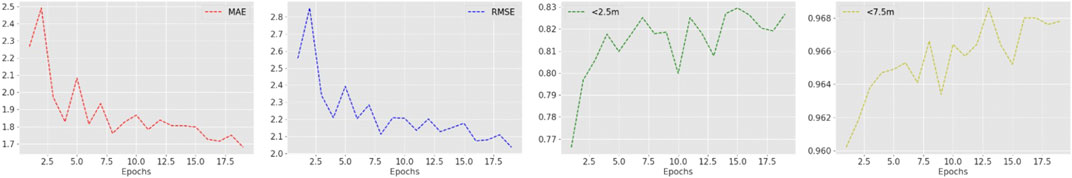
FIGURE 7. Visualization results of the graph representations of MAE, RMSE,
Additionally, we also exhibit the visualisation results of our proposed method for four different types of areas: a) darker areas, b) discontinuous areas, c) weakly textured areas, and d) areas with strong height variations, as shown in Figure 8. Our observations are as follows: In a), despite the overall darkness of the scene, our model effectively estimates the height map of the red-boxed area and accurately describes the undulations of the terrain. In b), the red-boxed area is clearly discontinuous with the surrounding area, but our method still produces accurate height estimations without any false noise heights. In c), even though the texture of terrain in the red-boxed area is not very distinct, our method effectively estimates the height map for each pothole. In d), the image contains significant sharp height shifts and some colour noise, but this does not affect the effectiveness of our model in estimating the height map.
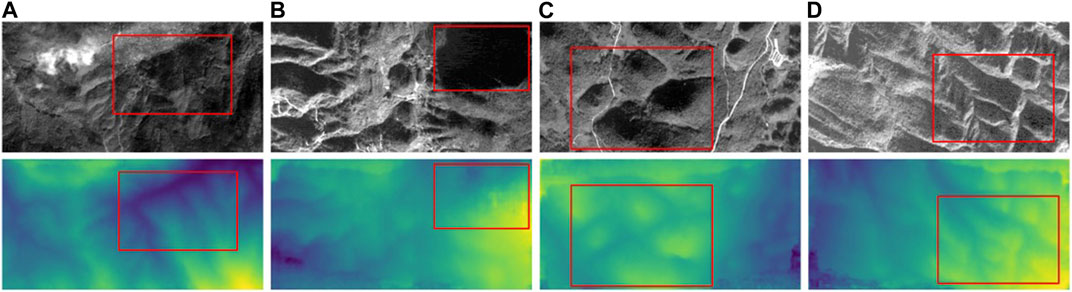
FIGURE 8. Visualization results of four different types of areas. (A) Darker areas. (B) Discontinuous areas. (C) Weakly textured areas. (D) Areas with strong hight variations.
3.2 Evaluation on the large-size satellite images
We train and validate the large-size satellite images (5,120 × 5,120) with RED-Net, SatMVS(RED-Net) and our A-SATMVSNet on a NVIDIA RTX 3090. The results are shown in Table 3. We can observe that although using the large-size satellite images as input data, which affects the performance of our model, our method still maintain a relatively excellent performance compared with other methods. This confirms the effectiveness and advantage of our proposed model.
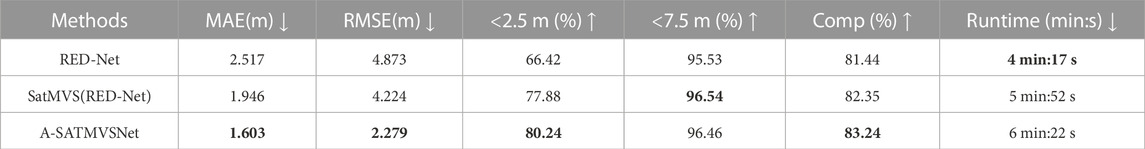
TABLE 3. Quantitative results of the SatMVS(RED-Net) and the RED-Net (with fitted pinhole model) on the TLC SatMVS dataset with different sizes. Numbers in bold indicate the best results.
4 Discussion
In this section, we provide ablation experiments to quantitatively and qualitatively evaluate the effectiveness of each of our proposed modules. The following proposed ablation results are processed on TLC SatMVS dataset using the similar parameters as Section 2.5. We adopt the decreasing comparison to validate the effectiveness of each of our proposed modules. The quantitative results are shown in Table 4. Comparing Row1 with Row3 in Table 4 indicates that our proposed Feature Extraction Network significantly improves the performance, i.e., MAE from 1.892 to 1.603 (SOTA). And we also observe that our Adaptive Volume Aggregation module can effectively improve the performance, i.e., RMSE from 2.253 to 2.270. It is clear that each individual module can significantly enhance model effects, and the two modules are complementary in A-SATMVSNet to achieve the best performance. Furthermore, we conducted sensitivity experiments on the depth Hypothesis Numbers and resolution of images, as presented in Table 5. Specifically, we compared the reconstruction quality of Dnum=[48, 16, 8], Dnum=[64, 16, 8], and Dnum=[64, 32, 8], while keeping N fixed at 3 and image resolution at 384 × 768. The results in Tab.5 demonstrate that finer depth division Dnum can enhance the reconstruction quality across all metrics.
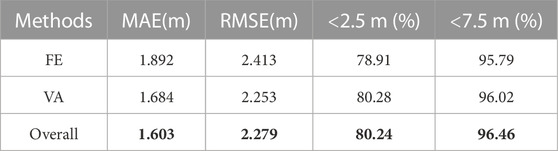
TABLE 4. Ablation results. ‘FE’ represents feature extraction module; ‘VA’ represents adaptive volume aggregation. Numbers in bold indicate the best results.
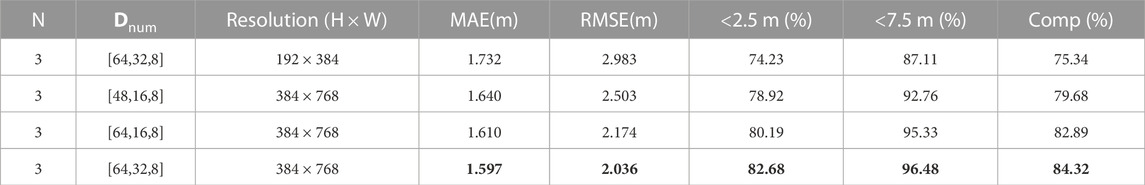
TABLE 5. Ablation study on number of depth hypothesis planes Dnum and resolutions of input images W and H on TLC SatMVS Dataset. Numbers in bold indicate the best results.
5 Conclusion
In this paper, we have proposed a satellite image stereo matching network based on attention mechanism (A-SATMVSNet). We design a feature extraction module based on triple dilated convolution with attention module to solve the problem of matching holes caused by insufficient extraction of surface features. Furthermore, compared with the traditional weighted average method, we design a novel cost-volume method that integrates attention mechanism to reduce the impact of matching errors to improve the accuracy of matching. As a result, our method achieves SOTA results on TLC SatMVS Dataset, showing better performance than many existing learning-based MVS methods in satellite images domain.
Data availability statement
Publicly available datasets were analyzed in this study. This data can be found here: https://github.com/WHU-GPCV/SatMVS.
Author contributions
QW was the project manager. LL conceived and designed the study. YZ and ZW conducted the experiments. LZ, XL, and QW analysed the data. LL and ZW wrote the manuscript. YZ, LZ, XL, and QW revised the manuscript.
Conflict of interest
The authors declare that the research was conducted in the absence of any commercial or financial relationships that could be construed as a potential conflict of interest.
Publisher’s note
All claims expressed in this article are solely those of the authors and do not necessarily represent those of their affiliated organizations, or those of the publisher, the editors and the reviewers. Any product that may be evaluated in this article, or claim that may be made by its manufacturer, is not guaranteed or endorsed by the publisher.
References
Barnes, C., Shechtman, E., Finkelstein, A., and Goldman, D. B. (2009). Patchmatch: A randomized correspondence algorithm for structural image editing. ACM Trans. Graph. 28, 1–11. doi:10.1145/1531326.1531330
Bharati, S., Podder, P., Mondal, M., and Prasath, V. (2021). Co-resnet: Optimized resnet model for Covid-19 diagnosis from x-ray images. Int. J. Hybrid Intelligent Syst. 17, 71–85. doi:10.3233/his-210008
Bleyer, M., Rhemann, C., and Rother, C. (2011). Patchmatch stereo-stereo matching with slanted support windows. Bmvc 11, 1–11.
Cheng, S., Xu, Z., Zhu, S., Li, Z., Li, L. E., Ramamoorthi, R., et al. (2020). “Deep stereo using adaptive thin volume representation with uncertainty awareness,” in Proceedings of the IEEE/CVF conference on computer vision and pattern recognition, 2524–2534.
Collins, R. T. (1996). “A space-sweep approach to true multi-image matching,” in Proceedings CVPR IEEE computer society conference on computer vision and pattern recognition (Ieee), 358–363.
Ding, Y., Yuan, W., Zhu, Q., Zhang, H., Liu, X., Wang, Y., et al. (2022). “Transmvsnet: Global context-aware multi-view stereo network with transformers,” in Proceedings of the IEEE/CVF conference on computer vision and pattern recognition, 8585–8594.
Esteban, C. H., and Schmitt, F. (2004). Silhouette and stereo fusion for 3d object modeling. Comput. Vis. Image Underst. 96, 367–392. doi:10.1016/j.cviu.2004.03.016
Furukawa, Y., and Ponce, J. (2009). Accurate, dense, and robust multiview stereopsis. IEEE Trans. pattern analysis Mach. Intell. 32, 1362–1376. doi:10.1109/tpami.2009.161
Galliani, S., Lasinger, K., and Schindler, K. (2015). Massively parallel multiview stereopsis by surface normal diffusion. Proc. IEEE Int. Conf. Comput. Vis., 873–881.
Gao, J., Liu, J., and Ji, S. (2021). “Rational polynomial camera model warping for deep learning based satellite multi-view stereo matching,” in Proceedings of the IEEE/CVF international conference on computer vision, 6148–6157.
Harris, C., and Stephens, M. (1988). “A combined corner and edge detector,” in Alvey vision conference Manchester, UK, 15, 10–5244.
He, K., Zhang, X., Ren, S., and Sun, J. (2016). “Deep residual learning for image recognition,” in Proceedings of the IEEE conference on computer vision and pattern recognition, 770–778.
Hiep, V. H., Keriven, R., Labatut, P., and Pons, J.-P. (2009). “Towards high-resolution large-scale multi-view stereo,” in 2009 IEEE conference on computer vision and pattern recognition (IEEE), 1430–1437.
Huang, H., Lin, L., Tong, R., Hu, H., Zhang, Q., Iwamoto, Y., et al. (2020). “Unet 3+: A full-scale connected unet for medical image segmentation,” in ICASSP 2020-2020 IEEE international conference on acoustics, speech and signal processing (ICASSP) (IEEE), 1055–1059.
Huang, P.-H., Matzen, K., Kopf, J., Ahuja, N., and Huang, J.-B. (2018). “Deepmvs: Learning multi-view stereopsis,” in Proceedings of the IEEE conference on computer vision and pattern recognition, 2821–2830.
Isensee, F., Petersen, J., Klein, A., Zimmerer, D., Jaeger, P. F., Kohl, S., et al. (2018). nnu-net: Self-adapting framework for u-net-based medical image segmentation. arXiv preprint arXiv:1809.10486.
Ji, M., Gall, J., Zheng, H., Liu, Y., and Fang, L. (2017). “Surfacenet: An end-to-end 3d neural network for multiview stereopsis,” in Proceedings of the IEEE international conference on computer vision, 2307–2315.
Jia, R., Chen, X., Cui, J., and Hu, Z. (2022). Mvs-t: A coarse-to-fine multi-view stereo network with transformer for low-resolution images 3d reconstruction. Sensors 22, 7659. doi:10.3390/s22197659
Kim, S.-W., Kook, H.-K., Sun, J.-Y., Kang, M.-C., and Ko, S.-J. (2018). “Parallel feature pyramid network for object detection,” in Proceedings of the European conference on computer vision (Munich, Germany: ECCV), 234–250.
Kutulakos, K. N., and Seitz, S. M. (2000). A theory of shape by space carving. Int. J. Comput. Vis. 38, 199–218. doi:10.1023/a:1008191222954
Laurentini, A. (1994). The visual hull concept for silhouette-based image understanding. IEEE Trans. pattern analysis Mach. Intell. 16, 150–162. doi:10.1109/34.273735
Li, J., Bai, Z., Cheng, W., and Liu, H. (2022a). “Feature pyramid multi-view stereo network based on self-attention mechanism,” in 2022 the 5th international conference on image and graphics processing (ICIGP), 226–233.
Li, X., Chen, H., Qi, X., Dou, Q., Fu, C.-W., and Heng, P.-A. (2018). H-Denseunet: Hybrid densely connected unet for liver and tumor segmentation from ct volumes. IEEE Trans. Med. imaging 37, 2663–2674. doi:10.1109/tmi.2018.2845918
Li, Y., Zhao, Z., Fan, J., and Li, W. (2022b). Adr-mvsnet: A cascade network for 3d point cloud reconstruction with pixel occlusion. Pattern Recognit. 125, 108516. doi:10.1016/j.patcog.2021.108516
Liao, J., Ding, Y., Shavit, Y., Huang, D., Ren, S., Guo, J., et al. (2022). Wt-mvsnet: Window-based transformers for multi-view stereo. arXiv preprint arXiv:2205.14319.
Lin, T.-Y., Dollár, P., Girshick, R., He, K., Hariharan, B., and Belongie, S. (2017). “Feature pyramid networks for object detection,” in Proceedings of the IEEE conference on computer vision and pattern recognition, 2117–2125.
Oktay, O., Schlemper, J., Folgoc, L. L., Lee, M., Heinrich, M., Misawa, K., et al. (2018). Attention u-net: Learning where to look for the pancreas. arXiv preprint arXiv:1804.03999.
Ronneberger, O., Fischer, P., and Brox, T. (2015). “U-net: Convolutional networks for biomedical image segmentation,” in International Conference on Medical image computing and computer-assisted intervention (Springer), 234–241.
Seferbekov, S., Iglovikov, V., Buslaev, A., and Shvets, A. (2018). “Feature pyramid network for multi-class land segmentation,” in Proceedings of the IEEE conference on computer vision and pattern recognition workshops, 272–275.
Seitz, S. M., Curless, B., Diebel, J., Scharstein, D., and Szeliski, R. (2006). “A comparison and evaluation of multi-view stereo reconstruction algorithms,” in 2006 IEEE computer society conference on computer vision and pattern recognition (CVPR’06) (IEEE), 1, 519–528.
Seitz, S. M., and Dyer, C. R. (1999). Photorealistic scene reconstruction by voxel coloring. Int. J. Comput. Vis. 35, 151–173. doi:10.1023/a:1008176507526
Szegedy, C., Ioffe, S., Vanhoucke, V., and Alemi, A. A. (2017). “Inception-v4, inception-resnet and the impact of residual connections on learning,” in Thirty-first AAAI conference on artificial intelligence.
Tao, C. V., and Hu, Y. (2001). A comprehensive study of the rational function model for photogrammetric processing. Photogrammetric Eng. remote Sens. 67, 1347–1358.
Targ, S., Almeida, D., and Lyman, K. (2016). Resnet in resnet: Generalizing residual architectures. arXiv preprint arXiv:1603.08029.
Wan, Z., Xu, C., Hu, J., Xiao, J., Meng, Z., and Chen, J. (2022). “Multi-view stereo network with attention thin volume,” in Pricai 2022: Trends in artificial intelligence: 19th pacific rim international conference on artificial intelligence, PRICAI 2022, shanghai, China, november 10–13, 2022, proceedings, Part III (Springer), 410–423.
Wang, X., Zhu, Z., Huang, G., Qin, F., Ye, Y., He, Y., et al. (2022). “Mvster: Epipolar transformer for efficient multi-view stereo,” in Computer vision–ECCV 2022: 17th European conference, tel aviv, Israel, october 23–27, 2022, proceedings, Part XXXI (Springer), 573–591.
Weilharter, R., and Fraundorfer, F. (2022). “Atlas-mvsnet: Attention layers for feature extraction and cost volume regularization in multi-view stereo,” in 2022 26th international conference on pattern recognition (ICPR) (IEEE), 3557–3563.
Yao, Y., Luo, Z., Li, S., Fang, T., and Quan, L. (2018). “Mvsnet: Depth inference for unstructured multi-view stereo,” in Proceedings of the European conference on computer vision (ECCV), 767–783.
Yao, Y., Luo, Z., Li, S., Shen, T., Fang, T., and Quan, L. (2019). “Recurrent mvsnet for high-resolution multi-view stereo depth inference,” in Proceedings of the IEEE/CVF conference on computer vision and pattern recognition, 5525–5534.
Yi, H., Wei, Z., Ding, M., Zhang, R., Chen, Y., Wang, G., et al. (2020). “Pyramid multi-view stereo net with self-adaptive view aggregation,” in European conference on computer vision (Springer), 766–782.
Zaharescu, A., Boyer, E., and Horaud, R. (2010). Topology-adaptive mesh deformation for surface evolution, morphing, and multiview reconstruction. IEEE Trans. Pattern Analysis Mach. Intell. 33, 823–837. doi:10.1109/tpami.2010.116
Zhang, J., Li, S., Luo, Z., Fang, T., and Yao, Y. (2023). Vis-mvsnet: Visibility-aware multi-view stereo network. Int. J. Comput. Vis. 131, 199–214. doi:10.1007/s11263-022-01697-3
Keywords: machine learning, satellite imagery, multi-view stereo matching, convolutional neural network, attention module
Citation: Lin L, Zhang Y, Wang Z, Zhang L, Liu X and Wang Q (2023) A-SATMVSNet: An attention-aware multi-view stereo matching network based on satellite imagery. Front. Earth Sci. 11:1108403. doi: 10.3389/feart.2023.1108403
Received: 26 November 2022; Accepted: 29 March 2023;
Published: 13 April 2023.
Edited by:
Athos Agapiou, Cyprus University of Technology, CyprusReviewed by:
Ming Hao, China University of Mining and Technology, ChinaRostam Affendi Hamzah, Technical University of Malaysia Malacca, Malaysia
Nurulfajar Abd Manap, Technical University of Malaysia Malacca, Malaysia
Copyright © 2023 Lin, Zhang, Wang, Zhang, Liu and Wang. This is an open-access article distributed under the terms of the Creative Commons Attribution License (CC BY). The use, distribution or reproduction in other forums is permitted, provided the original author(s) and the copyright owner(s) are credited and that the original publication in this journal is cited, in accordance with accepted academic practice. No use, distribution or reproduction is permitted which does not comply with these terms.
*Correspondence: Qianqian Wang, cXF3YW5nQGJpdC5lZHUuY24=