 Zhan-Xi Wei1,2,3†
 Meng Zhao
 Fei-Hong Xie
 Jian-Hui Dong
- 1Qinghai Bureau of Environmental Geological Exploration, Xining, China
- 2Qinghai 906 Project Survey and Design Institute, Xining, China
- 3Qinghai Geological Environmental Protection and Disaster Prevention Engineering Technology Research Center, Xining, China
- 4Sichuan Engineering Research Center for Mechanical Properties and Engineering Technology of Unsaturated Soils, Chengdu University, Chengdu, China
- 5State Key Laboratory of Geological Disaster Prevention and Geological Environment Protection, Chengdu University of Technology, Chengdu, China
In order to analyze the deformation of the old goaf in Dameidong Coal Mine and its influence on the surrounding rock and soil layer, it provides guidance for the prevention and control of geological disasters in the region. In this paper, the transient electromagnetic method and numerical simulation method were used to study the deformation law of the overlying strata in the mining area. The results of transient electromagnetic detection showed that the subsidence area of the goaf in Dameidong Coal Mine was within the range of the elliptical water-rich area, and the average buried depth of the goaf was expected to be 90 m. The model was established by discrete element numerical simulation to study the variation law of mining overburden rock. The results showed that the stress change in coal mining was mainly reflected at both ends of the goaf, which was a stress concentration phenomenon. Overburden rock deformation changed with the mining process. The stress concentration area and the displacement change area were highly coincident, consisted with the displacement monitoring map, showing a “U”-type distribution. The results proved that the numerical simulation results do have theoretical guidance for mining subsidence control.
1 Introduction
Since the 21st century, ecological construction had been an indispensable part of the global sustainable development strategy (Liu et al., 2010; Xia et al., 2006). However, with the gradual increase of the depth of coal mine development, the deformation and destruction of the overlying strata would lead to surface subsidence and trigger a series of mine geological disasters. Therefore, the detection of the range of coal mine goaf and the exploration of the deformation law of rock strata had become the research focus of many scholars.
First of all, in the field of geological disaster prevention and control, many scholars have done a lot of research. Zhang et al. (2022) proposed a prediction method of creep landslide by using mathematical model, which has important guiding significance for the prevention and control of landslide disaster. Through triaxial compression (RTC ) test, Zhang et al. (2020) analyzed the deformation characteristics and mechanical response of unloading soil, and revealed the instability mechanism and response mechanism of loess slope under unloading. Zhang et al. (2019a), Zhang et al. (2019b) proposed an early warning threshold model for rainfall-induced slope instability by studying the characteristics of slope deformation and failure caused by the continuous rise of groundwater level, which provided a new framework for early warning. Pei et al. (2016) revealed the importance of geological disaster prevention by studying the complete failure process of high fill slope. In the field of mining area exploration, Yin (2022) combined with audio magnetotelluric sounding (AMT) to detect the apparent resistivity of the karst development area in the mining area found out the distribution of the goaf in mining area and explained the feasibility of audio magnetotelluric sounding (AMT) and high density resistivity tomography to detect fault location. Qiang et al. (2021) applied the transient electromagnetic method to detect the apparent resistivity anomaly area of coal seam roof and floor and divided the relative water-rich anomaly area in the stratum. The importance of the transient electromagnetic method in the field of goaf detection is proved. In addition, Yang and Guo (2020), Wang and Liu (2013), Sun et al. (2021), and Wang (2009) used the high-density electrical method to detect the range of coal mine goaf and achieved effective results.
With the in-depth study of the stress distribution of overlying rock mass caused by underground mining by many scholars, physical models and numerical simulation experiments are more and more widely used. Yu and Gui (2014) used numerical simulation software to simulate the gently inclined coal seam with two-dimensional discrete element numerical simulation. The results show that compared with the horizontal coal seam in the plain area, the cracks caused by the shallow buried inclined coal seam in the mountainous area are more developed, the stability is poor, and it is easy to lose stability and cause landslides. Guan et al. (2012) used discrete element UDEC software to study the working face of the shallow coal seam subsidence area and concluded that the shallow coal seam rock layer and the main key layer have coupling effect on surface subsidence. Liang (2020) used two-dimensional discrete element UDEC numerical simulation software to study the dynamic development of cracks and the movement process of overlying strata in the shallow coal seam working face and obtained the caving step of immediate roof and the dynamic change law of overlying strata after mining in the shallow coal seam working face. Chen et al. (2016), through the physical similarity simulation experiment, proved that the use of the local filling coordination mining method can effectively control the fracture development height and for green mining energy and ecological environment protection to find a more effective and more efficient method. Liiu (2017) used two-dimensional discrete element UDEC software to study the feasibility and necessity of mining close-distance protective layers and concluded that the expansion rate of the protected layer reached 3‰. In addition, the stress changes and collapse caused by close-distance protected layers are in line with relevant regulations. Li (2016) used UDEC numerical simulation software to simulate the excavation direction of the shallow coal seam working face and monitored the dynamic change process of subsidence displacement and stress of different strata in the model during the gradual excavation process, so as to obtain the movement and deformation law of overlying strata after the gradual excavation of different coal seams, which provided relevant basis for the control of rock and soil layers in coal mines.
Through UDEC numerical simulation software, Gao et al. (2013) simulated the overlying coal and rock strata of the coal mine working face. The calculation results show that there are obvious vertical fracture cracks in the 20–30 m range of the two sides of the goaf in the coal mine. The results of the two-dimensional discrete element numerical simulation software are in good agreement with the field investigation results. This research results also provide a certain basis for other similar mine stope conditions and gas control in the goaf. It is demonstrated that the dynamic movement process of the overburden caused by coal seam mining simulated by the software can predict the dynamic distribution of gas migration channels during mining in the actual process. This also has important guiding significance for preventing gas overflow. Guo et al. (2010) used two-dimensional discrete element simulation software to demonstrate the relationship between force and force between rock mass blocks, which directly reflects that two-dimensional discrete element has been widely used in coal mine rock mechanics and mine pressure research. The aforementioned research shows that in the detection field of coal seam goaf, magnetotelluric method and transient electromagnetic method can accurately detect the approximate range and location of goaf and have the characteristics of easy construction, high detection accuracy, and strong directivity. It has become a mainstream detection method. The aforementioned research showed that in the field of coal seam goaf detection, the magnetotelluric method and transient electromagnetic method could indeed detect the approximate range and location of goaf, and numerical simulation could also study the deformation of overburden strata in the process of mining. However, there was no complete and specific research on the detection of mined-out area and the law of stress–strain settlement in the alpine region where the mining situation was more complex.
In this paper, the large coal tunnel of Datong Coal Mine in Datong County, Xining City, Qinghai Province, was taken as the research object. Combined with the geological and hydrological data of the study area, the transient electromagnetic method was used to detect the goaf and draw the goaf profile. Combined with two-dimensional discrete element numerical simulation software, the model was established with the old goaf of Datong Coal Mine in Datong County, Xining City, Qinghai Province, as the research background. The variation law of stress–strain of rock and soil layers was obtained by calculation. On the basis of this numerical simulation, combined with the actual monitoring of the coal mine goaf displacement variation, the deformation of the old goaf in Datong Coal Mine and the influence of the evaluation on the surrounding rock and soil layers were analyzed.
2 Engineering geology background
2.1 Meteorological and hydrological conditions
The key coal mining subsidence area of Datong County was located in the southeastern part of Datong Hui and Tu Autonomous County, Xining City, Qinghai Province, involving seven villages in Qiaotou Town and Liangjiao Township. The study area had village roads and mining area roads. The north national road G227 ran through Qiaotou Town, the county seat where the key coal mining subsidence area was located. The Dameidong Coal Mine was located in the southeast of Datong Hui and Tu Autonomous County, Xining City, Qinghai Province, China. The key research area belonged to plateau continental climate. The mean annual temperature ranged 2.8°C–3.9°C. Temperature difference 25.3°C, average daily temperature difference 13.2°C ∼ 13.8°C, average annual precipitation; between 508.7 and 532.6 mm. Summer and autumn witnessed more southeast wind, and the wind speed was small. Winter and spring witnessed more northwest wind, and the average wind speed was 2 m/s, the maximum wind speed was 17 m/s, and the average frost-free period was of 96.3 days.
2.2 Geological condition
The study area was located in the southern margin of the Xining–Datong Basin, which was composed of eroded and eroded low hills and eroded valley plains. The erosion and denudation hills in the area are mainly composed of Cretaceous, Paleogene mud, sandstone, and Quaternary loess. The altitude was 2,450–2,750 m, the relative height difference was 300 m, the mountain was high and the slope was steep, the ravines were cross, the terrain was undulating, the topography was complex, the vegetation was scarce, and the soil erosion was serious.
In view of the characteristics of underground mined-out area, such as strong concealment, poor regularity of spatial distribution characteristics, and difficult prediction of roof caving and collapse in mined-out area, how to quantitatively evaluate the distribution range, spatial morphological characteristics, and caving condition of the underground mined-out area had always been a key technical problem for engineers to evaluate the potential hazard of the mined-out area and reasonably determine the treatment measures of the mined-out area. At the same time, due to the underground mining of Datong Coal Mine, there were many private small coal mines in the past, which made the underground mining roadways densely distributed. The “cavity” produced by coal mining under the surface of the coal mine formed a large area of goaf, and the coal mining activities continued, causing various geological disasters.
The distribution range of goaf in Dameidong Coal Mine was obtained by a comprehensive analysis of field investigation, survey data provided by different coal mining enterprises, and transient electromagnetic exploration results. The distribution characteristics of the mined-out area were consistent with the distribution characteristics of the ore body. The task of transient electromagnetic exploration was to explore the distribution range and depth of the mined-out area in Dameidong Coal Mine. The obtained geophysical prospecting results showed that the collapse area of the mined-out area in Dameidong Coal Mine was elliptical, with a length of 770 m, a width of 400 m, and an area of 200,036 m2. The length of the roadway in Dameidong Coal Mine was 6,891 m, of which the underground chamber volume of the roadway in Dameidong Coal Mine was about 940.04 × 10⁴ m3. The distribution of the mined-out area in Dameidong Mine was shown in detail in the present situation diagram and prediction diagram.
3 Analysis of geophysical results
The transient electromagnetic method was a method used to detect the resistivity of a medium by using an ungrounded loop or ground line source to emit a primary pulse magnetic field to the ground, and using coil or ground electrode to observe the secondary induced eddy current field caused by an underground medium during the intermittent period of primary pulse magnetic field. It had the advantages of automatically eliminating the main noise source, no terrain influence, combined observation at the same point, best coupling with the detection target, strong abnormal response, simple shape, and strong resolution. Based on the actual situation of the study area, in order to efficiently monitor the status quo of the goaf, this paper intended to use the transient electromagnetic method to arrange geophysical survey lines in the three main coal mine areas. The geophysical survey line set by the large coal mine was E3-E3′. The detailed geophysical layout plan is shown in Figure 1.
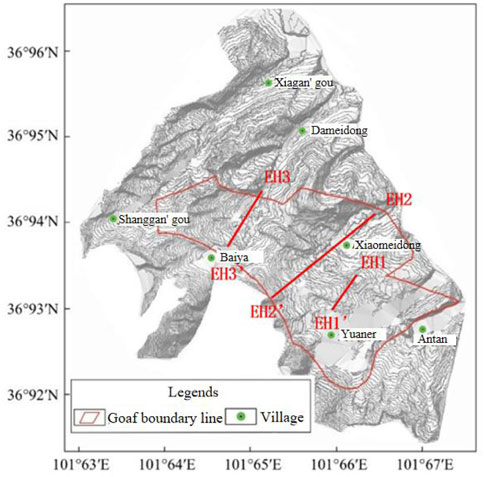
FIGURE 1. Layout plan of geophysical prospecting.
Combined with the original data of resistivity obtained by line detection, the terrain data were added to invert the apparent resistivity model, and the error value was obtained by comparing the forward calculation of the model data with the original data. The data error did not exceed 15%, which was the qualified inversion model. The inversion result is shown in Figure 2. The horizontal axis of the profile was horizontal distance (unit m), and the vertical axis was elevation (unit m). This interpretation work was based on the inversion profile, combined with the geological data and the actual situation to interpret each section.
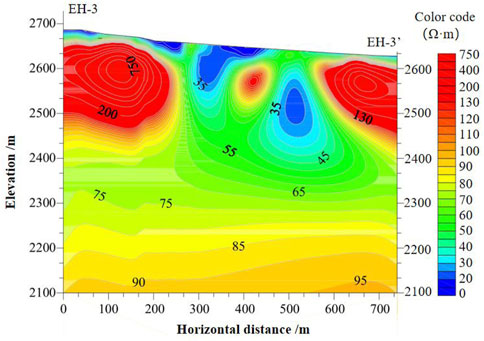
FIGURE 2. Inversion results of the transient electromagnetic method.
Figure 3 shows the predicted goaf map obtained by using the transient electromagnetic method to survey the large coal mine. The terrain range measured between EH-3 and EH-3′ was relatively flat, and the surface layer was mainly loess cover. It could be seen from the aforementioned figure that when the apparent resistance was less than 30 Ωm, it was speculated that it was a water-rich area of coal mine goaf collapse. When the apparent resistance was greater than 30 Ωm and less than 50 Ωm, it was presumed to be a weak water-rich area of coal mine goaf collapse. When the apparent resistance was greater than 50 Ωm, less than 100 Ωm was strongly weathered rock; when the apparent resistance was greater than 100 Ωm, it was a medium-lightly weathered rock layer. The profile of the study area was 27°, and there was a reverse fault between the two excavated coal seams with a dip angle of 60°.
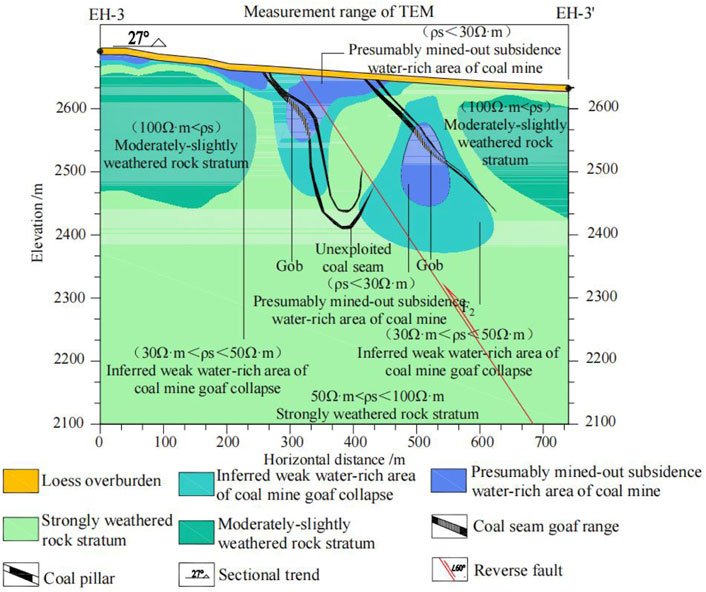
FIGURE 3. Interpretation of the inversion results of the transient electromagnetic method.
Figure 4 shows a cross-sectional view of the mining coal seams M1 and M3 in the Dameidong Coal Mine. The profile of the study area was 27°, where the thickness of the coal seams mined at both locations was 2.4 m. The thinner coal seams next to the two indicate that the coal seam had not been mined. There were two stratigraphic occurrences in the study area. The stratigraphic strike of Permian sandstone and mudstone was 73°, and the dip angle was 51°. The strike of Zhuluo sandstone and mudstone was 43°, and the dip angle was 31°. There was also a reverse fault between the two excavated coal seams with a dip angle of 60°.
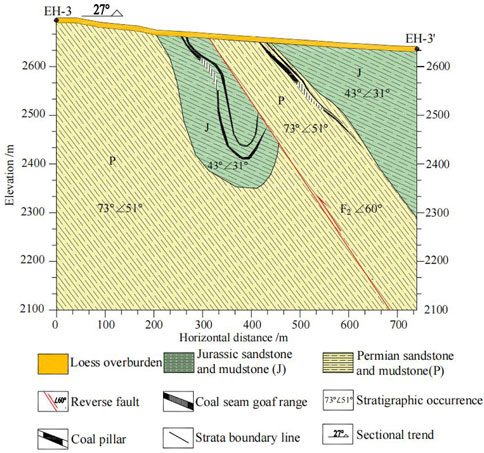
FIGURE 4. Geological profile of the eh3-3 'survey line.
The mechanical properties of each coal seam are detailed in Tables 1, 2.

TABLE 1. Coal seam M1 mining parameters.

TABLE 2. Coal seam M3 mining parameters.
4 Discrete element numerical simulation of goaf overlying strata deformation analysis
With the gradual improvement of computer technology, numerical simulation calculation gradually played an important role in scientific research projects. Numerical simulation calculation and analysis of rock and soil movement in coal seam mining was one of the important means of scientific research. It could reflect the deformation of coal mine excavation strata and showed the dynamic process of damage, which provided a quantitative analysis basis for the subsequent formulation of control schemes and support technology (Hao, et al., 2007; Zhang and Huang, 2010; Che et al., 2022). Discrete element software was widely used in underground engineering research such as coal mining and played an important role in the research of coal mining support and surrounding rock stability control theory. This numerical simulation method regarded the rock mass as a collection of two basic elements of rock and structural planes and continuously judged and updated the contact state of the block during the calculation process. According to these contact states, the load transfer mode between the blocks was judged, and the corresponding mechanical laws were selected for contact. The stress and deformation behavior of these basic elements were defined. By establishing a two-dimensional numerical model, the variation displacement, stress variation law, and surface subsidence of overlying strata after coal seam excavation were calculated and analyzed, which provided a quantitative analysis basis for safe mining on site.
4.1 Model establishment and survey line setting
Due to the complex stratum structure in the study area, in the process of establishing the numerical model, the rock and soil bodied with similar physical and mechanical properties were appropriately simplified, and the coal seams were divided into upper and lower sections, and the upper and lower sections are mined simultaneously.
The model was assumed to be an isotropic continuous homogeneous medium, and the mechanical model was the Mohr–Coulomb elastic-plastic model. The top surface of the model was free surface, the bottom was fixed constraint, and the surrounding was horizontal displacement constraint. The initial stress of the mining area was mainly self-weight stress. The gravity acceleration was set to 9.81 m/s2, and the direction was vertical downward. The physical and mechanical parameters of the rock strata are shown in Table 3.
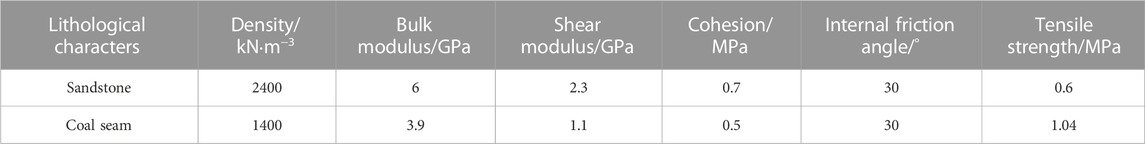
TABLE 3. Physical and mechanical parameters of rock strata.
According to the M-C criterion and Bandis empirical formula method, the theoretical joint shear stiffness and normal stiffness could be calculated. Combined with the field measured data and the joint contact embedding degree in the two-dimensional discrete element numerical simulation software, the joint normal stiffness of this model was set to 2.5 Gpa, and the joint shear stiffness was set to 5 Gpa. Detailed joint material parameters are shown in Table 4.

TABLE 4. Rock joint parameters.
For the constitutive model, the elastoplastic model was used in the modeling, and the block obeyed cons = 2 in the discrete element software; the joint constitutive model obeyed jcons = 3.
When establishing the model, we first used the round command to set the block fillet d = 0.1. We needed to set a reasonable calculation area according to the Saint–Venant principle. The size of the established geometric model should be based on the regional length of the excavated coal seam. On this basis, the side length was extended by 30%–50%. Therefore, a numerical simulation model was established according to the geological survey data of Datong Coal Mine in Xining City, Qinghai Province. After properly simplifying its area, the left excavation boundary was 50 m away from the established geometric model boundary, and the right excavation coal seam area was 200 m away from the established geometric model boundary. In this design, Block command was used to establish a 670 m long, 270 m high on one side, and 220 m high trapezoidal block on the other side as the research and calculation area. Arc command was used to divide each joint layer in the coal seam of Dameidong Coal Mine, so as to facilitate the dynamic simulation of excavation in this area. The loading method in UDEC software was used to simulate the actual stress of the overlying strata in the excavation process of the numerical model. A total of 15 layers of coal mine rock strata were simulated and divided by the excavation model. The rock mass in this area was divided into two large blocks, one part of the rock mass joint inclination angle was 51°, and the other part of the rock mass joint inclination angle was 31°.
When the geometric model of the computational domain was established, the block boundary conditions must be defined and consistent with the boundary conditions of the actual engineering situation, otherwise the calculated data would be inaccurate. Here, the vertical stress was the self-weight stress of the rock mass. According to the density of the rock mass and the excavation depth of the coal seam, the vertical stress of the numerical model was calculated. The calculated vertical stress was −9.09201 Mpa. In the two-dimensional discrete software, the compressive stress was negative, the tensile stress was positive, and the lateral stress was calculated according to the Poisson effect. The lateral stress was −4.5886 Mpa. Numerical simulation of unexcavated coal seam is shown in Figure 5.
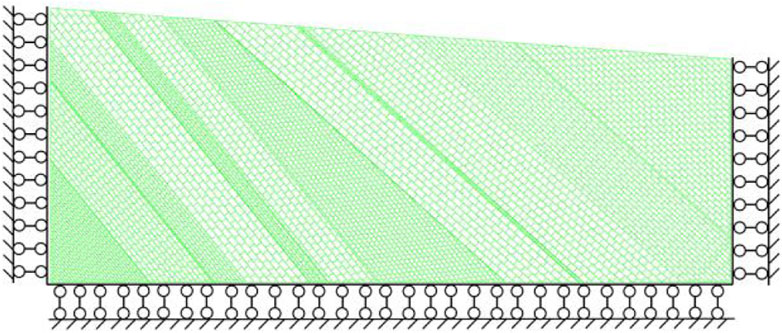
FIGURE 5. Schematic diagram of thee numerical model.
4.2 Analysis of numerical calculation results
Based on the Dameidong mining area of Datong Coal Mine in Xining City, Qinghai Province, as the main research area, combined with the field research survey data and the measured data, the geometric calculation model was constructed. The excavation area was divided into single excavation of inclined coal seam M1 and simultaneous excavation of inclined coal seam M1 and gently inclined coal seam M3. In this section, the displacement variation law and stress variation law of rock and soil layers after coal seam excavation were analyzed by the results obtained by simulation calculation.
First, the numerical calculation of single-layer excavation of coal seam M1 was carried out. When the geometric numerical model under the action of the original rock stress in this working condition was iteratively calculated to achieve balance, we used the delete range reg command to delete the rock and soil blocks that need to be excavated in the model. First, find out the four node coordinates of the excavation area, enter them clockwise, and then delete the blocks in the area to simulate the dynamic excavation work. After excavation, the number of iteration steps was superimposed by 10,000 steps to reach the balance. Different commands were input to output the corresponding graphics, and the coal seam M1 after excavation was explained and analyzed according to the obtained graphics.
Second, the numerical calculation of simultaneous excavation of coal seams M1 and M3 was carried out. When the geometric numerical model under the action of in situ rock stress was iteratively calculated to achieve balance, the goafs in coal seams M1 and M3 were deleted clockwise to simulate the dynamic excavation work. After the iteration steps were superimposed for 10,000 steps, the balance was achieved. Different commands were input to output the corresponding graphics, and the coal seams M1 and M3 after excavation were explained and analyzed according to the obtained graphics.
4.2.1 Coal seam M1 excavation stress field analysis
The stress cloud diagram was mainly used to observe the stress distribution of the rock mass in the working condition, which had more intuitive advantages than the contour map.
Figure 6 shows the distribution of stress after coal seam M1 mining. Among them, Figure 6A illustrates the distribution of horizontal stress after M1 coal seam mining reaches equilibrium under the initial state condition. The horizontal stress cloud map after excavation took 1 Mpa as the equivalent interval of stress size, with a minimum of 0Mpa and a maximum of −6 Mpa. The negative value was expressed as compressive stress, and the stress range of most areas in the horizontal stress cloud map was 1–2 Mpa. The stress state gradually decreases with the increase of elevation, and the bottom stress was larger. As shown in the figure, there were stress concentration areas at the front and back ends of the coal mine goaf, and the horizontal stress was distributed in the range of 2–4 Mpa. The goaf area of the coal mine rock and soil layers was also due to coal seam excavation. The stress release of the goaf area was reduced from the original equilibrium stress of 1–2 Mpa–0–1 Mpa. It could be seen in the horizontal stress cloud map after this excavation that when the excavated coal seam was again calculated to reach the stress balance, a caving zone would be formed above the goaf, and the stress range of the caving zone was distributed in 0–2 Mpa.
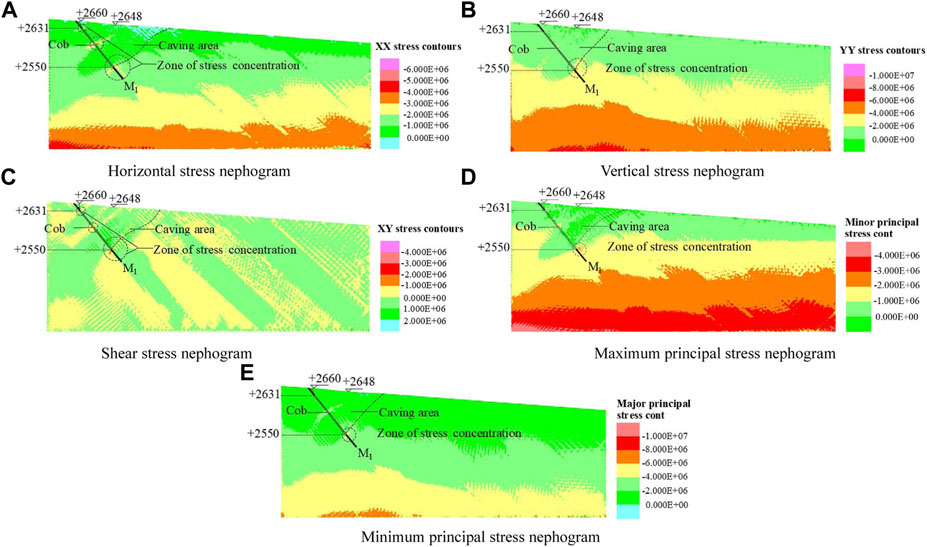
FIGURE 6. Stress distribution of coal seam M1 after mining. (A) Horizontal stress nephogram, (B) vertical stress nephogram, (C) shear stress nephogram, (D) maximum principal stress nephogram, and (E) minimum principal stress nephogram.
Figure 6B illustrates the distribution of vertical stress of coal seam M1 rock mass under the initial excavation condition. Under the action of self-weight stress, the vertical stress layers were evenly distributed. The vertical stress state decreased gradually with the increase of coal seam elevation, and the bottom stress was larger. After the excavation of the coal seam, the balance of the original rock stress was destroyed, and the stress field was redistributed. As shown in the diagram, the vertical stress cloud map took 2 Mpa as the equivalent interval, the minimum was 0 Mpa, the maximum was −8 Mpa (expressed as compressive stress), and the large area was 0–2 Mpa. The vertical stress at the bottom of the coal seam mining area was larger, and the stress at the upper roof of the coal seam goaf was smaller. The stress in the mined-out area of coal seam M1 was also released due to the excavation of coal seam, and the vertical stress in the mined-out area was reduced from the original equilibrium stress 2–4 Mpa to 0–2 Mpa. There were stress concentration areas at the front and back ends of the coal mine goaf, and the stress concentration areas were distributed in the range of 4–8 Mpa.
Figure 6C shows the distribution of shear stress after the mining of coal seam M1 reached equilibrium under the initial excavation condition. It could be seen from the figure that the shear stress of the rock strata near the mining area of coal mine rock and soil layers had positive and negative values. The positive value of shear stress indicated that it was consistent with the direction of movement along the inclined layer. When the excavated coal seam was recalculated to reach the stress balance, a caving area would be formed above the goaf, and the shear stress of the subsidence area reached 0–2 Mpa. As shown in the figure, in the front and back ends of the coal mine goaf were stress concentration areas, and the shear stress was negative, distributed in 1–3 Mpa.
Figures 6D, E show the distribution of the maximum principal stress and the minimum principal stress after the balanced mining of inclined coal seam M1. From the diagram, it could be seen that the distribution of the maximum principal stress and the minimum principal stress appears stress stratification. The stress size gradually decreased with the increase of the elevation of the coal mine area, and the bottom layer stress was larger, which was consistent with the abovementioned stress cloud diagram in all directions. The maximum principal stress cloud diagram took 1 Mpa as the equivalent interval, the minimum was 0 Mpa, the maximum was −4 Mpa, and the large area of the caving zone was 0–1 Mpa; the minimum principal stress cloud map took 2 Mpa as the equivalent interval, the minimum was 0 Mpa, the maximum was −10 Mpa, and the large area of the collapse area was within the area of 0–4 Mpa. From the diagram, it could be seen that there was a more obvious stress concentration area at the lower end of the excavation area in the maximum principal stress cloud diagram and the minimum principal stress cloud diagram, and the stress concentration area at the upper end of the goaf was not obvious.
4.2.2 Coal seam M1 excavation displacement field analysis
After the coal seam was mined out, the original stress balance state around the goaf was destroyed, causing the redistribution of stress, which caused the deformation, damage, and movement of the rock layer and develops from the bottom up to the surface causing the surface movement (Hao, et al., 2007; Chen and Zhao, 2014; Gui and Fan, 2014; Li and Wan, 2017). The deformation shape and movement angle of overlying strata in goaf could be observed intuitively by the displacement cloud diagram obtained by numerical simulation. In this section, the horizontal displacement, vertical displacement, and combined displacement of overlying strata in the mining area after coal seam mining were comprehensively analyzed and studied.
Figure 7 shows the displacement cloud map of coal seam M1 after mining. From the diagram, it could be seen that after the coal seam M1 excavation reaches equilibrium, the whole calculation model tended to be balanced and stable, and the roof and floor of the coal seam excavation were connected to reach the final rock deformation form.
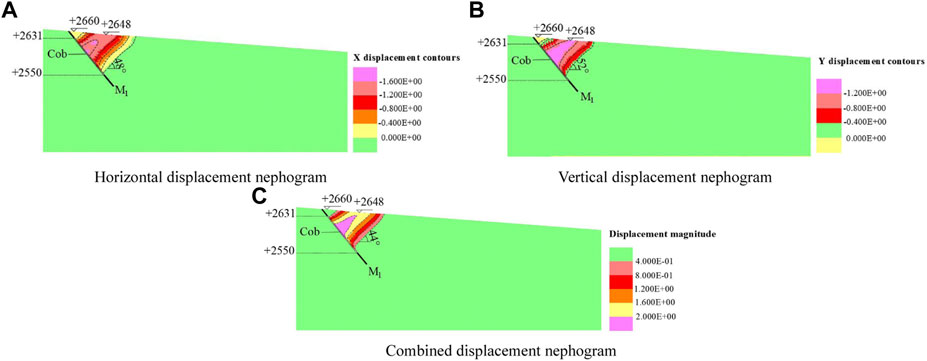
FIGURE 7. Coal seam M1 displacement cloud after mining. (A) Horizontal displacement nephogram, (B) vertical displacement nephogram, and (C) combined displacement nephogram.
Figure 7Ashows the change of horizontal displacement of overlying strata after the excavation of coal seam M1 rock mass reached stability. As shown in the figure, the maximum horizontal displacement appears at the middle roof of the coal seam M1 mining area, and the maximum displacement was 1.6 m. The rock layer in the excavation area appears obvious bending and collapse.
Figure 7B shows the change of vertical displacement of overlying strata after the mining of coal seam M1 rock mass reached stability. As shown in the figure, the deformation of rock strata in coal seam M1 has reached the surface, and the deformation of overlying strata in goaf was concentrated in the main collapse area. The vertical displacement deformation after excavation was layered, and the displacement variation decreases with the increase of the range. The horizontal displacement at the middle roof of the M1 mining area of the coal seam had the maximum vertical displacement value, and the maximum displacement was 1.2 m.
Figure 7C shows the change of the combined displacement of the overlying strata after the excavation of the coal seam M1 rock mass reached stability. The combined displacement was the result of the calculation of the horizontal displacement and the vertical displacement according to the root number of the Pythagorean Theorem. The combined settlement values in this figure were positive. The change of the combined displacement was roughly the same as that of horizontal displacement and vertical displacement. The combined displacement deformation after excavation was layered, and the displacement change of the roof in coal mine goaf was the largest. The combined displacement value in the large deformation area reached 0.4–2 m, and the displacement change was layered. The displacement change gradually decreased with the increase of range.
In order to analyze the specific subsidence displacement and verify the reliability of the numerical simulation results, we set up five monitoring lines parallel to the surface in the overlying strata of the mining area of coal seam M1, which were M1-1, M1-2, M1-3, M1-4, and M1-5, and each monitoring line was set up with 14 monitoring points. The figure showed monitoring points 1, 3, 5, 7, 9, 11, and 13. The spacing of the measuring points was roughly equal to 15 m, and the spacing of each monitoring line was 10 m. The layout of each monitoring line is shown in Figure 8.
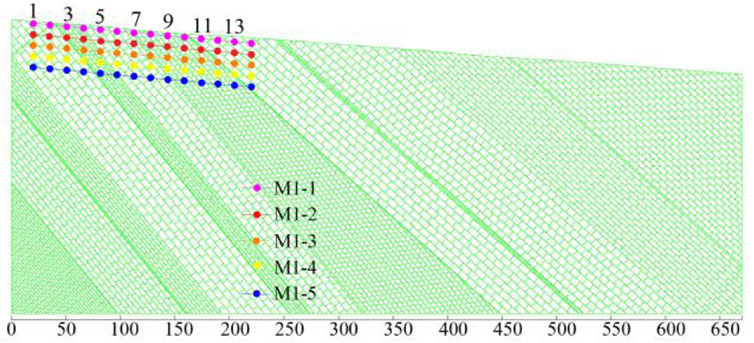
FIGURE 8. Layout of each monitoring line.
Figure 9A shows a combination of horizontal displacement curves. The abscissa in the figure represents the horizontal distance of the measuring point in the length direction of the numerical model, and the ordinate represents the horizontal displacement monitoring value of the measuring point. According to the change rule of the monitoring line in the figure, it was easy to know that the horizontal displacement change value of monitoring line M1-5 was the largest, and the maximum deformation displacement of the line was 1.8 m. The variation of monitoring line M1-1 was small. The monitoring line was the closest to the surface, and the maximum deformation displacement was 1.5 m. It could be seen from the figure that the horizontal displacement curve combination diagram drawn according to the data of the five monitoring lines showed a “U” -shaped symmetrical distribution change rule. The horizontal displacement deformation of the main subsidence area of the rock stratum within the horizontal distance of 75–180 m was large, and the displacement was roughly in the range of 0.3–1.8 m. On both sides of the large deformation area, the horizontal displacement deformation of the rock stratum was relatively small, and the displacement was roughly in the range of 0.0–0.1 m.
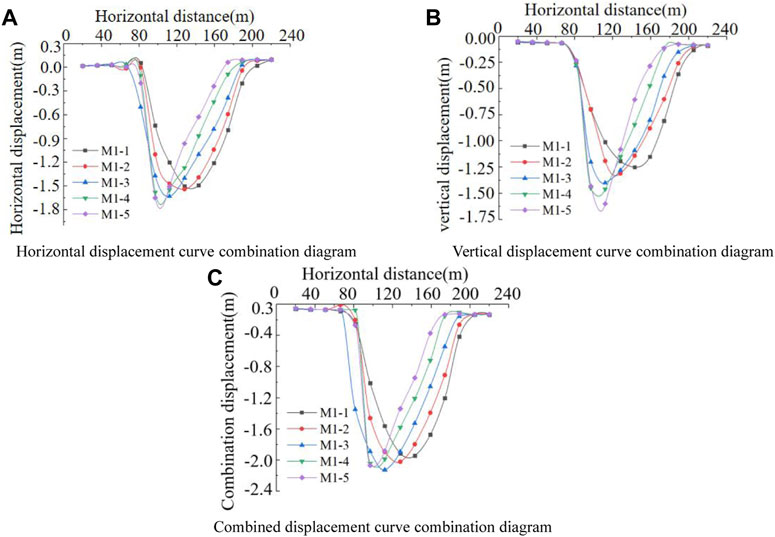
FIGURE 9. Sinking displacement curve. (A) Horizontal displacement curve combination diagram, (B) vertical displacement curve combination diagram, and (C) combined displacement curve combination diagram.
Figure 9B shows a combination of vertical displacement curves. The abscissa in the figure represents the horizontal distance of the measuring point in the length direction of the numerical model, and the ordinate represents the vertical displacement monitoring value of the measuring point. According to the change rule of the monitoring line in the diagram, it was easy to know that the vertical displacement change value of monitoring line M1-5 was the largest, and the maximum vertical deformation displacement of the monitoring line was about 1.65 m. Because the M1-1 monitoring line was closest to the surface, the deformation of the monitoring line was small, and the maximum deformation displacement was 1.25 m. It could be seen from the figure that the vertical displacement curve combination diagram drawn according to the data of the five monitoring lines showed a “U”-shaped symmetrical distribution change rule. The vertical displacement deformation of the main subsidence area of the rock stratum within the horizontal distance of 80–180 m was large, and the displacement was roughly in the range of 0.25–1.65 m. On both sides outside the large deformation area, the vertical displacement deformation of the rock stratum was small, and the displacement was roughly in the range of 0.0–0.1 m.
Figure 9C shows a combination of displacement change curves. Because the combined displacement was the result of the horizontal displacement and the vertical displacement according to the root number of the Pythagorean Theorem, the combined displacement should be positive. However, in order to compare the three types of curved more intuitively and clearly; the positive values were changed to negative values. The abscissa in the figure represents the horizontal distance of the measuring point in the length direction of the numerical model, and the ordinate represents the vertical displacement monitoring value of the measuring point. Similar to the change rule of the aforementioned two monitoring lines, the change value of combined displacement of monitoring line M1-5 was the largest, and the maximum displacement of combined deformation of this line was about 2.1 m because M1-1 monitoring line was the closest to the surface, the deformation of monitoring line was small, and the maximum displacement was 1.9 m. It could be seen from the figure that the combined displacement curve combination diagram drawn according to the data of the five monitoring lines showed a “U”-shaped symmetrical distribution change rule. The combined displacement deformation of the main subsidence area of the rock stratum within the horizontal distance of 80–180 m was large, and the displacement was roughly in the range of 0.3–2.1 m. On both sides of the large deformation area, the combined displacement deformation of the rock stratum was relatively small, and the displacement was roughly in the range of 0.0–0.1 m.
The law of the three displacement monitoring maps was consistent with the law of the horizontal displacement cloud analysis, showing a “U” distribution. Under different depths of rock strata, the closer to the coal seam mining area, the greater the change of horizontal displacement, and the farther away from the main subsidence area, the smaller the change of horizontal displacement of overlying strata. It was proved that the numerical simulation results do have theoretical guidance for mining subsidence control.
4.2.3 Stress field analysis of simultaneous excavation of coal seam M1 and M3
Figure 10 shows the stress distribution of coal seams M1 and M3 after simultaneous mining. Among them, Figure 10A shows the distribution of horizontal stress after the balance of coal seams M1 and M3 mining. The horizontal stress cloud map after excavation takes 1 Mpa as the equivalent interval, the minimum was 0 Mpa, the maximum was −6 Mpa (expressed as compressive stress), and the large area in the horizontal stress cloud map was 0–2 Mpa. The stress state gradually decreased with the increase of height, and the bottom stress was larger. As shown in the figure, there were stress concentration areas at the front and back ends of the coal mine goaf, and the horizontal stress was distributed in the range of 3–4 Mpa. The goaf area of the coal mine rock and soil layers was also due to coal seam excavation. The stress release of the goaf area was reduced from the original equilibrium stress of 1–2 Mpa to 0–1 Mpa. It could be seen in the horizontal stress cloud map after this excavation that when the excavated coal seam was again calculated to reach the stress balance, a caving zone would be formed above the goaf, and the stress distribution of the caving zone was 0–2 Mpa.
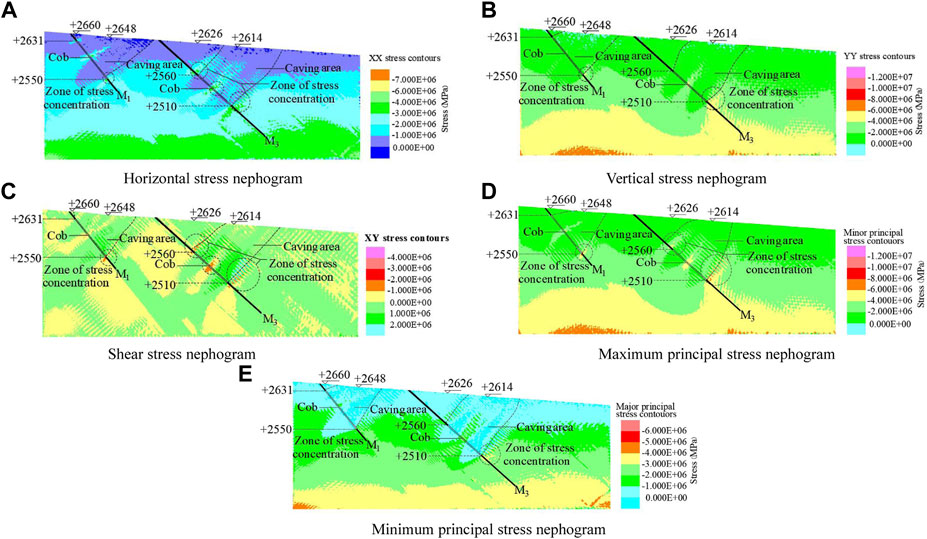
FIGURE 10. Stress cloud diagram of coal seams M1 and M3 after simultaneous mining. (A) Horizontal stress nephogram, (B) vertical stress nephogram, (C) shear stress nephogram, (D) maximum principal stress nephogram, and (E) minimum principal stress nephogram.
Figure 10B shows the distribution of vertical stress of coal seams M1 and M3 rock masses. Under the action of self-weight stress, the vertical stress was evenly distributed in layers. The vertical stress state decreased with the increase of height, and the bottom stress was larger. After the excavation of the coal seam, the balance of the original rock stress was destroyed, and the stress field was redistributed. As shown in the diagram, the vertical stress cloud map took 2 Mpa as the equivalent interval, the minimum was 0 Mpa, the maximum was −6 Mpa (expressed as compressive stress), and the large area was 0–2 Mpa. The vertical stress at the bottom of the coal seam mining area was larger, and the stress at the upper roof of the coal seam goaf was smaller. The vertical stress of mining area was reduced from 2–4 Mpa to 0–2 Mpa. There were stress concentration areas at the front and back ends of the coal mine goaf, and the stress concentration areas were distributed in the range of 6–8 Mpa.
Figure 10C shows the distribution of shear stress after the balance of coal seams M1 and M3 mining. From the diagram, it could be seen that the shear stress cloud map took 1 Mpa as the equivalent interval. When the excavated coal seam reached the stress balance again, the caving zone would be formed above the goaf. The large area of shear stress in the subsidence area was positive, reaching 0–2 Mpa. As shown in the front and back of the coal mine goaf have appeared stress concentration area, and the shear stress was negative, distributed in 1–2 Mpa.
Figures 10D, E show the distribution of the maximum principal stress and the minimum principal stress after the mining of coal seams M1 and M3 rock masses reached equilibrium. It could be seen from the figure that the distribution of the maximum principal stress and the minimum principal stress appeared stress stratification. The stress state gradually decreased with the increase of height, and the stress at the bottom layer was larger. The minimum is 0 Mpa, the maximum was −8 Mpa, and the large area of the caving area was 0–2 Mpa. The minimum principal stress cloud map took 1 Mpa as the equivalent interval, the minimum was 0 Mpa, the maximum was −5 Mpa (expressed as compressive stress), and the large area of the caving zone was within the range of 0–1 Mpa. It could be seen from the diagram that there was a more obvious stress concentration area at the lower end of the excavation area in the maximum principal stress cloud diagram and the minimum principal stress cloud diagram, and the stress concentration area at the upper end was not obvious.
4.2.4 Displacement field analysis of simultaneous excavation of coal seams M1 and M3
After the coal seam was mined, the original stress equilibrium state around the mined-out area was destroyed, which caused the redistribution of stress and the deformation, failure, and movement of rock strata. The deformation shape and movement angle of overlying strata in goaf could be observed intuitively by the displacement cloud diagram obtained by numerical simulation. In this section, the horizontal displacement, vertical displacement, and combined displacement of overlying strata in mining area after coal seam mining were comprehensively analyzed and studied.
Figure 11A shows the change of horizontal displacement of overlying strata after the simultaneous excavation of coal seams M1 and M3 reached stability. As shown in the figure, the horizontal displacement at the middle roof of the coal seam M3 mining area had a maximum value, and the maximum displacement was 1.2 m. The horizontal displacement of the rock strata in the goaf of the coal mine was inclined and layered. The horizontal displacement of the deformation area was relatively large. The displacement of the main subsidence area was the largest, and the range of large deformation area was 0–1.6 m.
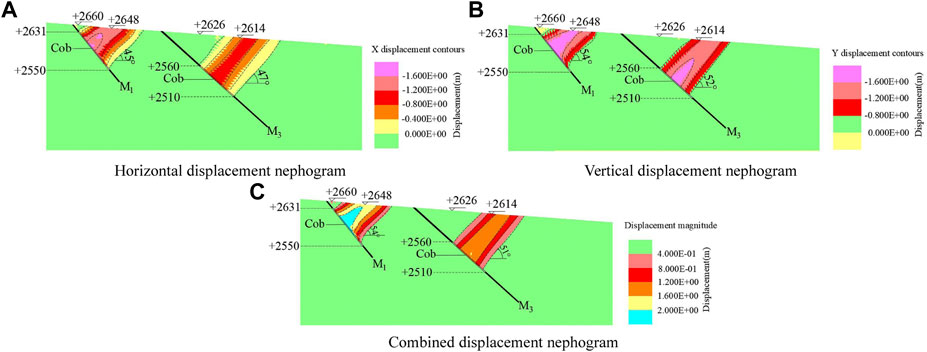
FIGURE 11. Coal seams M1 and M3 displacement cloud after mining. (A) Horizontal displacement nephogram, (B) vertical displacement nephogram, and (C) combined displacement nephogram.
Figure 11B shows the change of the vertical displacement of the overlying strata after the simultaneous mining of coal seams M1 and M3. As shown in the figure, the deformation of the rock strata of coal seam M3 had reached the surface, and the deformation of the overlying strata in the goaf was concentrated in the main collapse area. The vertical displacement deformation after excavation was layered, and the displacement variation gradually decreases with the increase of the range. The horizontal displacement at the middle roof of the M3 mining area of the coal seam had the maximum vertical displacement value, and the maximum displacement was 1.6 m; the displacement of the main subsidence area was the largest, the range of large deformation area was 0–1.6 m, and the inclination angle of large deformation area was 52°.
Figure 11C shows the change of the combined displacement of the overlying strata after the simultaneous excavation of coal seams M1 and M3 reached stability. The combined settlement values in this figure were positive. The change of combined displacement was roughly the same as that of horizontal displacement and vertical displacement. The combined displacement deformation after excavation was distributed in layers. The displacement variation of the roof in the coal mine goaf was the largest. The combined displacement value of the large deformation area reached 0.4–1.6 m, and the displacement variation was distributed in layers. The displacement variation decreases with the increase of range, and the inclination angle of large deformation area was 51°.
Figure 12 shows a schematic diagram of the fracture angle and boundary angle after coal mining. After the excavation of the coal seam was balanced, there would be obvious cracks in the rock and soil layers, and the deformation of the rock strata in the upper roof of the mining area was more obvious. Under the condition of full mining or close to full mining, the angle formed by the boundary crack and the horizontal line on the side of the coal pillar was considered to be the crack angle after the balance of coal seam mining. It could be seen from the figure that the crack angle of M1 was 114°, and the crack angle of the downhill was 45°. M3 had an uphill crack angle of 129° and a downhill crack angle of 52°. In the general subsidence area, in fact, we believed that when the rock movement reached a certain value, the small movement of the overlying strata was ignored, that is, the overlying strata are not moving. According to the definition of relevant specifications, under the condition of full mining or near full mining, the measured subsidence curve on the main section of the surface movement basin was used, and the point with a subsidence value of 10 mm was used as the boundary point. The angle between the line connecting the boundary point to the goaf boundary and the horizontal line on the side of the coal pillar was called the boundary angle. It could be seen from the figure that the uphill boundary angle of the overlying strata movement after the excavation of coal seam M1 was 92°, and the downhill boundary angle was 40°. After the excavation of coal seam M3, the uphill boundary angle was 125°, and the downhill boundary angle was 50°. See Table 5 for details.
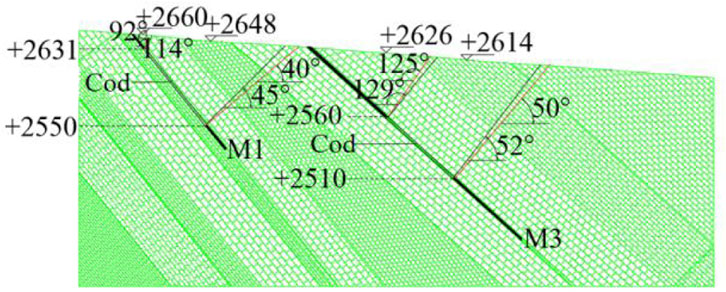
FIGURE 12. Fracture angle and boundary angle diagram.

TABLE 5. Prediction of the fracture angle and boundary angle under sufficient conditions (unit: °).
The cloud map of the displacement change indicates the final overall displacement of the balance after the excavation of coal seam M3. Because the change trend of the rock strata in different strata after the excavation of coal seam M3 was different, the situation of the subsidence of the rock strata was also different. In order to analyze the specific subsidence displacement and the law of the subsidence of the rock strata after the excavation of the coal seam more clearly and intuitively, we set up five monitoring lines parallel to the surface in the overlying strata of the mining area of coal seam M3, which were M3-1, M3-2, M3-3, M3-4, and M3-5, and each monitoring line had 14 monitoring points. The horizontal range of coal seam M3 was 300–520 M, and the distance between measuring points was 16 m. The distance between M3-1 and M3-2, M3-3 and M3-4 was 20 m, and the distance between M3-2 and M3-3, M3-4 and M3-5 was 10 m. The layout of each monitoring line is shown in Figure 13.
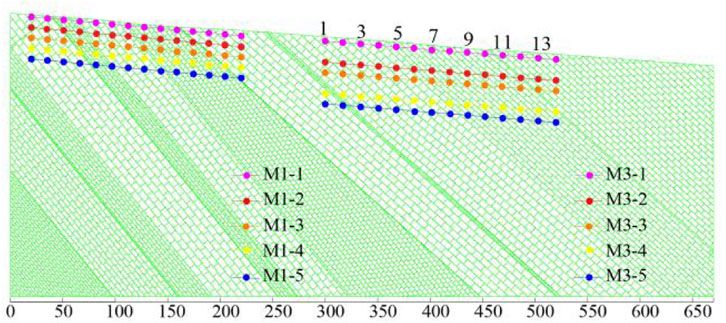
FIGURE 13. Layout of each monitoring line.
Figure 14 shows a combination of displacement curves after simultaneous excavation of coal seams. Figure 14A shows a combination of horizontal displacement curves, which as obtained by comparing five monitoring lines in the same coordinate system. According to the change rule of the monitoring line in the diagram, it was easy to know that the horizontal displacement change value of monitoring line M3-5 was the largest, and the maximum deformation displacement of the monitoring line was 1.0 m. The change of monitoring line M3-1 was small, the monitoring line is closest to the surface, and the maximum deformation displacement was 0.8 m. It could be seen from the figure that the horizontal displacement curve combination diagram drawn according to the data of the five monitoring lines showed a “U”-shaped symmetrical distribution change rule. The horizontal displacement deformation of the main subsidence area of the rock stratum within the horizontal distance of 320–480 m was large, and the displacement was roughly in the range of 0.2–1.0 m. On both sides of the large deformation area, the horizontal displacement deformation of the rock stratum was relatively small, and the displacement was roughly in the range of 0.0–0.1 m.
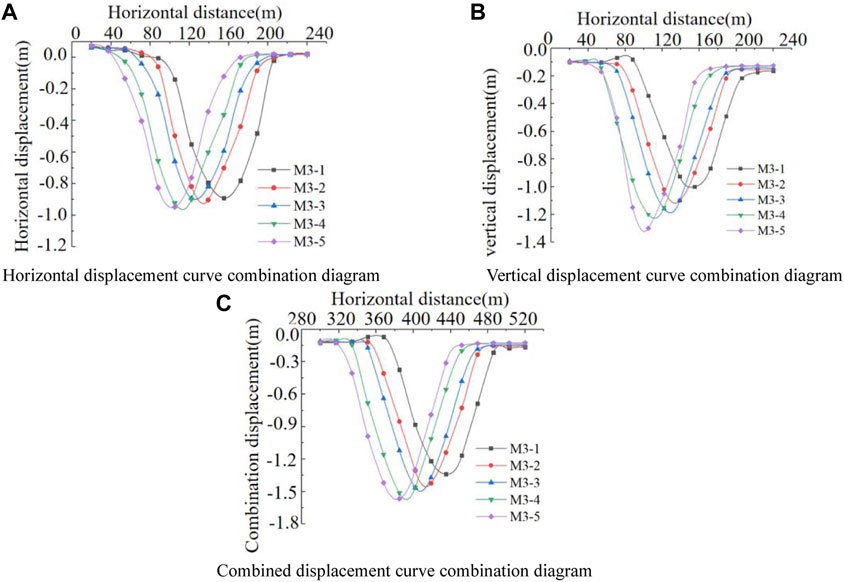
FIGURE 14. Sinking displacement curve. (A) Horizontal displacement curve combination diagram, (B) vertical displacement curve combination diagram, and (C) combined displacement curve combination diagram.
Figure 14B shows a combination of vertical displacement curves, which was obtained by comparing five monitoring lines in the same coordinate system. According to the change rule of the monitoring line in the diagram, it was easy to know that the vertical displacement change value of monitoring lines M3–5 was the largest, and the maximum vertical deformation displacement of the monitoring line was about 1.3 m. Because the M3-1 monitoring line was the closest to the ground, the deformation of the monitoring line was small, and the maximum displacement was 1.0 m. It could be seen from the figure that the vertical displacement deformation of the main subsidence area of the rock stratum within the horizontal distance of 320–480 m was relatively large, and the displacement was roughly in the range of 0.2–1.3 m. On both sides of the large deformation area, the vertical displacement deformation of the rock stratum was relatively small, and the displacement was roughly in the range of 0–0.1 m.
Figure 14C shows the combined displacement curve combination diagram. Similar to the change rule of the aforementioned two monitoring lines, the change value of combined displacement of monitoring line M3-5 was the largest, and the maximum displacement of combined deformation of this line was about 1.6 m because the M3-1 monitoring line was the closest to the surface, the deformation of monitoring line was small, and the maximum displacement was 1.38 m. It could be seen from the figure that the combined displacement curve combination diagram drawn according to the data of the five monitoring lines showed a “U”-shaped symmetrical distribution change rule. The combined displacement deformation of the main subsidence area of the rock stratum in the horizontal distance of 320–480 m was large, and the displacement was roughly in the range of 0.3–1.5 m. On both sides of the large deformation area, the combined displacement deformation of the rock stratum was relatively small, and the displacement was roughly in the range of 0.0–0.1 m.
The analysis showed that the stress concentration area and the displacement change area were highly coincident, and the displacement monitoring map was consistent with the horizontal displacement cloud analysis, showing a “U”-type distribution. Under different rock depths, the closer to the coal seam mining area, the greater the displacement change, the farther away from the main subsidence area, the smaller the overburden displacement change. It was proved that the numerical simulation results do have theoretical guidance for mining subsidence control.
5 Conclusion
According to the special geological conditions, mining conditions, and abundant measured data in the Dameidong mining area, the research idea of “transient electromagnetic detection-numerical simulation” was put forward, that is, using transient electromagnetic to detect the range of coal mine goaf, and combined with numerical simulation to study the settlement law of rock strata and to explore its role in the prevention and control of geological disasters.
1 The transient electromagnetic method was used to explore the hydrogeological conditions of the coal mine site in the study area. According to the geophysical prospecting results, when the apparent resistance was less than 30 Ωm, it was presumed to be the coal mine water-rich area; when the apparent resistance was greater than 30 Ωm and less than 50 Ωm, it was speculated that it was a weak water-rich area of coal mine, which was highly coincident with the mining area of large coal tunnel mining area and can be used as the basic basis for numerical simulation.
2 The numerical simulation results showed that the stress state diagram was layered after coal seam excavation. The stress in the middle roof of the mined-out area was large, and the caving zone would be formed above the mined-out area. The stress concentration area would appear in the front or back of the mined-out area, resulting in the stress release in the mined-out area, and the original equilibrium stress would decrease.
3 Combining the displacement curve drawn by the measured data of the monitoring line with the displacement change law obtained by numerical simulation, it was concluded that the displacement change of the overlying strata in the coal mine goaf was mostly in the 'U′ shape distribution. The displacement on the same horizontal plane increases first and then decreases, and the final deformation not adversely affected the surrounding buildings.
4 Through the combination of transient electromagnetic and numerical simulation, the analysis of the deformation of overlying strata in the old goaf of large coal roadway provided guidance for the prevention of geological disasters in mining area. Finally, it was speculated that the settlement deformation of the overlying strata in the improved coal mine goaf did not cause damage to buildings and residents in Datong County and nearby towns.
Data availability statement
The original contributions presented in the study are included in the article/supplementary material; further inquiries can be directed to the corresponding author.
Author contributions
MZ was responsible for the writing of the manuscript. Z-XW was responsible for electromagnetic exploration and numerical simulation. F-HX, J-HD, and Y-DD were responsible for analyzing the data obtained from electromagnetic exploration and numerical simulation.
Conflict of interest
The authors declare that the research was conducted in the absence of any commercial or financial relationships that could be construed as a potential conflict of interest.
Publisher’s note
All claims expressed in this article are solely those of the authors and do not necessarily represent those of their affiliated organizations, or those of the publisher, the editors, and the reviewers. Any product that may be evaluated in this article, or claim that may be made by its manufacturer, is not guaranteed or endorsed by the publisher.
References
Che, T., Gong, H., and Bo, J. (2022). Numerical simulation analysis of bedding slope stability of bridge foundation based on UDEC [ J ]. Sichuan Archit. 42 (01), 142–145.
Chen, G., and Zhao, F. Numerical simulation and analysis of the movement law of rock strata and surface based on UDEC[J]. Coal Econ. Inn. Mong 2014,18(09): 183–184. + 186.
Chen, H., Li, Y., and Zhao, P. (2016). Research on fracture control model of partially filled shallow coal seam based on UDEC simulation[J]. Shaanxi Coal 35 (01), 7–10. + 13.
Gao, B., Gao, J., and Yuan, D. (2013). Simulation and analysis of overburden fracture with large mining height based on UDEC[J]. J. Hunan Univ. Sci. Technol. Sci. Ed. 28 (02), 1–6.
Guan, K., Dong, T., and Jia, J. (2012). UDEC-based analysis of the coupling effect of topsoil and main key strata on surface subsidence in shallow coal seams[J]. Coal mine Saf. 43 (03), 161–163.
Gui, Q., and Fan, S. (2014). Numerical simulation of shallow coal seam in mountainous area based on UDEC[J]. Mod. coal mine 31 (01), 80–82.
Guo, C., Li, Y., and Liu, J. (2010). Application of UDEC in numerical simulation of mining subsidence in steeply inclined and extra-thick coal seams[J]. China Min. Ind. 19 (04), 71–74.
Hao, Z., Lin, B., and Zhang, J. (2007). Numerical simulation and analysis of overlying strata movement law in protective layer mining based on UDEC[J]. China Min. Ind. 16 (07), 81–84.
Li, E., and Wan, X. (2017). Numerical simulation of mine pressure behavior in stope based on UDEC[J]. Industrial Saf. Environ. Prot. 43 (11), 18–20. + 48.
Li, L. (2016). Research on the movement law of overlying strata during excavation based on UDEC[J]. Coal Chem. Industry 39 (10), 46–47. + 50.
Liang, Y. (2020). UDEC numerical simulation of shallow coal seam working face[J. ]. Shanxi Coal 40 (01), 9–12. + 34.
Liiu, Y. (2017). Numerical simulation of close-distance upper protective layer mining based on UDEC[J]. Energy Environ. Prot. 39 (09), 179–182. + 187.
Liu, Y., Guangjie, L., and Ma, X. (2010). Genesis analysis and risk prediction of ground fissures in Jingyu County, Jilin Province [J]. Chin. J. Geol. Hazards Prev. 21 (1), 136–139.
Pei, X. J., Zhang, S., Huang, R. Q., Wei, K. H., Liu, F. Z., and Duan, Y. X. (2016). Deformation propagation and identification of an impending disaster of a retained high embankment based on monitoring of minor deformation, China. Landslides Eng. Slopes Exp. 3, 1583–1590.
Qiang, Y., Wang, X., and Duan, R. (2021). Application of transient electromagnetic method in the exploration of Hancheng mining area[J]. Shanxi Geol. 39 (02), 89–95.
Sun, C., Liang, C., and Lu, R. (2021). Feasibility analysis of numerical simulation of high density electrical method applied to the detection of underground water goaf in coal mine[J]. West. Prospect. Proj. 33 (03), 148–151.
Wang, H. (2009). Study on the detection method of coal mine Goa. J. Taiyuan Technol. (05), 58–59. + 62.
Wang, J., and Liu, X. (2013). Application of high density electrical method in Zhuangzihe coal mine goaf detection. J. Shanxi coal 33 (10), 63–64. + 67.
Xia, Y., Lei, T., and Bai, H. (2006). Interaction between overlying strata of coal seam and underground water in mining damage[J]. Coal Geol. Explor. 34 (01), 41–45.
Yang, Z., and Guo, K. (2020). Application of high-density electrical method in the detection of concealed goaf in iron mines[J]. China Min. Ind. 29 (08), 158–164.
Yin, W. (2022). Magnetotelluric method for detection and prediction of karst collapse area in mining area[J]. West. Explor. Eng. 34 (05), 170–172.
Yu, J., and Gui, Q. (2014). UDEC simulation of fracture development in shallow coal seams in mountainous areas[J]. Mod. coal mines 27 (02), 57–59.
Zhang, S., Jiang, T., Pei, X., Huang, R., Xu, Q., Xie, Y., et al. (2022). A new forecasting method for failure time of creep landslide based on nonlinear creep behavior and new prewarning criterion. Front. Earth Sci. 10, 1018432. doi:10.3389/feart.2022.1018432
Zhang, S., Pei, X. J., Wang, S. Y., Huang, R. Q., and Zhang, X. C. (2020). Centrifuge model testing of loess landslides induced by excavation in Northwest China. Int. J. Geomech. 20. doi:10.1061/(ASCE)GM.1943-5622.0001619
Zhang, S., Pei, X. J., Wang, S. Y., Huang, R. Q., Zhang, X. C., and Chang, Z. L. (2019a). Centrifuge model testing of a loess landslide induced by rising groundwater in Northwest China. Eng. Geol. 259, 105170. doi:10.1016/j.enggeo.2019.105170
Keywords: geological disaster prevention, coal seam mining, former goaf detection, discrete element numerical simulation, strata deformation
Citation: Wei Z-X, Zhao M, Xie F-H, Cao S-H, Dong J-H and Dong Y-D (2023) Detection of former goaf and analysis of deformation characteristics of overburden in Dameidong coal mine. Front. Earth Sci. 11:1111745. doi: 10.3389/feart.2023.1111745
Received: 30 November 2022; Accepted: 24 January 2023;
Published: 08 February 2023.
Edited by:
Chengyi Pu, Central University of Finance and Economics, ChinaReviewed by:
Yong Wei, Guizhou Minzu University, ChinaYang Kong, Nanjing Hydraulic Research Institute, China
Copyright © 2023 Wei, Zhao, Xie, Cao, Dong and Dong. This is an open-access article distributed under the terms of the Creative Commons Attribution License (CC BY). The use, distribution or reproduction in other forums is permitted, provided the original author(s) and the copyright owner(s) are credited and that the original publication in this journal is cited, in accordance with accepted academic practice. No use, distribution or reproduction is permitted which does not comply with these terms.
*Correspondence: Meng Zhao, emhhb21lbmdAY2R1LmVkdS5jbg==
†These authors have contributed equally to this work