 Alessandro Aiuppa1*
 Giovanni Lo Bue Trisciuzzi1
 Salvatore Alparone2
 Marcello Bitetto1
 Mauro Coltelli2
 Dario Delle Donne3
 Gaetana Ganci2
 Emilio Pecora2
- 1Dipartimento di Scienze della Terra e del Mare (DiSTeM), Università di Palermo, Palermo, Italy
- 2INGV-Osservatorio Etneo, Catania, Italy
- 3INGV-Osservatorio Vesuviano, Napoli, Italy
The persistent open-vent degassing of Mt. Etna is often punctuated by months-long paroxysmal sequences characterized by episodes of violent Strombolian to lava fountaining activity. Understanding these gas-fueled transitions from quiescence to eruption requires routine measurement of gas fluxes. Here, we report SO2 flux measurements, obtained from a permanent UV camera system, collected over a two-year-long period spanning two paroxysmal sequences of Etna’s New South East Crater (NSEC) in December 2020/April 2021 and May/October 2021. In both cases, SO2 flux increased from ≤ 3250 Mg/day during “ordinary” activity to ≥ 4200 Mg/day. We interpret these distinct SO2 degassing regimes in light of seismic and thermal observations and drawing on numerical simulations of sulfur degassing constrained by parental melt sulfur contents in Etna’s hawaiites. We find that initiation of a paroxysmal sequence results from an approximate doubling of the time-averaged rate of magma supply (and degassing) above the sulfur exsolution level (∼150 MPa pressure), to >4 m3/s. This corroborates recent models that argue for the triggering of paroxysmal sequences by escalating supply of volatile-rich magma to a reservoir ∼3–4 km below the summit region. The non-stationary nature of magma flow and volcanic degassing we identify highlights the need for sustained surveillance to characterize long-term atmospheric budgets of volcanic volatiles.
1 Introduction
Magmatic degassing–the exsolution and separation of volatiles from melts - is a critical step in magmatic processes (Oppenheimer et al., 2014). The gas bubbles that form due to decompression/cooling upon crustal emplacement of magmas are the fuel of explosive volcanic eruptions (Gonnermann and Manga, 2003) and their release to the atmosphere can have local/regional (Mather, 2015) and global scale environmental impacts (e.g., during large-scale explosive eruptions; Robock, 2000).
This critical role gas plays in volcanic processes has motivated attempts to quantify gas emission rates from active volcanoes, with a focus on ground- and satellite-based techniques that target measurement of the more easily detectable volcanic SO2 flux (Oppenheimer et al., 2011). However, as volcanic SO2 flux catalogues become increasingly complete (Mori et al., 2013; Shinohara, 2013; Carn et al., 2017; Fischer et al., 2019; Arellano et al., 2021), the non-stationary nature of volcanic degassing emerges more and more clearly: even the so-called “persistent gas emitters” (Aiuppa et al., 2019) exhibit strong temporal fluctuations in emissivity, alternating periods of large SO2 emissions with periods of reduced degassing (e.g., Miyakejima volcano: Kazahaya et al. (2004) vs; Mori et al. (2013); Bagana volcano; Carn et al. (2017) vs; McCormick Kilbride et al. (2019)), or even degassing shut-off (e.g., Ambrym volcano: Bani et al. (2009) and Allard et al. (2016) vs; Moussallam et al. (2021)). While this unsteady degassing behavior challenges attempts to derive robust volcanic gas output inventories (Werner et al., 2019), it also opens avenues for eruption forecast (Poland and Anderson, 2020), as periods of heightened degassing typically coincide with, and sometimes precede eruptions (e.g., Reath et al., 2019). In any case, it is now well recognized that sustained observations are needed to characterize the fluctuating nature of volcanic degassing (Kern et el., 2022).
Mount Etna in Sicily has been the focus of some of the most sustained SO2 flux monitoring from ground-based observations (Caltabiano et al., 2004; Salerno et al., 2009). Operational monitoring of SO2 flux dates back to 1987, with some intermittent measurements in 1975 to 1986 (Caltabiano et al., 2004). The long time-series of measurements, supplemented by satellite observations (e.g., Queißer et al., 2019), have identified Etna as one of the strongest persistent volcanic gas emitters worldwide (Allard, 1997; Shinohara, 2013; Carn et al., 2017).
Etna’s persistent degassing activity is typically sustained by quiescent (passive) gas discharge from shallow convecting magma (Allard, 1997), accompanied by mild (Strombolian) intra-crater explosive activity. This ordinary activity is frequently interrupted by effusive eruptions (Branca and Del Carlo, 2004; Branca and Del Carlo, 2005; Andronico et al., 2005; Branca et al., 2011) and, periodically, by violent paroxysmal explosive activity (Andronico et al., 2021). Since the 1980s, there has been an intensification of this latter explosive behavior, with periods of quiescent open-vent degassing at the summit craters being frequently interrupted by powerful paroxysmal sequences, typically lasting months, and consisting of clusters of violent, short-lived Strombolian to lava fountaining episodes (Andronico et al., 2021 and references therein). These paroxysmal events vary widely in style (from mild Strombolian to large-scale lava fountaining), intensity (with up to 14 km high eruptive columns; Corsaro et al., 2017), duration (from < 2 to >24 h) and recurrence intervals (from hours to years). Most often, these events occur in clusters of more or less regularly spaced (∼10 days repose interval on average) episodes (post-2000 sequences consisted of three to 64 episodes), now described as a paroxysmal sequence (Andronico et al., 2021). Paroxysmal activity produces locally/regionally dispersed eruptive clouds (Poret et al., 2018) that cause tephra fallout on the inhabited flanks of the volcano. Tephra deposition results in a variety of hazards and impacts (Andronico et al., 2015; Osman et al., 2019), and in substantial economic losses (Barnard, 2004). This increasingly explosive nature of Etna’s volcanism has been related to a more volatile-rich, potassic magma feeding its transcrustal plumbing system (Métrich et al., 2004; Corsaro et al., 2009).
Although these paroxysmal sequences have at times involved multiple craters simultaneously (e.g., Corsaro et al., 2017), most since 2011 have been focused at the New South East Crater (NSEC) (Figure 1; Behncke et al., 2014; De Beni et al., 2015). Because all the summit craters can degas simultaneously, SO2 sensing tools able to resolve emissions from distinct vents/craters are very useful for understanding the volcano’s behavior. This capability is afforded by a recently deployed permanent UV camera system (D’Aleo et al., 2016; D’Aleo et al., 2019; Delle Donne et al., 2019) (Figure 1).
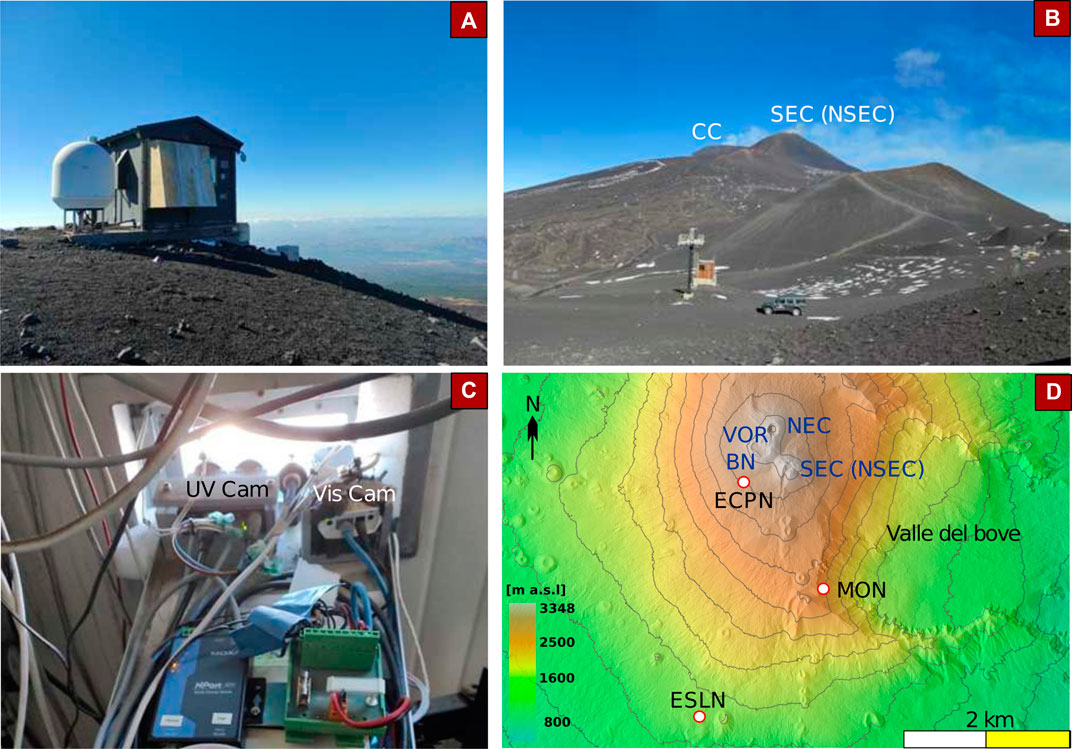
FIGURE 1. (A) The INGV-OE Montagnola hut; (B) The summit crater terrace as see from the Montagnola; (C) The UV Camera system inside the Montagnola (MON) hut: UV Cam: UV Camera; Vis Cam: Visible Camera; (D) Digital elevation map of the Etna’s summit region, showing the ubication of the seismic (ESLN and ECPN) and UV Camera (MON) instruments.
Here, we report on a UV camera-based SO2 flux time-series spanning 2 years during capturing two paroxysmal sequences of Etna’s NSEC in December 2020/April 2021 and May/October 2021 (INGV-OE, 2020; Andronico et al., 2021). Our aims are to: i) constrain the diverse SO2 flux behavior of ordinary vs paroxysmal eruptive periods, and ii) use the results to improve understanding of the trigger(s) of Etna’s paroxysms.
2 Materials and methods
2.1 UV camera measurements
The SO2 flux results we report on are derived from processing of images taken by the permanent “La Montagnola” (MON) UV camera system (Figure 1). Hardware/software characteristics and the system’s functionalities have been described (D’Aleo et al., 2016; D’Aleo et al., 2019; Delle Donne et al., 2019). In brief, the system employs two JAI CM-140GE-UV cameras sensitive to UV-radiation, fitted with two different band-pass optical filters (Full Width at Half Maximum, FWHM, of 10 nm) with central wavelengths of 310 and 330 nm, respectively. The two co-aligned cameras are programmed to record daily sequences of images (520×676 pixel at 10-bit) at 0.5 Hz rate during optimal illumination conditions (e.g., from 7.30 a.m. to 12.30 p.m. UTC time). Image acquisition is automated by a Fujitsu RX100 Workstation.
The daily images are post-processed by a standard protocol (Kantzas et al., 2010; Delle Donne et al., 2019), in which sets of simultaneously acquired images (from the two cameras) are combined into single absorbance images, applying the Beer–Lambert law. This allows quantification of the relative absorption of scattered UV sunlight by in-plume volcanic SO2 over the cameras’ field of view (FoV). Sequences of SO2 absorption images are then converted into SO2 column density images using the proportionality ratio between absorbance and SO2 column density, derived from an Ocean Optics USB 2000+ spectrometer pointing in a defined subregion of an absorbance image (Figure 1). Finally, SO2 column densities are integrated along a profile stretching over the median portion of a rectangular integration sub-area, positioned over the crater terrace (Figure 1). The obtained SO2 integrated column amounts (kg⋅m-1), once multiplied by plume speed (m⋅s-1; derived by applying an optical flow algorithm that tracks gas fronts in consecutive image frames; Delle Donne et al., 2019), yield a 0.5 Hz time step for SO2 flux (kg⋅s-1) measurement, examples of which are shown in Figures 2A–C.
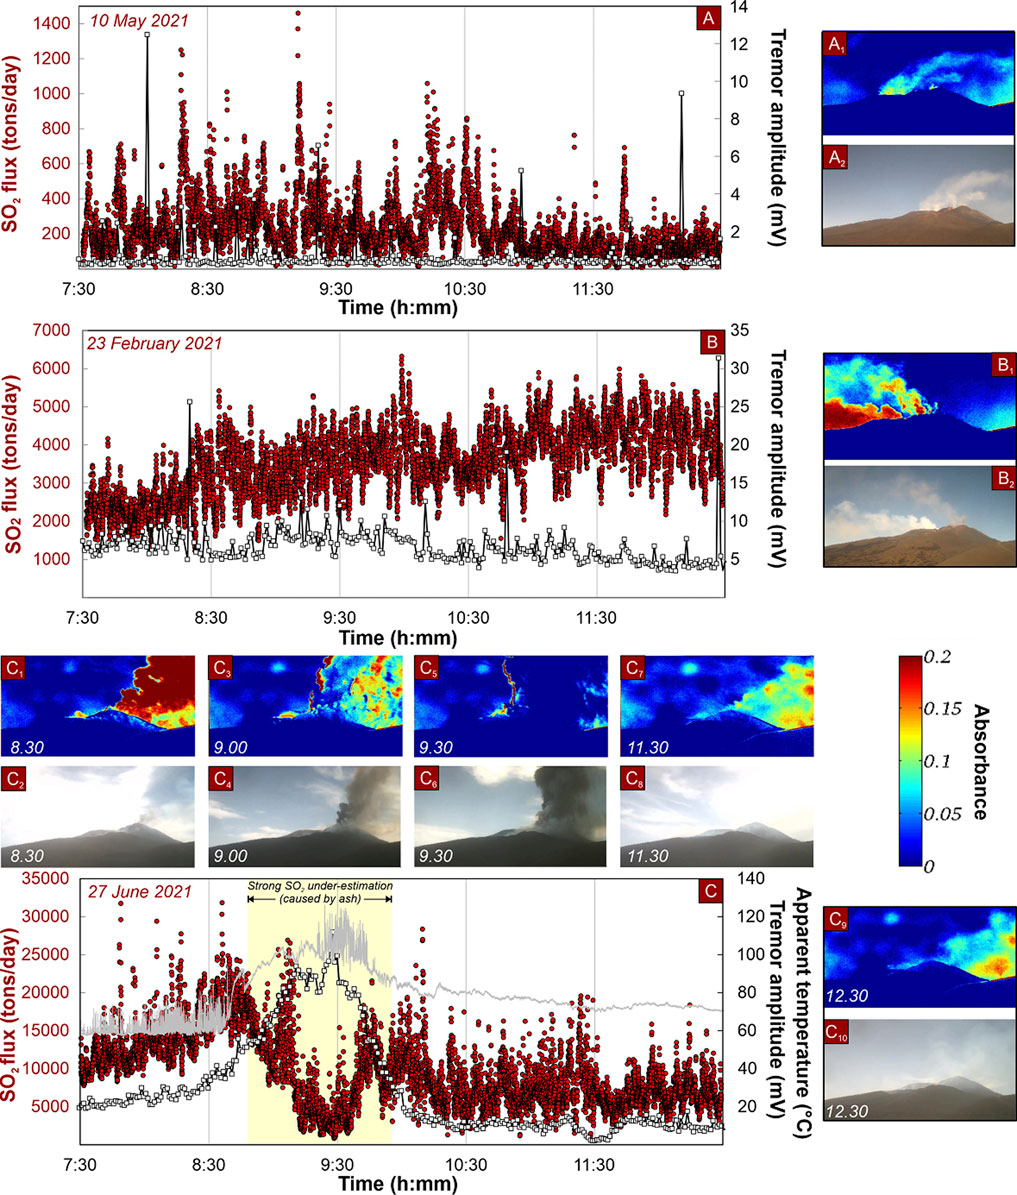
FIGURE 2. SO2 flux time-series (red circles, 1 measurement every 2 s) obtained in three distinct measurement days (time as UTC time). (A) 10 May 2021, a measurement day characteristic of passive during a quiescence period (PPP1) (B) 23 February 2021, representative of passive degassing during a repose interval in-between two consecutive paroxysmal episodes of paroxysmal sequence PS1 (C) 27 June 2021, taken as example of measurements during a temporal interval encompassing a paroxysmal episode. In (A) to (C), seismic tremor RMS amplitude (open squares; data from INGV-OE ECPN broadband seismometer) is shown for comparison (as 1 min average). Note different scales for both SO2 flux and tremor in (A) to (C), demonstrating a progressive escalation in degassing and seismic activity. In (C), the apparent temperatures derived by processing (using the NewSaraterm software; Andò and Pecora, 2006) images captured by the ENT infrared camera are also shown (grey solid line). The SO2 flux signal is abated by volcanic ash during peak of fountaining activity at circa 9.30 UTC time. In this phase (identified by yellow background), the low derived SO2 fluxes are therefore a measurement artefact—this and other (two other measurement days in total) data subset affected by strong ash in the plume have been excluded from further processing (e.g., they do not concur to calculation of daily SO2 flux averages illustrated in Figure 3 and listed in Supplementary Table S1). Photos are absorbance and visible images of Etna’s summit in the three specific days: 10 May 2021 (A1, A2); 23 February 2021 (B1 and B2); 27 June 2021 (C1 to C10; taken at specific times as indicated). In the absorbance images, colour tones are proportion to in-plume SO2 absorption of scattered UV sunlight (colour tone scale, from 0 to 0.2, shown in bottom right portion of the figure).
The entire operation sequence described above is completed using a MATLAB code that can deliver SO2 flux time-series in near real-time (Delle Donne et al., 2019). The results reported here (Figure 2; Figure 3) are, however, based on post hoc manual operator check and validation of these automatically processed data. In particular, the image sequences are visually inspected, and any frame of limited (or no) visibility (cloud coverage), or any frame (e.g., C4 and C6 in Figure 2 discussed below) with visible ash in the plume (as indicated by a co-exposed visible camera), are omitted from calculation of SO2 flux daily averages (illustrated in Figure 3B). This is because the presence of ash in the plume is known to significantly interfere (suppress) the in-plume SO2 signal (e.g., frames C3 and C5 in Figure 2 discussed below), resulting in artificially low SO2 fluxes. The implication is that our observations severely underestimate syn-eruptive SO2 emissions during a paroxysm’s climax, which can be more fully characterized from spaceborne instruments (Corradini et al., 2021). However, as paroxysmal episodes are relatively short-lived (minutes to hours), the under-represented paroxysmal SO2 contribution is relatively marginal (D’Aleo et al., 2019) if long-term (days to years) SO2 degassing trends are of interest, as it is the case here.
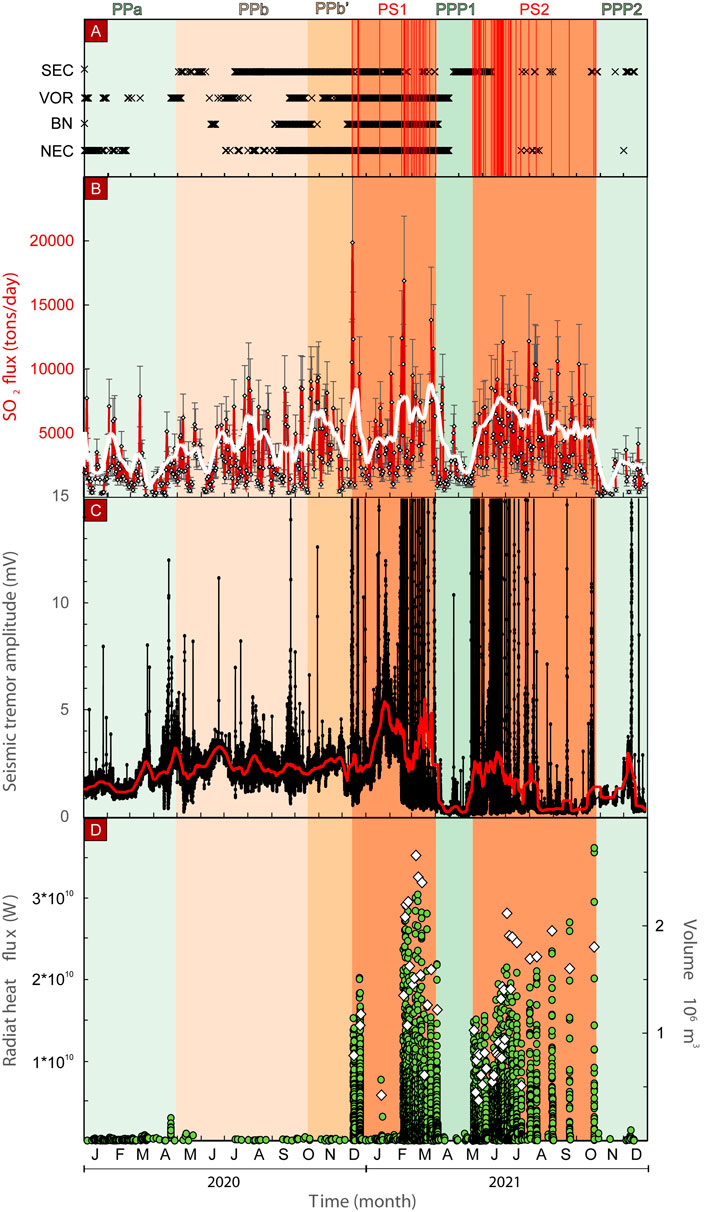
FIGURE 3. (A) Chronogram of volcanic activity at Etna throughout 2020–2021. Crosses indicate mild explosive activity (either impulsive ash discharge events or intra-crateric Strombolian activity) at one of the summit craters (NEC: Northeast crater; VOR: Voragine crater; BN: Bocca Nuova crater; SEC: Southeast crater). Red vertical bars identify paroxysmal episodes at SEC (lava fountains during paroxysmal sequences PS1 and PS2; indicated by dark orange shading). During the precursory phase PPb, shading with different orange tones mark periods of progressive acceleration of magma transport (as evidenced by the derived magma input rates of Figure 4) and activity build-up at SEC. (B) Temporal record of daily averaged SO2 fluxes (30% error bars are shown). The while solid line is a mobile average of the SO2 flux maxima. (C) Minute-averaged seismic tremor RMS amplitude (black symbols and line), as measured at the INGV-OE ESLN broadband seismometer (a very similar temporal trend–yet shifted at higher values but with some temporal gaps in the winter season–is observed at ECPN seismometer; see Supplementary Figure S1). The red solid line is a 20 days mobile average drawn to illustrate the long-term (weeks/months) tremor fluctuations. (D) Time-series of radiant heat flux (green circles), as derived from processing of MSG-SEVIRI multispectral images (one data every 15 min). The white diamonds indicate the erupted volumes (in 106 m3) estimated from the radiant heat fluxes using the methodology of Ganci et al. (2012), Ganci et al. (2013).
Artificial suppression of the real SO2 flux signal by ash is not the only disadvantage of UV Cameras compared with other more established measurement techniques, e.g., Differential Optical Absorption Spectroscopy (DOAS; Platt and Stutz, 2008; Galle et al., 2003; Galle et al., 2010). Targeting the proximal–and therefore often most optical opaque–portion of a plume (Figure 2), UV Cameras are more prone to errors caused by in-plume multiple scattering caused by aerosols and water droplets (Kern et al., 2010). We minimize this effect by selecting (from operator inspection of visible camera images) frames with visually transparent (uncondensed) plumes. More challenging is to account for the effect of radiation scattering (light dilution) in the line of sight between the volcanic plume and the SO2 camera (Kern et al., 2010). This can attenuate the SO2 signal, leading to significant underestimation of SO2 column amounts, depending on the distance between the observation site and the plume. To estimate random and systematic errors in SO2 column amount retrievals caused by light dilution, we apply the methodology of Campion et al. (2015) assuming an observation distance of 3 km (the distance between MON and Etna’s NSEC crater). For the Etna’s specific conditions, the methodology of Campion et al. (2015) allows derivation of a linear regression between measured and theoretical true scan column densities with a correlation coefficient (R2) of 0.99, and a slope of ∼0.68. From this regression, we estimate a potential systematic underestimation of the true SO2 column densities of ∼32%, and an average random error associated with each measurement of ∼20%.
The UV Camera FoV (Figure 1) also limits the range of detectable gas emissions to those produced by the South East Crater (SEC) complex (that includes the NSEC) and from the southern portion (Bocca Nuova) of the Central Craters (D’Aleo et al., 2019) while leaving undetected the emissions of the North East Crater (NEC) and Voragine (the VOR emissions can only be measured during vigorous explosive activity that produce high, sustained plumes; D’Aleo et al., 2019). Therefore, our SO2 flux measurements are unrepresentative of the bulk (total) plume emissions that, on Etna, are regularly monitored by more distant observations with scanning UV spectrometers (Salerno et al., 2009).
The daily averaged SO2 fluxes are listed in Supplementary Table S1. The chronology of volcanic activity (see below), and the complete SO2 flux time-series, are illustrated in Figures 3A, B.
2.2 Volcanic tremor and radiant heat
To more fully characterize eruptive activity, the SO2 flux record is complemented with seismic tremor data and thermal records from both satellite and ground-based instruments (Figure 2 and Figure 3).
Volcanic tremor is the most distinctive seismic signal recorded on active volcanoes. Generally associated with physical processes involving interactions between magmatic fluids and surrounding rocks inside the volcano (Chouet and Matoza, 2013), according to prevailing theory volcanic tremor originates from acoustic resonances of fluid-filled cracks triggered by pressure transients (Chouet, 1996). Volcanic tremor is often associated with the upward migration of magma and gases in the plumbing system (McNutt and Nishimura, 2008), and provides useful information on volcanic activity evolution (e.g., Almendros et al., 2001; Patané et al., 2013). At Mt. Etna, these seismovolcanic signals, and their variation over time, have turned out to be strictly related to eruptive activity (e.g., Patanè et al., 2008; Viccaro et al., 2014), and have provided clues on pressurization or depressurization phenomena within the plumbing system (Cannata et al., 2015). Furthermore, the temporal evolution of volcanic tremor amplitude has been found to strongly correlate with the intensity of explosive activity (Andronico et al., 2021) (compare Figures 2A–C). In fact, tremor amplitude gradually increases during the activity ramp-up that leads to a paroxysmal episode, peaking at the eruption climax, and then decreasing rapidly to return to a normal levels at the end of a paroxysmal episode (Alparone et al., 2003; Cannata et al., 2008) (Figure 2C). In order to track volcanic tremor amplitude changes, we calculate the Root-Mean-Square (RMS) of the seismic signal recorded by the vertical component of Serra La Nave seismic station (ESLN), located on the upper southern flank (Figure 1). This station is equipped with a broadband (40 s cut-off period), 3-component Trillium Nanometrics™ seismometer, acquiring at a sampling rate of 100 Hz. The RMS time series is calculated on 1 min long time windows of seismic signal filtered in the band 0.5–5.5 Hz. This frequency band includes most of the volcanic tremor energy (e.g., Cannata et al., 2008). The entire RMS time-series is illustrated in Figure 3C. The seismic station located at Cratere del Piano (ECPN), closer to the crater, exhibits a similar trend (Supplementary Figure S1).
Etna’s paroxysmal episodes are also characterised by thermal observations from both ground and space. In order to derive high-rate information on thermal activity during a paroxysmal episode (data in Figure 2C), we use ground-based long-wave infrared (LWIR) records derived from a FLIR Thermovision A40M infrared camera located in Nicolosi, 15 km south of the summit craters (ENT). The camera is installed on the roof of a school in front of the INGV headquarters in Nicolosi. Thermal images are converted on board by the camera into a single output value that corresponds to the maximum temperature (Figure 2C) recorded in a region of interest, centred on the zone potentially affected by eruptive activity. This temperature value is transmitted at 1 Hz, through a WiFi system, to the acquisition centre in Nicolosi, where thermal images are processed in real time by the NewSaraterm software (Andò and Pecora, 2006), developed with LabVIEWTM 8.0, to detect ash-rich eruptive columns, explosive and effusive activity. This software calculates, with a median filter, the daily thermal offset and extracts, for each measure, the difference between the detected value and the dynamic thermal offset. NewSaraterm also sends messages to the INGV-OE Control Room in Catania when a set of thresholds is exceeded, to alert on-duty staff for early warning procedures. The maximum apparent temperatures acquired by this camera are also published in real time on the INGV-OE Intranet page. The system has demonstrated its ability to recognize thermal anomalies over background. The temperatures displayed in the video frames are much lower than the true temperatures at the target owing to distance between the thermal camera site and the target (the summit craters), and the effect of environmental factors such as air humidity, pressure, air temperature, and the presence of protective lenses on the camera (Ball and Pinkerton, 2006; Sawyer and Burton, 2006; Spampinato et al., 2011). The temperature values illustrated in Figure 2C are thus apparent, not absolute, as they have not been corrected for the aforementioned factors. The chosen temperature range on the infrared camera is from —40°C to 120°C, and temperatures exceeding 130°C are not shown in Figure 2C.
Longer-term fluctuations in radiant heat (Figure 3D) are characterised using radiant heat flux derived from space-borne images acquired by the Spinning Enhanced Visible and InfraRed Imager (SEVIRI) on board Meteosat Second Generation (MSG) satellite. MSG-SEVIRI multispectral images are retrieved via the CL-HOTSAT system, a new version of the HOTSAT system (Ganci et al., 2011; Ganci et al., 2016; Ganci et al., 2018) implemented in the OpenCL standard to obtain near-real-time monitoring of volcano-related thermal activity. The SEVIRI sensor is especially useful to observe and track rapid eruptive events such as Etna’s paroxysmal explosions (Calvari et al., 2021; Calvari et al., 2022), since it allows the acquisition of images in the thermal and medium infrared region of the electromagnetic spectrum at very high temporal resolution (every 15 min; up to 5 min using the rapid scanning service at medium latitudes). The CL-HOTSAT system developed at INGV-OE allows for automatic detection of thermal anomalies and quantification of thermal activity through calculation of the radiant heat flux. The radiant heat flux time-series in 2020–2021 is illustrated in Figure 3D.
In the case of effusive eruptions, the radiant heat flux can be converted into a time average discharge rate (TADR) (Harris et al., 1998) assuming a thermal balance between the heat within the erupted flow volume and that lost from it. This balance implies that i) the volumetric flux is proportional to flow area, and ii) lava surfaces cool exponentially with time and distance from the source (Harris and Baloga, 2009). These assumptions cannot be verified in the case of transient events such as Etnean paroxysmal events, during which steady-state, and hence thermal equilibrium, cannot be reached (Garel et al., 2013). However, for these short and transient eruptive events, a satellite-derived volume estimation can be derived from modelling the radiant heat flux curve measured during the cooling-dominated phase of activity (Ganci et al., 2012; Ganci et al., 2013). Our satellite-derived radiant heat flux (Figure 3D) is converted into magma volumetric fluxes (Figure 3D) by modeling the time t) required for lava flow to cool following equation:
where Tsurf is the surface temperature for a stagnant, stable, cooling lava surface, Th is the initial temperature, Ta is ambient temperature, ε is emissivity, σ is the Stefan-Boltzmann constant, hc is the convective heat transfer coefficient, k is thermal conductivity, λ is a dimensionless scaling value, κ is thermal diffusivity, and Rc and Rr are thermal resistance terms for convection and radiation, respectively. Converting the surface temperature in radiant heat flux, hence including the radiating area, and fixing a minimum and maximum thickness expected for these short-lived events, an estimation of the emplaced volume can be obtained. Part of the thermal dataset used here is also discussed in Ganci et al. (2023).
3 Results
3.1 Volcanic activity
A chronology of volcanic activity during our observational interval (January 12,020 to December 31 2021) is illustrated in Figure 3A, as derived from INGV-OE monitoring reports (INGV-OE, 2020). As evident, volcanic activity has taken a variety of forms during the study period, with the four summit craters being intermittently (and at time all concurrently) active. As our primary goal is to analyze degassing dynamics at NSEC (the most active crater, but also the one that can be most successfully observed from our UV Camera position, Figure 1), we classify volcanic activity based on the characteristics exhibited by activity at this specific crater. Based on this, we categorize our observational interval into seven categories (activity periods), as discussed below.
The Precursory Phase PPa (January-April 2020) is distinguished for the lack of any visible eruptive activity at the NSEC (Figure 3A). Volcanic activity is therefore confined at NEC and VOR that exhibit some relatively continuous intra-crateric explosive (ash expulsion and mild Strombolian events) and effusive (at VOR) activity.
The Precursory Phase (PPb) (May 2020 to 12 December 2020) marks resumption of volcanic activity at the NSEC. Activity progressively intensifies (becomes increasingly more frequent; Figure 3A) at the NSEC during PPb, but remains limited to mild Strombolian activity and intermittent ash expulsion events. No paroxysmal episode takes place in this phase. Sub-period PPb’, the last 2 months of phase PPb (Figure 3A), is identified based on a visible acceleration in degassing activity at NSEC (based on the SO2 flux record; see below).
Onset of paroxysmal activity on 13 December marks onset of PS1, the first of two especially powerful paroxysmal sequences (dark orange in Figure 3A) occurring in 2020–2021 (INGV-OE, 2020; Andronico et al., 2021; Bonaccorso et al., 2021; Calvari et al., 2021; De Gori et al., 2021; Marchese et al., 2021; Corsaro and Miraglia, 2022). PS1 is opened by 4 “transitional” (following the terminology of Andronico et al. (2021): “strong Strombolian activity alternating with short periods of lava fountains”) eruptive episodes on 13, 21 and 22 December 2020, and on 18 January 2021 (Andronico et al., 2021; Bonaccorso et al., 2021; Corsaro and Miraglia, 2022) (Figure 3A). Since 16 February 2021, paroxysmal episodes become more rhythmic and closely spaced (Figure 3A). In total, PS1 includes 21 paroxysms, 17 of which are powerful lava fountaining episodes between February 16 and 1 April 2021 (Figure 3A). Although all episodes occur at NSEC, PS1 is notable for that all summit craters exhibit some milder intra-crateric explosive activity (Figure 3A).
The PS1 paroxysmal sequence closes abruptly with a final paroxysm on 1 April 2020, and is followed by circa 2 months of relative quiescence (no paroxysmal activity) in Post Paroxysmal Phase 1 (PPP1).
Paroxysmal activity resumes again at NSEC on 19 May 2021, marking the onset of a second paroxysmal sequence (PS2) that terminates on October 23. PS2 includes 34 episodes in total (INGV-OE, 2020) (Figure 3A), and is followed by a period of relative quiescence (Post Paroxysmal Phase 2; PPP2) until the end of the year (Figure 3A).
3.2 SO2 fluxes
Figure 2 shows examples of UV-camera derived, 0.5 Hz SO2 flux time-series obtained in three distinct days, taken respectively as representative of a) passive degassing during a quiescence period, b) passive degassing during a paroxysmal sequence (e.g., during a repose interval in-between two consecutive paroxysmal episodes), and c) a temporal interval encompassing a paroxysmal episode. These examples, although not exhaustive, illustrate the variety of Etna’s degassing modes in 2020–2021, and clearly identify a progressive SO2 flux increase from degassing regime a) to c). During quiescent periods (e.g., Figure 2A), the SO2 flux exhibits the typical “pulsed” degassing behavior seen in previous work (Tamburello et al., 2013), in which nearly periodic SO2 flux fluctuations repeat at periods of tens to hundreds of seconds. These are interpreted to reflect either atmospheric/dispersion processes, or the rhythmic release of sequences of concentrated SO2 clouds (or puffs) from the open vents (Tamburello et al., 2013). In this specific example, the daily averaged SO2 flux is typically at <1000 Mg/day level, and seismic tremor amplitude is at low levels, too (Figure 2A; Figure 3). Degassing regime b) (passive degassing during repose intervals between two consecutive paroxysmal episodes) is similar to regime a), but the SO2 flux fluctuates at around higher (>>1000 Mg/day) time-averaged levels, and seismic tremor amplitude is also more intense (Figure 2B; Figure 3). The SO2 flux reaches its highest levels (>5000 Mg/day) in the run-up to a paroxysmal episode, during which seismic tremor and ground-based thermal activity also escalate (Figure 2C). Seismic tremor and thermal activity peak during the paroxysmal climax (Figure 2C), during which our SO2 time-series are abnormally low. This apparent sin-paroxysm SO2 drop is a technical artifact due to the optically opaque nature of the ash-laden eruptive cloud (Figure 2C) that precludes quantitative SO2 detection (D’Aleo et al., 2019).
The ash-free (cfr. 2.1) SO2 flux results acquired during each observation day (examples in Figure 2) are averaged to derive the daily mean SO2 fluxes illustrated in Figure 3B. The plot clearly highlights large temporal oscillations in the daily averaged SO2 flux. In the relatively calm PPa phase, the SO2 flux averages at 1977 ± 1531 Mg/day (Figure 3B), but nearly doubles during the subsequent PPb phase of intensifying activity at the NSEC (mean, 3351 ± 2515 Mg/day) (here and below, we quote mean ±1 standard deviation). Onset of PS1 on December 13 marks an abrupt SO2 flux increase; the mean flux for this period is 4836 ± 3667. A large inter-daily variability is observed (range, 880–19850 Mg/day) during PS1, and the peak SO2 flux in our time-series (19850 Mg/day) is observed on December 14 (a few hours after the first paroxysmal episode on December 13). End of PS1 on April 1 marks an abrupt SO2 emission drop, and the SO2 flux remains at low levels of ∼2600 Mg/day (range, 580–8500 Mg/day) during the entire PPP1, to manifestly increase again during PS2 (mean, 4290 Mg/day; range 760–12160 Mg/day). The lowest fluxes are recorded in the PPP2 (mean, 1484 ± 1059 Mg/day).
3.3 Volcanic tremor and radiant heat flux
Tremor amplitude (Figure 3C) exhibits long-term (weeks-to months-long) fluctuations (as exemplified by the 20 days moving average; red curve), over which sharp and transient (hours) increases are superimposed that mark the repeated Strombolian and lava fountaining episodes in 2020–2021. The two paroxysmal sequences (PS1 and PS2) are therefore well evident in the seismic tremor record as clusters of repeated, abrupt tremor amplitude escalations during intense explosive intensity. The longer-term trend (red curve) identifies a progressive (thought irregular), mild tremor amplitude increase from PPa to PPb. This tremor amplitude escalation culminates in phase PS1, during which seismic tremor amplitude remains sustainedly high (background tremor, red curve, peaking on January 27). Seismic tremor amplitude then abruptly drops during phase PPP1, to resume again in phase PS2, though at reduced levels relative to phase PS1. Tremor amplitude is overall at low levels in phase PPP2, with some transient increases in December 2021 (Figure 3C).
Thermal anomalies are observed in SEVIRI images in correspondence to almost all the paroxysmal eruptions (Figure 3D). Images recorded during the 17 March, 27 May and 16 June paroxysmal episodes are affected by consistent cloud coverage that hampers derivation of erupted volumes. The paroxysmal episodes of the PS1 paroxysmal sequence are the most energetic, with heat flux peaks above 20 GW (Figure 3D). These convert into volumes of up to ∼2.5 ×10⁶ m3 per episode (Figure 3D), providing an average output rate of about 7 m3/s. The second paroxysmal sequence (PS2) is instead characterized by prevalently lower heat fluxes (<20 GW), and by an average output rate of 2.8 m3/s. The median volume per episode is also lower (<1.6·106 m3), and <1·106 m3 until 22 June (Figure 3D). The last two episodes (21 September and 23 October) are exceptional for their heat flux (>20 GW) and estimated volumes (of ∼1.5·106 m3) (Figure 3D).
4 Discussion
Our results demonstrate that the SO2 flux (Figure 3B) accelerates during the two 2020–2021 paroxysmal sequences. The cumulative SO2 degassed mass, illustrated in Figure 4B, exhibits a steeper trend in phases PS1 and PS2, confirming escalating degassing activity. The two paroxysmal sequences are additionally characterised by repeated, sharp escalations in seismic tremor amplitude (Figure 3C) and radiant heat flux (Figure 3D).
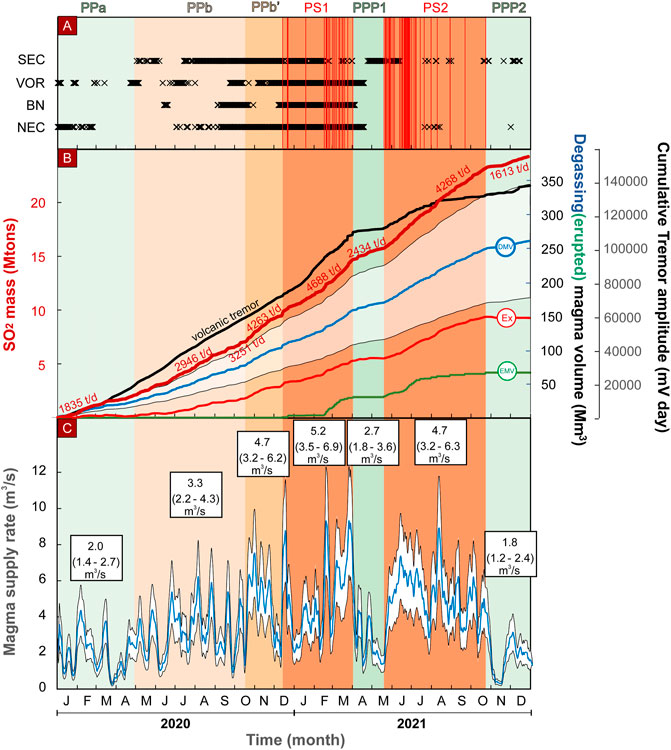
FIGURE 4. (A) Chronogram of volcanic activity at Etna throughout 2020–2021 (same as Figure 3); (B) Cumulative discharged SO2 mass (dark red solid line), derived from data in Figure 3 (data-gaps in the acquisition are filled by linear interpolation). Numbers in red represent time-averaged SO2 fluxes, calculated from the slopes of the (interpolated) SO2 mass trend. The light red line represents the Excess SO2 mass (Ex), calculated from the cumulative discharged SO2 mass by removing a background SO2 flux of 1835 Mg/day (PPa average). Also shown are is the cumulative Degassed Magma Volume (DMV, the volume of degassing magma required to sustain the 2021–2021 cumulative SO2 release), obtained by summation of the volumetric magma input rates derived by applying Equation 2 to the interpolated SO2 flux time-series. We present an intermediate scenario (blue curve labelled “DMV”) and upper/lower ranges (see white dashed area) (see text). The cumulative Erupted Magma Volume (EMV) is calculated by summing up eruptive volumes shown in Figure 3D; (C) Weekly mobile averages of magma input rates obtained by solving equation 2. We present an intermediate scenario (blue curve) and upper/lower ranges (white area; see text). Temporal fluctuations of these weekly averaged magma input rates are used to identify distinct activity periods (as illustrated by the coloured bands; see text).
That the SO2 flux regime at Etna modulates in response to changing activity level is not a new finding itself, as there is plenty of evidence for an SO2 flux escalation during both flank eruptions (Bruno et al., 2001; Caltabiano et al., 2004; Andronico et al., 2005) and summit crater paroxysmal sequences (Patanè et al., 2013; Spampinato et al., 2015; Corsaro et al., 2017; Coppola et al., 2019; Calvari et al., 2020). The relationship between SO2, seismic tremor (Salerno et al., 2018), and heat flux (Coppola et al., 2019; Corradini et al., 2020) has also been investigated earlier. However, our 2020–2021 dataset is relevant because of the especially clear contrasting SO2 flux regimes of paroxysmal vs ordinary periods, and for the relatively abrupt SO2 changes at the transitions to/from a paroxysmal sequence (compare Figure 3A; Figure 3B). These contrasting SO2 degassing regimes are further demonstrated by Figure 4, in which well-defined break-in-the-slopes in the cumulative SO2 degassed mass trend (Figure 4B) mark each activity transition (Figure 4A). Our SO2 record offers an opportunity to contributing to a better understanding of the mechanisms that govern the onset and duration of a paroxysmal sequence.
4.1 Sulfur as a tracer of magma feeding source processes
Recent advances in geophysical (Alparone et al., 2007; Aloisi et al., 2011; 2018; Patanè et al., 2013; Bonaccorso and Calvari, 2017; Cannata et al., 2018; De Gori et al., 2021) and geochemical (Allard et al., 2005; Aiuppa et al., 2010; La Spina et al., 2015; Paonita et al., 2021) monitoring, combined with careful volcanological, petrological and remote sensing observations (Corsaro et al., 2017; Calvari et al., 2018), have led to enormous progress in understanding, interpreting and modelling the drivers of Etna’s paroxysmal sequences. Consensus has been reached that the transition from ordinary to paroxysmal activity at NSEC is a response to escalating supply of volatile-rich, mafic magma into a vertically elongated, shallow (∼2–4 km depth below the summit, bvs) magma storage zone (Figure 5A). Mixing of this mafic magma with more evolved, shallow resident magma (Kahl et al., 2015; Corsaro et al., 2017; Giuffrida and Viccaro, 2017) would cause gas-driven pressure build-up over timescales of days to months (Giuffrida and Viccaro, 2017), and ultimately eruption (Bonaccorso et al., 2013; Patanè et al., 2013; Corsaro et al., 2017; Cannata et al., 2018; Bonaccorso et al., 2021). For example, the PS1 sequence in late 2020 to early 2021 has recently been proposed to represent the culmination of a magma resupply event of the ∼2–4 km deep magma storage zone, started in late 2020, as also indicated by a seismic swarm on 19 December 2020 (Bonaccorso et al., 2021). The escalating tremor amplitude since December 13, as seen in our results (Figure 3C), is entirely consistent with this hypothesis.
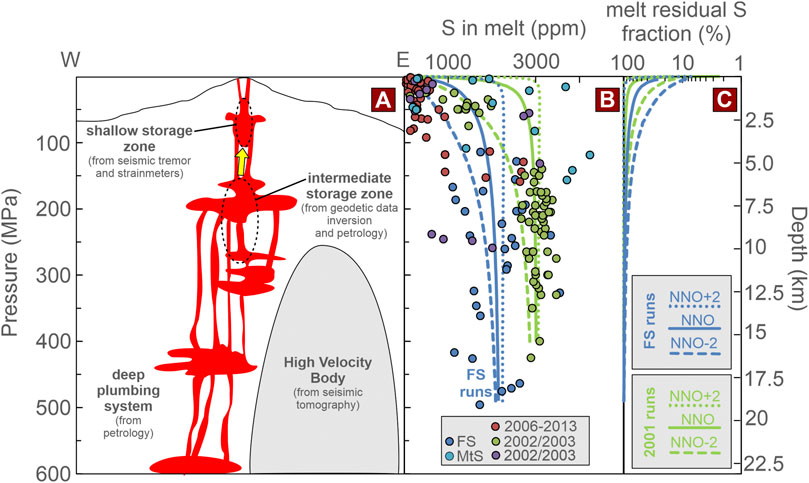
FIGURE 5. (A) Schematic representation (E-W cross-section) of Etna’s transcrustal plumbing system, as derived from synthesis of information arising from a variety of studies and disciplines: geodesy (Palano et al., 2008; Aloisi et al., 2011; Palano et al., 2017; Aloisi et al., 2018), seismic tremor (Alparone et al., 2007; Cannata et al., 2018), seismic tomography (Patanè et al., 2003; Patanè et al., 2013; De Gori et al., 2021), strainmeters (Bonaccorso et al., 2013; Bonaccorso et al., 2021), volcanic gases (Allard et al., 2005; Aiuppa et al., 2010; Paonita et al., 2021), and petrology (Métrich et al., 2004; Kahl et al., 2015; Corsaro et al., 2017; Giuffrida and Viccaro, 2017); (B) Pressure-dependence of S content in Etna’s melt inclusions (data from Métrich et al., 2004; Spilliaert et al., 2006; Gennaro et al., 2019). Data for specific eruptions (FS, Monte Spagnolo (MtS), 2002/2003) and summit activity periods (2006–2013) are shown. Lines describe the model predicted (model of Moretti et al., 2003) evolutions of dissolved S contents in Etna’s melt during simulated decompression paths. Green lines, 2001 model runs (initialised assuming a parental melt S content of 3000 ppm, and same run conditions as in Aiuppa et al., 2007); Blue lines, FS runs (initialised assuming a parental melt S content of 2200 ppm, and melt composition as in Gennaro et al., 2019). Three runs were carried for each scenario to explore a range of redox conditions (from −2 to +2 log units below/above the Nickel-Nickel Oxide buffer, NNO) (see Table 1). (C) Pressure-dependent, model predicted (same runs as (B)) fraction (in %) of S remaining dissolved in the melt during de-compressional degassing.
Indirect evidence for recharge/over-pressuring of the shallow Etna’s magma ponding zone comes from the petrology/geochemistry of erupted products (e.g., Pompilio et al., 2017), from modelling of seismic and geodetic signals (e.g., Bonaccorso et al., 2021), and from the chemistry of volcanic gases released prior to (Aiuppa et al., 2010; Paonita et al., 2021) and during (Allard et al., 2005) the lava fountaining episodes. Inversion of geodetic data (Palano et al., 2008; Aloisi et al., 2011; Palano et al., 2017; Aloisi et al., 2018; Cannata et al., 2018), and petrological information (Métrich et al., 2004; Corsaro et al., 2017; Giuffrida and Viccaro, 2017; Cannata et al., 2018), have been used to suggest the mafic magma feeding paroxysmal sequences is sourced by an intermediate (at ∼ 8–11 km depth below sea level, bsv) magma storage zone (Figure 5A), part of a vertically elongated, complex transcrustal magmatic feeding systems extending down to the Moho (Giuffrida and Viccaro, 2017) (Figure 5A). However, a fundamental challenge remains the identification of the magma input rate threshold (if any) at which the volcano behaviour transitions to a paroxysmal sequence.
SO2 fluxes are especially useful in this regard as they can be converted into magma input (degassing) rates with the petrological method based on the equation:
where Qin is the magma input rate (in m3/s) above the SO2 exsolution level (the level at which effective sulphur S degassing from melt into a fluid phase starts), ΦSO2 is the SO2 flux (in Mg/day), ΔXS is S loss upon degassing (as inferred from the difference between parental melt and residual—post-eruption—S contents in Etna’s magmas; Figure 5B), and x and ρm are melt crystallinity and density (in kg/m3), respectively. In brief, the equation calculates the volumetric magma input rate required to justify the surface-measured SO2 output, based on knowledge of initial (pre-degassing) and final (post surface emplacement) S content in melt, and has extensively been used at Etna to constrain degassing magma budgets over decadal (Allard, 1997; Allard et al., 2006), yearly (Coppola et al., 2019), or even daily (D’Aleo et al., 2019) timescales. Estimates point to a general decline of time-averaged Qin values, from 5.4 to 8.9 m3/s in the 1975–1995 period (Allard, 1997), to ∼3 m3/s in 1995–2005 (Allard et al., 2006), and ∼1.6 m3/s in 2005–2010 (Coppola et al., 2019), reflecting an SO2 flux drop following the 2001 Etna’s flank eruption (Catalbiano et al., 2003). The common conclusion is, however, that such SO2-derived, time-averaged magma input rates are larger (1.8–4 times higher) than the mass eruption rate, implying long-term endogenous volcano growth (Allard, 1997) and deformation (Coppola et al., 2019).
Application of Equation (2) requires a model that suitably describes S behaviour during magmatic degassing of Etna’s alkali basalts. This model, starting from knowledge of the initial S content in Etna’s parental magmas, should be able to predict the fraction of S lost to vapor phase at each step of the magma decompression path, and up to surface pressure (0.1 MPa) (Allard, 1997). Deeply trapped, primitive melt inclusions are typically used to infer the initial (pre-degassing) parental melt S contents (Wallace and Edmonds, 2011). At Etna, melt inclusion results for the 2001 and 2002–2003 eruptions (Métrich et al., 2004; Spilliaert et al., 2006) indicate a parental melt S content of ∼3000 ppm (0.3 wt%), and a systematic decrease of dissolved S with pressure decrease (with S loss to vapour starting at pressures ≤150 MPa; Figure 5B). This 3000 ppm estimate, and 95% S extraction from melt upon degassing at ≤150 MPa (e.g., ΔS = 0.00285 in Eq. (2)), have been used in previous magma input rate estimates (Allard, 1997; Allard et al., 2006; Coppola et al., 2019). However, more recent work (Gennaro et al., 2019) has found more variable parental melt S contents in magmas, and less systematic (than found for the 2002–2003 melt inclusions; Spilliaert et al., 2006) pressure-dependence of melt S contents (Figure 5B). The authors suggest that variable redox conditions exert a strong control on dissolved S in Etna’s magmas.
In view of the above, we use the model of Moretti et al. (2003) to simulate S behaviour during de-compressional degassing of Etna’s magmas, using two distinct scenarios for the initial S contents (2001 runs: 3000 ppm, same run conditions as in Aiuppa et al., 2007; FS runs: 2200 ppm, melt composition as in Gennaro et al., 2019). We also explore the role of magma redox by running degassing model simulations over a range of redox conditions (from −2 to +2 log units below/above the Nickel-Nickel Oxide buffer, NNO) (see Table 1). Our model results (Figure 5B) output pressure-dependent model dissolved S contents matching the compositional range of Etna’s melt inclusions (Figure 5B). Importantly our model calculations demonstrate that, independently on model input conditions, S loss to vapor is negligible for pressures ≥200 MPa, and only becomes significant for pressures ≤150 MPa (Figure 5C). Therefore, in spite the S degassing path is manifestly redox-dependent (with more reducing conditions - NNO-2—leading to some larger “deeper/earlier” S degassing), it remains that S loss to vapor is minimal in the deep Etna’s plumbing systems (e.g., at conditions deeper than the 8–11 km bsv storage zone of Figure 5A). This makes of the surface measured SO2 flux a key tracer of the rates of magma supply, from the intermediate magma storage zone to the shallow portions of the Etna’s plumbing system, where paroxysmal sequences are initiated (Figure 5).
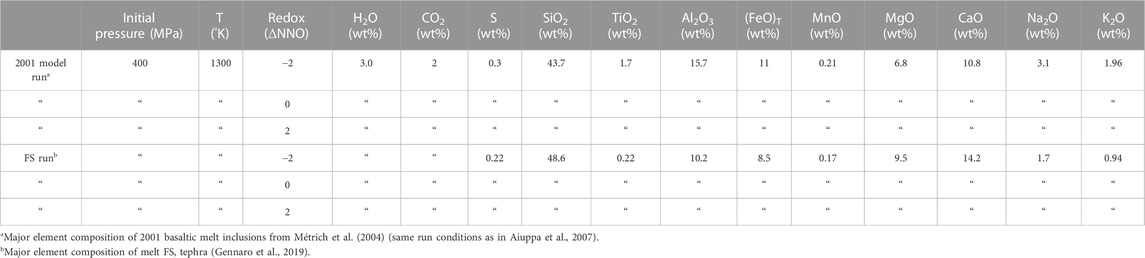
TABLE 1. Data input parameters of our degassing model runs. Parental melt composition (major and volatile elements) is represented by the primitive Etna’s olivine-hosted melt inclusions. All runs simulate magma decompression under isothermal conditions (Temperature T = 1300 K) from an initial pressure of 400 MPa down to atmospheric conditions (0.1 MPa). Redox conditions are kept constant in each model run, and vary from −2 to +2 log units below/above the Nickel-Nickel Oxide buffer in the different runs. See text for discussion.
We caution that our degassing models offer a simplified view of real degassing conditions of Etna’s magma. For example, our models are run in isothermal conditions, and therefore do not consider the effect of crystallization upon cooling, and the consequent role crystals may play in favouring bubble nucleation (Woitischek et al., 2020). Likewise, the model assumes gas-melt equilibrium at each step of the decompression path, and therefore cannot account for any disequilibrium generated during gas bubble expansion within the melt (Oppenheimer et al., 2018). This latter effect, however, mostly impacts gas redox and sulphur speciation (e.g., the SO2/H2S ratio) rather than total S degassing behaviour. Tests made by initialising runs at different initial volatile conditions indicate that varying the parental melt H2O content leads to some minor shift in the derived pressures of sulphur degassing initiation, but does not alter our overall conclusion of a shallow (≤150 MPa) condition of sulphur loss to the gas phase. Therefore, although simplified, our models offer a useful representation of the portion of the Etna’s plumbing system in which sulphur degassing actively takes place.
4.2 SO2-derived magma input rates
Stemming from the above, we use Equation 2 to convert our daily averaged SO2 fluxes (ΦSO2; data from Figure 3B) into daily averaged magma input rates (Qin) by taking into account the possible full spectrum of ΔS and crystallinity x values in Etna’s magmas (Figures 4B, C).
We illustrate the possible range of magma input rates Qin as a white shaded area in Figure 4C (in the diagram, the Qin values are expressed in the form of 7 days mobile averages). This area is limited by an upper range estimate (obtained using ΔS = 0.00205 and crystallinity x = 0.3) and a lower range estimate (obtained fixing ΔS at 0.00285 and crystallinity x at 0). These upper and lower range scenarios correspond to initial S contents of 2200 and 3000 ppm respectively, and 95% S extraction from melt upon degassing (see above). Density is fixed at 2700 kg/m3 in all calculations. The blue solid line in Figure 4C represents an intermediate scenario, obtained by averaging results of the upper and lower range scenarios. The same upper/lower/intermediate range estimates are illustrated in Figure 4B in the form of cumulative degassing magma volume, e.g., the cumulative volume of degassing magma required to explain the surface SO2 emissions. This cumulative volume is obtained from the summation of daily Qin values.
Our results constrain the time-averaged magma input rate Qin for the entire temporal interval (2020–2021) at 3.6 ± 2.7 m3/s (the mean values quoted here and below are based on the intermediate scenario; blue curve), within the range of previous estimates (Allard, 1997; Allard et al., 2006; Coppola et al., 2019). However, we observe large Qin temporal fluctuations (Figure 4C), with a progressive increase from PPa (mean: 2.0 m3/s; lower-upper scenario averages: 1.4–2.7 m3/s) to PPb (mean: 3.3 m3/s; lower-upper scenario averages: 2.2–4.3 m3/s) and finally PS1 (mean: 4.7 m3/s; lower-upper scenario averages: 3.5–6.9 m3/s) (Figure 4C). Then, after a sharp drop in PPP1 (mean: 2.7 m3/s; lower-upper scenario averages: 1.8–3.6 m3/s), Qin escalates again during PS2 (mean: 4.7 m3/s; lower-upper scenario averages: 3.2–6.3 m3/s). The lowest estimated Qin values are for PPP2 (mean: 1.8 m3/s; lower-upper scenario averages: 1.2–2.4 m3/s) (Figure 4C).
The calculations indicate that the magma input rate is 2-3 higher during a paroxysmal sequence (PS1 and PS2) than during the ensuing Post Paroxysmal phases (PPP1 and PPP2). Also, paroxysmal sequences exhibit on average a factor 30%–45% Qin increase relative to the precursory Phase (PP). At this point, we focus our attention on the last 2 months of the precursory phase (PPb’; identified in dark orange in Figure 3 and Figure 4), in which the time averaged SO2 flux increases (to ∼4260 Mg/dayay), and the corresponding Qin accelerates to values (mean: 4.7 m3/s; lower-upper scenario averages: 3.2–6.2 m3/s) in all similar to those characteristic of PS1 and PS2. Manifestly, the Qin rump-up pre-dates (by 1–2 months) the onset of PS1.
Ultimately, our results (Figure 4) suggest that onset and duration of a paroxysmal sequence are controlled by the rates of magma transport into the shallow magma plumbing system that feeds the NSEC (Figure 3 and Figure 4). The key aspect to consider is that our SO2 flux measurements are unrepresentative of the bulk (total) plume, but rather only capture the SO2 emissions from the South East Crater (SEC) complex (that also comprises the NSEC) and from the southern segment of the Central Craters (D’Aleo et al., 2019). Notably, our SO2 fluxes for the 2020–2021 paroxysmal sequences (PS1-PS2; Figure 3B) are in the same range of the SO2 flux time-averages derived by the INGV-OE network of UV scanners (INGV-OE, 2020; Salerno et al., 2022) that sense the distal, bulk (total) plume (Salerno et al., 2009). This fact strongly suggests that the southern portion of the crater terrace (SEC-Bocca Nuova) becomes the Etna’s dominant source of gas (of SO2, at least) during a paroxysmal sequence. The corollary is that our inferred magma input rates (Figure 4C) are intended to represent supply rates to the SEC-Bocca Nuova feeding system–these can only approach the total magma input rates only when/if activity concentrates at NSEC (e.g., shortly prior, or during, a paroxysmal sequence).
4.3 SO2 vs radiant heat and seismic tremor
Additional clues can be derived from a comparative analysis of the SO2 flux record (Figure 3B) with independent geophysical evidence (Figure 3C; Figure 3D).
We infer that, in the 2 years covered by our study, ∼15 Tg of SO2 have cumulatively been released (Figure 4B). When the intermediate scenario is considered (blue curve labelled DMV), this cumulative SO2 mass output requires degassing of ∼260·106 m3 of magma (from a minimum of 180·106 m3 in the lower range scenario to a maximum of 354·106 m3 in the upper range scenario). Of these, we infer that roughly half (∼120·106 m3) have sustained degassing during the 266 days interval covering the two paroxysmal sequences (PS1-PS2). Our MSG-SEVIRI results (Figure 3D), owing to the relatively coarse (1–3 km) spatial resolution of the multispectral images used, capture only feeble and inconstant thermal anomalies during open-vent ordinary activity (PPa, PPb, PPP1 and PP2 phases) (Figure 3D). In contrast, very intense radiant heat fluxes are detected by SEVIRI associated to each of the PS1/PS2 paroxysmal episodes (Figure 3D). These radiant heat fluxes, once converted into erupted volumes (Figure 3D), constrain the total (cumulative) magma output (required to explain the satellite-measured thermal emissions) at ∼70·106 m3 (Figure 4B). These calculations imply that, during the 2020–2021 paroxysmal sequence, the output magma volume (∼70·106 m3) corresponds to a relatively large (∼58%) proportion of the magma supplied to (and releasing SO2 from) the shallow Etna’s magma plumbing system. Such relatively large output/input fraction (0.58) is well above that typically observed during ordinary activity, when a large output vs input unbalance is typically observed (input/output ratios of ∼0.1, Allard et al., 2006). The implication is that, during a paroxysmal sequence, the transfer of magma to the surface is facilitated and, as previously found (Coppola et al., 2019), the output/input ratio approaches 1 (e.g., all magma supplied to the shallow magmatic system is erupted).
Comparison between SO2 flux and seismic tremor amplitude is also informative (Figs, 3, 4, 6). The seismic tremor record (Figure 3C) indicates clear high-frequency fluctuations (resulting from transient, intense seismic tremor increases during explosive activity) that are superimposed on a more continuous, longer-period trend. Focusing on this longer-term component (expressed by the 20 days moving average, exemplified by the red curve in Figure 3C), it is evident that seismic tremor is higher during a paroxysmal sequence (both PS1 and PS2) than during ordinary activity (see background seismicity in phases PPa, and PPP1 and PPP2). However, while the two paroxysmal sequences exhibit similarly elevated SO2 degassing regimes (see Figure 3B; Figure 4B), there is a marked contrast in their seismic tremor signatures, with PS2 being associated to less intense tremor (compare red trend in PS1 and PS2; Figure 3C). Also, while the SO2 flux escalation manifestly starts in phase PPb’, well before onset of paroxysmal activity (cfr. 4.2), the tremor increase in phases PPb and PPb’ is modest, with a notable escalation being only observed during PS1 (background tremor peaks on January 27). This complex SO2 flux vs seismic tremor relationship is additionally indicated by Figure 6 that compares the time-averaged SO2 flux vs seismic tremor signatures for the 7 activity phases. This plot confirms that the precursory phase (PPb’) is essentially manifested by temporally increasing SO2 fluxes at nearly invariant tremor (relative to PPb), and that the PS1 and PS2 sequences have similar (within uncertainties) time-averaged SO2 fluxes but diverse (> factor 2) seismic tremor amplitudes. Ordinary activity (phases PPa, PPP1 and PPP2) is characterised by consistently low SO2 fluxes (<4000 Mg/day) and seismic tremor amplitude (<2 mV). The conclusion is that, although SO2 flux and tremor are broadly correlated in the long-term (Figure 6; see also Salerno et al., 2018), their relationship is complicated by temporal swings in between the multiple tremor sources recognised on Etna (Cannata et al., 2008; Cannata et al., 2015; Zuccarello et al., 2022).
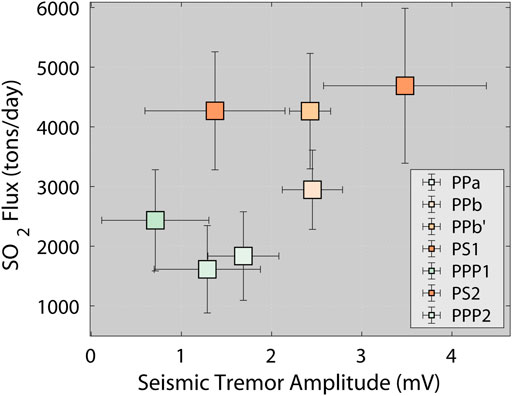
FIGURE 6. Scatter plot of time averaged seismic tremor amplitude vs SO2 flux in the 7 activity phases discussed in the text. Data plot as mean ± 1 standard deviation. Ordinary activity (phases PPa, PPP1 and PPP2) are characterised by reduced tremor amplitude (<2 mV) and SO2 flux (<3000 Mg/day). In the preparatory phase PPb, and especially PPb’, the mean SO2 flux increases to > 3000 Mg/day, and mean seismic tremor amplitude is between 2 and 3 mV. The two paroxysmal sequences exhibit similar mean SO2 flux regimes but contrasting seismic tremor signature. See text for discussion.
Although precise seismic tremor source location is beyond the scope of this study, we use the ratio of the seismic tremor amplitudes measured at the ECPN and ESLN seismic stations (e.g., the ECPN/ESLN tremor amplitude ratio; Figure 7) to investigate the temporal stability vs variability of the seismic tremor source in 2020–2021. This approach stands on the basis that temporal shifts in the ratio of tremor amplitudes recorded at summit (ECPN) vs intermediate height (ESLN) seismic station (see location in inset of Figure 7B and in Figure 1D) are informative of spatio-temporal changes in seismic tremor source (Alparone et al., 2003; Alparone et al., 2007; Cannata et al., 2008). We identify large oscillations in the ECPN/ESLN seismic tremor ratio in 2020–2021 (Figure 7) that are clearly indicative of a non-stationary seismic tremor source. These ratio fluctuations, in combination with information on seismic tremor location (extracted from INGV-OE reports; see Figure 7), support distinct PS1 vs PS2 tremor signatures; in which, during phase PS2, seismic tremor source is irradiated deeper (in May-June 2021; as indicted by low ECPN/ESLN ratio) and/or underneath BN/VOR crater sector (during July-October 2021), while seismic tremor source is more stably underneath the SEC in phase PS1 (Figure 7). A manifest upward migration (increasing ECPN/ESLN ratio) of the seismic tremor source, to cluster underneath the SEC, is also detectable in phases PPb and PPb’ (Figure 7).
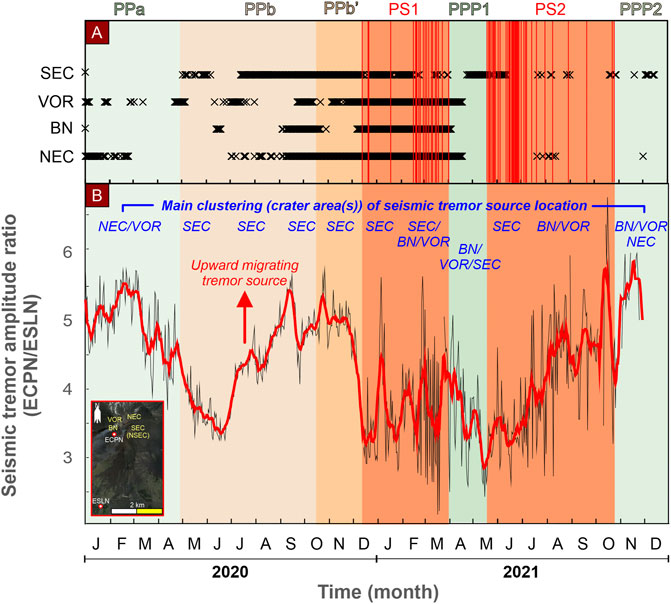
FIGURE 7. (A) Chronogram of volcanic activity at Etna throughout 2020–2021 (same as Figure 3). (B) Temporal record (2020–2021) of the ratio of tremor amplitudes measured at the ECPN and ESLN seismic stations. The ratio is calculated by ratioing the daily averaged tremor amplitudes from the two stations (a 10 days mobile average is shown in red). The temporal variability of the ratio supports significant spatio-temporal changes in seismic tremor source (Alparone et al., 2003; 2007; Cannata et al., 2008). These temporal swings are additionally indicated by seismic tremor locations (in blue), extracted by INGV-OE reports (INGV-OE, 2020; INGV-OE, 2020), that indicate the crater sector below which seismic tremor source locations are clustered.
4.4 Implications for the drivers of paroxysmal sequences
Drawing on all the evidence, we propose a mechanism in which, during ordinary activity (e.g., phase PPa), volcanic activity is concentrated at the Central Crater (VOR) and NEC (Figure 2A; Figure 3A). The VOR/NEC vent area has long been recognised as the most stable (persistent) magma degassing pathway during ordinary activity, while the SEC is thought to represent the surface expression of a secondary lateral branching (connected to the VOR/NEC in a branched feeding conduit geometry) (Marchetti et al., 2009; Aiuppa et al., 2010; Cannata et al., 2015). Our derived low SO2 fluxes (<2000 Mg/day) and magma input rates (∼1–3 m3/s) during the PPa phase (Figure 3; Figure 4; Figure 6) imply limited magma transport toward the south-eastern branching system (that feeds the SEC), and rather suggest preferential magma channelling in the “stable” central feeding conduit system. Seismic tremor locations clustering in the VOR/NEC area confirm this (INGV-OE, 2020; Figure 7). The radiant heat flux is low (Figure 3D), implying limited surface magma emplacement. This is typical of ordinary activity phases (e.g., Coppola et al., 2019), when a high input/output magma unbalance is typically observed that implicates shallow magma circulating in the central conduits evolves in open-system degassing conditions (Aiuppa et al., 2010; Edmonds et al., 2022). Open-system degassing implies efficient (low-pressure) separation of gas bubbles from melt to sustain quiescent open-vent degassing (and minor intra-crateric explosive activity) at VOR/NEC, and leads to recycling of dense/degassed magma deep into the plumbing system (Allard, 1997). Seismic tremor amplitude remains at low (background) levels (Figure 3; Figure 6).
Increasing SO2 fluxes (Figure 3; Figure 4; Figure 6) and magma input rates (Figure 4C) in phase PPb imply preferential magma migration toward the southern part of the crater terrace, and its channelling into the structurally/gravitationally unstable (Bonforte et al., 2017) Etna’s south-eastern upper flank, where the SEC branching system insists (Marchetti et al., 2009; Aiuppa et al., 2010; Patanè et al., 2013). This increased magma supply rate causes progressive re-awakening of the NSEC (Figure 3A), and some moderate seismic tremor increase (Figure 3C; Figure 6). Notably, the seismic tremor source consistently migrates upward and toward the SEC in this period (Figure 7; INGV-OE, 2020). The process intensifies in phase PPb’ when (at relatively invariant tremor amplitude; Figure 6) the SO2 flux ramps up to > 4000 Mg/day, suggesting accelerating magma transport (and degassing) toward the SEC. We propose that, as the magma input rate into the shallow SEC magma plumbing system increases to > 4 m3/s (PPb’ to PS1), such larger volumes of feeding mafic magma cannot be accommodated by quiescent (passive) open-system degassing, but rather lead to magma eruption in a paroxysmal sequence. We argue, based on previous work, that ascent of faster moving bubbly magma may lead to foam accumulation on-top of the SEC shallow magma reservoir (Allard et al., 2005), ultimately leading to pressure-build up (Bonaccorso et al., 2013; Bonaccorso et al., 2021), and finally eruption. Elevated seismic tremor and radiant heat at the PS1 onset mark explosive magma outburst in repeated paroxysmal episodes (Figures 3C,D). In this view, the sequence of paroxysmal episodes would perdure until fresh magma feeding into reservoir that feeds the NSEC vanishes down to the quiescent (persistent activity) values (in phase PPP1; Figure 4). Ultimately the process repeats again in May to December 2021, with phases PS1 and PPP2.
Our SO2 flux record (Figure 3B) is evidence for the utility of spatially resolved UV Camera observations in detecting gas/magma migration prior to/during clustering of volcanic activity at one specific crater. In particular, the manifest SO2 flux increase in phase PPb’ (Figures 3, 6), well before onset of paroxysmal sequence PS1, suggests that UV Camera observations have the potential to trace increasing magma supply weeks to months in advance to resumption of paroxysmal activity. However, comparison between the two recorded paroxysmal sequences (Figure 3; Figure 4; Figure 6) clearly shows that the transition from ordinary to paroxysmal activity can not only happen progressively (as in the case of PS1), but also suddenly (PS2). SO2, tremor and thermal records all increase abruptly at the PS2 onset, and we see no detectable precursory SO2 flux increase beforehand (Figure 3B). The diversity between PS1 and PS2 sequences is additionally demonstrated by the excess cumulative SO2 mass, shown in Figure 4B (red curve labelled “Ex”). This is calculated by subtracting the average SO2 flux for phase PPa (taken as representative of background degassing) from the cumulative SO2 mass. This excess SO2 mass progressively ramps up (during phases PPb to PPb’) prior to PS1, implying a gradual, protracted (several months long) acceleration in the SO2 degassing regime. In contrast, the excess SO2 mass does not show any precursory increase prior to onset of PS2, and rises contemporaneously with the start of paroxysmal activity. Tremor amplitude also rises during PS2, but to a lesser extent than in PS1 (Figure 3; Figure 6), implying distinct tremor source area (Figure 7). In particular, the prevailingly low ECPN/ESLN tremor amplitude ratios (Figure 7) suggest deepening of seismic source location in phase PPP1, and at the onset of phase PS2 (INGV-OE, 2020). This comparison demonstrates the challenges in anticipating paroxysmal behaviour at Etna, especially when the driving processes are rapid (hours) and deeply initiated (e.g., PS2).
5 Conclusion
We have shown here that the Etna’s SO2 flux emissions ramp up, by a factor 2–3 or more (on average), during a paroxysmal sequence (relative to ordinary activity). During a paroxysmal sequence, peak SO2 flux emissions as high as ∼20 Gg/day can be reached, or ∼10 times more than the background (ordinary activity) time-averaged levels. Our results, therefore, confirm the fluctuating, non-stationary nature of volcanic gas release at open-vent, persistently degassing volcanoes (Carn et al., 2017). The implication is that, at the many persistently degassing volcanoes worldwide, semi-continuous gas observations (with automated instrumental networks, e.g., Arellano et al., 2021) should be privileged over more infrequent (campaign-style) measurements.
Our results also confirm the benefits of using volcanic SO2 sensing tools (such as UV Cameras) that can spatially resolve emissions from distinct vents/craters. At the many volcanoes worldwide having multiple degassing vents, UV Cameras, especially if used in tandem with UV scanning spectrometers that image the bulk (total) plume from more distal locations (e.g., Salerno et al., 2009), can effectively allow tracking intensification of degassing at one specific vent (Etna’s NSEC in our case) before paroxysmal activity commences there.
Interpretation of SO2 flux timeseries requires a model is available for S evolution during magma ascent/degassing in the subsurface (e.g., Figure 5). Modeling S degassing behavior is still complicated by our still fragmentary understanding of S partitioning behavior between melt and fluid (e.g., Ding et al., 2023). It is anticipated that S studies at volcanoes should become even more interdisciplinary in the future, merging expertise from gas and melt inclusion geochemistry, experimental petrology, and thermodynamics/modelling.
Data availability statement
The original contributions presented in the study are included in the article/Supplementary Material, further inquiries can be directed to the corresponding author.
Author contributions
AA devised the study concept. All authors contributed to refinement of the initial concept. GL, DD, SA, and GG analysed the data in collaboration with all authors. All authors contributed to interpretation. AA drafted the original version of the manuscript with contributions from all co-authors. All authors contributed to the article and approved the submitted version.
Funding
The research leading to these results has received funding from the European Research Council under the European Union’s Seventh Framework Programme (FP7/2007/2013)/ERC Grant agreement No. 305377 (Principal Investigator: AA), from the Ministero Istruzione Università e Ricerca (Miur), grant PRIN 2017-2017LMNLAW (AA), from the NSFGEO-NERC grant Sulfur cycling in subduction zones (subcontract between Lamont-Doherty Earth Observatory and DiSTeM, co-Pi AA), from the PE-PNRR project “Return”, and from Istituto Nazionale Geofisica e Vulcanologia (INGV, Grant Number 9999.815 VOLC-GAS).
Acknowledgments
The INGV-OE staff is acknowledged for support to maintenance of instrumentation in the field.
Conflict of interest
The authors declare that the research was conducted in the absence of any commercial or financial relationships that could be construed as a potential conflict of interest.
The handling editor CO declared a past co-authorship with the author AA.
Publisher’s note
All claims expressed in this article are solely those of the authors and do not necessarily represent those of their affiliated organizations, or those of the publisher, the editors and the reviewers. Any product that may be evaluated in this article, or claim that may be made by its manufacturer, is not guaranteed or endorsed by the publisher.
Supplementary material
The Supplementary Material for this article can be found online at: https://www.frontiersin.org/articles/10.3389/feart.2023.1115111/full#supplementary-material
References
Aiuppa, A., Cannata, A., Cannavò, F., Di Grazia, G., Ferrari, F., Giudice, G., et al. (2010). Patterns in the recent 2007-2008 activity of Mount Etna volcano investigated by integrated geophysical and geochemical observations. Geochem. Geophys. Geosyst. 11 (9), Q09008. doi:10.1029/2010GC003168
Aiuppa, A., Fischer, T. P., Plank, T., and Bani, P. (2019). CO2 flux emissions from the Earth’s most actively degassing volcanoes, 2005-2015. Sci. Rep. 9, 5442. doi:10.1038/s41598-019-41901-y
Aiuppa, A., Moretti, R., Federico, C., Giudice, G., Gurrieri, S., Liuzzo, M., et al. (2007). Forecasting Etna eruptions by real-time observation of volcanic gas composition. Geology 35 (12), 1115–1118. doi:10.1130/G24149A.1
Allard, P., Aiuppa, A., Bani, P., Métrich, N., Bertagnini, A., Gauthier, P. J., et al. (2016). Prodigious emission rates and magma degassing budget of major, trace and radioactive volatile species from Ambrym basaltic volcano, Vanuatu island Arc. J. Volcanol. Geotherm. Res. 322, 119–143. doi:10.1016/j.jvolgeores.2015.10.004
Allard, P., Behncke, B., D'Amico, S., Neri, M., and Gambino, S. (2006). Mount Etna 1993-2005: Anatomy of an evolving eruptive cycle. Earth Sci. Rev. 78 (1-2), 85–114. doi:10.1016/j.earscirev.2006.04.002
Allard, P., Burton, M., and Muré, F. (2005). Spectroscopic evidence for a lava fountain driven by previously accumulated magmatic gas. Nature 433, 407–410. doi:10.1038/nature03246
Allard, P. (1997). Endogenous magma degassing and storage at Mount Etna. Geophys. Res. Lett. 24, 2219–2222. doi:10.1029/97GL02101
Almendros, J., Chouet, B., and Dawson, P. (2001). Spatial extent of a hydrothermal system at kilauea volcano, Hawaii, determined from array analyses of shallow long-period seismicity: 2. Results. J. Geophys. Res. Solid Earth. 106 (B7), 13581–13597. doi:10.1029/2001JB000309
Aloisi, M., Bonaccorso, A., Cannavò, F., and Currenti, G. M. (2018). Coupled short- and medium-term geophysical signals at etna volcano: Using deformation and strain to infer magmatic processes from 2009 to 2017. Front. Earth Sci. 6, 109. doi:10.3389/feart.2018.00109
Aloisi, M., Mattia, M., Ferlito, C., Palano, M., Bruno, V., and Cannavò, F. (2011). Imaging the multi-level magma reservoir at Mt. Etna volcano (Italy). Geophys. Res. Lett. 38 (16). doi:10.1029/2011GL048488
Alparone, S., Andronico, D., Lodato, L., and Sgroi, T. (2003). Relationship between tremor and volcanic activity during the Southeast Crater eruption on Mount Etna in early 2000. J. Geophys. Res. Solid Earth. 108 (B5), 2241–2253. doi:10.1029/2002JB001866
Alparone, S., Cannata, A., and Gresta, S. (2007). Time variation of spectral and wavefield features of volcanic tremor at Mt. Etna (January-June 1999). J. Volcanol. Geotherm. Res. 161, 318–332. doi:10.1016/j.jvolgeores.2006.12.012
Andò, B., and Pecora, E. (2006). An advanced video-based system for monitoring active volcanoes. Comput. Geosci. 32, 85–91. doi:10.1016/j.cageo.2005.05.004
Andronico, D., Branca, S., Calvari, S., Burton, M., Caltabiano, T., Corsaro, R. A., et al. (2005). A multi-disciplinary study of the 2002-03 etna eruption: Insights into a complex plumbing system. Bull. Volcanol. 67, 314–330. doi:10.1007/s00445-004-0372-8
Andronico, D., Cannata, A., Di Grazia, G., and Ferrari, F. (2021). The 1986–2021 paroxysmal episodes at the summit craters of Mt. Etna: Insights into volcano dynamics and hazard. Earth Sci. Rev. 220, 103686. doi:10.1016/j.earscirev.2021.103686
Andronico, D., Scollo, S., and Cristaldi, A. (2015). Unexpected hazards from tephra fallouts at Mt etna: The 23 november 2013 lava fountain. J. Volcanol. Geother. Res. 304, 118–125. doi:10.1016/j.jvolgeores.2015.08.007
Arellano, S., Galle, B., Apaza, F., Avard, G., Barrington, C., Bobrowski, N., et al. (2021). Synoptic analysis of a decade of daily measurements of SO2 emission in the troposphere from volcanoes of the global ground-based Network for Observation of Volcanic and Atmospheric Change. Earth Syst. Sci. 13 (3), 1167–1188. doi:10.5194/essd-13-1167-2021
Ball, M., and Pinkerton, H. (2006). Factors affecting the accuracy of thermal imaging cameras in volcanology. J. Geophys Res. Solid Earth. 111 (B11), 3829. doi:10.1029/2005JB003829
Bani, P., Oppenheimer, C., Tsanev, V. I., Carn, S. A., Cronin, S. J., Crimp, R., et al. (2009). Surge in sulphur and halogen degassing from Ambrym volcano, Vanuatu. Bull. Volcanol. 71, 1159–1168. doi:10.1007/s00445-009-0293-7
Barnard, S. T. (2004). Results of a reconnaissance trip to Mt. Etna, Italy: The effects of the 2002 eruption of etna on the province of Catania. Bull. N. Z. Soc. Earthq. Eng. 37 (2), 47–61. doi:10.5459/bnzsee.37.2.47-61
Behncke, B., Branca, S., Corsaro, R. A., De Beni, E., Miraglia, L., and Proietti, P. (2014). The 2011-2012 summit activity of mount etna: Birth, growth and products of the new SE crater. J. Volcanol. Geotherm. Res. 270, 10–21. doi:10.1016/j.jvolgeores.2013.11.012
Bonaccorso, A., and Calvari, S. (2017). A new approach to investigate an eruptive paroxysmal sequence using camera and strainmeter networks: Lessons from the 3-5 december 2015 activity at etna volcano. Earth Planet. Sci. Lett. 475, 231–241. doi:10.1016/j.epsl.2017.07.020
Bonaccorso, A., Carleo, L., Currenti, G., and Sicali, A. (2021). Magma migration at shallower levels and lava fountains sequence as revealed by borehole dilatometers on etna volcano. Front. Earth Sci. 9, 740505. doi:10.3389/feart.2021.740505
Bonaccorso, A., Currenti, G., Linde, A., and Sacks, S. (2013). New data from borehole strainmeters to infer lava fountain sources (etna 2011-2012). Geophys. Res. Lett. 40, 3579–3584. doi:10.1002/grl.50692
Bonforte, A., Fanizza, G., Greco, F., Matera, A., and Sulpizio, R. (2017). Long-term dynamics across a volcanic rift: 21 years of microgravity and GPS observations on the southern flank of Mt. Etna volcano. J. Volcanol. Geotherm. Res. 344, 174–184. doi:10.1016/j.jvolgeores.2017.06.005
Branca, S., Coltelli, M., Groppelli, G., and Lentini, F. (2011). Geological map of Etna volcano, 1:50,000 scale. Ital. J. Geosci. 130 (3), 265–291. doi:10.3301/IJG.2011.15
Branca, S., and Del Carlo, P. (2004). “Eruptions of Mt etna during the past 3200 years: A revised compilation integrating the historical and stratigraphic records,” in Mt. Etna: Volcano laboratory. Editors A. Bonaccorso, S. Calvari, M. Coltelli, C. Del Negro, and S. Falsaperla (Washington, DC: American Geophysical Union), 1–27. doi:10.1029/143GM02
Branca, S., and Del Carlo, P. (2005). Types of eruptions of etna volcano AD 1670–2003: Implications for short-term eruptive behaviour. Bull. Volcanol. 67, 732–742. doi:10.1007/s00445-005-0412-z
Bruno, N., Caltabiano, T., Giammanco, S., and Romano, R. (2001). Degassing of SO2 and CO2 at Mount Etna (Sicily) as indicator of pre-eruptive ascent and shallow emplacement of magma. J. Volcanol. Geotherm. Res. 110, 137–153. doi:10.1016/S0377-0273(01)00201-3
Caltabiano, T., Burton, M., Giammanco, S., Allard, P., Bruno, N., Murè, F., et al. (2004). “Volcanic gas emission from the summit craters and flanks of Mt. Etna, 1987-2000,” in Mt. Etna: Volcano laboratory. Editors A. Bonaccorso, S. Calvari, M. Coltelli, C. Del Negro, and S. Falsaperla (Washington, DC: American Geophysical Union), 111–128. doi:10.1029/143GM08
Caltabiano, T., Salerno, G., Bruno, N., and Longo, V. (2003). “Mt. Etna SO2 emissions during the 2002–2003 eruption,” in Proceeding of the EGS-AGU-EUG joint assembly (Nice, France: Spinger).
Calvari, S., Biale, E., Bonaccorso, A., Cannata, A., Carleo, L., Currenti, G., et al. (2022). Explosive paroxysmal events at etna volcano of different magnitude and intensity explored through a multidisciplinary monitoring system. Remote Sens. 14 (16), 4006. doi:10.3390/rs14164006
Calvari, S., Bilotta, G., Bonaccorso, A., Caltabiano, T., Cappello, A., Corradino, C., et al. (2020). The vei 2 christmas 2018 etna eruption: A small but intense eruptive event or the starting phase of a larger one? Remote Sens. 12 (6), 905. doi:10.3390/rs12060905
Calvari, S., Bonaccorso, A., and Ganci, G. (2021). Anatomy of a paroxysmal lava fountain at etna volcano: The case of the 12 March 2021, episode. Remote Sens. 13 (15), 3052. doi:10.3390/rs13153052
Calvari, S., Cannavò, F., Bonaccorso, A., Spampinato, L., and Pellegrino, A. G. (2018). Paroxysmal explosions, lava fountains and ash plumes at etna volcano: Eruptive processes and hazard implications. Front. Earth Sci. 6, 107. doi:10.3389/feart.2018.00107
Campion, R., Delgado-Granados, H., and Mori, T. (2015). Image-based correction of the light dilution effect for SO2 camera measurements. J. Volcanol. Geotherm. Res. 300, 48–57. doi:10.1016/j.jvolgeores.2015.01.004
Cannata, A., Catania, A., Alparone, S., and Gresta, S. (2008). Volcanic tremor at Mt. Etna: Inferences on magma dynamics during effusive and explosive activity. J. Volcanol. Geotherm. Res. 178, 19–31. doi:10.1016/j.jvolgeores.2007.11.027
Cannata, A., Di Grazia, G., Giuffrida, M., Gresta, S., Palano, M., Sciotto, M., et al. (2018). Space-time evolution of magma storage and transfer at Mt. Etna volcano (Italy): The 2015–2016 reawakening of Voragine crater. Geochem. Geophys. Geosyst. 19, 471–495. doi:10.1002/2017GC007296
Cannata, A., Spedalieri, G., Behncke, B., Cannavò, F., Di Grazia, G., Gambino, S., et al. (2015). Pressurization and depressurization phases inside the plumbing system of Mount Etna volcano: Evidence from a multiparametric approach. J. Geophys. Res. Solid Earth. 120, 5965–5982. doi:10.1002/2015JB012227
Carn, S. A., Fioletov, V. E., Mclinden, C. A., Li, C., and Krotkov, N. A. (2017). A decade of global volcanic SO2 emissions measured from space. Sci. Rep. 7, 44095–44112. doi:10.1038/srep44095
Chouet, B. A. (1996). Long-period volcano seismicity: Its source and use in eruption forecasting. Nature 380, 309–316. doi:10.1038/380309a0
Chouet, B. A., and Matoza, R. S. (2013). A multi-decadal view of seismic methods for detecting precursors of magma movement and eruption. J. Volcanol. Geotherm. Res. 252, 108–175. doi:10.1016/j.jvolgeores.2012.11.013
Coppola, D., Laiolo, M., Massimetti, F., and Cigolini, C. (2019). Monitoring endogenous growth of open-vent volcanoes by balancing thermal and SO2 emissions data derived from space. Sci. Rep. 9, 9394. doi:10.1038/s41598-019-45753-4
Corradini, S., Guerrieri, L., Brenot, H., Clarisse, L., Merucci, L., Pardini, F., et al. (2021). Tropospheric volcanic SO2 mass and flux retrievals from satellite. The etna december 2018 eruption. Remote Sens. 13 (11), 2225. doi:10.3390/rs13112225
Corradini, S., Guerrieri, L., Stelitano, D., Salerno, G., Scollo, S., Merucci, L., et al. (2020). Near real-time monitoring of the Christmas 2018 Etna eruption using SEVIRI and products validation. Remote Sens. 12 (8), 1336. doi:10.3390/RS12081336
Corsaro, R. A., Andronico, D., Behncke, B., Branca, S., De Beni, E., Caltabiano, T., et al. (2017). Monitoring the december 2015 summit eruptions of Mt. Etna (Italy): Implications on eruptive dynamics. J. Volcanol. Geotherm. Res. 341, 53–69. doi:10.1016/j.jvolgeores.2017.04.018
Corsaro, R. A., Métrich, N., Allard, P., Andronico, D., Miraglia, L., and Fourmentraux, C. (2009). The 1974 flank eruption of Mount Etna: An archetype for deep dike-fed eruptions at basaltic volcanoes and a milestone in Etna’s recent history. J. Geophys. Res. 114 (B7), B07204. doi:10.1029/2008JB006013
Corsaro, R. A., and Miraglia, L. (2022). Near real-time petrologic monitoring on volcanic glass to infer magmatic processes during the february-april 2021 paroxysms of the South-East Crater, etna. Front. Earth Sci. 10, 828026. doi:10.3389/feart.2022.828026
D’Aleo, R., Bitetto, M., Delle Donne, D., Coltelli, M., Coppola, D., McCormick Kilbride, B., et al. (2019). Understanding the SO2 degassing budget of Mt Etna’s paroxysms: First clues from the december 2015 sequence. Front. Earth Sci. 6, 239. doi:10.3389/feart.2018.00239
D’Aleo, R., Bitetto, M., Delle Donne, D., Tamburello, G., Battaglia, A., Coltelli, M., et al. (2016). Spatially resolved SO2 flux emissions from Mt Etna. Geophys. Res. Lett. 43 (14), 7511–7519. doi:10.1002/2016GL069938
De Beni, E., Behncke, B., Branca, S., Nicolosi, I., Carluccio, R., Caracciolo D'Ajello, F., et al. (2015). The continuing story of Etna's new Southeast crater (2012-2014): Evolution and volume calculations based on field surveys and aerophotogrammetry. J. Volcanol. Geotherm. Res. 303, 175–186. doi:10.1016/j.jvolgeores.2015.07.021
De Gori, P., Giampiccolo, E., Cocina, O., Branca, S., Doglioni, C., and Chiarabba, C. (2021). Re-Pressurized magma at Mt. Etna, Italy, may feed eruptions for years. Commun. Earth Environ. 2, 216. doi:10.1038/s43247-021-00282-9
Delle Donne, D., Aiuppa, A., Bitetto, M., D’Aleo, R., Coltelli, M., Coppola, D., et al. (2019). Changes in SO2 flux regime at Mt. Etna captured by automatically processed ultraviolet camera data. Remote Sens. 11 (10), 1201. doi:10.3390/rs11101201
Ding, S., Plank, T., Wallace, P. J., and Rasmussen, D. J. (2023). Sulfur_X: A model of sulfur degassing during magma ascent. Geochem. Geophys. Geosystems 24, 10552. doi:10.1029/2022GC010552
Edmonds, M., Liu, E., and Cashman, K. (2022). Open-vent volcanoes fuelled by depth-integrated magma degassing. Bull. Volcanol. 84, 28. doi:10.1007/s00445-021-01522-8
Fischer, T. P., Arellano, S., Carn, S., Aiuppa, A., Galle, B., Allard, P., et al. (2019). The emissions of CO2 and other volatiles from the world’s subaerial volcanoes. Sci. Rep. 9, 18716. doi:10.1038/s41598-019-54682-1
Galle, B., Johansson, M., Rivera, C., Zhang, Y., Kihlman, M., Kern, C., et al. (2010). Network for observation of volcanic and atmospheric change (novac): A global network for volcanic gas monitoring -network layout and instrument description. J. Geophys. Res. 115, 05304. doi:10.1029/2009JD011823
Galle, B., Oppenheimer, C., Geyer, A., McGonigle, A., Edmonds, M., and Horrocks, L. (2003). A miniaturised ultraviolet spectrometer for remote sensing of SO2 fluxes: A new tool for volcano surveillance. J. Volcanol. Geoth. Res. 119, 241–254. doi:10.1016/S0377-0273(02)00356-6
Ganci, G., Bilotta, G., Cappello, A., Hérault, A., and Del Negro, C. (2016). Hotsat: A multiplatform system for the thermal monitoring of volcanic activity using satellite data. Geol. Soc. Lond. Special Publ. 426 (1), 207–221. doi:10.1144/SP426.21
Ganci, G., Bilotta, G., Zuccarello, F., Calvari, S., and Cappello, A. (2023). A multi-sensor satellite approach to characterize the volcanic deposits emitted during Etna’s lava fountaining: The 2020–2022 study case. Remote Sens. 15 (4), 916. doi:10.3390/rs15040916
Ganci, G., Cappello, A., Bilotta, G., Hérault, A., Zago, V., and Del Negro, C. (2018). Mapping volcanic deposits of the 2011-2015 Etna eruptive events using satellite remote sensing. Front. Earth Sci. 6, 83. doi:10.3389/feart.2018.00083
Ganci, G., Harris, A. J. L., Del Negro, C., Guehenneux, Y., Cappello, A., Labazuy, P., et al. (2012). A year of lava fountaining at etna: Volumes from SEVIRI. Geophys. Res. Lett. 39 (6). doi:10.1029/2012GL051026
Ganci, G., James, M. R., Calvari, S., and Del Negro, C. (2013). Separating the thermal fingerprints of lava flows and simultaneous lava fountaining using ground-based thermal camera and SEVIRI measurements. Geophys. Res. Lett. 40, 5058–5063. doi:10.1002/grl.50983
Ganci, G., Vicari, A., Fortuna, L., and Del Negro, C. (2011). The HOTSAT volcano monitoring system based on a combined use of SEVIRI and MODIS multispectral data. Ann. Geophys. 54, 5. doi:10.4401/ag-5338
Garel, F., Kaminski, E., Tait, S., and Limare, A. (2013). The influence of wind on the estimation of lava effusion rate from thermal remote-sensing. J. Volcanol. Geotherm. Res. 264, 223–230. doi:10.1016/j.jvolgeores.2013.08.006
Gennaro, E., Iacono-Marziano, G., Paonita, A., Rotolo, S., Martel, C., Rizzo, A. L., et al. (2019). Melt inclusions track melt evolution and degassing of Etnean magmas in the last 15 ka. Lithos 324-325, 716–732. doi:10.1016/j.lithos.2018.11.023
Giuffrida, M., and Viccaro, M. (2017). Three years (2011-2013) of eruptive activity at Mt. Etna: Working modes and timescales of the modern volcano plumbing system from micro-analytical studies of crystals. Earth Sci. Rev. 171, 289–322. doi:10.1016/j.earscirev.2017.06.003
Gonnermann, H., and Manga, M. (2003). Explosive volcanism may not be an inevitable consequence of magma fragmentation. Nature 426, 432–435. doi:10.1038/nature02138
Harris, A. J. L., and Baloga, S. M. (2009). Lava discharge rates from satellite-measured heat flux. Geophys. Res. Lett. 36 (19), L19302. doi:10.1029/2009GL039717
Harris, A. J. L., Flynn, L. P., Keszthelyi, L., Mouginis-Mark, P. J., Rowland, S. K., and Resing, J. A. (1998). Calculation of lava effusion rates from Landsat TM data. Bull. Volcanol. 60, 52–71. doi:10.1007/s004450050216
INGV-OE (2020). Bollettini settimanali sul monitoraggio vulcanico, geochimico del vulcano Etna. Available at: https://www.ct.ingv.it/index.php/monitoraggio-e-sorveglianza/prodotti-del-monitoraggio/bollettini-settimanali-multidisciplinari.
Kahl, M., Chakraborty, S., Pompilio, M., and Costa, F. (2015). Constraints on the nature and evolution of the magma plumbing system of Mt. Etna volcano (1991-2008) from a combined thermodynamic and kinetic modelling of the compositional record of minerals. J. Petrology 56 (10), 2025–2068. doi:10.1093/petrology/egv063
Kantzas, E. P., McGonigle, A. J., Tamburello, G., Aiuppa, A., and Bryant, R. G. (2010). Protocols for UV camera volcanic SO2 measurements. J. Volcanol. Geotherm. Res. 194 (1-3), 55–60. doi:10.1016/j.jvolgeores.2010.05.003
Kazahaya, K., Shinohara, H., Uto, K., Odai, M., Nakahori, Y., Mori, H., et al. (2004). Gigantic SO2 emission from Miyakejima volcano, Japan, caused by caldera collapse. Geology 32 (5), 425–428. doi:10.1130/G20399.1
Kern, C., Aiuppa, A., and De Moor, J. M. (2022). A golden era for volcanic gas geochemistry? Bull. Volcanol. 84, 43. doi:10.1007/s00445-022-01556-6
Kern, C., Kick, F., Lübcke, P., Vogel, L., Wöhrbach, M., and Platt, U. (2010). Theoretical description of functionality, applications, and limitations of SO2 cameras for the remote sensing of volcanic plumes. Atmos. Meas. Tech. 3, 733–749. doi:10.5194/amt-3-733-2010
La Spina, A., Burton, M., Allard, P., Alparone, S., and Muré, F. (2015). Open-path FTIR spectroscopy of magma degassing processes during eight lava fountains on Mount Etna. Earth Planet. Sci. Lett. 413, 123–134. doi:10.1016/j.epsl.2014.12.038
Marchese, F., Filizzola, C., Lacava, T., Falconieri, A., Faruolo, M., Genzano, N., et al. (2021). Mt. Etna paroxysms of february-april 2021 monitored and quantified through a multi-platform satellite observing system. Remote Sens. 13 (16), 3074. doi:10.3390/rs13163074
Marchetti, E., Ripepe, M., Ulivieri, G., Caffo, S., and Privitera, E. (2009). Infrasonic evidences for branched conduit dynamics at Mt. Etna volcano, Italy. Geophys. Res. Lett. 36 (19), L19308. doi:10.1029/2009GL040070
Mather, T. A. (2015). Volcanoes and the environment: Lessons for understanding Earth's past and future from studies of present-day volcanic emissions. J. Volcanol. Geotherm. Res. 304, 160–179. doi:10.1016/j.jvolgeores.2015.08.016
McCormick Kilbride, B. T., Mulina, K., Wadge, G., Johnson, R. W., Itikarai, I., and Edmonds, M. (2019). Multi-year satellite observations of sulfur dioxide gas emissions and lava extrusion at Bagana volcano, Papua New Guinea. Front. Earth Sci. 7, 9. doi:10.3389/feart.2019.00009
McNutt, S. R., and Nishimura, T. (2008). Volcanic tremor during eruptions: Temporal characteristics, scaling and constraints on conduit size and processes. J. Volcanol. Geotherm. Res. 178 (1), 10–18. doi:10.1016/j.jvolgeores.2008.03.010
Métrich, N., Allard, P., Spilliaert, N., Andronico, D., and Burton, M. (2004). 2001 flank eruption of the alkali- and volatile-rich primitive basalt responsible for Mount Etna's evolution in the last three decades. Earth Planet. Sci. Lett. 228, 1–17. doi:10.1016/j.epsl.2004.09.036
Moretti, R., Papale, P., and Ottonello, G. (2003). “A model for the saturation of C-O-H-S fluids in silicate melts,” in Geological society of london (London: Special Publications), 81–101. doi:10.1144/GSL.SP.2003.213.01.06
Mori, T., Shinohara, H., Kazahaya, K., Hirabayashi, J., Matsushima, T., Mori, T., et al. (2013). Time-averaged SO2 fluxes of subduction-zone volcanoes: Example of a 32 years exhaustive survey for Japanese volcanoes. J. Geophys. Res. Atmos. 118 (15), 8662–8674. doi:10.1002/jgrd.50591
Moussallam, Y., Médard, E., Georgeais, G., Rose-Koga, E. F., Koga, K. T., Pelletier, B., et al. (2021). How to turn off a lava lake? A petrological investigation of the 2018 intra-caldera and submarine eruptions of Ambrym volcano. Bull. Volcanol. 83, 36. doi:10.1007/s00445-021-01455-2
Oppenheimer, C., Fischer, T. P., and Scaillet, B. (2014). Volcanic degassing: Process and impact. Treatise Geochem. 4, 111–179. doi:10.1016/B978-0-08-095975-7.00304-1
Oppenheimer, C., Scaillet, B., and Martin, R. S. (2011). Sulfur degassing from volcanoes: Source, conditions, surveillance, plume chemistry and Earth system impacts. Rev. Mineral. Geochem. 73 (1), 363–421. doi:10.2138/rmg.2011.73.13
Oppenheimer, C., Scaillet, B., Woods, A., Sutton, A. J., Elias, T., and Moussallam, Y. (2018). Influence of eruptive style on volcanic gas emission chemistry and temperature. Nat. Geosci. 11, 678–681. doi:10.1038/s41561-018-0194-5
Osman, S., Rossi, E., Bonadonna, C., Frischknecht, C., Andronico, D., Cioni, R., et al. (2019). Exposure-based risk assessment and emergency management associated with the fallout of large clasts at Mount Etna. Nat. Hazards Earth Syst. Sci. 19, 589–610. doi:10.5194/nhess-19-589-2019
Palano, M., Puglisi, G., and Gresta, S. (2008). Ground deformation patterns at Mt. Etna from 1993 to 2000 from joint use of InSAR and GPS techniques. J. Volcanol. Geotherm. Res. 169 (3-4), 99–120. doi:10.1016/j.jvolgeores.2007.08.014
Palano, M., Viccaro, M., Zuccarello, F., and Gresta, S. (2017). Magma transport and storage at Mt. Etna (Italy): A review of geodetic and petrological data for the 2002–03, 2004 and 2006 eruptions. J. Volcanol. Geotherm. Res. 347, 149–164. doi:10.1016/j.jvolgeores.2017.09.009
Paonita, A., Liuzzo, M., Salerno, G., Federico, C., Bonfanti, P., Caracausi, A., et al. (2021). Intense overpressurization at basaltic open-conduit volcanoes as inferred by geochemical signals: The case of the Mt. Etna December 2018 eruption. Sci. Adv. 7 (36), 6297. doi:10.1126/sciadv.abg6297
Patanè, D., Aiuppa, A., Aloisi, M., Behncke, B., Cannata, A., Coltelli, M., et al. (2013). Insights into magma and fluid transfer at mount etna by a multiparametric approach: A model of the events leading to the 2011 eruptive cycle. J. Geophys. Res. Solid Earth. 118 (7), 3519–3539. doi:10.1002/jgrb.50248
Patané, D., Chiarabba, C., De Gori, P., and Bonaccorso, A. (2003). Magma ascent and the pressurization of mount Etna's volcanic system. Science 299, 2061–2063. doi:10.1126/science.1080653
Patané, D., Di Grazia, G., Cannata, A., Montalto, P., and Boschi, E. (2008). Shallow magma pathway geometry at Mt. Etna volcano. Geochem. Geophys. Geosyst. 9 (12), 2131. doi:10.1029/2008GC002131
Platt, U., and Stutz, J. (2008). Differential optical absorption spectroscopy principles and applications, physics of Earth and space environments. Berlin, Heidelberg: Springer-Verlag, 597.
Poland, M. P., and Anderson, K. R. (2020). Partly cloudy with a chance oflavaflows: Forecasting volcaniceruptions in the twenty-first century. J. Geophys. Res. Solid Earth 125 (1). doi:10.1029/2018JB016974
Pompilio, M., Bertagnini, A., Del Carlo, P., and Di Roberto, A. (2017). Magma dynamics within a basaltic conduit revealed by textural and compositional features of erupted ash: The December 2015 Mt. Etna paroxysms. Sci. Rep. 7, 4805. doi:10.1038/s41598-017-05065-x
Poret, M., Costa, A., Andronico, D., Scollo, S., Gouhier, M., and Cristaldi, A. (2018). Modeling eruption source parameters by integrating field, ground-based, and satellite-based measurements: The case of the 23 February 2013 Etna paroxysm. J. Geophys. Res. Solid Earth. 123 (7), 5427–5450. doi:10.1029/2017JB015163
Queißer, M., Burton, M., Theys, N., Pardini, F., Salerno, G., Caltabiano, T., et al. (2019). TROPOMI enables high resolution SO2 flux observations from Mt. Etna, Italy, and beyond. Sci. Rep. 9, 957. doi:10.1038/s41598-018-37807-w
Reath, K., Pritchard, M., Poland, M., Delgado, F., Carn, S., Coppola, D., et al. (2019). Thermal, deformation, and degassing remote sensing time series (CE 2000-2017) at the 47 most active volcanoes in Latin America: Implications for volcanic systems. J. Geophys. Res. Solid Earth 124 (1), 195–218. doi:10.1029/2018JB016199
Robock, A. (2000). Volcanic eruptions and climate. Rev. Geophys. 38 (2), 191–219. doi:10.1029/1998RG000054
Salerno, G. G., Burton, M., Di Grazia, G., Caltabiano, T., and Oppenheimer, C. (2018). Coupling between magmatic degassing and volcanic tremor in basaltic volcanism. Front. Earth Sci. 6, 157. doi:10.3389/feart.2018.00157
Salerno, G. G., Burton, M. R., Oppenheimer, C., Caltabiano, T., Randazzo, D., Bruno, N., et al. (2009). Three-years of SO2 flux measurements of Mt. Etna using an automated UV scanner array: Comparison with conventional traverses and uncertainties in flux retrieval. J. Volcanol. Geotherm. Res. 183 (1-2), 76–83. doi:10.1016/j.jvolgeores.2009.02.013
Salerno, G., La Spina, A., Allard, P., Corradini, S., Merucci, L., Guerrieri, L., et al. (2022). Gas constraints on the source mechanisms of Mt. Etna 2021 paroxysmal lava fountains sequence. Abstract volume 5a Conferenza A. Rittmann, Catania, 29 Settembre - 1 Ottobre 2022. Misc. INGV 70, 230.
Sawyer, G. M., and Burton, M. R. (2006). Effects of a volcanic plume on thermal imaging data. Geophys. Res. Lett. 33 (14), L14311. doi:10.1029/2005GL025320
Shinohara, H. (2013). Volatile flux from subduction zone volcanoes: Insights from a detailed evaluation of the fluxes from volcanoes in Japan. J. Volcanol. Geotherm. Res. 268, 46–63. doi:10.1016/j.jvolgeores.2013.10.007
Spampinato, L., Calvari, S., Oppenheimer, C., and Boschi, E. (2011). Volcano surveillance using infrared cameras. Earth Sci. Rev. 106 (1-2), 63–91. doi:10.1016/j.earscirev.2011.01.003
Spampinato, L., Sciotto, M., Cannata, A., Cannavo, F., La Spina, A., Palano, M., et al. (2015). Multiparametric study of the February-April 2013 paroxysmal phase of Mt. Etna New South-East crater. Geochem. Geophys. Geosyst. 16 (6), 1932–1949. doi:10.1002/2015GC005795
Spilliaert, N., Métrich, N., and Allard, P. (2006). S–Cl–F degassing pattern of water-rich alkali basalt: Modelling and relationship with eruption styles on mount etna volcano. Earth Planet. Sci. Lett. 248, 772–786. doi:10.1016/j.epsl.2006.06.031
Tamburello, G., Aiuppa, A., McGonigle, A. J. S., Allard, P., Cannata, A., Giudice, G., et al. (2013). Periodic volcanic degassing behavior: The Mount Etna example. Geophys. Res. Lett. 40 (18), 4818–4822. doi:10.1002/grl.50924
Viccaro, M., Garozzo, I., Cannata, A., Di Grazia, G., and Gresta, S. (2014). Gas burst vs. gas-rich magma recharge: A multidisciplinary study to reveal factors controlling triggering of the recent paroxysmal eruptions at Mt. Etna. J. Volcanol. Geotherm. Res. 278-279, 1–13. doi:10.1016/j.jvolgeores.2014.04.001
Wallace, P. J., and Edmonds, M. (2011). The sulfur budget in magmas: Evidence from melt inclusions, submarine glasses, and volcanic gas emissions. Rev. Mineral. Geochem. 73, 215–246. doi:10.2138/rmg.2011.73.8
Werner, C., Fischer, T., Aiuppa, A., Edmonds, M., Cardellini, C., Carn, S., et al. (2019). “Carbon dioxide emissions from subaerial volcanic regions: Two decades in review,” in Deep carbon: Past to present. Editors B. Orcutt, I. Daniel, and R. Dasgupta (Cambridge: Cambridge University Press), 188–236. doi:10.1017/9781108677950
Woitischek, J., Edmonds, M., and Woods, A. W. (2020). The control of magma crystallinity on the fluctuations in gas composition at open vent basaltic volcanoes. Sci. Rep. 10, 14862. doi:10.1038/s41598-020-71667-7
Keywords: Etna, SO2 flux, volcanic gases, paroxysms, UV Camera, basaltic explosive volcanism
Citation: Aiuppa A, Lo Bue Trisciuzzi G, Alparone S, Bitetto M, Coltelli M, Delle Donne D, Ganci G and Pecora E (2023) A SO2 flux study of the Etna volcano 2020–2021 paroxysmal sequences. Front. Earth Sci. 11:1115111. doi: 10.3389/feart.2023.1115111
Received: 03 December 2022; Accepted: 22 May 2023;
Published: 01 June 2023.
Edited by:
Clive Oppenheimer, University of Cambridge, United KingdomReviewed by:
Santiago Arellano, Chalmers University of Technology, SwedenPhilipson Bani, UMR6524 Laboratoire Magmas et Volcans (LMV), France
Copyright © 2023 Aiuppa, Lo Bue Trisciuzzi, Alparone, Bitetto, Coltelli, Delle Donne, Ganci and Pecora. This is an open-access article distributed under the terms of the Creative Commons Attribution License (CC BY). The use, distribution or reproduction in other forums is permitted, provided the original author(s) and the copyright owner(s) are credited and that the original publication in this journal is cited, in accordance with accepted academic practice. No use, distribution or reproduction is permitted which does not comply with these terms.
*Correspondence: Alessandro Aiuppa, YWxlc3NhbmRyby5haXVwcGFAdW5pcGEuaXQ=