 Ting Xiong1,2
 Leli Cheng3,4*Dongming Guo5Lijun Guan2Qiangtao Jiang2Hu Zhangming1,6Senlin Yin4Gongyang Chen4
- 1School of Geosciences, Yangtze University, Wuhan, Hubei, China
- 2Shenzhen Branch of CNOOC Ltd, Shenzhen, Guangdong, China
- 3State Key Laboratory of Petroleum Resources and Prospecting, China University of Petroleum, Beijing, China
- 4Institute of Logging Technology and Engineering, Yangtze University, Jingzhou, Hubei, China
- 5China-France Bohai Geoservices Co Ltd, Tianjin, China
- 6Geological Research Institute of Western Drilling Engineering Co Ltd, Kelamayi, Xinjiang, China
The accurate understanding of the origin of overpressure is the basis of formation pressure research and the core work of determining the distribution of formation pore pressure in drilling design. The deep water area of Baiyun Sag in the Pearl River Mouth Basin in the northern margin of the South China Sea has been proved to be a hydrocarbon rich depression. In recent years, overpressure has been encountered in the middle and deep layers, but the geological origin of the overpressure in the deep water area are still unclear. Therefore, the pore pressure profile of the Baiyun Sag was evaluated using the data of drilling and seismic velocity, and the relationship between overpressure and the generation mechanism was established. Most of the surrounding and shallow strata of Baiyun Sag show normal pressure, while the middle and deep strata generally show overpressure, with the maximum pressure coefficient up to 1.55. The overpressure zone mainly develops from the middle of Zhujiang Formation to the upper member of Enping Formation. The mudstone resistivity and density values of the two typical Wells deviated from the normal trend. The density showed a constant trend with the increase of depth, while the resistivity showed a certain degree of reversal. The upper layer of the overpressure zone showed abnormally high resistivity values, corresponding to the overgland and transition zone formed by high carbonate content. There is no obvious increase of porosity in the overpressured sandstone strata of Baiyun sag, which does not have the characteristics of undercompaction. The velocity in the overpressure section of the two Wells varies greatly, and the density is basically unchanged or slightly decreased. It is concluded that the overpressure is caused by fluid expansion from hydrocarbon-generation. The large-scale and long-term fluid expansion caused by hydrocarbon generation and expulsion of source rocks provides the power source for the formation of overpressure in Baiyun sag. The distribution of effective source rocks has a controlling effect on the distribution range of overpressure. The tight sandstone strata in the Zhuhai, Wenchang and Enping formations become the cover layer of the overpressure system in the longitudinal direction.
1 Introduction
Accurate understanding of formation pore pressure before opening the formation is an important part of reducing drilling risk and cost (Yassir and Bell, 1996). In drilling operations, proper drilling fluid density sequence is the core content of drilling design, and a clear formation pore pressure distribution is the premise of this work (Slavin and Smirnova, 1998). Depending on the sequence of drilling operations, formation pore pressure can be evaluated in two ways: monitoring and forecasting. Formation pressure monitoring generally starts from the comparison of Wells before drilling (Osborne and Swarbrick, 1997). The formation pressure is calculated in combination with the new dynamic data during drilling, which is used to adjust the drilling fluid performance and drilling strategy in real time (Hunt et al., 1994). Formation pressure prediction is to evaluate formation pressure using seismic and well drilled data in order to calculate formation pressure as accurately as possible before drilling (Hao et al., 2002). The prediction of formation pressure is generally based on the basic theories of Terzaghi and Biot theorem (Belonin and Slavin, 1998). Quantitative models such as Eaton method and Bowers method have been developed for pressure calculation, but these models are based on the premise of correctly understanding the causes of overpressure (Bowers G L, 1995; Luo and Vasseur, 1996; Peter et al., 2004; Lahann and Swarbrick, 2011; Zhao et al., 2018).
As for the research on the causes of overpressure, unbalanced compaction was believed to be the main reason for the formation of overpressure in the early stage, and then hydrocarbon generation expansion gradually came into people's view (Teige et al., 1999; Mark et al., 2009; Guo et al., 2010). The contribution of other causes of overpressure, especially the montmorillite-illite transformation, tectonic extrusion, pressure transfer, etc. to the formation of overpressure has been discovered and confirmed (Guo et al., 2011, 2012). The authors propose that the overpressure in the tensioning basin is mainly caused by unbalanced compaction and hydrocarbon generation, which develop at different diagenetic stages and burial depths Xu et al., 2019a.
The deep water area of Baiyun Sag in the Pearl River Mouth Basin in the northern continental margin of the South China Sea is a hydrocarbon rich depression which has been proved by exploration practice (Figure 1) (Sun et al., 2011). It has the characteristics of hydrocarbon resources, which are both oil-gas generation and gas-dominated (Shi et al., 2007; Hu et al., 2021). In recent years, the Enping Formation has encountered overpressure in the middle and deep depths, but the distribution and geological origin of the overpressure in the deep water area are still unclear (Figure 2) (Li et al., 2012; Han et al., 2017). Due to the lack of offshore drilling data, unclear classification of overpressure causes and unclear response characteristics of LWD (Logging While Drilling) data, the prediction accuracy of pre-drilling overpressure in this area is low, and drilling accidents related to formation overpressure often occur in drilling practice, which not only affects the exploration results, but also causes considerable economic losses. Therefore, the pore pressure profile of the Enping Formation in the Baiyun Sag was evaluated using the data of well drilling and seismic velocity, and the relationship between overpressure and the generation mechanism was established.
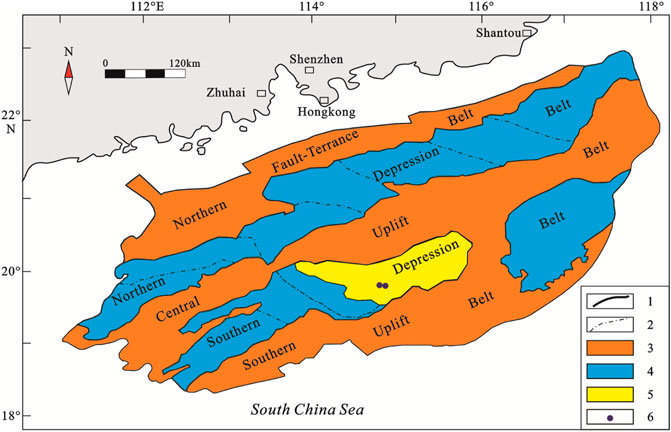
FIGURE 1. The Paleogene tectonic units of the Pearl River Mouth basin (adapted after Wang et al., 2017). 1 boundary of first-order tectonic unit, 2 boundary of second-order tectonic unit, 3 forward direction structure, 4 Negative direction structure, 5 Location of study area, 6 drilling wells position.
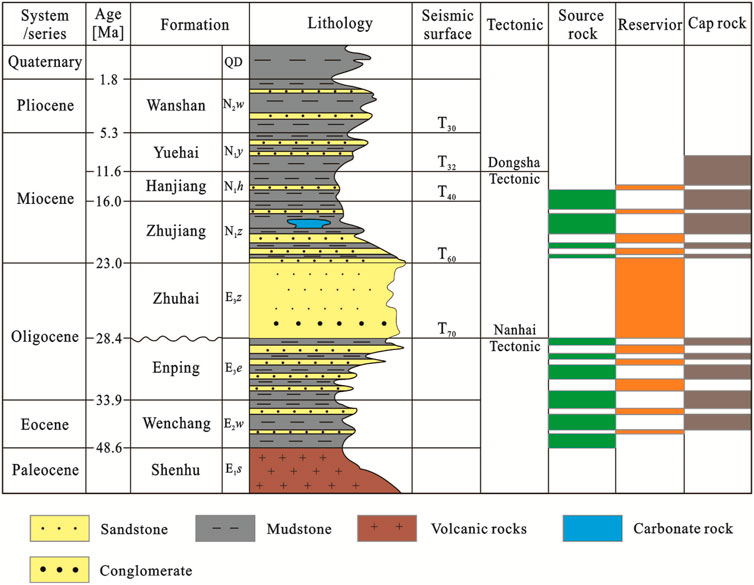
FIGURE 2. Stratigraphic column for the Baiyun Sag.
2 Geologic setting
Located in the slope area of the northern continental shelf of the South China Sea, the Pearl River Mouth Basin is a Cenozoic passive continental margin extensional faulted basin, which is divided into five northeastern tectonic units from north to south, including the Northern Fault Step Zone and Depression Zone, the Central Uplift Zone, the Southern Depression Zone and Uplift Zone (Zhang et al., 2014). Each tectonic unit is further divided into several secondary depressions and low uplift, among which the Baiyun Sag in the south is the largest and deepest secondary depression. Influenced by the collision of Indo-Australian plate and Eurasian plate, subduction of Pacific plate and mantle plume arching, the Pearl River Mouth Basin is a Mesozoic and Cenozoic oil-bearing basin formed on the basement of Caledonian, Hercynian and Yanshanian folds (Wang et al., 2017). Baiyun Sag is located in the transition zone and upper slope area of the southwest Pearl River Mouth Basin (Figure 1) (Sun et al., 2014). It is a negative structural unit with long-term stable subsidence. In general, it is NEE trending, Panyu Low Uplift in the north, and adjacent to Shenhu Dark sand uplift and the second pearl depression in the west by a NW trending basement fault and magmatic activity zone. The east side is the Dongsha Uplift (Li et al., 2013a). Due to the downward slope of the depression facing the outlet of the Pearl River, there is sufficient supply of terrigenous sediments, and the lacustrine source rocks with large thickness are developed, and their deposition and filling are characterized by unilateral lateral transport of sediments. Therefore, the Cenozoic sedimentary filling characteristics of Baiyun Sag show the evolution law of “coarser lower and finer upper, from land to sea, from shallow water to deep water, and from over-compensation to under-compensation”. Baiyun Sag is located in the transitional zone between continental crust and oceanic crust (Zheng et al., 2012). The sedimentary basement is mainly medium-acid magmatic rocks, followed by metamorphic rocks and basic rocks. The crust thickness is relatively thin, generally ranging from 18 km to 28 km. The geothermal gradient is 31.5°C–41°C/hm, which belongs to the depression with high geothermal field (Han et al., 2017). The Baiyun Sag is mainly filled with the Eocene lacustrine sedimentary Wenchang Formation, the Lower Oligocene fluvial lacustrine coal measure sedimentary Enping Formation, the Upper Oligocene shallow Marine shelf-delta sedimentary Zhuhai Formation, the Lower Miocene deep water continental slop-deep water fan sedimentary Zhujiang-Hanjiang Formation, Late Miocene Yuehai Formation, Pliocene Wanshan Formation and Quaternary (Li et al., 2012).
3 Pore pressure estimation methods
Using drilling and seismic data, we apply different methods to calculate or measure pore formation pressure.
3.1 Eaton’s prediction method
The original Eaton method is a method to calculate formation pressure based on the normal compaction trend line proposed by Eaton in 1972. It is one of the most widely used formation pressure determination methods in petroleum industry. Eaton (1976) established the expression of the relationship between formation pore pressure and logging acoustic time difference based on the experience and theoretical analysis in the Gulf of Mexico and other areas. This relationship does not change with the lithology or depth. The principle is that the change of pressure gradient of overlying strata determines the relationship between the ratio of actual and normal trend values of observed compaction parameters and formation pore pressure (Eaton B A, 1976). In the face of different overpressure causes, the coincidence rate of calculation results can be improved by adjusting the index N. Its expression is:
where, Pp is the formation pore pressure; Po is the overburden pressure; Ph is normal hydrostatic pressure; tn, Vn, Rn, Cn, ρn, dcn are divided into the sonic time difference, sonic velocity, resistivity, electrical conductivity, density and dc index of the normal trend line of a certain depth of mud shale. to, V0, Ro, C0, ρ0, dc are respectively measured sonic time difference, sonic velocity, resistivity, electrical conductivity, density and dc index of mud shale at a given depth. N is the Eaton index and the coefficient related to strata.
3.2 Bowers’ prediction method
Bowers method was put forward by Bowers in 1995. It systematically considered the formation mechanism of mudstone's unbalanced compaction and other overpressures, and unified the other overpressure causes with the concept of pore fluid expansion (Dutta, 2002). Finally, the overpressure causes were summarized into two main factors: unbalanced compaction and pore fluid expansion. Since the uneven compaction of mudstone and pore fluid expansion show two opposite processes in the stress-strain curve of the sedimentation and overloading process, namely the sedimentation and overloading process and the unloading process, the sedimentation and overloading process is the process in which the vertical effective stress continues to increase or remain unchanged (Bowers G L, 2002). The relation curve of acoustic velocity and vertical effective stress of mudstone reflecting this process is called sedimentation and compaction curve. The unloading process refers to the process in which the vertical effective stress decreases. The unloading curve is the relationship between the acoustic velocity of mudstone and the vertical effective stress reflecting this process (Rrmdhan and Goulty, 2011). The core of Bowers’ method is that the overpressure caused by uneven compaction of mudstone should be determined by the compaction curve to determine the vertical effective stress, while the abnormal high pressure caused by pore fluid expansion should be determined by the unloading curve to determine the vertical effective stress. Then the effective stress theorem is used to calculate the formation pore pressure, that is, the overburden pressure and the vertical effective stress are used to determine the formation pore pressure. It is generally considered that this method does not require the establishment of a normal compaction trend line, but the process of establishing a loading curve is equivalent to the way of establishing a trend line.
Within the stress range of research significance, the original sedimentary loading curve of mudstone can be described as follows:
The unloading curve can be described as follows:
where, V is the acoustic velocity of mudstone, σev is the vertical effective stress, A and B are the relevant constant coefficients, σmax and Vmax are the maximum vertical effective stress and the corresponding acoustic velocity at the beginning of unloading, and U is the elastic-plastic coefficient of mudstone.
3.3 MDT method
The Modular Formation Dynamics Tester (Zhang et al., 2020) has become an indispensable part of formation testing projects in oil and gas Wells due to its superior testing performance and reliability. In the study area, MDT pressure sampling was performed in almost all evaluation Wells drilled with a certain hydrocarbon display. With the widespread application of MDT cable formation testing, a series of reservoir parameters can be obtained by scientific and reasonable analysis of pressure measurement data, such as formation pressure gradient, temperature gradient, and fluidity, which reflects the physical properties of the reservoir. In general, due to reservoir properties, it is not possible to measure all pressure points in MDT tests as effective points. Overpressure points, leakage points (seat seal failure) and dry points are often detected.
3.4 Abnormal drilling mud density and gas measurement
In the process of drilling, gas anomalies in gas logging are often the display of abnormally high pressure zones, including background gas, single root gas, aftereffect gas, drilling gas, and suction gas, etc. Therefore, the existence of overpressure can be predicted according to drilling fluid gas penetration and formation pressure can be judged in an auxiliary way. Tingay et al. (2013) summarized six principles for formation pressure determination by logging gas measurement:
1) If the background gas is normal and there is no gas infiltration from the borehole wall, PP (pore pressure)< Swab (swab pressure)< ESD (Equivalent Static Density)< ECD (equivalent circulating density);
2) If the background gas is normal and there is sporadic wall infiltration gas, Swab < PP < ESD < ECD;
3) If the background gas is normal and there is continuous borehole penetration gas, Swab < ESD < PP < ECD;
4) If the background gas increases and there is sporadic or continuous penetration into the wellbore, Swab < ESD < ECD < PP;
(5)If there is a large increase in background gas and borehole infiltration gas cannot be identified, Swab < ESD < ECD << PP;
6) If there is a good correspondence between the decrease of gas total and the increase of ECD, then PP > ECD.
4 Results interpretation
4.1 Characteristics of measured pressure
According to the results of MDT sampling analysis, the salinity of formation water in the study area ranges from 27,472 to 306,328 g/L, and the formation water is mainly of CaCl2 type. The density of formation water is about 1,004–1,074 g/cm3, and the hydrostatic pressure gradient is 0.98–1.05 MPa/hm. The average value is about 1.02 MPa/hm. In this paper, pressure coefficient 1.2 is used as the boundary between normal pressure system and overpressure system. According to the statistics of 43 measured pressure values of seven Wells with MDT measured pressure data in Baiyun Sag, most of the measured pressure values in the periphery and shallow area of the sag are normal pressure, with pressure coefficient ranging from 0.9 to 1.0, while the deep area is generally overpressure, with pressure coefficient exceeding 1.3 and up to 1.55 (Figure 3).
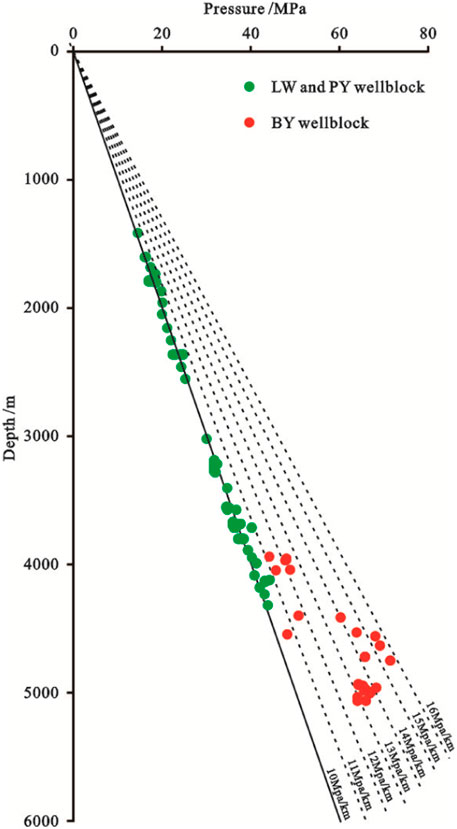
FIGURE 3. Pore pressure coefficient profile of the study area.
4.2 Characteristics of mudstone overpressure response
The measured MDT pressure can obtain the information of pressure and temperature of permeable rock strata, which can directly reflect the formation pressure state of the test interval. However, the longitudinal continuous pressure distribution profile of a large set of strata cannot be obtained, and it is generally difficult to obtain effective MDT data points in mudstone interval. Therefore, it is necessary to use geophysical logging data to study the longitudinal continuous response characteristics of overpressure in mudstone and sandstone intervals, and further identify the overpressure zone in combination with MDT testing of sandstone intervals (Bowers, 1995; Dutaa, 2002; Najibi et al., 2017). Previous studies have shown that the overpressure zone generally has the characteristics of low acoustic velocity, while the resistivity logging response to overpressure is complex, and the density logging presents abnormally low density values for the overpressure zone caused by undercompaction. According to the relationship between mudstone acoustic velocity, mudstone resistivity, density and other logging data and formation pore pressure calculation results (Figures 4, 5), the interface depth of the overpressure top in well BY01 is 3,550 m Figure 4, and from the depth to the bottom hole 5,050 m, the mudstone acoustic velocity deviates from the normal compaction trend, resulting in abnormal low acoustic velocity. The overpressure system runs from the middle part of the Pearl River Formation to the top of the Enping Formation. At a depth of 4,625 m, the MDT measured formation pressure of sandstone in the middle section of Zhujiang Formation is 69.23 MPa, and the pressure coefficient is 1.54, which corresponds to the maximum pressure point estimated by mudstone acoustic velocity. The acoustic time difference of well BY02 Figure 5 sandstone also deviates from normal compaction, and the amplitude is similar to or slightly smaller than mudstone. The interface depth of the overpressure top in well BY02 is 3,780 m. From the depth to the bottom hole of 5,120 m, the acoustic velocity of mudstone deviates from the normal compaction trend, resulting in abnormal high acoustic time difference. The overpressure system runs from the middle of Zhujiang Formation to the top of Enping Formation at a depth of 4,745 m, and the measured formation pressure value of MDT is 71.5 MPa and the pressure coefficient is 1.55. The pressure coefficient predicted by the maximum pressure position corresponding to the acoustic time difference of mudstone is about 1.56. The mudstone resistivity and density values of the two typical Wells deviated from the normal trend. The density showed a constant trend with the increase of depth, while the resistivity showed a certain degree of reversal. The upper layer of the overpressure zone showed abnormally high resistivity values, corresponding to the overgland and transition zone formed by high carbonate content. The overpressure logging response shows that the overpressure zone in Baiyun sag is mainly developed from the middle part of Zhujiang Formation to the upper part of Enping Formation.
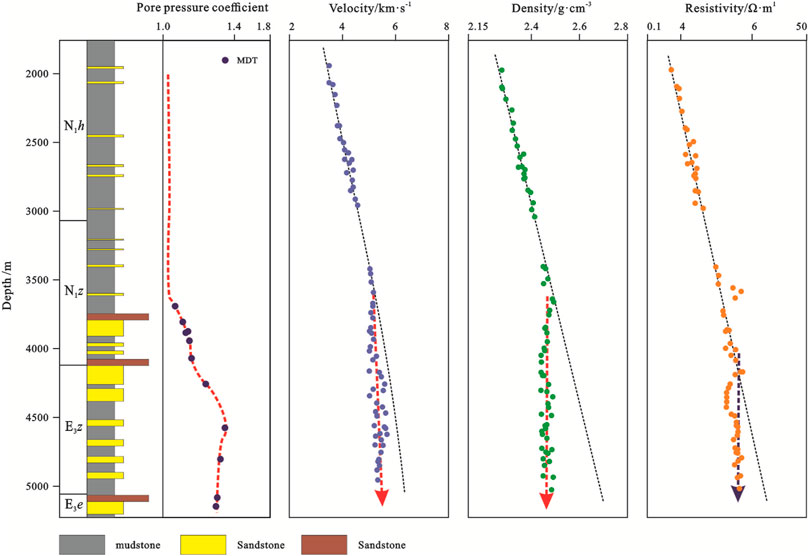
FIGURE 4. Calculation results of pore formation pressure and depth profiles of well-logging parameters, including velocity, density, resistivity and MDT data from Well BY01.
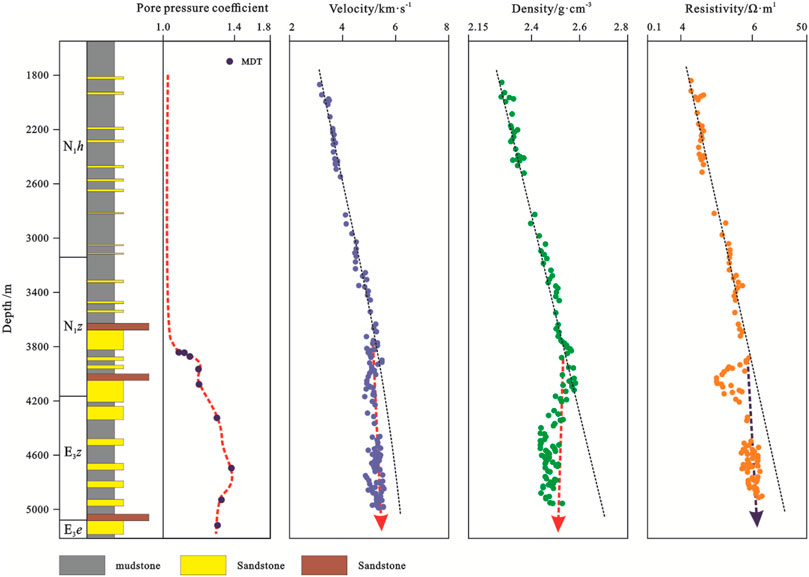
FIGURE 5. Calculation results of pore formation pressure and depth profiles of well-logging parameters, including velocity, density, resistivity and MDT data from Well BY02.
4.3 Pore pressure profile
The data of this study came from the MDT measured temperature and pressure data of seven Wells in Baiyun Sag. There were 53 measured pressure data, and the data points were concentrated in the depth range of 1,300–5,000 m. According to different horizons, Baiyun Sag is divided into four sets of overpressure systems: Zhujiang Formation, Zhuhai Formation, Enping Formation and Wenchang Formation (Figure 3, Figure 6). On the whole, the measured pressure in the shallow layer of Baiyun Sag is mainly normal pressure, and the pressure coefficient is mainly distributed in the range of 0.95–1.05, while there is overpressure in the middle and deep layer, and the pressure coefficient is greater than 1.3. Among them, the Pearl River Formation presents overpressure in some areas, and the pore pressure coefficient is up to 1.4. The formation of Zhuhai Formation presents overpressure in some areas, and the maximum pore pressure coefficient is about 1.5. The Enping Formation presents overpressure in most areas, and the maximum pore pressure coefficient can reach 1.6. It is speculated that overpressure is common in Wenchang Formation, and the maximum pore pressure coefficient is more than 1.6.
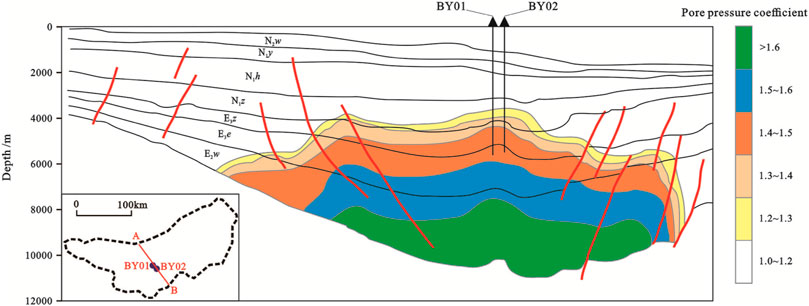
FIGURE 6. Profile distribution of pressure coefficient in Baiyun sag (Modified from Tian et al., 2020)
5 Discussion
5.1 Cause of overpressure in Baiyun Sag
The stress action and fluid expansion in the process of rock compaction are two widely recognized overpressure formation mechanisms (Eaton, 1976; Guo et al., 2010), and the geological factors leading to the formation of overpressure usually include: tectonic extrusion, undercompaction, hydrocarbon generation, crude oil cracking, hydrothermal action, clay mineral dehydration, etc Xu et al., 2019b. Based on the analysis of geological conditions and geophysical parameters, it is concluded that the overpressure in the middle and deep Baiyun Sag does not have the characteristics of undercompaction, and the main cause of the overpressure is fluid expansion. The formation of undercompaction and overpressure usually requires high deposition rate and large sets of mudstone deposition. However, the depositional environment of Zhuhai Formation in the BY well area of Baiyun Sag is continental shelf delta front, and the depositional environment of the upper member of Enping Formation is braided river delta plain, which lacks the development background of large sets of mudstone and does not have the geological conditions for the formation of undercompaction and overpressure. In addition, rock porosity and pore structure are the key parameters that reflect undercompaction and overpressure. No significant increase of porosity has been observed in sandstone strata in the overpressure section of Baiyun Sag. Thin section identification of reservoir rocks in the overpressure section shows that lineal contact and serrated contact are dominant among the grains (Figure 7A), or the physical properties are dense due to the filling of carbonate cements between grains (Figure 7B), reaching the middle diagenetic stage B. It does not have the characteristics of undercompaction.
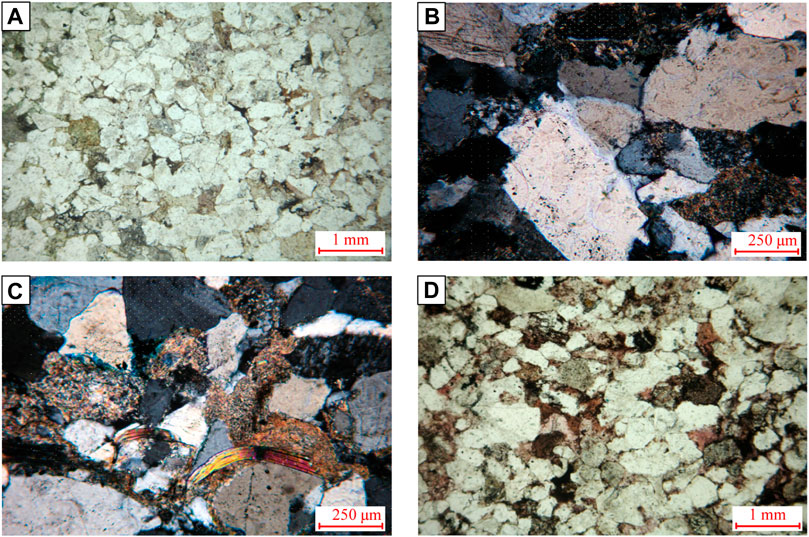
FIGURE 7. Microscopic characteristics of sandstone reservoir in overpressure section (A) The sandstone appears to have low porosity under the microscope, BY01-2987m; (B,C) Concave-line contact between particles, BY01-3025m; (D) A large amount of carbonate cements are filled between particles, BY02-3231 m.
Bowers. (1995) summarized the relationship between effective stress-velocity and effective stress-density in the overpressure section caused by undercompaction and fluid expansion, and pointed out that the overpressure caused by undercompaction was located on the stress loading curve, while the overpressure caused by fluid expansion was located on the upper part of the stress unloading curve. As indicated by the velocity-effective stress identification chart in this area, the overpressure section generally shows a tendency to deviate from normal compaction (Figures 8A, C), which is the cause of fluid expansion. Lahann and Swarbrick, (2011) proposed that the dension-velocity intersection diagram could distinguish the overpressure caused by dehydration of clay minerals from that caused by hydrocarbon-generation. The overpressure mudstone caused by dehydration of clay minerals showed a significant decrease in acoustic velocity and a slight increase in density, while the overpressure mudstone caused by fluid expansion caused by hydrocarbon-generation basically remained unchanged or slightly decreased in density. On the rate-density chart, the velocities in the overpressure section of the two Wells varied greatly, and the density remained basically unchanged or slightly decreased. It can also be concluded that the overpressure in the area was mainly caused by fluid expansion caused by hydrocarbon generation (Figures 8B, D).
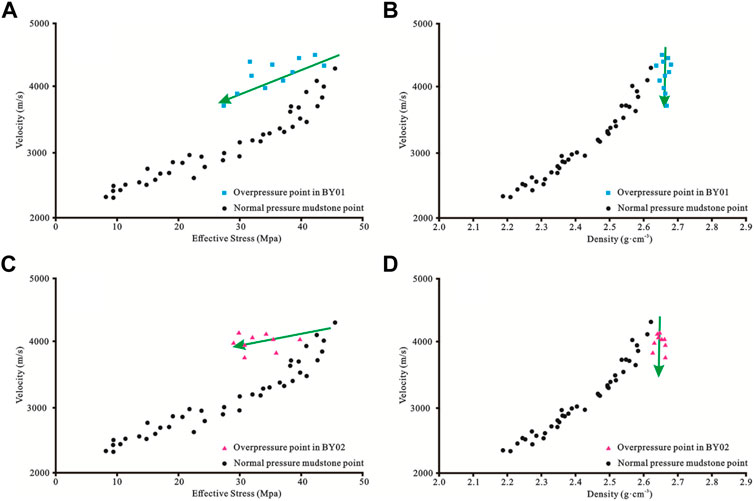
FIGURE 8. The genetic mechanism of overpressure is identified in Baiyun Sag, the plate according in Bowers (1995). (A,B) drop point results of Paleogene mudstone data in Well BY01. (C,D) drop point results of Paleogene mudstone data in Well BY02.
5.2 Control factors of overpressure distribution
According to the analysis of various geological conditions, the formation and distribution of overpressure in Baiyun Sag are affected by two factors.
1) Hydrocarbon generation and distribution range of source rocks. The Wenchang Formation is a semi-deep lacustrine source rock with TOC content of 0.9%–1.8%. The Enping Formation is dominated by transgressive/Marine source rocks with TOC content of 0.7%–5.4% and Ro of 1.8%–3.5% (about 200°C–260°C) (Mi et al., 2018). According to the results of source rock thermal evolution simulation (Zhang et al., 2014), the Wenchang Formation entered the oil generation stage at 37 Ma, and the late high heat flow event led to the rapid gas generation stage since 16 Ma. Enping Formation also entered the stage of large-scale gas generation since 16 Ma (Hu et al., 2021). Due to the large burial depth and high geothermal gradient of the Wenchang Formation in Baiyun Sag, there is still potential for oil cracking gas on a large scale. The fluid expansion caused by hydrocarbon generation and expulsion in large-scale and long-term source rocks provides the power source for the formation of overpressure in Baiyun Sag. On the other hand, the Eocene Wenchang Formation and Enping Formation are the two main source rocks developed in Baiyun Sag (Zhu et al., 2012; Li et al., 2013b), and the adjacent Zhujiang Formation and Shenhu Formation received oil and gas migration and charging from the former, resulting in formation overpressure. It can be clearly seen on the plane (Figures 9, 10) that the area with the maximum organic matter maturity and effective thickness of the source rocks is consistent with the position with the highest formation pressure coefficient, indicating the control effect of the distribution of the source rocks on the overpressure distribution.
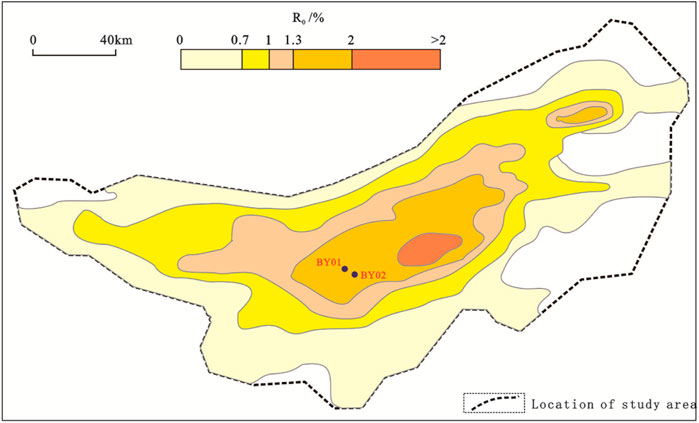
FIGURE 9. Contour map of maturity of organic matter in the Middle of Enping Formation, Baiyun Sag Mi et al., 2018.
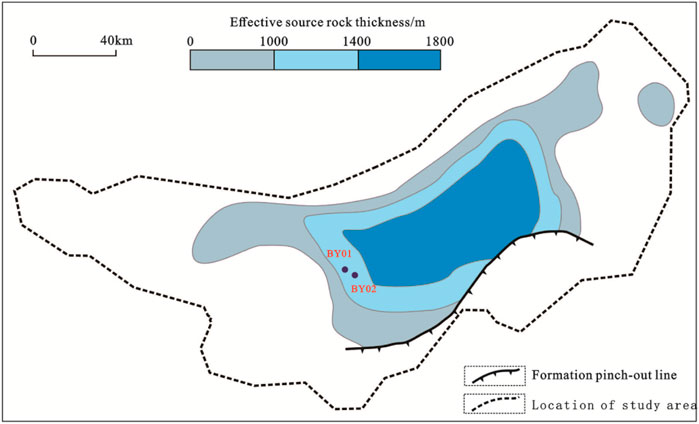
FIGURE 10. Isothickness map of Palaeogene effective source rocks in Baiyun Sag Mi et al., 2018.
2) Formation and distribution of tight strata. Baiyun Sag is characterized by high variable geothermal temperature. With the increase of geothermal gradient, sandstone porosity and permeability decrease significantly (Qing et al., 2018). Previous analysis results of reservoir diagenesis and accumulation system showed that (citation), before the main hydrocarbon charging of 13.8 Ma, the sandstone reservoir of Zhuhai Formation in the middle-high geothermal gradient area of Baiyun Sag had been generally diagenetic densification, and the remaining porosity was reduced from 22.8% to 11.9%, which formed an effective seal on the pressure system of the lower bed. It is not conducive to the expulsion of oil and gas generated by source rocks of Wenchang-Enping Formation. After this period, the deep sandstone reservoirs in Wenchang Formation and Enping Formation were also generally densified in the main accumulation period, which resulted in the poor outflow of oil and gas. Some drilling in Baiyun Sag reveals that the deep strata all have overpressure, the pressure state of sandstone and mudstone interval is closely related, and the overpressure of sandstone originates from mudstone. The overpressure of sandstone is usually the result of the transfer of overpressure fluid from mudstone to sandstone, and the overpressure amplitude in sandstone is usually smaller than or close to the overpressure amplitude in mudstone, which depends on the contact characteristics between sand and mudstone, the ability of fluid transfer and exchange, and the overpressure equilibrium time (Hao et al., 2002). Well BY01 is located in the center of the depression, and the sandstones in the nearly kilometer well section all contain gas. Since Zhuhai Formation, overpressure is common in the formation, and the sandstone reservoir has densification characteristics, while the overpressure top interface is in good consistency with the depth of the tight reservoir (Figures 4, 5), which confirms the sealing effect of the deep tight sandstone adjacent to the source rock.
Conclusion
1) Most of the surrounding and shallow strata of Baiyun sag show normal pressure, while the middle and deep strata generally show overpressure, with the maximum pressure coefficient of 1.55. The overpressure logging response shows that the overpressure zone in Baiyun Sag is mainly developed from the middle part of Zhujiang Formation to the upper part of Enping Formation. The mudstone resistivity and density values of the two typical Wells deviated from the normal trend. The density showed a constant trend with the increase of depth, while the resistivity showed a certain degree of reversal. The upper layer of the overpressure zone showed abnormally high resistivity values, corresponding to the overgland and transition zone formed by high carbonate content.
2) The Zhujiang Formation in Baiyun Sag presents overpressure in some areas, and the pore pressure coefficient is up to 1.4. The formation of Zhuhai Formation presents overpressure in some areas, and the maximum pore pressure coefficient is about 1.5. The Enping Formation presents overpressure in most areas, and the maximum pore pressure coefficient can reach 1.6. It is speculated that overpressure is common in Wenchang Formation, and the maximum pore pressure coefficient is more than 1.6.
3) There is no obvious increase of porosity in the sandstone strata of the overpressured section of Baiyun Sag, and the thin section identification of the reservoir rocks of the overpressured section shows that the intergranular contact is mainly line contact and serrated contact, which reaches the middle petrogenesis stage B, and the sandstone does not have the characteristics of undercompaction. According to the velocity density chart, the velocity of the overpressure section of the two Wells varies greatly, and the density is basically unchanged or slightly decreased. It is concluded that the overpressure in this area is mainly caused by fluid expansion caused by hydrocarbon-generation.
4) The large-scale and long-term fluid expansion caused by hydrocarbon generation and expulsion of source rocks provides a power source for the formation of overpressure in Baiyun Sag, and the distribution of effective source rocks has a controlling effect on the distribution range of overpressure. The sandstone reservoirs in Zhuhai Formation, Wenchang Formation and Enping Formation were generally densified before a large amount of oil and gas was generated, which resulted in the poor outflow of oil and gas, and these tight strata became the cover of overpressure system in the longitudinal direction.
Data availability statement
The datasets presented in this article are not readily available because The research data involved trade secrets. Requests to access the datasets should be directed to Leli Cheng, chengleli@yangtzeu.edu.cn.
Author contributions
TX completed the main processing and analysis work, LC established the framework and completed the paper writing, DG, LG, and QJ provided the data, HZ processed part of the data, SY and GC modified the paper and put forward useful suggestions.
Funding
This study was supported by the Foundation of State Key Laboratory of Petroleum Resources and Prospecting, China University of Petroleum, Beijing (No. PRP/open-2104).
Acknowledgments
The author acknowledges the support of operation geoscience team in Shenzhen Branch of CNOOC Ltd., for their technical input throughout the period of this research.
Conflict of interest
Authors TX, LG, QJ, were employed by Shenzhen Branch of CNOOC Ltd. Author GD was employed by China-France Bohai Geoservices Co Ltd. Author HZ was employed by Geological Research Institute of Western Drilling Engineering Co Ltd.
The remaining authors declare that the research was conducted in the absence of any commercial or financial relationships that could be construed as a potential conflict of interest.
Publisher’s note
All claims expressed in this article are solely those of the authors and do not necessarily represent those of their affiliated organizations, or those of the publisher, the editors and the reviewers. Any product that may be evaluated in this article, or claim that may be made by its manufacturer, is not guaranteed or endorsed by the publisher.
References
Belonin, M. D., and Slavin, V. I. (1998). Abnormally high formation pressures in petroleum regions of Russia and other countries of the C. I. S. AAPG Mem. 70, 155–171. doi:10.1306/M70615C7
Bowers, G. L. (2002). Detecting high overpressure. Lead. Edge 21 (2), 174–177. doi:10.1190/1.1452608
Bowers, G. L. (1995). Pore pressure estimation from velocity data: Accounting for overpressure mechanisms besides undercompaction. Int. J. Rock Mech. Min. Sci. Geomechanics Abstr. 31, 276. doi:10.2118/27488-PA
Dutta, N. C. (2002). Geopressure prediction using seismic data: Current status and the road ahead. Geophysics 67 (6), 2012–2041. doi:10.1190/1.1527101
Eaton, B. A. (1976). Graphical method predicts geopressures worldwide. World . 183 (1), 51–56. doi:10.1016/0038-092X(76)90080-3
Guo, X., He, S., Liu, K., Song, G., Wang, X., and Shi, Z. (2010). Oil generation as the dominant overpressure mechanism in the cenozoic dongying depression, bohai bay basin, China. AAPG Bull. 94 (12), 1859–1881. doi:10.1306/05191009179
Guo, X., He, S., Zheng, L., and Wu, Z. (2011). A quantitative model for the overpressure caused by oil generation and its influential factors. Acta Pet. Sin. 32 (3), 637–644. doi:10.7623/syxb201104011
Guo, Z., Liu, Z., Lv, R., et al. (2012). Predrill prediction of formation pressure using seismic data in deep-water area of Baiyun Depression,northern South China Sea. Oil Geophys. Prospect. 47 (1), 126–132. (in chinese).
Han, Y., Chen, Y., Yang, H., Wang, L., Shen, H., Guo, S., et al. (2017). Source to sink" of enping Formation and its effects on oil and gas exploration in baiyun sag, Pearl River Mouth basin. china pet. Explor. 22 (2), 25–34. (in chinese). doi:10.3969/j.issn.1672-7703.2017.02.003
Hao, F., Zou, H., Ni, J., et al. (2002). Evolution of overpressured systems in sedimentary basins and conditions for deep. oil/gas Accumul. 27 (5), 20–28. (in chinese). doi:10.3321/j.issn:1000-2383.2002.05.022
Hu, J., Long, Z., Huang, Y., Zhang, L., Hu, D., Wang, Y., et al. (2021). Tectono-thermal modelling of baiyun sag, perrl River Mouth basin, since cenozoic. Chin. J.s Geophys. 64 (5), 1654–1665. (in chinese). doi:10.6038/cjg202100413
Hunt, J. M., Whelan, J. K., Eglinton, L. B., et al. (1994). Gas generation-a major cause of deep Gulf Coast overpressure. Oil Gas J. 92 (29), 59–63. doi:10.2118/24117-PA
Lahann, R. W., and Swarbrick, R. E. (2011). Overpressure generation by load transfer following shale framework weakening due to smectite diagenesis. Geofluids 11 (4), 362–375. doi:10.1111/j.1468-8123.2011.00350.x
Li, Y., Fu, N., and Zhang, Z. (2013b). Hydrocarbon source conditions and origins in the deepwater area in the northern South China Sea. Acta Pet. Sin. 34 (2), 247–254. (in chinese). doi:10.7623/syxb201302006
Li, Y., Zheng, R., Zhu, G., Boyu, G., and Xiaoqing, H. (2013a). Deep-water depositional features of Miocene Zhujiang Formation in baiyun sag, Pearl River Mouth basin. Earth Sci. Froontiers 87 (1), 197–210. (in chinese). doi:10.1111/1755-6724.12041
Li, Y., Zheng, R., Zhu, G., et al. (2012). Deep-water tractive deposition in Zhujiang formatioBaiyun sag,Zhujiang River Mouth Basin and its geological implications. Acta Oceanol. Sin. 34 (1), 127–135. (in chinese).
Luo, X. R., and Vasseur, G. (1996). Geopressuring mechanism of organic matter cracking: Numerical modlling. AAPG Bull. 80 (6), 856–874. doi:10.1306/64ED88EA-1724-11D7-8645000102C1865D
Mark, R. P., Richard, R. H., Richard, E. S., Swarbrick, R. E., Morley, C. K., and Damit, A. R. (2009). Origin of overpressure and pore pressure prediction in the Baram Province, Brunei. AAPG Bull. 93 (1), 51–74. doi:10.1306/08080808016
Mi, L., Zhang, Z., Xiong, P., Liu, J., Zhang, B., Zhao, Q., et al. (2018). Main controlling factors of hydrocarbon accumulation in Baiyun Sag at northern continental margin of South China Sea. Petroleum Explor. Dev. 45 (5), 963–973. (in chinese). doi:10.1016/s1876-3804(18)30100-9
Najibi, A. R., Ghafoori, M., Lashkaripour, G. R., and Asef, M. R. (2017). Reservoir geomechanical modeling: In-situ stress, pore pressure, and mud design. J. Petroleum Sci. Eng. 151, 31–39. doi:10.1016/j.petrol.2017.01.045
Osborne, M. J., and Swarbrick, R. E. (1997). Mechanisms for generating overpressure in sedimentary basins: A reevalution. AAPG Bull. 81 (6), 1023–1041. doi:10.1306/522B49C9-1727-11D7-8645000102C1865D
Peter, V. R., Richard, H., and Peter, T. (2004). The origin of overpressure in the carnarvon basin, western Australia: Implications for pore pressure prediction. Pet. Geosci. 10, 247–257. doi:10.1144/1354-079302-562
Qing, Y., Mei, L., Shi, H., Camanni, G., Shu, Y., Wu, J., et al. (2018). The Late Cretaceous tectonic evolution of the South China Sea area: An overview, and new perspectives from 3D seismic reflection data. Earth-Science Rev. 187, 186–204. doi:10.1016/j.earscirev.2018.09.013
Rrmdhan, A. M., and Goulty, N. R. (2011). Overpressure and mudrock compaction in the lower kutai basin, Indonesia: A radical reappraisal. AAPG Bull. 95 (10), 1725–1744. doi:10.1306/02221110094
Shi, W., Chen, H., Chen, C., Pang, X., and Zhu, M. (2007). Pressure evolution and hydrocarbon migration in the Baiyun sag, Pearl River Mouth basin, China. Front. Earth Sci. China 1 (2), 241–250. (in chinese). doi:10.1007/s11707-007-0030-5
Slavin, V. I., and Smirnova, E. M. (1998). Abnormally high formation pressures: Origin, prediction, hydrocarbon field development, and ecological problems. Abnorm. Press. hydrocarbon Environ. 70, 105–114. doi:10.0000/PMID14070
Sun, J., Zhan, W., and Qiu, X. (2011). Relationship between tectonic evolution and pertroleum systems in baiyun sag,pearl river mouth basin. Mar. Geol. Quat. Geol. 31 (1), 101–108. (in chinese). doi:10.3724/sp.j.1140.2011.01101
Sun, Y., Zhao, T., and Ke, Q. (2014). Numerical simulation of pverpressure of shallow water flow in baiyun sag of the northern south China sea. Adv. Earth Sci. 29 (9), 1055–1064. (in chinese). doi:10.11867/j.issn.1001-8166.2014.09.1055
Teige, G. M. G., Hermanrud, C., Wensaas, L., and Nordgard Bolas, H. (1999). The lack of relationship between overpressure and porosity in North Sea and Haltenbanken shales. Mar. Petroleum Geol. 16 (4), 321–335. doi:10.1016/s0264-8172(98)00035-x
Tian, L., Zhang, Z., Xiong, P., et al. (2020). Characteristics of overpressure development in the mid-deep strata of Baiyun sag and its new enlightenment in exploration activity. China Offshore Oil Gas 32 (6), 1–11. (in chinese).
Tingay, M. R. P., Morley, C. K., Laird, A., Limpornpipat, O., Krisadasima, K., Pabchanda, S., et al. (2013). Evidence for overpressure generation by kerogen-to-gas maturation in the northern Malay Basin. AAPG Bull. 97 (4), 639–672. doi:10.1306/09041212032
Wang, K., Zhang, G., Yang, H., et al. (2017). Thermal evolution of source rock and prediction of petroleum resources potential in Baiyun Depression, deep-water area of the northern South China Sea. J. Trop. Oceanogr. 36 (1), 25–34. (in chinese). doi:10.11978/2016047
Xu, S., Hao, F., Xu, C., Zou, H., and Gao, B. (2019a). Seismic geomorphology and sedimentology of fluvial-dominated delta: Implications for the Neogene reservoirs, Offshore Bohai Bay Basin, China. AAPG Bulletin 103, 2399–2420. doi:10.1306/0130191522517122
Xu, S., Hao, F., Xu, C., Zou, H., Zhang, X., Zong, Y., et al. (2019b). Hydrocarbon migration and accumulation in the northwestern Bozhong subbasin, Bohai Bay basin, China. J. Pet. Sci. Eng. 172, 477–488. doi:10.1016/j.petrol.2018.09.084
Yassir, N., and Bell, J. S. (1996). Abnormally high fluid pressures and associated porosities and stress regimes in sedimentary basins. SPE Form. Eval. 11 (1), 5–10. doi:10.2118/28139-pa
Zhang, G., Yang, H., Chen, Y., et al. (2014). The baiyun sag: A giant rich gas-generation sag in the deepwater area of the Pearl River Mouth basin. Nat. Gas. Ind. 34 (11), 11–25. (in chinese). doi:10.3787/j.issn.1000-0976.2014.11.002
Zhang, X., Chen, H. H., Kong, L. T., and Long, Z. (2020). The coupling relationship between paleofluid pressure evolution and hydrocarbon-charging events in the deep of Biyang Depression, Central China. Earth Sci. 46 (5), 1769–1781. doi:10.3799/dqkx.2019.187
Zhao, J., Li, J., and Xu, Z. (2018). Advances in the origin of overpressures in sedimentary basins. Petroleum Res. 3 (1), 1–24. (in chinese). doi:10.1016/j.ptlrs.2018.03.007
Zheng, R., Ma, Q., Yang, B., et al. (2012). Characteristics of Miocene Zhujiang Formation submarine fan sandstone reservoirs in baiyun sag,Pearl River Mouth basin,China. J. Chengdu Univ. Technol. Sci. Technol. Ed. 39 (5), 455–462. (in chinese).
Keywords: Pearl River Mouth Basin, Baiyun Sag, overpressure characteristics, controlling factors, overpressure origin
Citation: Xiong T, Cheng L, Guo D, Guan L, Jiang Q, Zhangming H, Yin S and Chen G (2023) Overpressure characteristics and geological origin of the paleogene in Baiyun Sag, Pearl River Mouth Basin. Front. Earth Sci. 11:1118443. doi: 10.3389/feart.2023.1118443
Received: 07 December 2022; Accepted: 06 February 2023;
Published: 17 February 2023.
Edited by:
Zhigang Li, School of Earth Sciences and Engineering, Sun Yat-sen University, Zhuhai Campus, ChinaReviewed by:
Shang Xu, China University of Petroleum, Huadong, ChinaYinhui Zuo, Chengdu University of Technology, China
Shaoze Zhao, Chengdu University of Technology, China
Copyright © 2023 Xiong, Cheng, Guo, Guan, Jiang, Zhangming, Yin and Chen. This is an open-access article distributed under the terms of the Creative Commons Attribution License (CC BY). The use, distribution or reproduction in other forums is permitted, provided the original author(s) and the copyright owner(s) are credited and that the original publication in this journal is cited, in accordance with accepted academic practice. No use, distribution or reproduction is permitted which does not comply with these terms.
*Correspondence: Leli Cheng, Y2hlbmdsZWxpQHlhbmd0emV1LmVkdS5jbg==