 Yang Liu
 Dongdong Han3*
 Wentao Wang
- 1School of Urban Planning and Municipal Engineering, Xi’an Polytechnic University, Xi’an, China
- 2State Key Laboratory of Green Building in Western China, Xi’an University of Architecture and Technology, Xi’an, Shaanxi, China
- 3School of Geological Engineering and Geomatics, Chang’an University, Xi’an, Shaanxi, China
- 4Department of Civil and Environmental Engineering, University of Michigan, Ann Arbor, MI, United States
Lattice beam and prestressed anchor rod are used to enhance stability and prevent failure of soil or rock slopes. In this study, a model of Lattice beam and prestressed anchor rod (LBPAR) system was designed with reinforcement mechanisms and a model test was constructed with a circular slip surface of a loess slope. First, interaction between the loess slope and the LBPAR system was investigated by an LBPAR system analysis model. Stability of sliding mass from the sliding bed with an arc-shaped sliding surface was then studied by an experimental model designed. Finally, internal force distribution of lattice beams in the LBPAR system was investigated by using a large-scale physical model test. The results were compared to those calculated using the reverse beam method, indicating that the LBPAR system strengthened the sliding mass in space and improved the overall stability of the loess slope. With vertical loading, the axial tensile stress of the main anchor rod increases continuously. The bending area of the anchor rod was concentrated within 2 m of the sliding surface. And the maximum bending moment reaches 70 N·m. The sliding mass was subject to vertical load pressure, lattice beams’ pressure, and dead weight in the meantime and the maximum earth pressure value is near the node of the lattice beams. It is proved that such a method excels in the engineering design of loess landslides, which has promising applications in the future.
1 Introduction
Loess is a loose sediment that has been formed by aeolian deposition in arid climates since Quaternary period. It is made up of solid, liquid, and gas phases. China has the most extensive loess distribution in the world. The total loess area is nearly 631 thousand square kilometers, accounting for nearly 6% of China’s land area (Wang G et al., 2014; Wang J et al., 2014; Peng et al., 2018; Peng et al., 2019). In China, loess is classified into two types: primary loess and secondary loess (Assallay et al., 1996; Wang G et al., 2014; Peng et al., 2019).
Soil layers formed after deposition eroded by rain, forming the current situation of thousands of gullies (Peng et al., 2018; Peng et al., 2019). Geo-hazards such as loess landslides, flow-slides, and ground collapses affect people’s lives and livelihoods (Bélanger, 2007; Xu et al., 2018; Liu et al., 2022). One type of landslide is called loess slope (Peng et al., 2019; Wang et al., 2019; Chang et al., 2021). Collapse, slope instability, and other geological disasters are subject to human intervention to the slope foot, and natural climate change like freezing and thawing, rain, and others (Assallay et al., 1996; Xu et al., 2018). Constructions, such as roads, railways, airports, and urban areas, are thus inevitably threatened by the hazard of a loess landslide.
To date, loess geological hazards have been studied, as well as the theory and method of disaster reinforcement (Peng et al., 2019). investigated the genetic diversity and distribution of loess landslides in China (Arai and Tagyo, 1985). proposed a numerical procedure for determining the location of the critical non-circular slip surface with the lowest factor of safety, particularly for historic loess cave dwellings. The mechanisms of loess landslides have been one of the top topics for landslide experts, but there are still other topics that need to be paid more attention (Baoping et al., 2005). The limit equilibrium method (LEM) and strength reduction method (SRM) (Matsui And Ka-Ching, 1992; Firincioglu and Ercanoglu, 2021) are two common calculation methods for analysis of slope stability (Bishop, 1954). used the slip circle for slope stability analysis, and (Matsui And Ka-Ching, 1992) performed a finite element slope stability analysis using shear strength reduction technique. In addition (Su and Shao, 2021), proposed a three-dimensional slope stability analysis method based on finite element stress analysis (Zhang et al., 2011). proposed a novel method for system reliability analysis of ground slopes (SON et al., 1999). analyzed slope stability by conducting strength reduction. Slope stability safety factors calculated using strength reduction technique was compared with an upper bound analysis solution based on a log-spiral failure mechanism (Zhou and Cheng, 2013). analyzed the stability of three-dimensional slopes using a rigorous limit equilibrium method (Huang et al., 2019). proposed a novel radial cable to contain tensile failures in steep rubble-rock interfaces.
Lattice anchorage technology is a light structure of flexible site that can be easily combined with other anti-slide structures. It is suitable for securing high and steep landslides and can be combined with various forms of flexible vegetation protection system (Day et al., 1999). proposed a design method for stabilizing slopes with piles (Zhu et al., 2015). designed a physical model test to study the evolutionary process of a reinforced model slope using a fiber-optic monitoring network (Ye et al., 2019). used models to carry out response analysis of slopes strengthened by frames with prestressed anchors under seismic conditions considering prestressing (Huang et al., 2019). proposed a new anchor system called “radial cable” to increase the pull-out capacity of cables in the fill, which in turn helps to control the tensile deformation in the fill along the interface. Besides, some new techniques (Sun et al., 2020; Zhang et al., 2021) were used to study the reinforced slopes. As Table 1 shows the main findings of previous studies for slope reinforcement. Therefore, the experimental study of the LBPAR system is of great significance to reinforcement mechanism research. High variability of factors, such as bolt diameter, spacing, and mechanical properties, control and influence the reinforcement effect of the loess slide with a circular slip surface. Meanwhile, the interaction of soil and anchor rods among the sliding body, sliding bed, prestressed anchor rod, and lattice beams need to be studied.
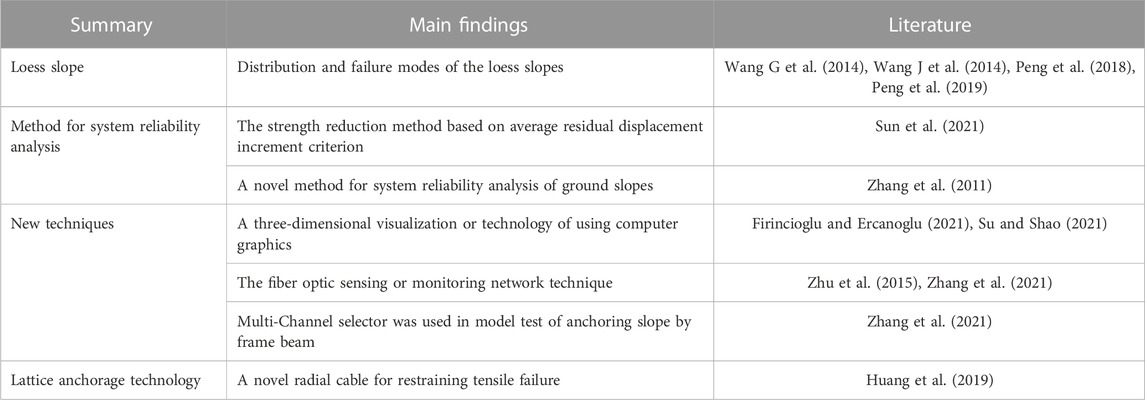
TABLE 1. Main findings of previous studies for slope reinforcement.
In this study, a comprehensive method was proposed to analyze the stability of landslide and its strengthening mechanism with LBPAR system. First, a small loess real landslide model with an arc-shaped sliding surface was designed. Then, a reinforced structural model was established to strengthen the sliding mass from the sliding bed. Finally, the applicability of the proposed method is verified by a model test in terms of the load-pressure behavior of the LBPAR system.
2 Methods
This study mainly focuses on the reinforcement mechanism of the loess slope with the LBPAR system. As shown in Figure 1A, the LBPAR system is composed of two parts: lattice beam and prestressed anchor rod. The sliding mass is fixed to the sliding bed by a support system. The anchorage section of prestressed anchor rod is anchored in the sliding bed as shown in Figure 1C. The lattice beams prevent the sliding mass from sliding bed down along the sliding surface. In the LBPAR system, the prestressed anchor rods fastened the sliding mass to the sliding bed with lattice beams. The sliding mass was compacted by the preloading load caused by the pressure of the lattice beams. The lattice beams fixed the sliding body to the sliding bed by anchor rods. Only the ideal slip surface is considered in this study. As is shown in Figure 1, the sliding body can rotate along the sliding surface under the action of its weight and the external load. The lattice beam and the prestressed anchor rod synergistically improved the stability of the slope with arc-shaped sliding surface. In an experimental simulation study, it is assumed that the sliding material is uniform, and the seepage of groundwater and surface water is not considered. Only the total deformation of the sliding body and the destruction of the soil under static load were considered. The fixed lattice beam is assumed to be a rigid component with respect to the soil, and the sliding bed is considered stable throughout the study.
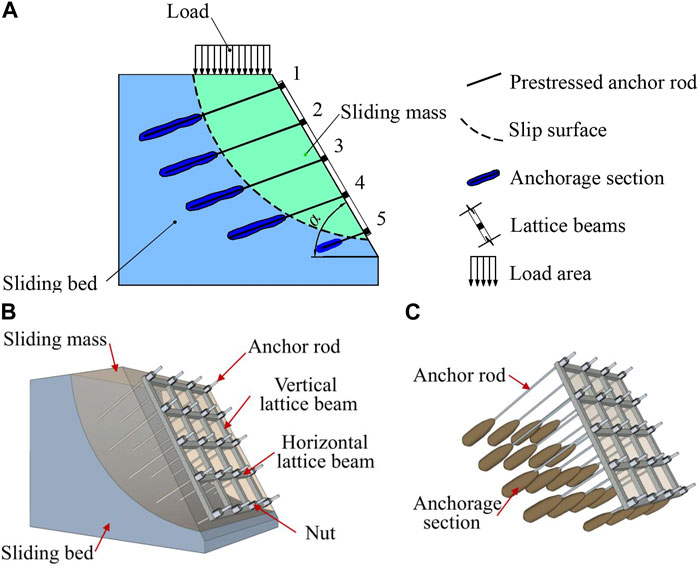
FIGURE 1. Diagram of the LBPAR system for loess slope. (A) Diagram of reinforcement mechanism of the LBPAR system; (B) 3D sketch of research model; (C) 3D sketch of the lattice beam and prestressed anchor rod with anchorage section.
To simplify the calculation, a typical and simplified reinforced model of the LBPAR system for sliding loess is created, as shown in Figure 2. The model is proposed based on the following assumptions:
1) As one type of soil, loess is also an anisotropic material with its special engineering geological properties. The sliding bed and sliding body are made of loess in the southern suburbs of Xi’an. The anchor rod steel is an isotropic material, and mechanical properties of the deformation body are exact the same in all directions.
2) The prestressed anchor rod is simplified as elastic support, and the center of the stress axis coincides with the geometric center of the lattice beam and prestressed anchor rod.
3) In this study, only slow rotation and sliding were considered, and the states of each component of the LBPAR system was considered in a static state.
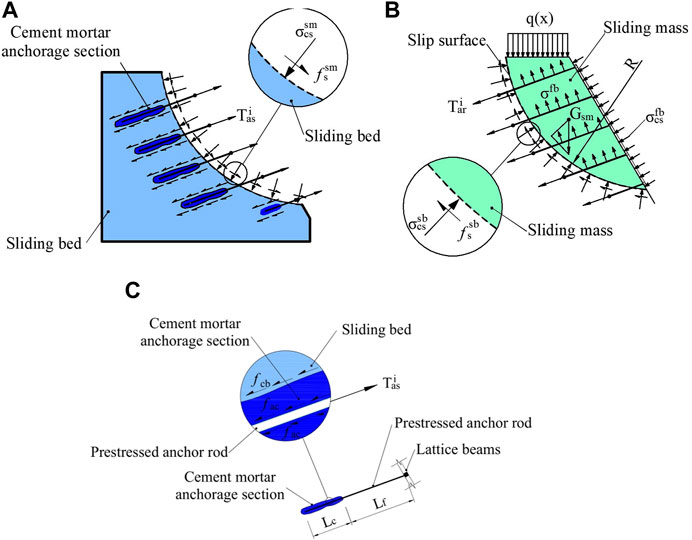
FIGURE 2. Diagram of prestressed anchor rod in sliding bed. (A) The sliding bed; (B) the sliding mass; (C) System of LBPAR. Lf is the length of free section of anchorage section; Lc is the length of anchorage section; fssb is the friction between the sliding mass and sliding bed.
Therefore, according to the torque equilibrium equation, the static equilibrium of vertical forces over the arc-shaped sliding surface is described as:
where
where Gsm is the weight of the sliding mass; GBA is the weight of the prestressed anchor rod section in the sliding mass; R is the radius of the arc-shaped sliding surface; RG is the distance from center of arc-shaped sliding surface to the centre-of-gravity position; Rq is the distance from centroid point of uniformly distributed load to the centre-of-gravity position; Ff is the friction between the sliding mass and sliding bed; F(q) is the value of distributed load on the top of sliding mass, it is related to the value of distributed load q(t); Afb is the contact area of the prestressed anchor rod; σfb is the stress of the sliding mass and the sliding prestressed anchor rod is shown as Figure 2; Tar and Tas are the axial force of anchor rod, Tar =- Tas; μ is the coefficient of friction between the sliding mass and the sliding bed. The friction is related to the friction coefficient and the positive pressure of the contact surface.
3 Experimental protocol
There are two aspects in method: one part is the experimental design; another is the design of the experimental procedure. First, the model was prepared, and the earth pressure cells were installed in the slip mass and the slip bed. Next, the holes are drilled according to the planned position. Meanwhile, the reinforced concrete frame beams were prefabricated and the anchor rods were installed. Finally, the loading and data recording were carried out by the corresponding data acquisition system.
3.1 Experimental model design
A full-scale loess landslide model was designed to investigate the reinforcement mechanism of the LBPAR system with an arc-shaped sliding surface. In order to satisfy the assumptions in Section 2, a model test box was designed and built for experimental investigation of a loess slope. The test box was 10.0 m long, 7.5 m high, and 6.6 m wide. A plastic sheet was attached to the inner wall of the model box to reduce edge effect and keep humidity constant. A loess slope model was designed with a right trapezoidal cross-section. The loess utilized in the experiment came from a construction site in southern suburbs of Xi’an. The right trapezoid model is with a length of 6.5 m and a height of 7.5 m. The top and bottom lengths of the model are 6.5 and 9.25 m respectively. The slope rises at an angle of 60° to the horizontal. An arc-shaped sliding surface was designed between the sliding mass and the sliding bed. The radius of the arch is 6.855 m and the arch chord has an angle of 43° horizontally. The sliding mass is in contact with the sliding bed through a preset arc-shaped sliding surface. The width of the top of the sliding mass was 2.815 m.
During the tests, the sliding bed of the model was first filled with a layer-by-layer compaction of loess. The compression coefficient of the model soil was chosen as 1.2 during compaction. The actual weight and moisture content of the compacted soil were 20.7 kN/m3 and 15%, respectively.
The arched sliding surface is composed of double layers of plastic sheets, which provide good sliding performance as the contact boundary material between a sliding body and a sliding bed.
The sliding mass was also filled with artificial layered compaction of loess. Meanwhile, earth pressure cells, displacement sensors, stressometers, and strain gauge sensors were installed in the test model. Then the slope surface and the slope top of the sliding mass were obtained by soil cutting. Excess soil was cut from top to bottom to form the model. When the model is cut about 0.5 m above the shear outlet of the slope foot, the top of the sliding mass of the slope appears subsidence phenomenon. It is indicated that the model has reached the limit equilibrium state. At this moment, the temporary sandbags are put on the slope foot to prevent further deformation. Next, the prestressed anchor rods are arranged in a square with a spacing of 1.5 m × 1.5 m. The diameter of the anchor rod is 14 mm with HPB300 (design tensile strength is 270 N/mm2 in a Chinese standard). The diameter of the anchoring section made of cement mortar is 120 mm and grouted with M30 mortar (The mortar strength is 30 N/mm2). The free section of the anchor rod should be filled with dry sand. The lattice beams are placed on the surface of the sliding body and have a cross-section of 0.1 m × 0.1 m. Four 6 mm thick main HPB300 ribs are used at the four corners of the beams, the stirrups are spaced 200 mm apart, and the iron wires are 2.4 mm in diameter. The concrete strength of the beams is 10 N/mm2, and the diameter of the reserved hole at the intersection of the frame beams is 50 mm. When the prestressed anchor rods and the lattice beams are arranged, the temporary sandbags are removed.
3.2 The design of experimental process
Continuous measurement is a major challenge for test result reliability and repeatability. Therefore, test program and procedure are vital. The prestress value of the anchor rod is applied with the wrench to tighten the nut at the end of the anchor head. The stress value of the anchor rod is monitored with the anchor rod stressometers.
Vertical loading was realized by adding sandbags on the top of the sliding mass. Each level of loading was loaded at 6 kPa. After each level was loaded, the data was tested in real-time. A next level loading was made after the data was essentially stable. When the deformation of the grid anchorage stabilized after each loading level, the data of bolt stress, bolt deformation and slope displacement were recorded by the test system. And the loading was then stopped until the slope reached final stability. As Figure 3 shown, the anchor heads were chosen as measurement points for displacement of the sliding mass. The earth pressure cells were installed in the sliding mass and the sliding bed in advance, as shown in Figure 3. Settlements for the top of the landslide and the horizontal displacement for the shear outlet of the sliding mass were measured with strain displacement sensors.
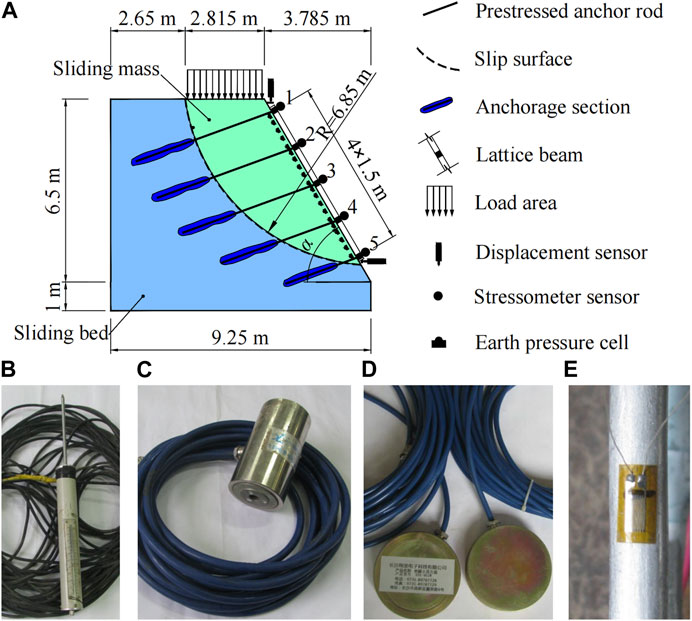
FIGURE 3. Sensors of the test model. (A)Sensors layout of the test model; (B) Displacement sensor; (C) Stressometer on cross section of anchor rod; (D) Earth pressure cell of SZZX—EXX series; (E) Strain gauge: X120 × 5AA.
Strain gauges with foil resistance are installed along the prestressed anchor rod, as shown in Figure 4. Four strain gauges are arranged at four directions, up, down, forward, and back of each measuring point section. The anchor rod is usually equipped with strain gauges, which are used to measure the strain of the anchorage section and the free section in the tests. The distance between strain gauges of the anchorage section and the free section within 50 cm near the sliding surface is 20 cm, and distance between the strain gauges of the remaining free section is 80 cm. Figure 5 depicted a detailed sketch of the test model, illustrating the current state of the test loading process. And the wiring group of the sensors takes up some space. The net weight of the sensor lead wire has an impact on the test results as well. In addition, the TST3826 static strain testing and analysis system from Test Electron was used for strain testing of strain gauges and displacement sensor. The data of the stressometers was collected by the XL-DSY01 Six-string intelligent reading system, the data of the earth pressure cells was collected by the XHY-ZH1 reading instrument.
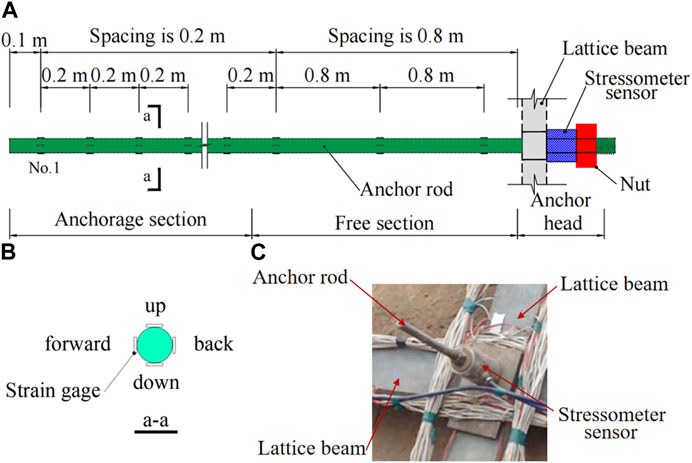
FIGURE 4. Diagram of strain gauge and stressometer on anchor rod; (A) Diagram of strain gauge on anchor rod; (B) Strain gauge on cross section of anchor rod; (C) Stressometer sensor of the anchor rod.
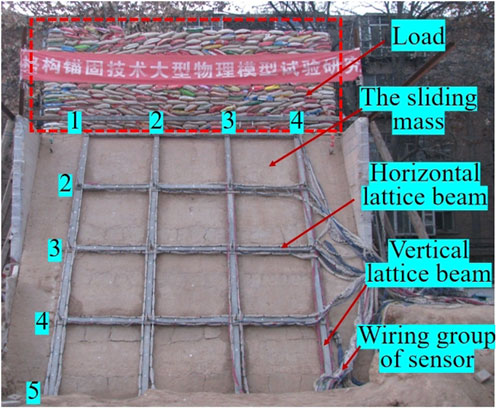
FIGURE 5. A detailed sketch of the test model.
4 Results of experiments
4.1 Deformation of sliding mass
In this test, it is observed that after a load of 6 kPa, there is a small displacement at the top of the slope, but no displacement at the bottom of the slope. By the time the load reaches 12 kPa, the position of the shear outlet at the base of the slope changes and the slip body begins to slip. As the load gradually increases, the stress in the middle free section of the tie rod gradually increases, and the strain value at the lattice girder connections and the strain value in the middle span between the connections increase as well. When the final stress of load reaches 42 kPa, the final displacement of the top of the embankment reaches 66 mm and the displacement of the base of the embankment reaches 72 mm. At this point, the maximum stress in the bolt reaches 211 MPa.
As the vertical load increases, the displacement of the slip body changes continuously. The displacement curve of the slip body shown in Figure 6 was obtained by collecting data from displacement measurement points placed at the top of the slip mass and at the base of the slope. The prestressed anchor rods were pulled to fix the sliding mass between the lattice girder and the sliding bed. Figure 7 shows the axial internal force curve of five rows of anchor rods under vertical loading.
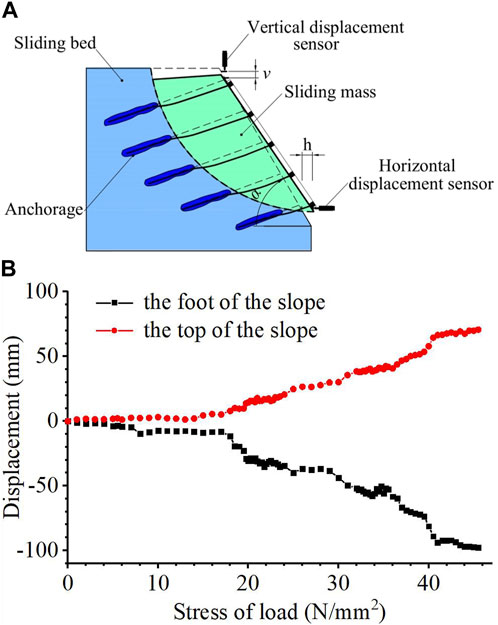
FIGURE 6. Deformation sketch of sliding mass and anchor rod after test; (A) Deformation sketch; (B) Displacement curve of the foot and the top of the slope under the load.
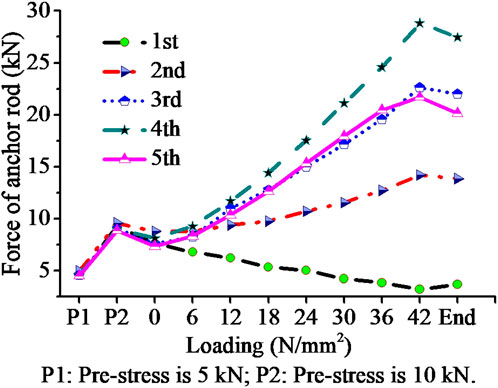
FIGURE 7. Average tension of each horizontal anchors from top to bottom with load.
In the model test, the sketch shown in Figure 6A was obtained after the loading tests. The sliding body slides along the circular landslide under load. The prestressed anchor rod exerts compressive stress on the sliding body through the lattice girder and increases the frictional force on the sliding surface. At the same time, the rod is partially bent due to displacement of the sliding body in the position of the sliding surface. The displacement of the foot and the top of the slope is shown in Figure 6. When the vertical load is 42 N/mm2, the displacement h of the slope toe reaches 72 mm.
4.2 Axial force of the anchor rods
Figure 7 shows the curves of the axial force variation of the anchor rods of the middle vertical arrangement from top to bottom of the sliding mass under load. As the vertical load is applied, the axial tensile stress of the main bolt increases continuously. The stress diagram of each row of bolts along the longitudinal direction is shown in Figure 7. From bottom to top, the axial force of the first row is clearly different from that of the other rows. The first row was close to the shear exit. And according to the test results, the preload of the first row of tie rods continues to decrease with vertical load.
The soil is subject to prestressing, and the system compresses the sliding body. When the pre-stress is 5 kN, the stress of the anchor rod is 32.5 MPa; and when the pre-stress is 10kN, the stress of the anchor rod is 65 MPa. From 2cd to fourth row, the force of the anchor rods increases. The first row and the fifth row are different. During loading process, a certain amount of stress relaxation occurs in the axial direction of the pre-stress of the first anchor rods. During loading, the prestress of the first row of bolts relaxes a certain amount in the axial direction for the first row of the anchor rods.
The top layer is the first row of anchor bolts. In the overall rotation process of the sliding body, the position change leads to the movement of the compressed soil of the fifth row of anchor bolts, resulting in part of the stress loss. Compared to Figure 6B, the results explain the reinforcement status of the reinforcement effect in the rotation process of the sliding body.
Figure 8 shows the axial tensile stress curve for the anchor rod M32 with the load. It is obvious that the stress value varies greatly between the anchoring section and the free section around the sliding surface as the boundary. As Figure 9 shows, the bending moment for the prestressed anchor rod M32 is the third beam node in the third row. By analyzing the test data, the distribution rules of bending moments are obtained at different positions in the loading process. The anchor rod was bent on both sides of the sliding surface. The bending area of the anchor rod was concentrated within 2 m from the sliding surface. And the maximum bending moment reached 70 N m.
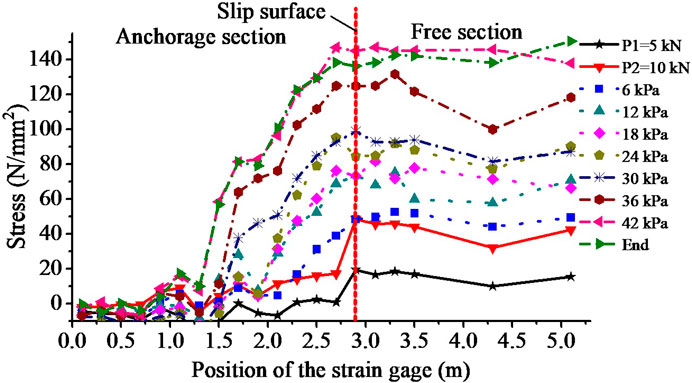
FIGURE 8. Stress curve for anchor rod M32 of different position with loading.
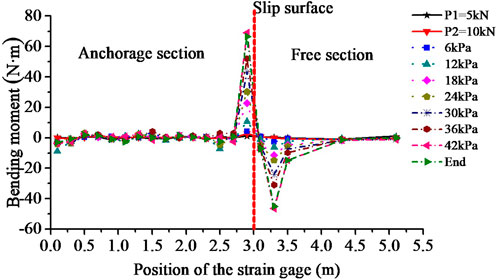
FIGURE 9. Bending moment for the anchor rod M32 in different positions with load. Note: The position of the strain gage is the distance from the strain gage to the end of anchor rod next to the anchorage section.
It is obvious that the axial strain of the anchor rod in the anchoring section is small, and the stress changes in the free section with the overall movement of the sliding body. Under the action of axial force, the anchor rod is affected by the resistance of cement mortar body bonded to it, and the cement mortar body bonded to it is affected by the soil resistance of sliding bed, which plays an anchoring role. The external surface of cement mortar in the anchoring section is in contact with the sliding bed. The axial force of the bolt is transferred to the slide bed through a mortar.
4.3 Earth pressure under lattice beams
The data of pressure under beams were collected using the earth pressure cell. The distribution curve of the earth pressure between the lattice beam and the sliding mass under load is shown in Figure 10. The stress value of the distribution curve of earth pressure between a lattice beam and sliding mass under load. The stress value of earth pressure increased from the first span to the fourth span. In each span, the stress increased from the middle of the span to the node under the lattice beams.
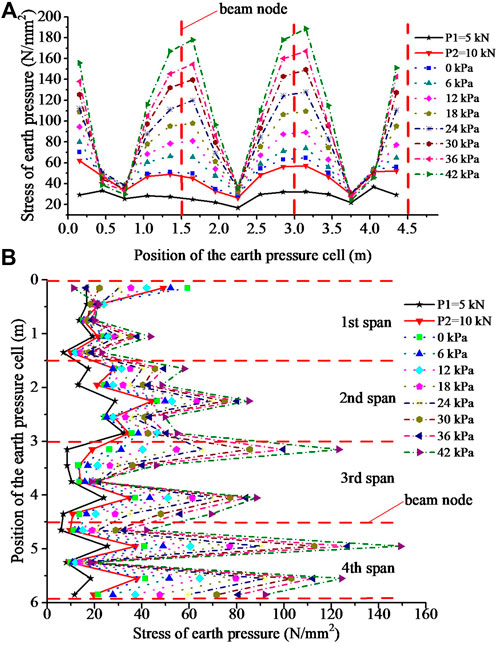
FIGURE 10. The pressure distribution curve between the lattice beam and sliding mass. (A) Horizontal bottom lattice beam; (B) Vertical bottom lattice beam. Note: The position of the earth pressure cell is the distance from current row or column anchor rod to the first row or column.
The data collected by a pressure box at the bottom of the beam show that the sliding body is in vertical compression state under lateral constraint with vertical force. It shows that the actual pressure distribution of beam bottom and slope is affected by the whole sliding body.
5 Discussion
Lattice beams protect the sliding mass from sliding bed down along the sliding surface. In the process of external loading, the deformation of the slope, the crack distribution of the lattice beam, and the tensile force characteristics of each anchor rod are studied in test study. The primary indicators include loading value, the strain of anchor rod and lattice beam, earth pressure, and the deformation of sliding mass and sliding bed. The sliding body and the sliding bed move relatively. The sliding body has a downward sliding trend, and the anchor rod and lattice beam both work together to reinforce the stability of the sliding mass as what Figure 2 shows.
At this moment, the soil of the whole sliding body was subject to vertical and lateral compression. Gradually, part of the soil was in a shear failure state on surface in contact with the sliding bed, anchor rod, and lattice beams. The axial tensile prestressed anchor rods were affected by sheer force locally due to the relative movement of the sliding body and sliding bed. As load increases, the displacement and deformation of the sliding body increase.
When the loading amount reaches 42 kPa, the final displacement of the slope top reaches 66 mm, and the displacement of the slope foot reaches 72 mm. Theoretically, when the horizontal displacement of the sliding body at the foot of the slope is 72 mm, the vertical displacement of the top of the slope should be 60 mm, but the actual displacement is 66 mm, indicating that the sliding body is compressed by the vertical load. Therefore, the sliding body was subject to a three-sided compression state. It can be seen that there is a compression of 6 mm above and below the sliding body along the sliding surface, which indicates that the slide bed and the lattice frames extrude the slide body from the side under the pulling action of anchor rods. As shown in Figure 1, the stability of the sliding body was improved.
For the sliding body, it was subject to vertical load, lattice beams’ pressure, and dead weight in the meantime. The maximum earth pressure value is near the node of the lattice beams. And the closer the beam is to the ground, the greater the subsoil pressure for the vertical bottom lattice beam. In the test process, there are no obvious signs of landslide instability in each group, and the maximum tensile force of the anchor rod is far from the ultimate bearing capacity of the anchor rod. While a number of cracks appear in lattice beam joints and spans, indicating that the failure structure of the anchor rod has reached the ultimate state of bearing capacity.
According to the axial stress test results (Figure 8), the anchor rod has axial strain starting from the position of 0.75 m. From the point of view of bolt bending on the sliding surface, there is influence from 2.25 m to 4.25 m, which is within a range of 2 m. According to the axial stress test results (Figure 9), the bolt has axial strain starting from the position of 0.75 m. Since bolt bends on the sliding surface, the influence from position of 2.25 m–4.25 m is within a range of 2 m. The influence region of the stress and bending moment were obtained as Table 2 shown. In practical engineering, the characteristics of loess are affected by the regional characteristics of loess, its environmental condition, and the reinforcement method. In addition, for the anchor rod under the loss of prestressing, the pre-tension will be lost by the deformation of the compressed soil. However, under the action of external load, the vertical force of the sliding body will offset the loss of prestress. The anchor rod near the shear outlet can be eliminated in design so that sufficient space shall be left for lowest layer anchor rod. The anchor rods of the lowest layer anchor rod shall be arranged aside sufficient space from the shear outlet.
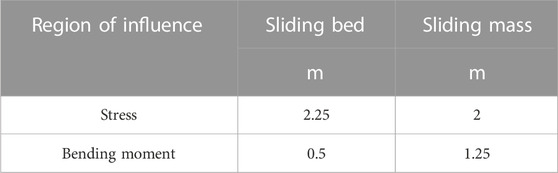
TABLE 2. Influence region of the stress and bending moment.
Under the vertical load of landslide part of the stress is counteracted by the compressed landslide. In the actual reinforcement project, the collapsibility of the sliding body and relaxation is caused by local compression of the sliding body by a structural beam after pressure consolidation. The characteristics of loess are affected by environment. Besides, the anchor force is damaged by the deformation of the compressed soil. However, under the effect of loading, the vertical force of the slide body offsets the loss of prestressed stress. Under the force of landslide thrust or the vertical load of the sliding slope, some of the stress is offset by the compressed slider. For the LBPAR system as shown in Figure 2, the prestressed anchor rods fastened the sliding mass to the sliding bed with lattice beams. The sliding mass was compacted by the preloading load because of the pressure of the lattice beams. Meanwhile, the anchor rods improved the integrity of the sliding mass. In summary, the anchoring section of cement mortar is closely combined with the sliding bed. The lattice beams fixed the sliding body to the sliding bed by the anchor rods. These phenomena illustrate the effect of the anchoring force of anchoring section in sliding bed. As Figure 1A shown, the experimental results agree with the typical and simplified reinforced model of the LBPAR system.
6 Conclusion
In this paper, reinforcement mechanism, reinforcement logic, and theory of bolt are revised, and the proposed reinforcement mechanism is verified by a model test. A reinforcement experimental study was conducted on mechanical characteristics induced by the loess slope. Discussion includes deformation characteristics of sliding mass, stress distribution of anchor rod, as well as system analysis during the whole loading period. The primary conclusions inferred from the results are summarized as follows.
1) The LBPAR system strengthened the sliding mass in space and improved the overall stability of the loess slope. The rotation slip of the sliding mass is related to the anchoring force. As the vertical load uniformly distributed vertical load increases, the deformation of the sliding mass in mechanical properties of the soil leads to the rotational sliding. When the final loading value reaches 42 kPa, the final displacement v of the slope top reaches 66 mm, and the displacement h of the slope foot reaches 72 mm.
2) The LBPAR system is a flexible loess slope support system with anchor rods bent on both sides of the sliding surface. The anchor rods exerted compressive stress on the sliding mass through the lattice beams. With load increasing, the axial tensile stress of the main anchor rod increases continuously. The bending area of the anchor rod was concentrated within 2 m of the sliding surface. And the maximum bending moment reaches 70 N m.
3) The sliding mass was subject to vertical load pressure, lattice beams’ pressure, and dead weight in the meantime. The maximum earth pressure value is near the node of the lattice beams. And the closer the beam is to the ground, the greater the subsoil pressure for the vertical bottom lattice beam. Although the soil properties at different parts of the loess slope are the same, their mechanical characteristics are different.
Near the sliding surface, the bottom of the beam is constructed around the anchor rod. And the maximum earth pressure reaches 190 N/mm2. Following studies will focus on different styles for slip surfaces, considering the influence of groundwater, surface water, and other factors on the supporting effect of landslides.
Data availability statement
The original contributions presented in the study are included in the article/Supplementary Material, further inquiries can be directed to the corresponding authors.
Author contributions
YL, NL, and DH wrote the main manuscript text. DH, YL, and NL conducted the tests. DH, YL, and WW analyzed the data and prepared the figures. All authors reviewed the manuscript.
Funding
This study was supported by a grant from the Key Research and Development Program of Shaanxi (No. 2022SF-085), Science and Technology Plan Project of Yulin (No. CXY-2020-053), the key laboratory of well stability and fluid and rock mechanics in oil and gas reservoir of Shaanxi Province, Xi’an Shiyou University (No. WSFRM20200102001) and National Natural Science Foundation of China (No. 41977231).
Conflict of interest
The authors declare that the research was conducted in the absence of any commercial or financial relationships that could be construed as a potential conflict of interest.
Publisher’s note
All claims expressed in this article are solely those of the authors and do not necessarily represent those of their affiliated organizations, or those of the publisher, the editors and the reviewers. Any product that may be evaluated in this article, or claim that may be made by its manufacturer, is not guaranteed or endorsed by the publisher.
References
Arai, K., and Tagyo, K. (1985). Determination of noncircular slip surface giving the minimum factor of safety in slope stability analysis. Soils Found. 25, 43–51. doi:10.3208/sandf1972.25.43
Assallay, A. M., Rogers, C. D. F., and Smalley, I. J. (1996). Engineering properties of loess in Libya. J. Arid Environ. 32 (4), 373–386. doi:10.1006/jare.1996.0031
Baoping, W., Sijing, W., Enzhi, W., Jianmin, Z., Yugeng, W., and Xinglin, W. (2005). Deformation characteristics of loess landslide along the contact between loess and neocene red mudstone. ACTA Geol. SIN. 79, 139–151. doi:10.1111/j.1755-6724.2005.tb00875.x
BéLANGER, P. (2007). Underground landscape: The urbanism and infrastructure of Toronto’s downtown pedestrian network. Tunn. Undergr. Space Technol. 22, 272–292. doi:10.1016/j.tust.2006.07.005
Bishop, A. W. (1954). The use of the slip circle in the stability analysis of slopes. Géotechnique 5, 7–17. doi:10.1680/geot.1955.5.1.7
Chang, Z., Huang, F., Huang, J., Jiang, S.-H., Zhou, C., and Zhu3, L. (2021). Experimental study of the failure mode and mechanism of loess fill slopes induced by rainfall. Eng. Geol. 280, 105941. doi:10.1016/j.enggeo.2020.105941
Day, R. W., Poulos, H. G., Hassiotis, S., Chameau, J. L., Gunaratne, N., and Leshchinsky, D. (1999). Design method for stabilization of slopes with piles. J. Geotechnical Geoenvironmental Eng. 125, 910–914. doi:10.1061/(asce)1090-0241(1999)125:10(910)
Firincioglu, B. S., and Ercanoglu, M. (2021). Insights and perspectives into the limit equilibrium method from 2D and 3D analyses. Eng. Geol. 281, 105968. doi:10.1016/j.enggeo.2020.105968
Huang, D., Li, P., and Cen, D. (2019). A novel radial cable for restraining tensile failure in steep fill-rock interfaces. J. Mt. Sci. 16, 1715–1730. doi:10.1007/s11629-018-5188-7
Liu, Z., Pan, Z., Li, S., Zhang, L., Wang, F., Han, L., et al. (2022). Study on the effect of cemented natural fractures on hydraulic fracture propagation in volcanic reservoirs. Energy 241, 122845. doi:10.1016/j.energy.2021.122845
Matsui, T., and Ka-Ching, S. A. N. (1992). Finite element slope stability analysis by shear strength reduction technique. Soils Found. 32, 59–70. doi:10.3208/sandf1972.32.59
Peng, D. L., Xu, Q., Liu, F. Z., He, Y. S., Zhang, S., Qi, X., et al. (2018). Distribution and failure modes of the landslides in Heitai terrace, China. Eng. Geol. 236, 97–110. doi:10.1016/j.enggeo.2017.09.016
Peng, J., Wang, A., Wang, Q., Zhuang, J., Huang, W., Zhu, X., et al. (2019). Distribution and genetic types of loess landslides in China. J. Asian Earth Sci. 170, 329–350. doi:10.1016/j.jseaes.2018.11.015
Son, E. M. D., Roth, W. H., and Drescher, A. (1999). Slope stability analysis by strength reduction. Géotechnique 49, 835–840. doi:10.1680/geot.1999.49.6.835
Su, Z., and Shao, L. (2021). A three-dimensional slope stability analysis method based on finite element method stress analysis. Eng. Geol. 280, 105910–105912. doi:10.1016/j.enggeo.2020.105910
Sun, W., Wang, G., and Zhang, L. (2021). Slope stability analysis by strength reduction method based on average residual displacement increment criterion. Bull. Eng. Geol. Environ. 80, 4367–4378. doi:10.1007/s10064-021-02237-y
Sun, Y., Cao, S., Xu, H., and Zhou, X. (2020). Application of distributed fiber optic sensing technique to monitor stability of a geogrid-reinforced model slope. Int. J. Geosynth. Ground Eng. 6, 29–11. doi:10.1007/s40891-020-00209-y
Wang, G., Li, T., Xing, X., and Zou, Y. (2014). Research on loess flow-slides induced by rainfall in July 2013 in Yan’an, NW China. Environ. Earth Sci. 73, 7933–7944. doi:10.1007/s12665-014-3951-9
Wang, J.-J., Liang, Y., Zhang, H.-P., Wu, Y., and Lin, X. (2014). A loess landslide induced by excavation and rainfall. Landslides 11, 141–152. doi:10.1007/s10346-013-0418-0
Wang, J., Zhang, D., Wang, N., and Gu, T. (2019). Mechanisms of wetting-induced loess slope failures. Landslides 16, 937–953. doi:10.1007/s10346-019-01144-4
Xu, L., Coop, M. R., Zhang, M., and Wang, G. (2018). The mechanics of a saturated silty loess and implications for landslides. Eng. Geol. 236, 29–42. doi:10.1016/j.enggeo.2017.02.021
Ye, S., Fang, G., and Zhu, Y. (2019). Model establishment and response analysis of slope reinforced by frame with prestressed anchors under seismic considering the prestress. Soil Dyn. Earthq. Eng. 122, 228–234. doi:10.1016/j.soildyn.2019.03.034
Zhang, J. H., Li, F., Zhang, S. P., Zhou, J. K., and Wu, H. M. (2021). Research on application of multi-channel selector in centrifugal model test of anchoring slope by frame beam. Front. Earth Sci. 9, 1–13. doi:10.3389/feart.2021.757724
Zhang, J., Zhang, L. M., and Tang, W. H. (2011). New methods for system reliability analysis of soil slopes. Can. Geotechnical J. 48, 1138–1148. doi:10.1139/t11-009
Zhou, X. P., and Cheng, H. (2013). Analysis of stability of three-dimensional slopes using the rigorous limit equilibrium method. Eng. Geol. 160, 21–33. doi:10.1016/j.enggeo.2013.03.027
Keywords: landslide, loess slope, prestressed anchor rod, lattice frame, reinforcement mechanism
Citation: Liu Y, Han D, Liu N and Wang W (2023) Reinforcement mechanism analysis of lattice beam and prestressed anchor rod system for loess slope. Front. Earth Sci. 11:1121172. doi: 10.3389/feart.2023.1121172
Received: 11 December 2022; Accepted: 24 April 2023;
Published: 09 May 2023.
Edited by:
Pierre Gehl, Bureau de Recherches Géologiques et Minières, FranceCopyright © 2023 Liu, Han, Liu and Wang. This is an open-access article distributed under the terms of the Creative Commons Attribution License (CC BY). The use, distribution or reproduction in other forums is permitted, provided the original author(s) and the copyright owner(s) are credited and that the original publication in this journal is cited, in accordance with accepted academic practice. No use, distribution or reproduction is permitted which does not comply with these terms.
*Correspondence: Yang Liu, eWFuZ2xpdUB4cHUuZWR1LmNu; Dongdong Han, eWF0b25nZG9uZ2RvbmdAY2hkLmVkdS5jbg==