Abstract
Debris flow is a common geological hazard in mountainous areas of China, often causing secondary disasters and seriously threatening residents and infrastructure. This paper uses the Xigou debris flow in the Three Gorges Reservoir Region (TGRR) as an example case study, the development characteristics and initiation pattern of which were analyzed based on field investigation. The disaster dynamics software DAN-W was then used to simulate the entire initiation-movement-accumulation process of the debris flow and conduct the debris flow dynamics analysis. The paper also simulated and predicted the movements of landslides in the formation area of a debris flow after its initiation. The results show that the movement duration of the Xigou debris flow was approximately 40 s, the maximum velocity was 37.1 m/s, the maximum thickness of the accumulation was 18.7 m, and the farthest movement distance was 930 m, which are consistent with the field investigation. When the volumes of landslide transformed into a new source material of debris flow are 5 × 10⁴, 10 × 104, 15 × 104, 20 × 104, and 26 × 104 m3, the movement distances of the debris flows are 250, 280, 300, 340, and 375 m, respectively. When the volume of the source material exceeds 20 × 104 m3, debris flow movement can seriously impact the residential houses at the entrance of the gully. This paper can provide a scientific basis for the prevention and mitigation of the Xigou debris flow.
1 Introduction
A debris flow is an extremely fast torrent (solid-liquid two-phase flow) that forms in deep gullies or ravines (Hungr et al., 2001). The Three Gorges Reservoir Region (TGRR) is an area that witnesses frequent debris flow of multiple source types, large material volumes, severe climatic conditions, and intense human engineering activities and therefore possesses the conditions for macro and giant debris flow outbreaks (Zhang et al., 2021; Tang et al., 2015). The TGRR has a relatively more concentrated population following the resettlement project, which will lead to substantial losses, in both lives and property, in the event of a debris flow outbreak in the settlement areas.
As debris flow disasters continue to occur, methods to prevent or mitigate these disasters have become an urgent issue. Therefore, some experts and scholars have sought to better understand debris flows and reduce the damage they cause (Cui et al., 2011; Dowling and Santi, 2014; Nocentini et al., 2015; Zhang and Matsushima, 2018; Hu et al., 2019; Lee et al., 2020; Wang et al., 2022). In these studies, the reliability of numerical simulation methods has been demonstrated through back analyses of landslide and debris flow cases. Non-etheless, the selection of suitable rheological models and parameters is still the main challenge for the predictive analysis of debris flow movement characteristics. To this end, back analysis of historical hazard cases with similar damage types is crucial, as successful back analysis can be used to correct models and improve prediction accuracy, and provide rheological models and parameters that are suitable for potential landslide and debris flow predictive analysis (Xing et al., 2014). Thus, more accurate prediction and assessment of landslide and debris flow can be carried out (Chang et al., 2019; Dou et al., 2019; Dou et al., 2020; Zhao et al., 2021; Liu et al., 2022; Yin et al., 2022).
With the difficulties inherent in model experiments and field observation, numerical simulation is gradually becoming an important approach to studying debris flows. Advances in numerical computation of debris flows have provided a number of different models to describe debris flow movements, including continuum medium method, discrete medium method, and mixed medium method based on the descriptions of the constituent materials and movements (Hu et al., 2012). The continuum medium model assumes a continuous and void-free distribution of the debris flow body in space and can be primarily classified into one-fluid and multifluid models. The discrete medium model reduces the debris flow into a system consisting of a large number of material particles of a certain size, and the simplest discrete medium model is the discrete element method (DEM) model. The mixed media model describes the movements of the liquid and solid phases of a debris flow in a continuum and a discrete media model, respectively, and is the model that can best reflect the physical nature of a debris flow. The main numerical methods commonly used in debris flow numerical calculations are the finite element method (FEM), finite volume method (FVM), finite difference method (FDM), Boltzmann method (LBM), and smoothed particle hydrodynamics (SPH) method (Wang and yao, 2007; Hu et al., 2014; Qiu et al., 2022). Hungr and Evans (2004) developed the dynamic simulation software DAN-W based on the Lagrangian analytic solution of the Saint-Venant equations and used different rheological models to perform back analysis of the debris flow movement and accumulation process; the results showed that the frictional and Voellmy rheological models are more applicable for debris flow simulation and analysis.
On 18 June 2018, the Xigou debris flow occurred in Wushan County, Chongqing (located at 31°09′16″N, 109°58′34″E), burying the buildings at the entrance of gully and damaging the road, directly threatening 195 households and 773 people living. The analysis of the mechanism and development characteristics of the debris flow is of great significance to the follow-up preventing work. In this paper, the development characteristics of the Xigou debris flow were studied through detailed field investigation. The geological dynamics model DAN-W was used to simulate the initiation-movement-accumulation process of the debris flow and to analyze the mechanism and kinematic characteristics of the debris flow. The best combination of rheological models and parameters was obtained through the trial-error method to improve the accuracy of debris flow dynamics analysis, providing a reliable reference for disaster prevention and mitigation of the same debris flow type. The paper also adopted the DAN-W model to analyze and predict the landslide state in the landslide area and obtained the movement characteristics, such as the distance, accumulation thickness, and slip velocity, of the debris flow under different conditions. Then, the impact force of the Xigou debris flow on residential buildings and other buildings at the gully entrance was calculated when the material source value totaled 20 × 104 m3 and 26 × 104 m3 to provide a reference for disaster prevention and mitigation in the study area.
2 Geological background of the study area
The Xigou debris flow is located in Wushan County, Chongqing (Figure 1). The study area is generally at a lower elevation in the south and higher in the north, ranging from 265 to 1890 m, with steep slopes of 30°–50° in the upper part of the gully and gentle slopes of 10°–20° in the lower part. The Xigou debris flow basin contains three debris flow gullies—#1, #2, and #3—all of which are rectangular in shape, with an overall basin area of approximately 1.28 km2.
FIGURE 1

Geographical location map of the Xigou debris flow.
The strata in the study area are Quaternary artificial fill (Q4ml), Quaternary Holocene landslide accumulation (Q4del), Quaternary colluvium (Q4col+dl), and Quaternary Pleistocene alluvium (Q4al+pl), and the exposed bedrock primarily consists of Triassic Patung Schichten (T2b) mudstone, fractured marl, and Lower Triassic Jialingjiang Formation (T1j4) limestone. The study area is located on the southeastern flank of the Qiyao Mountain anticline, with a monoclinal output and a rock formation yield of 160°–180°∠45°–58°, and does not exhibit any fault development.
The study area features a humid subtropical monsoon climate with an average annual temperature of 18.4°C, an average annual precipitation of 1066.2 mm, a maximum annual rainfall of 1,509.9 mm, a maximum monthly rainfall of 445.9 mm (September), and a maximum daily rainfall of 384.6 mm (31 August 2014), with 68.8% of the rainfall occurring during the rainy season (May-September). The cumulative rainfall between January and August of the year when the debris flows occurred was 824.8 mm, with the cumulative rainfall in June reaching 194.2 mm, much larger than the historical average for June (Figure 2). On 18 June 2018, Wushan County witnessed continuous heavy rainfall, with a cumulative rainfall of 174.3 mm.
FIGURE 2

Monthly and cumulative rainfall in the study area in 2018 c.
3 Description of the xigou debris flow
The overall shape of the Xigou debris flow basin is rectangular, with a valley orientation of 10° ESE, a slope of nearly 25°, and a ditch length of 1.82 km, which is located in the elevation range of 282–1,424 m. When experiencing heavy rainfall, the side slopes produce strong runoff, which scours and coats the loose accumulation material sources in the gully, gradually accumulating and expanding to form debris flows. As they move, these debris flows collide with the slopes and scrape and excavate the substrate, causing some of the side slopes to collapse and, eventually, gradually accumulate at the entrance of the gully as the speed decreases. In terms of dynamics, the Xigou debris flow can be divided into four areas: a catchment area, formation area, movement area, and accumulation area (Figure 3). The catchment area is located in the upper part of the debris flow gully and has the largest area that easily catches water. The formation and movement areas are located in the middle of the gully. The formation area is large, and the debris flow forms in the formation area and flows toward the movement area. The accumulation area is located at the gully entrance at the foot of the slope, and the debris flow flows from the upper part to this area, where accumulation occurs.
FIGURE 3

Xigou debris flow partition.
3.1 Catchment area
The catchment area is a roughly rectangular shape that is distributed within the elevation range of 530–1,462 m. The terrain is steep, with a relative height difference of 864–922 m. The vegetation cover is over 85%, primarily consisting of shrubs. The cover layer is thin, with local outcrops of fractured marl and mudstone, experiencing few avalanches and landslides and other unfavorable geological conditions in addition to minimal soil erosion. The ditches in the catchment area are well developed, providing the necessary dynamic conditions for forming debris flows.
3.2 Formation area
The formation area is primarily located within the elevation range of 310–560 m, with a steep topography and slope of approximately 30° and an overall area of approximately .448 km2 (Figure 4A). The surface layer of the formation area is mostly Quaternary Holocene colluvial soil, with a thickness of approximately 20 m, and most of the debris flow material sources are concentrated in this area. The catchment area is located in the upper part of the formation area. When it rains, rainwater collects in the catchment area and flows toward the formation area, and the debris flow forms in the formation area and flows downstream. The landslide area is located in the formation area of Xigou #2, which is approximately 100 m long and 80 m wide, with a volume of approximately 26.0 × 10⁴ m3. The large amount of accumulation in this area provides a rich material source for debris flow movement (Figure 4B).
FIGURE 4

Features of Xigou debris flow partitions. (A) Formation area (B) Landslide area (C,D) Movement area (E) Accumulation area (F) Accumulation distribution.
3.3 Movement area
The movement area is primarily distributed from the elevation of 310 m to the entrance of the gully. The length of the movement area for gully #1, #2, and #3 is 90, 135, and 220 m, respectively. The slope in this area is approximately 25°, and the channel is generally narrow and straight, which is conducive to the rapid flow of debris. During high-speed movement, the debris flow collides, scrapes, and entrains a large volume of loose accumulation on the gully surface (Figures 4C,D).
3.4 Accumulation area
The accumulation area is located below 300 m in elevation, with an open space and fan-shaped area (Figure 4E). The accumulation areas of gully #1, #2, and #3 are approximately 3,065, 6,643, and 6,886 m2, respectively. According to site investigations, the accumulation is primarily composed of gravelly soil and clay, with a grain size of 5–30 cm and a maximum grain size of 1.5 m (Figure 4F).
Due to the relatively large slope drop in the upper part of each branch gully in the basin, the debris flow is fast, and the loose accumulation is relatively small, while the middle and lower parts of the main gully are relatively gentle, and the debris flow produces a large amount of material accumulation in the accumulation area due to the reduced kinetic energy. This area is where human construction activity is concentrated, including houses and roads in Xigou Village.
4 Formation mechanism of the xigou debris flow
In the study area, the Xigou debris flow occur due to heavy rainfall. During debris flow movement, they continuously scour and erode the bank slopes on both sides of the gully, leading to landslides within the landslide area, further increasing the volume of the material source of debris flows, and a large amount of debris flow material accumulates at the gully entrance. Heavy rainfall is the main cause for debris flow formation. The Xigou debris flow disaster formation process is divided into three main phases: initiation phase, amplification phase, and siltation phase (Figure 5).
FIGURE 5
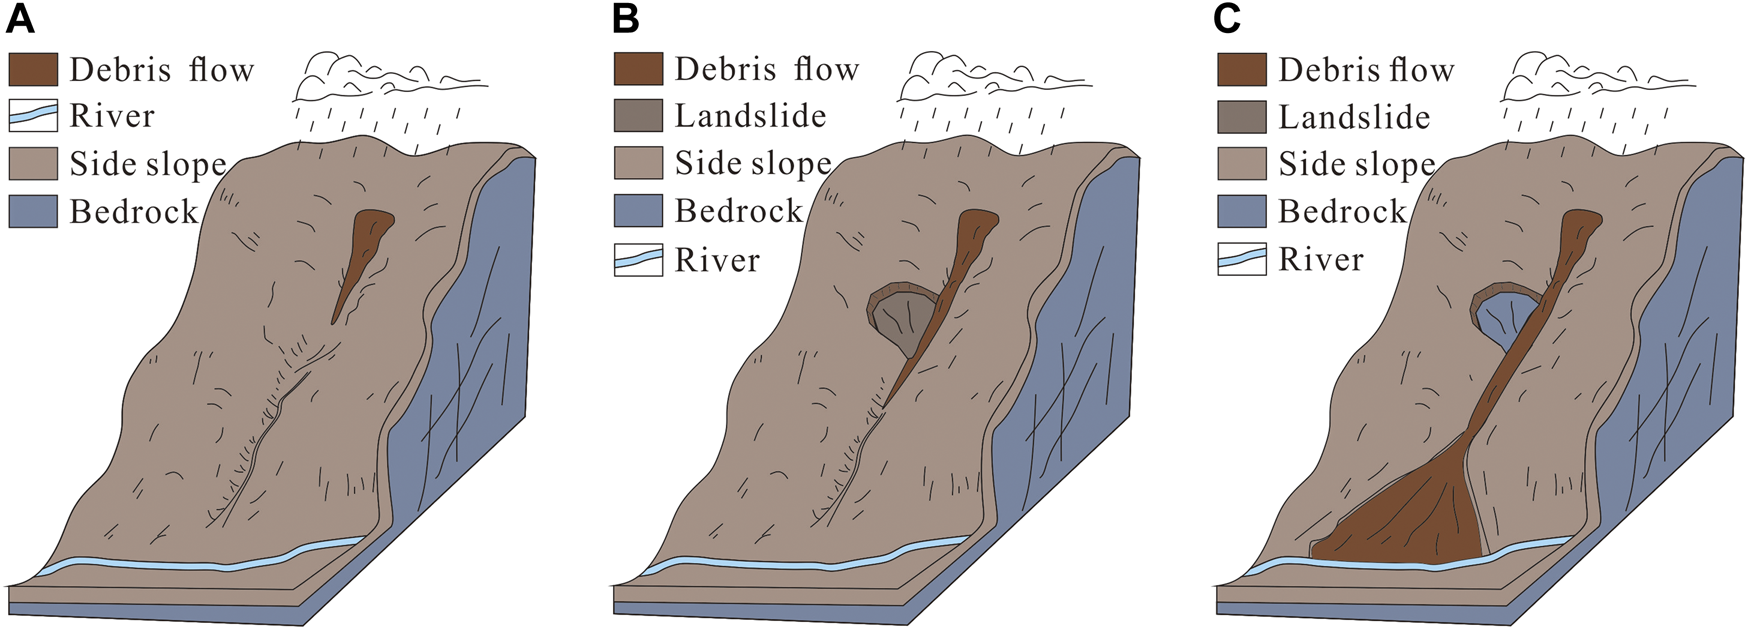
Formation mechanism of the Xigou debris flow. (A) Initiation phase (B) Amplification phase (C) Siltation phase.
Initiation phase: Heavy rainfall on 18 June 2018 caused a number of small landslides on the rear edge of the slope, a large number of avalanches and rock slides gathered in the gully, and the amount of loose solid material sources increased greatly. The catchment area was large, the terrain was steep, and the gully easily caught water. A large amount of rainwater quickly gathered in the narrow gully channel and quickly formed into a flood. Then, the floodwater mixed with the loose solid material sources in the formation area to form a debris flow, scouring and mobilizing the loose accumulation of material sources in the gully channel and moving downstream.
Amplification phase: As the runoff increased, the debris flow generated greater kinetic energy in the narrow gully, and the erosion capacity gradually increased. Both sides of the gully were steep, and the loosely accumulated soil on both slopes was mainly fragmented rocky soils. As the debris flow moved, it continuously scraped and scoured the bank slopes on both sides of the gully, which intensified the lateral erosion effect on the front edge of the landslide area, resulting in slope slip damage. The landslide provided favorable conditions for the solid material source of debris flow movement.
Siltation phase: The debris flow movement induced the landslide, and the loose landslide mass moved downstream with the debris flow. The entrainment and dynamic erosion of the debris flow in the transportation process led to a gradual reduction in the kinetic energy of the debris flow. The debris flow eventually accumulated at the gully entrance with a relatively gentle slope.
5 Numerical simulation of debris flow
5.1 Introduction to DAN
DAN-W is a numerical simulation software developed by Hungr to simulate the debris flow movement process and its dynamics. DAN-W uses the Lagrangian analytic solution of the Saint-Venant equations to decompose the landslide into a number of blocks and assumes that these blocks will not undergo internal deformation during movement. After establishing the balance equations and kinetic equations and then solving the equations via the Lagrangian finite difference method, data on the movement velocity, movement distance, and accumulation thickness were obtained (Hungr, 1995).
The DAN model treats landslides as equivalent fluids and further back analyzes landslide movement by setting the paths and directions of movement and selecting different rheological models to calculate the movement distance, velocity, and accumulation thickness of landslides.
Hungr (2009) and Sosio (2008) showed that the frictional and Voellmy rheological models can reflect the movement and accumulation characteristics of landslides more accurately. The rheological relationships are specified as follows:
The expressions for the resistance of the frictional model are as follows:where is the resistance at the bottom of the slide (N); is the total stress perpendicular to the direction of the sliding path (Pa); is the pore pressure coefficient, i.e., the ratio of pore pressure to total stress; and is the internal friction angle (°).
The expression for the resistance of the Voellmy model is as follows:where is the resistance at the bottom of the slide (N), is the slip friction coefficient is the total stress perpendicular to the direction of the sliding path (Pa); is the material volumetric weight (N/m3); is the transportation velocity of the slide (m/s); and is the turbulent diffusion coefficient (m/s2).
5.2 Model establishment and parameter selection
As a result of the heavy rainfall on 18 June 2018, debris flow hazards broke out in gullies #1, #2, and #3 in the study area, of which the most threatening was the debris flow in gully #2. Therefore, gully #2 was chosen for modeling and calculation. Through field geological investigation, the profile of gully #2 before and after the debris flow occurred was determined (Figure 6). In this paper, two rheological models, the frictional model and the Voellmy model, were used to simulate the movement characteristics of the debris flow in different areas according to the gully characteristics and debris flow movement characteristics in the formation, movement, and accumulation areas. Research results have shown that the frictional model is suitable for application in the formation area (Yang et al., 2020). The frictional model and the Voellmy model were applied to the movement area and the accumulation area, respectively, and four model combinations of F-F-F, F-V-V, F-V-F, and F-F-V were obtained, which corresponded to debris flow movement distances of 1,100, 820, 930, and 820 m, respectively (Table 1). A comparison of the four models by the trial-error method revealed that the simulation results of the F-V-F model were closer to the actual movement distance of 950 m of the Xigou debris flow; therefore, the F-V-F rheological model was used for simulation calculation (Table 2 shows the parameters of the F-V-F model).
FIGURE 6
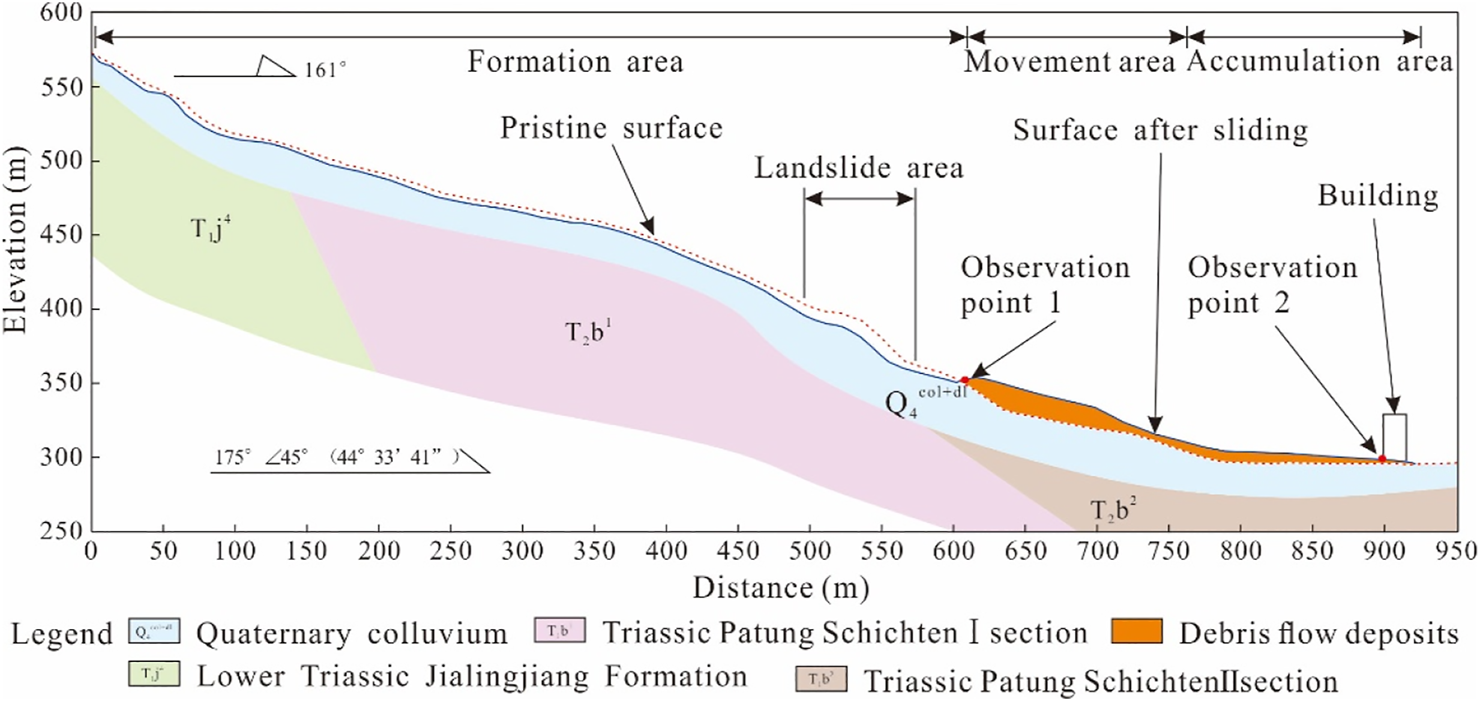
Geological profile of gully #2 of the Xigou debris flow.
TABLE 1
| Model | Debris flow partition | Movement distance (m) | Actual distance (m) | ||
|---|---|---|---|---|---|
| Formation area | Movement area | Accumulation area | |||
| F-F-F | Frictional | Frictional | Frictional | 1,100 | 950 |
| F-V-V | Frictional | Voellmy | Voellmy | 820 | |
| F-V-F | Frictional | Voellmy | Frictional | 930 | |
| F-F-V | Frictional | Frictional | Voellmy | 820 | |
Model combinations for xigou debris flow.
TABLE 2
| Model | Friction coefficient | Internal friction angle (°) | Turbulent diffusion coefficient (m/s) | Volumetric weight (kN/m3) | Scraping depth (m) |
|---|---|---|---|---|---|
| F | 20 | 20 | |||
| V | 0.4 | 300 | 20 | 3 | |
| F | 20 | 20 |
Parameters for the F-V-F model.
5.3 Results
5.3.1 Movement characteristics of the debris flow
The movement characteristics of the Xigou debris flow are shown in Figures 7, 8. Figure 7 indicates that the debris flow movement lasted approximately 40 s, with the head and tail starting almost simultaneously. During the initiation phase, a large amount of rainwater collected in the gully, which mixed with the loose accumulation on the surface and flowed downstream, causing the velocity of the debris flow head to gradually increase during 0–8 s. At 8 s, the velocity reached a maximum of 18.7 m/s until approximately 14 s, when the head entered the accumulation area. As the gully in the accumulation area was gentler, the velocity started to decrease. The head was blocked by the building at the foot of the slope where the velocity dropped to 0 m/s and then flowed out on a side of the building before finally stopping its movement at a horizontal distance of 930 m. The steeper slope of the rear edge of the slope and the large amount of rainwater flowing into the formation area caused the velocity of the debris flow tail to increase sharply at 0–7 s, after which the movement path was relatively gentle, and the velocity remained at 15–20 m/s until approximately 22 s, when the tail entered the steep slope, and the velocity increased, reaching a maximum of 37.1 m/s at 27 s. Thereafter, the tail was blocked by the accumulation in the movement area, and the velocity decreased linearly until the tail accumulated in the movement area and stopped.
FIGURE 7
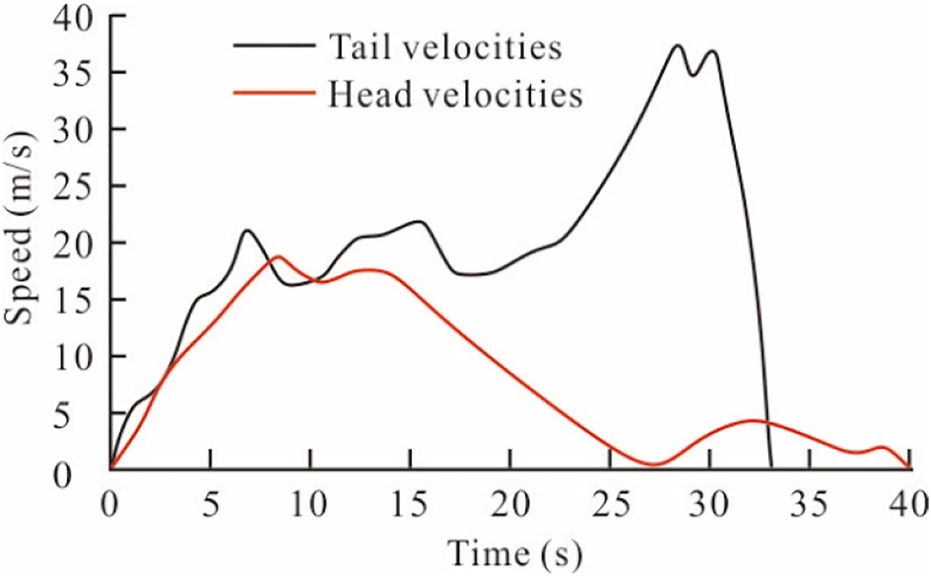
Velocities of the debris flow head and tail over time.
FIGURE 8

Velocities of the debris flow head and tail over slide distance.
5.3.2 Morphological characteristics of debris flow movement
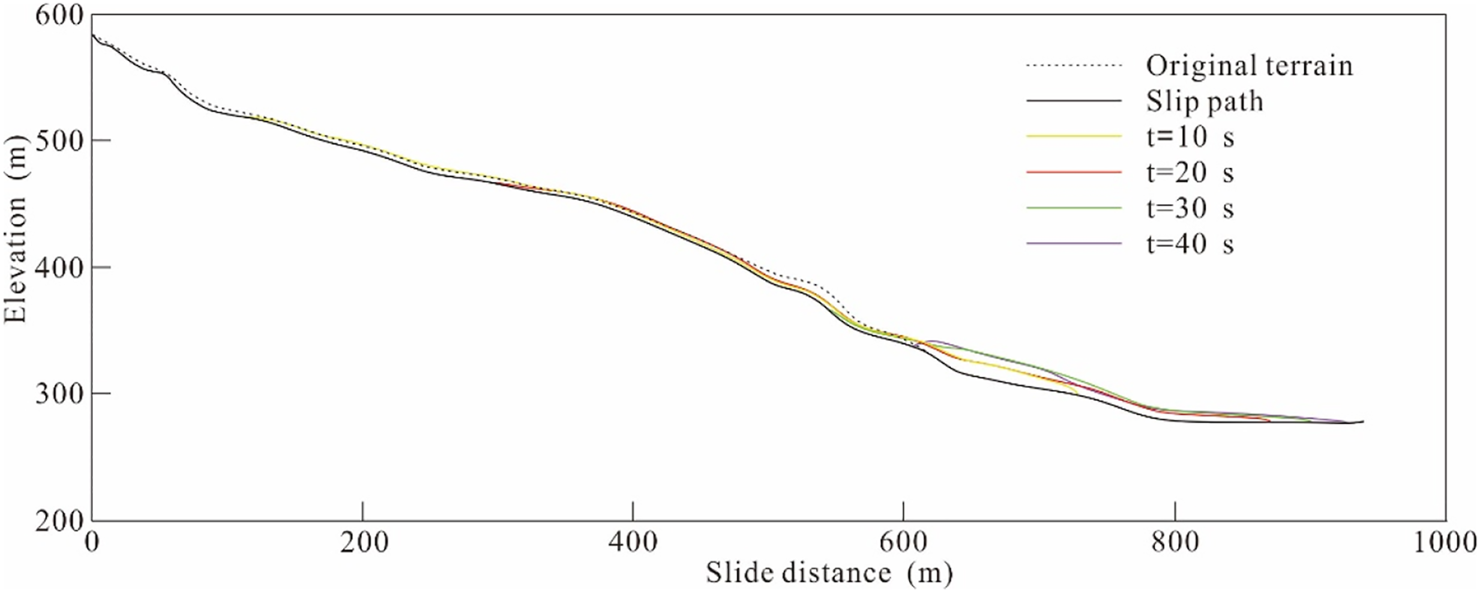
The changes in the accumulation thickness and morphology of the debris flow at 10 s intervals from start to stop are shown in Figures 9, 10. At 0 s, the debris flow head was located at a horizontal distance of 610 m, and the tail was located at a horizontal distance of 0 m. The average thickness of the debris flow accumulation ranged from 2.5 to 17.5 m, with the maximum accumulation thickness of 18.7 m located at a horizontal distance of 620 m. The head of the debris flow began to decrease in velocity at 15 s, while the tail remained at a higher velocity moving downstream, resulting in the gradual accumulation of the debris flow in the movement area, reaching a maximum accumulation thickness of 18.7 m at a horizontal distance of 620 m. At 40 s, the tail was located at a horizontal distance of 600 m, the accumulation thickness in the movement area was 7–18 m, and the debris flow movement stopped at a horizontal distance of 930 m.
FIGURE 9
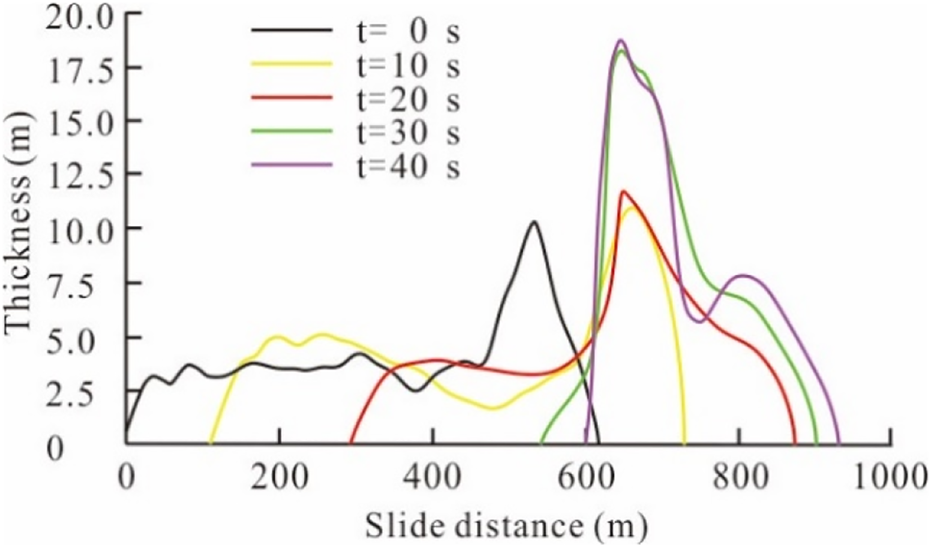
Debris flow thickness variation.
FIGURE 10
Debris flow morphology variation.
During the 20 s after the initiation of the debris flow, the head exhibited a high velocity and moved a distance of approximately 260 m. Within 20–40 s, the debris flow moved to the accumulation area, where the terrain was flat, and gradually decelerated, moving only 60 m during this period. Therefore, after t=20 s, the debris flow thickness in the accumulation area did not change notably. The horizontal distance of approximately 620 m is typical of negative terrain, so the debris flow accumulated much more at this distance, leading to a peak in debris flow thickness at this location.
5.3.3 Movement characteristics of the debris flow at the observation point
According to the field investigation, observation point one and observation point 2 were set at horizontal distances of 600 m and 900 m, respectively, for analysis (Figure 6), and the variation in debris flow velocities and thicknesses at the observation points with times were obtained (Figures 11, 12). Observation point one is located at the intersection of the formation area and the movement area, and the movement characteristics at observation point one were selected for the analysis. In terms of velocity, the debris flow arrived at observation point one within 2 s of startup with a velocity of 5 m/s. As the debris flow was in the initiation phase, the velocity of the debris flow through observation point one increased and reached a maximum velocity of 19 m/s at approximately 8 s. At approximately 10 s, the debris flow started to accumulate in the movement area, and the velocity of the debris flow at observation point one gradually decreased. Between 20 and 25 s, the debris flow velocity picked up at observation point one due to the faster tail movement. The large accumulation of debris flow in the narrow movement area impeded the flow of the tail downstream, causing the tail velocity to gradually decrease as it flowed through observation point one until it stopped moving. In terms of thickness, within 0–15 s, the debris flow thickness past observation point one was approximately the same as the thickness of the initial debris flow, indicating that the overall flow downstream after the initiation of the debris flow remained essentially unchanged. Between 15 and 30 s, the debris flow gradually piled up in the movement area, and the debris flow thickness gradually increased at observation point 1. After 30 s, the accumulation in the movement area extended to observation point one, where the debris flow tail continued to accumulate until the tail stopped moving and the thickness of the accumulation reached a maximum of 12.5 m and remained constant.
FIGURE 11

Velocity versus time as the debris flow passed through the observation point.
FIGURE 12

Velocity versus thickness as the debris flow passed through the observation point.
Observation point 2 was located at a building in the accumulation area, where the Xigou debris flow posed a threat to residential houses and other buildings at the foot of the slope; therefore, the movement characteristics at observation point 2 were chosen for the analysis. Figure 11 indicates that the debris flow passed through this point at approximately 30 s, at which point the velocity was 3.25 m/s, exhibiting an overall slowing velocity until the debris flow ultimately stopped moving. After the debris flow passed through observation point 2, the accumulation thickness at this point increased until the movement ended when the accumulation thickness was approximately 4.5 m. Thus, the debris flow did not stop moving when it reached observation point 2 and had a certain impact on the buildings.
6 Discussion
6.1 Simulation analysis of the transformation from landslide to debris flow
Based on the field investigation and unmanned aerial vehicle (UAV) images, a landslide was identified within the central formation area of the debris flow gully (Figure 4B). The landslide area is located within the elevation range of 350–410 m, with the front edge of the landslide body at an elevation of 350 m and the back edge at an elevation of 407 m. The landslide area had a relative height difference of 57 m, a length of approximately 100 m, a width of approximately 80 m, and a material source volume of approximately 26.0 × 10⁴ m3. The slide body is dominated by rubble, and the main slide direction is 211°; boundary conditions have formed, the frontal slide has blocked the debris flow gully, and the entire landslide area is unstable.
On 18 June 2018, the study area was subjected to persistent heavy rainfall, and large amounts of rainwater rapidly collected upstream of the debris flow gully and surged into the narrow gully channel, rapidly forming a flood, which mixed with loose solid material sources on the gully surface to form a debris flow that continued to scour the loose accumulation sources in the gully and moved downstream. After the debris flow moved to the landslide area, it continuously scraped and scoured the bank slopes on both sides of the gully channel. The scraping and lateral erosion of the slope of the landslide area by the debris flow destroyed the stability of the original slope body, resulting in a landslide on the slope of the landslide area. Some of the landslide bodies continued to move downstream after being transformed into debris flow and eventually accumulated at the gully entrance. The remaining landslides and slope accumulations became new sources of debris flow, and under heavy rainfall conditions, they are prone to destabilize and form debris flows again.
In this section, the DAN-W model was used to simulate the movement state of debris flow when it breaks out again under heavy rainfall conditions. Assuming that the volume of landslide volumes that transform into new sources of debris flow are 5 × 10⁴, 10 × 104, 15 × 104, 20 × 104, and 26 × 104 m3, these source volumes are used as five sets of working conditions to simulate and predict the movement states of debris flow with different source volumes and obtain the movement characteristics, such as distance, accumulation thickness, and slide velocity, of debris flow under various conditions.
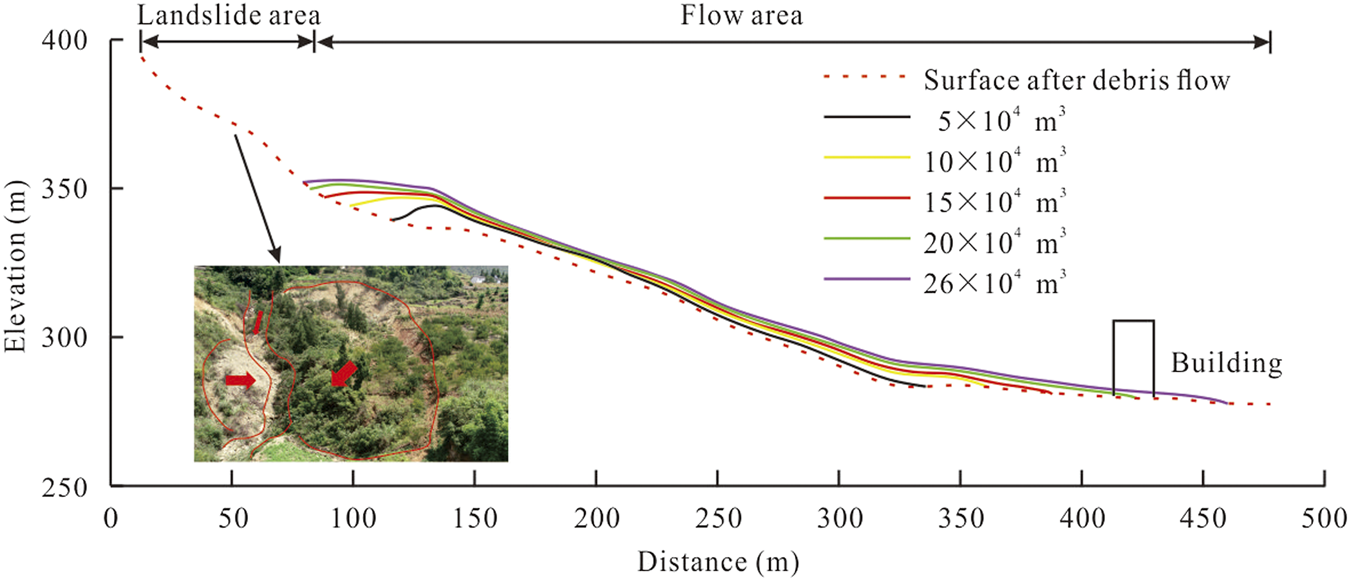
Figures 13–15 present the accumulation morphology, movement velocity, and accumulation thickness of debris flows at different source volumes. When the volume of the material source was 5 × 10⁴ m3, due to the small volume of the material source, the accumulation thickness was small, and the movement distance was limited. The thickness of the accumulation body reached its maximum value of 11 m at the horizontal distance of 130 m, with a movement distance of the debris flow of approximately 250 m and a maximum speed of 16 m/s, located at the horizontal distance of 130 m. Subsequently, the speed gradually decreased until it slid to the horizontal distance of 340 m and stopped, not impacting any buildings, such as residential buildings. When the volume of the source was 10×104 m3 and 15 × 104 m3, the distance of the debris flow was 280 m and 300 m, respectively, and the maximum velocity was 17.5 m/s and 19.0 m/s, respectively. The debris flow did not reach the house at the gully entrance, so it did not affect the house and other buildings. When the volume of the material source was 20 × 104 m3, the debris flow moved approximately 340 m and reached a maximum velocity of 20.5 m/s at a horizontal distance of 150 m. The debris flow collided with buildings, such as houses at the gully entrance, at a lower velocity with a horizontal distance of 415 m and stopped after it reached a horizontal distance of 425 m. When the volume of the material source was 26 × 104 m3, due to its larger volume, the movement distance of the debris flow was greater, along with the accumulation thickness. The movement distance of the debris flow was approximately 375 m. The terrain at the horizontal distances of 130 m and 335 m was relatively flat, which is conducive to the accumulation of mudslide materials, and the accumulation thickness at these two places was relatively large, at 12.5 and 7.5 m, respectively. The maximum velocity of the debris flow was 21.5 m/s at a horizontal distance of 150 m, and buildings, such as residential houses, were located in the path of the debris flow movement and would suffer from debris flow impacts and siltation, threatening the safety of the residents on both sides of gully entrance #2.
FIGURE 13
Morphology of accumulation formed by different landslide volumes.
FIGURE 14
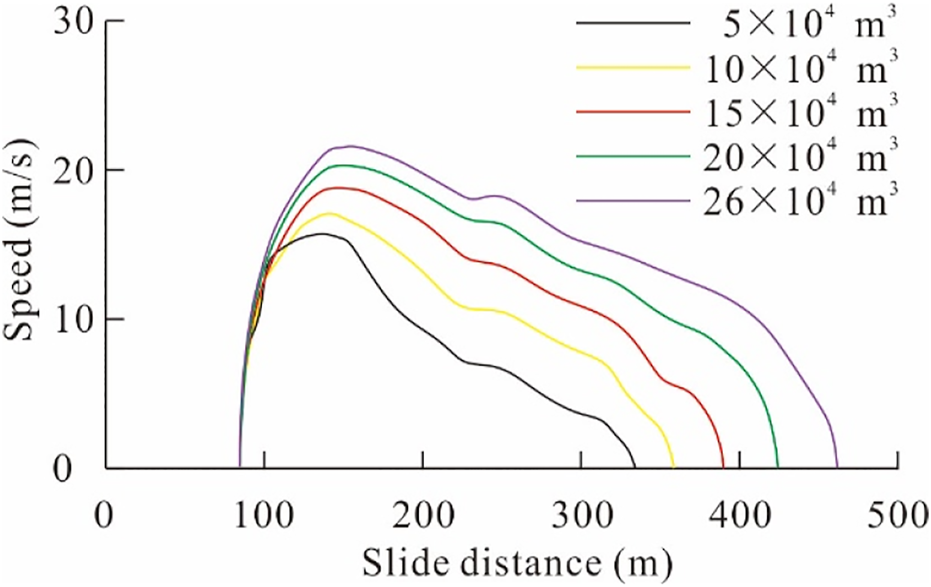
Velocity versus slide distance for different landslide volumes.
FIGURE 15

Thickness versus slide distance for different landslide volumes.
The movement distances, velocities, thicknesses, and morphologies of debris flows under different working conditions were calculated for debris flows with different source volumes to provide a basis for future disaster prevention and mitigation of the Xigou debris flow.
6.2 Impact of debris flow on buildings
The debris flow impact force is the most important indicator for assessing building resistance to debris flow damage (Hu et al., 2012), and its magnitude is related to the debris flow velocity, volumetric weight, etc. Determining the impact force of debris flows on buildings is the most important step when designing debris flow control projects.
The impact force of debris flow on residential houses in the accumulation area can be calculated by the following equation (T/CAGHP 006–2018, 2018):where is the overall impact pressure of the debris flow (kPa); is the volumetric weight of the debris flow (kN/m3); is the flow velocity of the debris flow (m/s); is the acceleration of gravity (m/s2); is the angle between the force surface of the building and the impact force direction of the debris flow (°); and is the building shape coefficient, which is 1.0 for circular buildings, 1.33 for rectangular buildings, and 1.47 for square buildings.
On 18 June 2018, a debris flow disaster occurred in the study area, resulting in two residential houses and the ground floor of a residential building at the gully entrance being buried, and Eq. 3 was used to calculate the impact force of this debris flow on the residential houses and other buildings. Figure 13 shows that the debris flow movement affects the residential houses and other buildings at the gully entrance under the working conditions of the debris flow source volume of 20 × 104 m3 and 26 × 104 m3 in the landslide area. Therefore, the impact forces of the debris flow on the residential houses and other buildings under these two working conditions were also calculated to predict the degree of damage caused by the debris flow to the residential houses.
The impact force of Xigou debris flow at the entrance of the gully was calculated to be 28.67 kPa, and the impact force of the debris flow on the houses was 39.19 and 241.37 kPa for the source volumes 20 × 104 m3 and 26 × 104 m3, respectively (Table 3). Zanchetta (2004) analyzed the relationship between the debris flow impact force and the damage to buildings and proposed a damage rating for buildings under debris flow impact. When the impact force of the debris flow is stronger than 90 kPa, the building is completely destroyed; when the impact force is less than 90 kPa but greater than 35 kPa, most of the building is severely damaged; and when it is less than 35 kPa, the building is slightly damaged. Figure 4C shows the damage to two residential buildings at the gully entrance, which suffered frontal impacts from the debris flow, with severe damage to doors, windows, and walls, including partially broken walls, and the ground floor was covered in silt but suffered no structural damage. According to the damage levels of buildings under the debris flow impact proposed by Zanchetta et al. (2004), it is presumed that when the material source volume is 20 × 104 m3, buildings, such as residential houses, at the entrance of the gully will suffer more serious debris flow impacts, and some walls will be punched through and some floors will be covered in silt. When the material source volume is 26 × 104 m3, residential houses at the gully entrance will be completely demolished.
TABLE 3
| Working conditions | (kN/m3) | (m/s) | (°) | (m/s2) | (kPa) | |
|---|---|---|---|---|---|---|
| Xigou Debris Flow | 1.33 | 20.00 | 3.25 | 90 | 9.8 | 28.67 |
| Working conditions for 20×104 m3 | 1.33 | 20.00 | 3.80 | 90 | 9.8 | 39.19 |
| Working conditions for 26×104 m3 | 1.33 | 20.00 | 9.43 | 90 | 9.8 | 241.37 |
Calculation results of the impact forces of debris flow on the residential houses at the gully entrance.
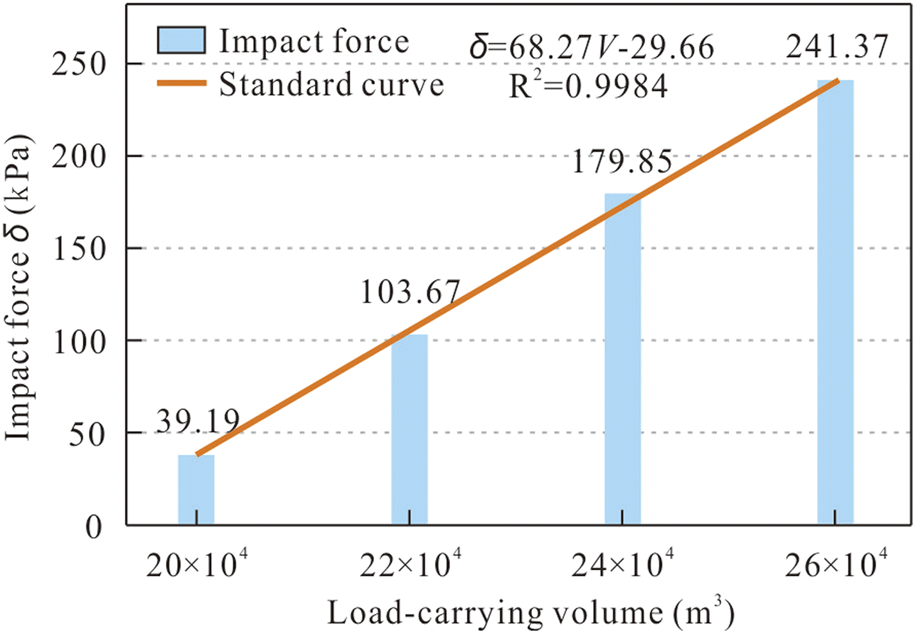
Further calculations of the impact forces generated by the debris flow with material source volumes of 20 × 104 m3, 22 × 104 m3, 24 × 104 m3, and 26 × 104 m3 led to the following equation for the relationship between the material source volume and impact force under general conditions:where is the overall impact force of the debris flow (kPa) and is the volume of the debris flow source (m3).
As the debris flow material source volume increases, the impact force generated by the debris flow increases linearly (Figure 16). Thus, the magnitude of the impact force that will be generated by the debris flow can be further predicted by measuring the material source volume of the debris flow.
FIGURE 16
Association between debris flow material source volume and its impact force.
Several suggestions have been proposed to avoid damage to buildings from debris flows: (1) Construct interceptor gullies and diversion channels upstream of the debris flow formation area to intercept some of the flood water and reduce the flood peak. (2) Set up tailing dams in the gullies to stop the mud and sand and reduce the size of debris flows. (3) Reinforce debris flow retaining walls behind residential houses to prevent water flow and debris flow from directly washing over the foot of the slope.
7 Conclusion
Taking the Xigou debris flow as an example, this paper summarizes and analyzes the development characteristics of the debris flow and its destabilization mode based on field investigation. The process of initiation-movement-accumulation was simulated, and the debris flow dynamics analysis was conducted using the dynamics software DAN-W with the rheological model and parameters of the back analysis of the Xigou debris flow. The main conclusions are as following.
(1) Heavy rainfall is the main trigger for Xigou debris flows. Their formation process is divided into three main phases: initiation, amplification, and siltation.
(2) The F-V-F rheological model well simulated the movement distance and accumulation morphology of the debris flow via the DAN-W software. The duration of Xigou debris flow movement is approximately 40 s, the maximum velocity is 37.1 m/s, the maximum thickness of the accumulation is 18.7 m, and the farthest movement distance is 930 m.
(3) After the debris flow moved to the landslide area, it continuously scraped and scoured the bank slopes on both sides of the gully channel, resulting in failure of the landslide. The loose landslide mass moved downstream with the debris flow, and provide the new material source of the debris flow. For the remaining landslides, the numerical simulation predicts the movements of landslides with different volumes after transformation into debris flows. It is presumed that after the volume of material source exceeds 20×104 m3, the movement of debris flows will affect the safety of buildings such as residential houses at the gully entrance.
Statements
Data availability statement
The original contributions presented in the study are included in the article/supplementary material, further inquiries can be directed to the corresponding authors.
Author contributions
ZD: conceptualization, methodology, funding acquisition, and writing-original draft. AZ: investigation, supervision, writing-review, and editing. SW: writing-review and editing. XF: formal analysis. LY: data curation, numerical simulation method. XJ: investigation. HW: investigation.
Funding
This research was funded by the follow-up of the Geological Disaster Prevention and Control Project in the Three Gorges area (Grant Nos. 000121 2019C C C60 001 & 000121 2021C C C60 001), the Hubei Provincial Natural Science Foundation of China (Grant Nos. 2020CFB352) and the Qianlong Plan Top Talent Project of Wuhan Center of China Geological Survey (Grant Nos. QL 2022-06). Special thanks are given to Prof. Yueping YIN, China Institute of Geo-Environment Monitoring. We are also grateful to Prof. O. Hungr for supplying a copy of the DAN-W software.
Conflict of interest
Author LY was employed by the company Wuhan Design and Research Institute Co., Ltd. of China Coal Technology and Engineering Group.
The remaining authors declare that the research was conducted in the absence of any commercial or financial relationships that could be construed as a potential conflict of interest.
Publisher’s note
All claims expressed in this article are solely those of the authors and do not necessarily represent those of their affiliated organizations, or those of the publisher, the editors and the reviewers. Any product that may be evaluated in this article, or claim that may be made by its manufacturer, is not guaranteed or endorsed by the publisher.
References
1
Chang K. T Merghadi A. Yunus A. P. Pham B. T. Dou J. (2019). Evaluating scale effects of topographic variables in landslide susceptibility models using GIS-based machine learning techniques. Sci. Rep.9 (12296), 1603–1604. 10.1038/s41598-019-48773-2
2
Cui P. Chen X. Q. Zhu Y. Y. Su F. H. Wei F. Q. Han Y. S. et al (2011). The wenchuan earthquake (may 12, 2008), sichuan province, China, and resulting geohazards. Nat. Hazards56 (1), 19–36. 10.1007/s11069-009-9392-1
3
Dou J. Yunus A. P. Bui D. T. Sahana M. Pham B. T. (2019). Evaluating GIS-based multiple statistical models and data mining for Earthquake and Rainfall-induced landslide susceptibility using the LiDAR DEM. Remote Sens.11 (6), 638. 10.3390/rs11060638
4
Dou J. Yunus A. P. Bui D. T. Merghadi A. Sahana M. (2020). Improved landslide assessment using support vector machine with bagging, boosting, and stacking ensemble machine learning framework in a mountainous watershed, Japan. Landslides17, 641–658. 10.1007/s10346-019-01286-5
5
Dowling C. A. Santi P. M. (2014). Debris flows and their toll on human life: A global analysis of debris-flow fatalities from 1950 to 2011. Nat. Hazards71 (1), 203–227. 10.1007/s11069-013-0907-4
6
Hu K. Cui P. Ge Y. G. (2012). Building destruction patterns by August 8,2010 debris flow in zhouqu,Western China. J. Mt. Sci.30 (4), 484–490. (in Chinese). 10.3969/j.issn.1008-2786.2012.04.015
7
Hu K. Cui P. Li P. (2014). Debris flow dynamic models and numerical computation. Chin. J. Nat.36 (5), 313–318. (in Chinese). 10.3969/j.issn.0253-9608.2014.05.001
8
Hu X. D. Hu K. H. Tang J. B. You Y. Wu C. (2019). Assessment of debris-flow potential dangers in the Jiuzhaigou Valley following the August 8, 2017, jiuzhaigou earthquake, Western China. Eng. Geol.256, 57–66. 10.1016/j.enggeo.2019.05.004
9
Hungr O. (1995). A model for the runout analysis of rapid flow slides, debris flows, and avalanches. Can. Geotechnical J.32 (4), 610–623. 10.1139/t95-063
10
Hungr O. Evans S. G. Bovis M. J. Hutchinson J. N. (2001). A review of the classification of landslides of the flow type. Environ. Eng. Geosci.7 (3), 221–238. 10.2113/gseegeosci.7.3.221
11
Hungr O. Evans S. G. (2004). Entrainment of debris in rock avalanches: An analysis of a long run-out mechanism. Geol. Soc. Am. Bull.116 (9-10), 1240–1252. 10.1130/b25362.1
12
Hungr O McDougall S. (2009). Two numerical models for landslide dynamic analysis. Comput. Geosciences35, 978–992. 10.1016/j.cageo.2007.12.003
13
T/CAGHP 006-2018 (2018). Specification of geological investigation for debris flow stabilization. Beijing, China: China Geological Disaster Prevention and Engineering Industry Association.
14
Liu G. N. Wu Y. Wang S. C. Liao J. Yu S. W. (2022). The Main Water Environmental Issues and Assessment-zonation of Eco-environmental Geology Risks for Typical River-lake-wetland Systems in the Central Yangtze River. South China Geology38 (2), 226–239. (in Chinese).
15
Lee D. H. Cheon E. Lim H. H. Choi S. K. Kim Y. T. Lee S. R. (2020). An artificial neural network model to predict debris-flow volumes caused by extreme rainfall in the central region of South Korea. Eng. Geol.281 (4), 105979. 10.1016/j.enggeo.2020.105979
16
Qiu H. J. Zhu Y. R. Zhou W. Q. Sun H. S. He J. Y. (2022). Influence of DEM resolution on landslide simulation performance based on the Scoops3D model. Geomatics, Natural Hazards and Risk13 (1), 1663–1681. 10.1080/19475705.2022.2097451
17
Nocentini M. Tofani V. Gigli G. Fidolini F. Casagli N. (2015). Modeling debris flows in volcanic terrains for hazard mapping: The case study of ischia island (Italy). Landslides12 (5), 831–846. 10.1007/s10346-014-0524-7
18
Sosio R. Crosta G. B. Hungr O. (2008). Complete dynamic modeling calibration for the Thurwieser rock avalanche (Italian Central Alps). Eng. Geol.100 (1-2), 11–26. 10.1016/j.enggeo.2008.02.012
19
Tang H. M. Li C. D. Hu X. L. Su A. J. Wang L. Q. Wu Y. P. et al (2015). Evolution characteristics of the Huangtupo landslide based on in situ tunneling and monitoring. Landslides11, 511–521. 10.1007/s10346-014-0500-2
20
Wang L. Y. Qiu H. J. Zhou W. Q. Zhu Y. R. Liu Z. J. (2022). The post-failure spatiotemporal deformation of certain translational landslides may follow the pre-failure pattern. Remote Sens.14, 2333. 10.3390/rs14102333
21
Wang Q. yao L. K. (2007). Lattice Boltzmann method and its application in the study on deposition of debris flow. J. Catastrophology22 (3), 1–5. (in Chinese). 10.7666/d.y1131768
22
Xing A. G. Wang G. Yin Y. P. Jiang Y. Wang G. Z. Yang S. et al (2014). Dynamic analysis and field investigation of a fluidized landslide in Guanling, Guizhou, China. Eng. Geol.181 (7), 1–14. 10.1016/j.enggeo.2014.07.022
23
Yang L. W. Wei Y. J. Peng L. Wang W. Zhu S. Wang J. et al (2020). Kinematical characteristics of collapse in red beds in kangsu town, wuqia county, xinjiang. J. Eng. Geol.28 (3), 520–529. (in Chinese). 10.13544/j.cnki.jeg.2019-109
24
Yin Z. M. Zhao B. Q. Ye R. Q. (2022). Identification of potential landslides in the head area of the three Gorges reservoir based on time series InSAR. South China Geology38 (2), 273–280 (in Chinese).
25
Zanchetta G. Sulpizio R. Pareschi M. T. Leoni F. Santacroce R. (2004). Characteristics of may 5-6, 1998 volcaniclastic debris flows in the sarno area (campania, southern Italy): Relationships to structural damage and hazard zonation. J. Volcanol. Geotherm. Research133133 (1-4), 377–393. 10.1016/s0377-0273(03)00409-8
26
Zhang C. Yin Y. Yan H. Li H. Dai Z. Zhang N. (2021). Reactivation characteristics and hydrological inducing factors of a massive ancient landslide in the three Gorges Reservoir, China. Eng. Geol.292, 106273. 10.1016/j.enggeo.2021.106273
27
Zhang N. Matsushima T. (2018). Numerical investigation of debris materials prior to debris flow hazards using satellite images. Geomorphology308, 54–63. 10.1016/j.geomorph.2018.02.008
28
Zhao Q. R. Cao S. H. Wen W. F. Zhou L. Y. (2021). Landslide susceptibility evaluation based on weights of evidence method for the Zaoshi reservoir in Shimen county, Hunan province. South China Geology37 (2), 216–225. (in Chinese).
Summary
Keywords
DAN-W, debris flow, development characteristics, disaster mechanism, the three gorges reservoir region
Citation
Dai Z, Zhang A, Wang S, Fu X, Yang L, Jiang X and Wang H (2023) The development characteristics and mechanisms of the Xigou debris flow in the Three Gorges Reservoir Region. Front. Earth Sci. 11:1122562. doi: 10.3389/feart.2023.1122562
Received
13 December 2022
Accepted
04 January 2023
Published
16 January 2023
Volume
11 - 2023
Edited by
Haijun Qiu, Northwest University, China
Reviewed by
Linwei Li, Guizhou University, China
Jie Dou, China University of Geosciences Wuhan, China
Updates
Copyright
© 2023 Dai, Zhang, Wang, Fu, Yang, Jiang and Wang.
This is an open-access article distributed under the terms of the Creative Commons Attribution License (CC BY). The use, distribution or reproduction in other forums is permitted, provided the original author(s) and the copyright owner(s) are credited and that the original publication in this journal is cited, in accordance with accepted academic practice. No use, distribution or reproduction is permitted which does not comply with these terms.
*Correspondence: Anle Zhang, 1548104595@qq.com; Shufeng Wang, 422530802@qq.com
ORCID: Zhenwei Dai, orcid.org/0000-0002-9238-9265
This article was submitted to Geohazards and Georisks, a section of the journal Frontiers in Earth Science
Disclaimer
All claims expressed in this article are solely those of the authors and do not necessarily represent those of their affiliated organizations, or those of the publisher, the editors and the reviewers. Any product that may be evaluated in this article or claim that may be made by its manufacturer is not guaranteed or endorsed by the publisher.