 Federico Scoto1,2*
 Gianluca Pappaccogli1,2Mauro Mazzola3Antonio Donateo1Roberto Salzano4Matteo Monzali5Fabrizio de Blasi3
 Catherine Larose6Jean-Charles Gallet7
 Stefano Decesari8
 Andrea Spolaor3
- 1National Research Council of Italy, Institute of Atmospheric Sciences and Climate ISAC-CNR, Lecce, Italy
- 2Joint Research Center—ENI-CNR Aldo Pontremoli, Lecce, Italy
- 3National Research Council of Italy, Institute of Polar Sciences, ISP-CNR, Venice, Italy
- 4National Research Council of Italy, Institute of Atmospheric Pollution Research, IIA-CNR, Sesto Fiorentino, Italy
- 5Department of Physics and Astronomy—DIFA, University of Bologna, Bologna, Italy
- 6Environmental Microbial Genomics, Laboratoire Ampère, National Scientific Research Council of France (CNRS), University of Lyon, Lyon, France
- 7Norwegian Polar Institute, Tromsø, Norway
- 8National Research Council of Italy, Institute of Atmospheric Sciences and Climate (CNR-ISAC), Bologna, Italy
The snow season in the Svalbard archipelago generally lasts 6–10 months a year and significantly impacts the regional climate, glaciers mass balance, permafrost thermal regime and ecology. Due to the lack of long-term continuous snowpack physical data, it is still challenging for the numerical snow physics models to simulate multi-layer snowpack evolution, especially for remote Arctic areas. To fill this gap, in November 2020, an automated nivometric station (ANS) was installed ∼1 km Southwest from the settlement of Ny-Ålesund (Spitzbergen, Svalbard), in a flat area over the lowland tundra. It automatically provides continuous snow data, including NIR images of the fractional snow-cover area (fSCA), snow depth (SD), internal snow temperature and liquid water content (LWC) profiles at different depths with a 10 min time resolution. Here we present the first-year record of automatic snow preliminary measurements collected between November 2020 and July 2021 together with weekly manual observations for comparison. The snow season at the ANS site lasted for 225 days with an annual net accumulation of 117 cm (392 mm of water equivalent). The LWC in the snowpack was generally low (<4%) during wintertime, nevertheless, we observed three snow-melting events between November and February 2021 and one in June 2021, connected with positive temperature and rain on snow events (ROS). In view of the foreseen future developments, the ANS is the first automated, comprehensive snowpack monitoring system in Ny-Ålesund measuring key essential climate variables needed to understand the seasonal evolution of the snow cover on land.
1 Introduction
Snow cover is a key component in polar regions and, besides the ocean, is the second largest interface between the atmosphere and the Earth’s surface during winter (Valt and Salvatori, 2016). The annual snow layer is critical to the surface mass balance of the glaciers, as it is the result of snow accumulation and ablation, with the former controlled by the snowfall rate and the latter depending on the net incoming energy flux at the surface (Kumar et al., 2019). On a larger scale, owing to its high reflectivity in the visible light range and to the significant mass of water stored in it, seasonal snow cover also has a strong impact on regional and global energy and water cycles. In addition, due to its high specific surface area, snow is capable of absorbing and scavenging a wide variety of natural and anthropogenic gases, particles, and contaminants from the atmosphere, which are eventually preserved within the seasonal snowpack until summer snowmelt (Gallet et al., 2011; Spolaor et al., 2014; Vecchiato et al., 2018; Burgay et al., 2021). Snowpacks also constitute habitats for precipitated microorganisms that actively interact with their physico-chemical environment and are driven by ecosystem changes (Els et al., 2019).
In the Arctic Archipelago of Svalbard, the seasonal snowpack covers ∼60 to 100 percent of the land between winter and summer (Gallet et al., 2019). From a physical point of view, snow deposited on land or ice surfaces is thermodynamically unstable and very sensitive to changes both in weather and/or climate conditions. In fact, the snowpack is an extraordinarily dynamic medium that can vary throughout the season from non-isothermal to isothermal conditions (Singh, 2011). During winter, it is usually composed of a succession of snow layers with different densities depending on the processes by which they have been subjected (i.e., wind-compacted layers, melt-refrozen layer, ice layer, bottom hoar). This condition leads to a non-homogeneous thermal profile of the snowpack, with temperatures generally lower at the snow-air interface and higher at the base of the snowpack (Fierz, 2011). Such a thermal gradient promotes the metamorphosis of snow crystals, resulting in recrystallization and faceting within the snowpack (Pinzer and Schneebeli, 2009; Pinzer et al., 2012). Another process that can significantly alter the chemo-physical properties of the snowpack frequently occurs in autumn and winter when, due to the presence of a semi-continuous weather front between the cold masses of Arctic air and the warmer air of the polar cell (Urbański and Litwicka, 2022), Svalbard weather is often subjected to rapid changes. Incursions of southerly mild moist air can lead to significant atmospheric warming (with a relative increase up to 20°C–25°C), shifting temperatures from well below zero values to positive, in a matter of a few days. Such short-lived intrusions of warm spells can carry aerosols originating in the mid-latitudes and moisture (Spolaor et al., 2021), causing rainfall events commonly identified as “rain on snow events” (ROS) (Serreze et al., 2021). In a warmer climate scenario, the ROS are predicted to increase during winter linked with the weakening of the polar vortex, warmer sea waters, and the disappearance of sea ice (Bintanja and Selten, 2014; Bintanja and Andry, 2017; Müller et al., 2022). Finally, in response to increasing temperatures and insolation in late spring and summer, especially in the coastal region, the snowpack is subject to melting, becoming isothermal and homogeneous in stratification.
Over the last decades, due to positive-feedback processes involving several components of the Earth system (Goosse et al., 2018), the Arctic region is experiencing an enhancement of near-surface air temperature 3 to 4 times more compared to lower latitudes and the global mean: a process widely known as Arctic Amplification (Maturilli et al., 2013; Previdi et al., 2021; Rantanen et al., 2022). In this perspective, a deeper understanding of the physical snowpack evolution in response to the ongoing atmospheric warming is critical to better evaluate and model future interactions between a changing snow cover and other Earth’s compartments, including atmosphere, glaciers, soils, freshwater networks, ocean, and sea ice (Gallet et al., 2019). Moreover, continuous observations of snow depth and physical properties carried out in parallel to atmospheric aerosol observations at the nearby stations of Gruvebadet and Zeppelin provide new opportunities to progress in the understanding of the potential effect of black carbon and dust deposition on snow albedo and metamorphism (AMAP, 2015). Finally, the understanding of melt water penetration in the snowpack and internal refreezing also needs to be improved due to the complexity of the processes involved and the lack of field observations (D’Amboise et al., 2017).
Manual measurements of the main snow physical properties (e.g., temperature, density, snow stratigraphy, layer harness, type of crystals, specific surface area) are usually carried out directly in the field through the snow pit technique, which consists of digging a trench in the annual snowpack and acquiring the snow physical parameters at different depths (Gallet et al., 2019). This technique is the most widely used and valuable to compare measurements collected in different sites, in order to assess the spatial variability of the snowpack conditions. The snow pit approach, however, requires the snowpack to be altered or disrupted, it is time-consuming and provides only a snapshot of a broader annual variability of the snow cover. As a valid alternative to field work measurements, a new generation of non-invasive field devices installed on near-surface-based automatic nivometric stations, has given the possibility to continuously measure different snowpack physical properties, such as snow depth, snow temperature profile, snow surface temperature, water liquid content, snow water equivalent and many others (Kinar and Pomeroy, 2015). To date, automatic observations of the snow cover are regularly conducted by snow and avalanche services primarily in mountain areas to provide the public with timely information about the snow condition and avalanche hazards (Pirazzini et al., 2018). The data obtained from snow monitoring, although punctual, are crucial and lead to an improvement in physical and chemical models of the snowpack, providing high-resolution inputs to numerical climate models, hydrology, snowpack evolution (Kinar and Pomeroy, 2015; Pirazzini et al., 2018). In the polar regions, instead, long-term automatic measurements of the snowpack for scientific purpose are relatively scarce and limited to few study cases due to severe weather conditions and extremely challenging logistics (Pfeffer and Humphrey, 1996; Järvinen et al., 2013; Gallet et al., 2019; Domine et al., 2021; Royer et al., 2021).
In late 2020, to fill this observational gap and assist in the interpretation of the distribution of chemical species in the snowpack, an automated nivometric station (ANS) was installed in Ny-Ålesund in West Spitzbergen, Svalbard. It provides continuous measurements of snow depth (SD), snow thermal profile, liquid water content (LWC) and fractional snow-cover area (fSCA). In this paper, we present the ANS instrumental set-up, the first-year record of preliminary measurements collected together with manual observations for comparison, the main issues encountered and the possible future implementations to fully assess the temporal evolution of the snowpack in real time.
2 Study site and instrumental set-up
Located along the coast of the Kongsfjord, on the western side of Svalbard, Ny-Ålesund is the world’s second northernmost year-round research station hosting research projects and long-term observation series. In November 2020, the first instrumental set-up of the automated nivometric station was installed on a flat area over the tundra in the proximity of the Gruvebadet Aerosol Laboratory, ∼1 km Southwest from Ny-Ålesund (78° 55.018’ N, 11° 53.698’ E, 43 m a.s.l., Figure 1). A 2-m high triangular truss, constituting the supporting structure of the ANS, was fixed to the ground through steel cables and anchor rods, adjacent to a delimited area dedicated for the year-round monitoring of snow chemistry since 2018.
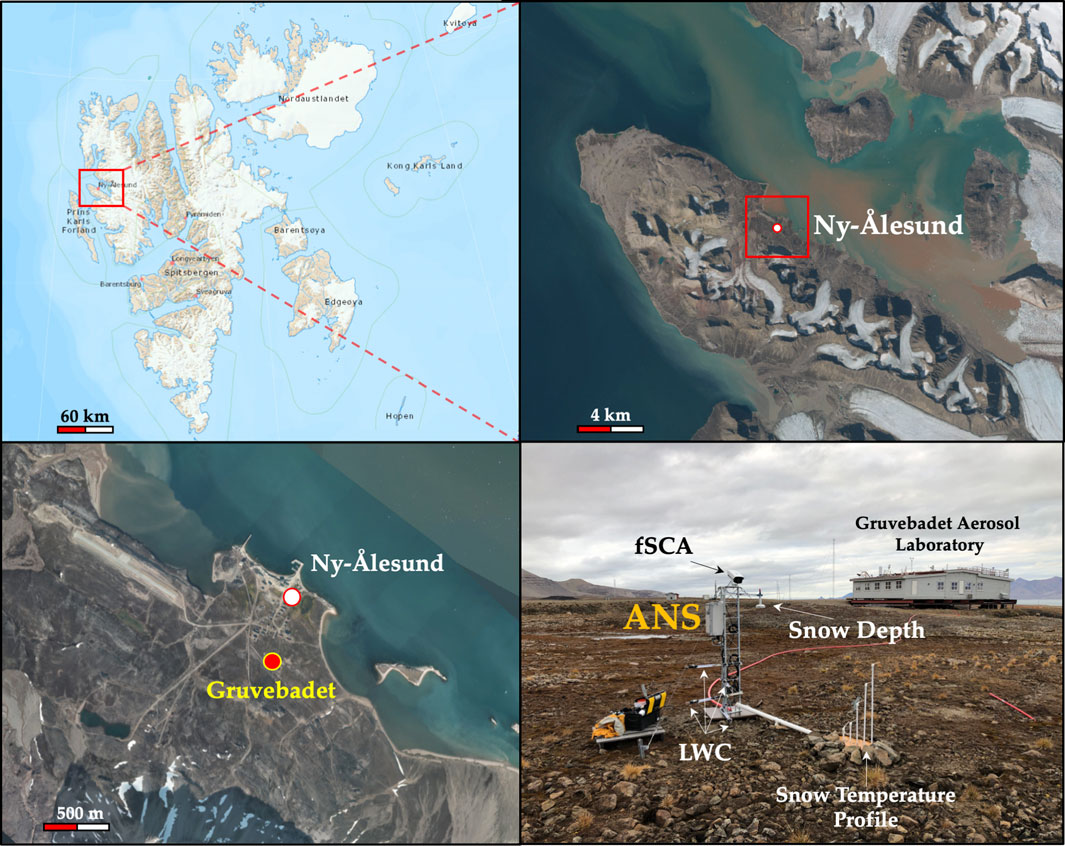
FIGURE 1. Location and general view of the instrumental set-up composing the Automated Nivometric Station (ANS) installed in Ny-Ålesund (Svalbard) in November 2020. Maps and satellite images from TopoSvalbard (https://toposvalbard.npolar.no/).
The original instrumental set-up includes an ultrasonic snow-meter sensor measuring snow depth (model NESA-LU06, Resolution = 1mm, Accuracy <0.1% full-scale value at 20°C), 6 Resistance Temperature Detectors (RTD) Pt100 to measure the snowpack thermal profile (model NESA-TT, Sensitivity = 0.01°C, Accuracy ≤0.1°C) and 4 frequency domain reflectometry (FDR) soil moisture sensors to detect the amount of liquid water content within the snowpack (model NESA-SM1, Sensitivity = 0.1%, Precision = ±2%). In addition, in April 2021, the existing ANS infrastructure was implement with a near-infrared (NIR) time lapse-camera to calculate the fractional snow-cover area and observe specific processes occurring at the snow surface (i.e., roughness, wind crust formations, snow metamorphism, etc.). The NIR camera is equipped with a Sony IMX219 sensor (8 Megapixel resolution), installed in a heated housing mounted on top of the ANS truss, and coupled to an IR light source. The sensor was modified by removing an IR cut filter and adding a Storaro blue NIR filter. This last filter allows the removal of the red colour component and the detection of the near-infrared light component. The camera was programmed to shoot an oblique picture of the snow surface every hour (Figure 1). To obtain an accurate measure of the snow temperature at different snow depths and minimise the disturbance of the ANS structure on the free settlement of the snowpack, we designed and built a separate support unit on which temperature sensors were installed. The separate unit is composed of 6 Pt100 thermistors supported by vertical PVC pipes with different heights (5, 25, 50, 75, 100, 125 cm above the ground level), fixed to a wooden base ∼2 m far from the ANS supporting truss (Figure 1). Snow temperature measurements are obtained only by sensors that were completely buried by snow. To assess whether a given sensor was effectively surrounded by snow, we combine automatic snow depth measurements with time-lapse imagery from the NIR camera. Temperatures provided by sensors not completely buried by snow were discarded. Moreover, to record the LWC variations at different snow depths, we installed 4 Frequency Domain Reflectometry (FDR) moisture sensors on the extremity of their supporting arms at 25, 50, 75, 100 cm above the ground, respectively. The supporting arms were distributed radially around the ANS truss with an outreach of about 50 cm, to reduce the physical interference among them (especially during the melting season) and ensure that each sensor is fully immersed in the snow at its corresponding level. All the sensors were calibrated by their manufacturing companies, checked before installation, and connected to a datalogger (model NESA-Evolution) for continuous acquisition. Snow physical properties are measured every 10-s and logged with 10-min time resolution. The datalogger was powered by 220V A/C electrical supply (with a 12V back-up battery) and connected to the internet via Ethernet. Data transfer is assured by FTP connection through the local network. More detailed information about data coverage, sampling time resolution and other technical specifications of the snow monitoring system installed on the ANS, is provided in Table 1.
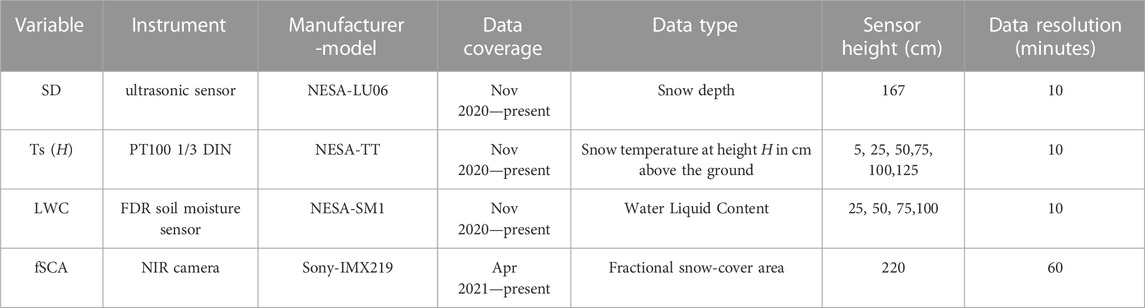
TABLE 1. Description of the instrumental set-up installed on the ANS updated to 2021.
3 Results and discussion
In the following sections, we present the first-year measurements of snow depth, snow temperature and LWC profiles acquired in Ny-Ålesund during the snow season between November 2020 and July 2021. We complement our observational record with measures of the fSCA derived from NIR time lapse imagery starting in late spring and lasting until the end of the snow melting season (April-June 2021). We also show manual measurements of snow depth and snow temperature profiles carried out at weekly resolution for comparison.
3.1 Snow depth
Continuous snow depth (SD) measurements of the seasonal snow cover are shown in Figure 2. The raw data acquired by the ultrasonic sensor were corrected for the sensor height (167 cm). We considered 1 cm of snow, or greater, to define the first and last day of the snow season. The snow cover lasted a total of 225 days between 16 November 2020, and 30 June 2021. In this regard, it must be mentioned that, when the ANS was installed in the field on 7 November 2020, the snowpack was between 10–15 cm deep (Figure 3A). On November 12th and 15th, however, two extreme events characterised by unusual warm temperatures (7.9°C and 6.1°C, respectively, with the former being the highest temperature ever recorded in Ny-Ålesund in November) and intense rainfall (15.8 and 29 mm of total precipitation) caused the snow layer to melt completely, exposing the tundra-covered ground again (Figure 3B, weather data from MET Norway). From November 16th onward, the snow cover gradually increased through at least 15 snow deposition events, reaching the maximum height of 117 cm on 21 May 2021 (Figures 3C, D). To assess the accuracy of the automated SD observations, routinely control checks were carried every week through manual measurements in the nearby snow-camp dedicated to snow sampling activities, or by visual inspection of the NIR camera images in which a graduated pole is framed. (Figure 2).
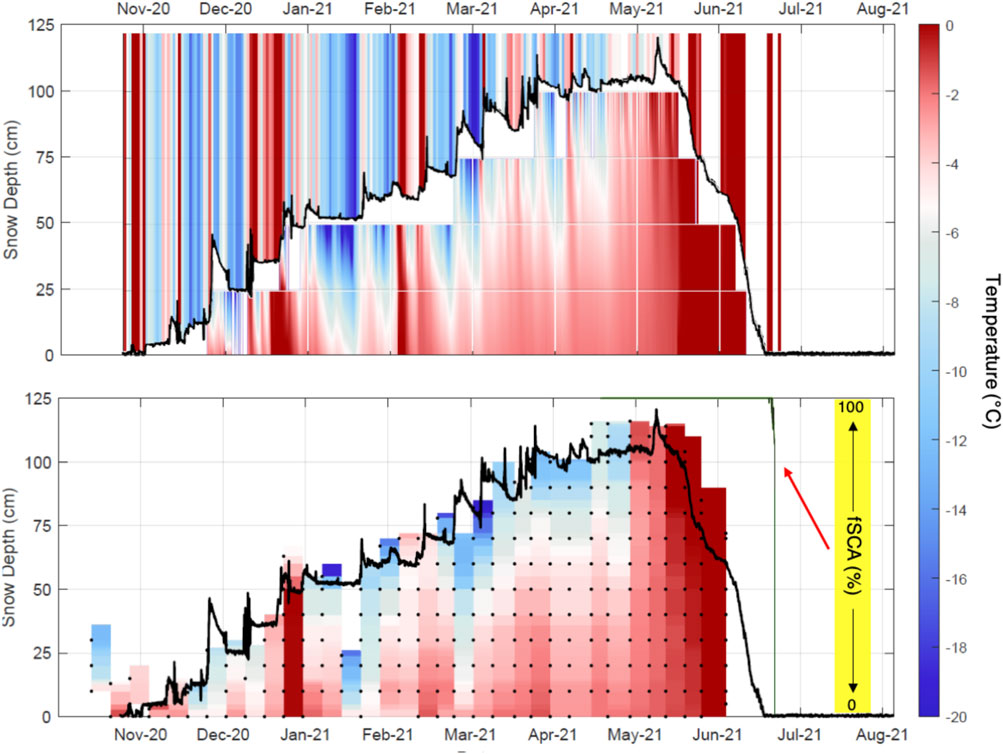
FIGURE 2. Snow depth and temperature profile in Gruvebadet (Ny-Ålesund) over the snow season 2020–2021. In both panels, the tick black line indicates the snow depth acquired by the ultrasonic sensor. The upper panel shows the thermal gradient of the snowpack inferred from the ANS temperature sensors (installed at 5, 25, 50, 75, 100, 125 cm) with vertical-colored stripes in the background indicating the 2-m air temperature at the Climate Change Tower (CCT) about ∼700 m far from Gruvebadet. Lower panel shows manual measurements of snow height and snow temperature carried every week for comparison. Finally, the dark green line indicates the fractional snow-cover area (fSCA) retrieved by the NIR camera during the melting season.
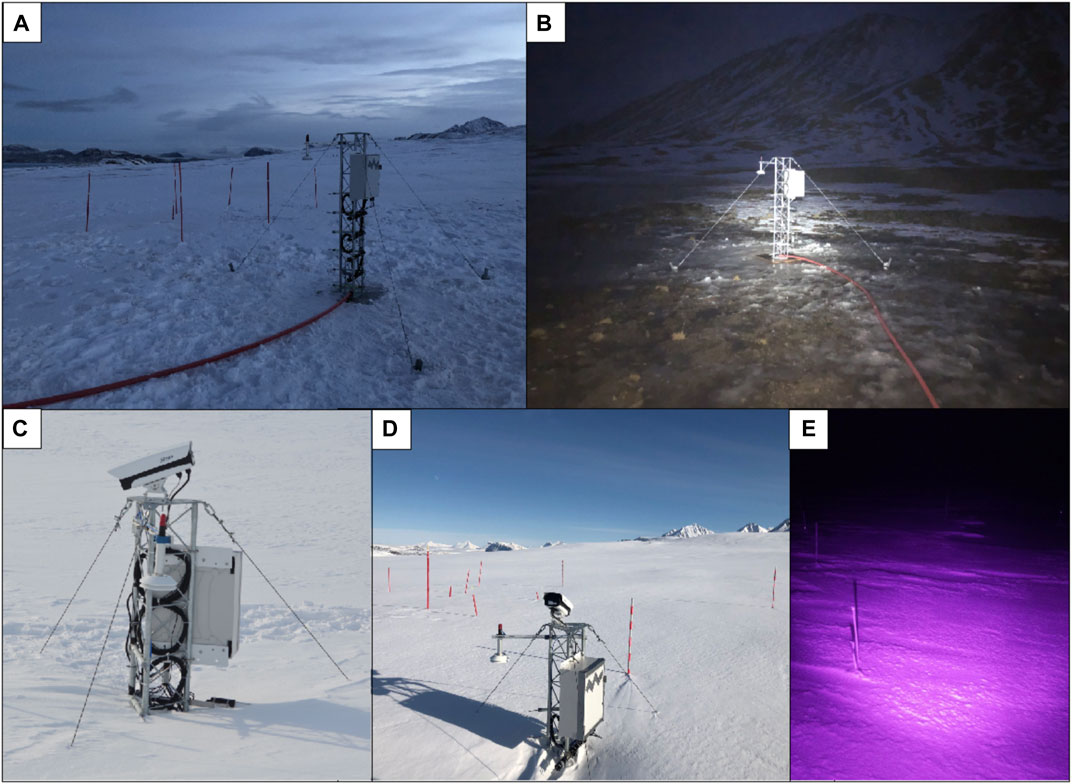
FIGURE 3. The automated nivometric station (ANS) installed in Gruvebadet (Ny-Ålesund) close to the snow sampling area on (A) November 7th, and (B) 12 November 2020, after a ROS event. Note that the snow temperature sensors were originally installed directly on the ANS truss, however, after the ROS events we decided to move them to the separate unit to minimise the disturbance of the ANS main structure. (C–D) The NIR camera installed in April 2021 on the top of the ANS truss and (E) a nocturnal image from the NIR camera in which snow temperature sensors are visible. To assess whether a given temperature sensor was effectively surrounded by snow during the snow season, snow depth measurements are combined with time-lapse imagery.
3.2 The snow temperature profile
Snow temperature profile of the snowpack during the first year of observation is shown in Figure 2. It reflects the temperature distribution of the snowpack at one point in both space and time (Fierz, 2011). Although an accurate description of the physical processes affecting the snow temperature profile is not the main objective of this paper, we provide a brief overview of the first-year data collected to show their potential for future specific works. As shown in Figure 2, the snow temperature profile in the top ∼50 cm of the snowpack is strongly influenced by the snow–atmosphere interaction (i.e., daily-mean of 2-m air temperatures acquired in the nearby Climate Change Tower (CCT) (Mazzola et al., 2016). This is generally valid both for the polar night (Nov-Mar) and for the polar day (Apr-June). During January 2nd to 6th, and February 17th to 20th 2021, we observed two warming events, in both cases associated with ROS (with 44.1 and 3.7 mm of total precipitation respectively, data from MetNorway), that led, at least the first basal 25 cm of the snowpack, to the melting point. From the beginning of March, when the snowpack was constantly >75 cm, the considerable insulating capacity of the snowpack is also evident. Indeed, external heat penetrated only through the upper 30–50 cm of the snowpack, as also found in an earlier study by Fierz (2011). In contrast, below the upper part, snow temperature is strongly attenuated with depth, and the temperature profile seems to be affected only by longer cycles than diurnal. Finally, from mid-to-late May, the snow temperature profile of the snowpack was constantly at 0°C becoming, in turn, isothermal at the melting point. For the snow season 2020–21, the melting period of the snow cover at the ANS site lasted a total of 39 days. The Pearson correlation coefficient between manual and automatic snow temperature measurements (out of a total of 178 observations) is r = 0.92* (excluding 12 outliers* with a difference between manual and automatic snow temperature >5°C or < −5°C) and r = 0.85 considering all the observations (not shown). Since manual observations were carried once a week, usually between 01:00 and 02:00 p.m., while automatic measurements are continuously acquired every 10 min, for comparison we averaged the latter over a six-hour time window centered at 13:30 on the day of manual sampling.
3.3 Snow liquid water content
Liquid water content (LWC), or wetness, is defined as the amount of water within the snow that is in the liquid phase (Pirazzini et al., 2018). The presence of liquid water in snow can originate from either melting, with liquid water partially filling the pore space (Fierz et al., 2009), rain events (Serreze et al., 2021), or a combination of the two. An increase in the LWC of the snowpack leads also to an onset of meltwater runoff within a catchment, which is important information for flood predictions, especially during intense melting events linked with warm air temperatures (Pérez Díaz et al., 2017). In Figure 4, we show measurements of LWC in the snowpack during selected periods of the year expressed as volume (LWCV) fraction and reported as a percent (%). Liquid water can move in the snowpack only if the content of residual or irreducible water (i.e., the water that can be held by surface forces against the pull of gravity for capillary action), is exceeded (Fierz et al., 2009). Depending on the snow type, residual water content in snow corresponds to a volume fraction of about 3%–6% (Fierz et al., 2009).
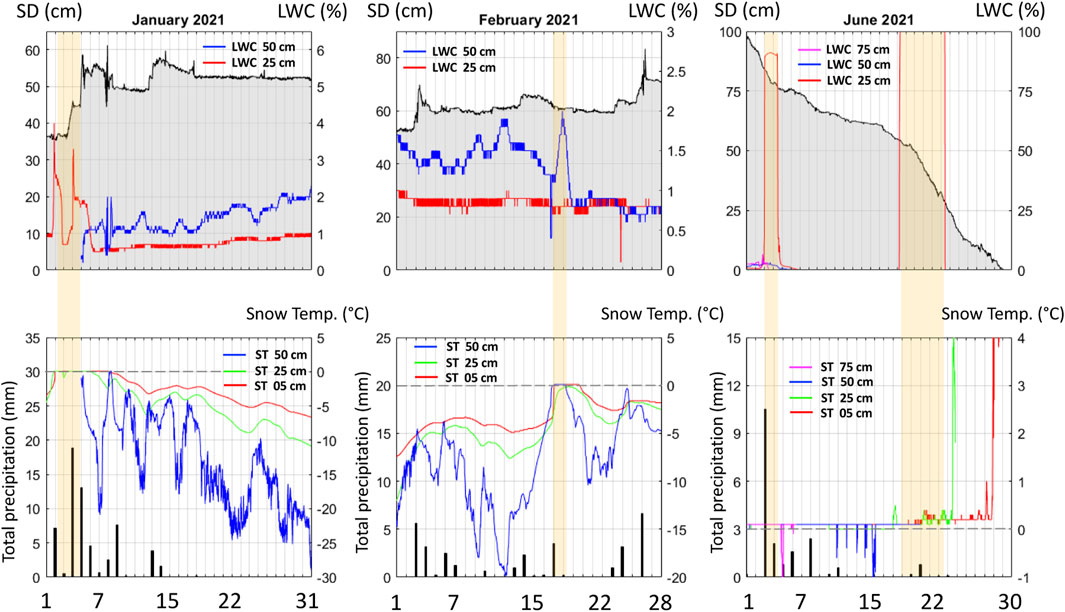
FIGURE 4. Snow height (upper panels), snow temperature (middle panels) and LWC (lower panels) in January, February, and June 2021. Yellow bands indicate the warming events associated with ROS and enhanced seasonal melting (late June).
Consistent with the snow temperature profile, during the two warming events of January and February 2021, we observed an increase in the LWC at the first basal 50 cm of the snowpack, even though the two events present a different behaviour (Figure 4). On January 1st and 4th, the LWC sensor located at 25 cm above the ground recorded two repeated pulses from 0.9% to 3.2% (concomitant with the increase in snow temperature from −2.9°C to 0°C) and from 0.7% to 3.1%, in a matter of 6 and 16 h respectively. Interestingly, during the second warming event of February 16th and 17th, the snow LWC at 50 cm above the ground varied from 0.4% to 1.9% in ∼26 h, while the sensor at 25 cm did not show any significant change, remaining relatively stable between 0.7%–0.9%. This different response might suggest the presence of an ice layer between the two sensors (probably formed after the first ROS event of January), which could have acted as a physical barrier for downward water mobility during the new warming event. Finally, on June 2nd to 5th 2021, when the snowpack was already at the melting point, we observe a final ROS event that caused a significant decrease in the snow depth of about 15 cm, together with a rapid increase in LWC in the first basal 25 cm up to 90% From June 18th to 24th, the same basal snow layer at the bottom of the snowpack was 100% soaked with water (Figure 4).
3.4 Near-infrared camera images
Terrestrial photography is the selected technique for assessing the snow cover phenology on the surface close to the ANS. Based on the current setup of the NIR time-lapse camera, two information components can be retrieved: i) the quantitative estimation of the fractional snow-cover area (fSCA); ii) the qualitative description of the surface condition in front of the camera. While fSCA represents the percentage of a defined area covered by snow (Salzano et al., 2019), the availability of these images also supports the description of the surface (Salzano et al., 2021) in terms of spatial heterogeneity (shadows, surface water, and ice crust) and surface roughness (flat or rippled surface). The availability of night-time imagery is therefore another important issue, since the quality check about the experimental setup can be monitored all-round year Figure 3E. The key feature of estimating the fSCA is the availability of spatially representative information (over 20 m2), which can be combined with manual as well as automatic snow height measurements. As shown in Figure 2 (lower panel), comparing automatic snow depth data with fSCA, estimated following the procedure described in Salzano et al. (2019), the latter approach is efficient for having a more reliable description of the snow evolution especially during the melting season. Indeed, according to fSCA measurements, we extended the end of snow cover to 3 July 2021, since snow patches were present in the neighbourhood of the ANS measurement site.
4 Limitations and future developments
Although the snow physical data acquired by the ANS during the first year of snow monitoring in Ny-Ålesund showed a high potential for future developments, we would highlight some technical issues encountered during the snow season to suggest some possible solutions. First, we point out that, especially after heavy rainfall, the snowpack level sensor can convey water underneath, creating a melting cone and altering the snow height measurement. Although this problem cannot be physically avoided, a possible solution is to compare the SD measured by the ultrasonic sensor with the SD data inferred from the NIR camera images to assess possible bias between the two positions.
Secondly, we did not have information about snow temperature between the snow surface and the highest temperature sensor not discarded (as shown in Figure 2). These data gaps can be filled by employing an infrared snow surface temperature sensor. This improvement will allow for a more comprehensive picture of the snowpack thermal gradient, from the bottom to the surface. In this perspective, measuring near-surface atmospheric temperature directly at the ANS site could provide more accurate details about the air-snow surface interactions from both a physical and a chemical point of view. Third, although a direct measure of the bulk density of the snowpack can be obtained only by manual measurements, it can be indirectly inferred from the combined automatic measurements of snow water equivalent (SWE) (e.g., using a snow pillow, a neutron probe, or a Snowpack Analyser) and snow depth (Pirazzini et al., 2018). Since the ANS is already equipped with an ultrasonic snow level sensor, we foresee coupling it with a SWE sensor to automatically retrieve snow density variations during the snow season. This will enhance the harmonisation of the measurements with other snow observational study sites, in line with the indications provided by the Global Cryosphere Watch Initiative for improving in-situ snow depth and SWE observations (Brun et al., 2013). Last but not least, at the beginning of polar night, we reported damages to the separate unit of the ANS holding the snow temperature probes, due to the presence of a reindeer. Future developments of the ANS will include a fence to shield the instruments from local fauna and vice versa.
5 Conclusion
This work aims to present the instrumental set-up composing our ground-based automated nivometric station (ANS), installed in November 2020 in Ny-Ålesund, Svalbard. In addition to the instrumental specification, we provide two records of automatic and manual measurements of snow depth and snow temperature together with a record of liquid water content in the snowpack acquired over the first year of snow monitoring (winter 2020 - summer 2021). Furthermore, in April 2021, we installed a near-infrared time lapse camera to measure the fractional snow-cover and observe surface snow features. The snow season lasted 225 days in total, between November ‘20 and June ‘21, with a maximum snow depth of 117 cm observed in May 2021. During both winter and summer periods, we observed a strong connection between near-surface atmospheric temperature and the snow temperatures in the upper 50 cm of the snowpack. In contrast, lower snow layers were less affected by external temperature changes at least on diurnal time scales. The combined information from snow temperature and LWC data indicate four distinct melting events. Three melting events, associated with rain-on-snow events, occurred in a matter of a few days, and only impacted the basal part of the snowpack. The last melting event, corresponding to the summer snow melt, involved the whole snowpack and lasted ∼40 days, until the seasonal snow cover completely disappeared in the first days of July 2021. In this regard, measurements of the fractional snow-cover from the NIR camera indicated that the snow cover lasted 4 days more compared with automatic snow depth measurements by the ultrasonic sensor. In view of the foreseen future developments, including the installation of new sensors for measuring snow surface temperature, near-surface air temperature, and snow water equivalent (SWE), the ANS is the first automated, comprehensive snowpack monitoring system in Ny-Ålesund measuring key snow physical properties. The data collected are fundamental to a deeper knowledge of the snowpack evolution over the snow season and its response to warming climate and/or increased predicted extreme weather events such as rain on snow events. In addition, continuous records of physical snow observations could be extremely valuable to constrain and further develop numerical simulation of the seasonal snowpack with a focus on the distribution and total load of contaminants and impurities as well as to better understand the microbiological activity within it.
Data availability statement
The datasets presented in this study can be found in online repositories. The names of the repository/repositories and accession number(s) can be found below: https://doi.org/10.5281/zenodo.7342300 and https://doi.org/10.5281/zenodo.7342282.
Author contributions
FS and AS conceived and designed the research. FS, GP, AD, MMa, and RS, planned the experimental design, installed, and maintained the instruments. FS, GP, MM, MM, and RS collaborated on data collection and post-processing. FS, GP, AD, MM, MM, and RS carried out the data analysis presented in this paper, developed the codes used to analyse the data and prepared the datasets. AD and SD managed and provided the funding projects. FS drafted the manuscript with contributions from all co-authors. All authors reviewed and edited the manuscript, cooperating to interpret the results, wrote, read, commented, and approved the final manuscript.
Funding
This work has been conducted thanks to the financial support the Joint Research Center ENI-CNR—“Aldo Pontremoli”, WP1 “Impatto delle emissioni in atmosfera sulla criosfera e sul cambiamento climatico nell’Artico”, the Svalbard Science Forum (SSF) for the Arctic Field Grant “Aerosol Flux in Arctic” (ALFA) project (RiS ID 11390; NFR contract 310658). The dataset about the fSCA has been prepared in the framework of the SIOS Core Data (Research Council of Norway, project number 291644, Svalbard Integrated Arctic Earth Observing System—Knowledge Centre, operational phase).
Acknowledgments
Authors acknowledge the Institute of Polar Science (ISP-CNR) and its staff for the logistics of the Arctic Station “Dirigibile Italia” in Ny-Ålesund.
Conflict of interest
The authors declare that the research was conducted in the absence of any commercial or financial relationships that could be construed as a potential conflict of interest.
Publisher’s note
All claims expressed in this article are solely those of the authors and do not necessarily represent those of their affiliated organizations, or those of the publisher, the editors and the reviewers. Any product that may be evaluated in this article, or claim that may be made by its manufacturer, is not guaranteed or endorsed by the publisher.
References
AMAP (2015). AMAP Assessment 2015: Black carbon and ozone as Arctic climate forcers. Oslo, Norway: Arctic Monitoring and Assessment Programme, 116.
Bintanja, R., and Andry, O. (2017). Towards a rain-dominated Arctic. Nat. Clim. Chang. 7, 263–267. doi:10.1038/nclimate3240
Bintanja, R., and Selten, F. M. (2014). Future increases in Arctic precipitation linked to local evaporation and sea-ice retreat. Nature 509, 479–482. doi:10.1038/nature13259
Brun, E., Lawrimore, J., de Rosnay, P., and Friddell, J. (2013). A Global Cryosphere Watch Initiative for improving in-situ snow observations and their access for rescuing/collecting historical in-situ snow data. Geneva, Switzerland: World Meteorol. Organ. Glob. Cryosph. Watch, 5–13.
Burgay, F., Barbaro, E., Cappelletti, D., Turetta, C., Gallet, J.-C., Isaksson, E., et al. (2021). First discrete iron(II) records from Dome C (Antarctica) and the Holtedahlfonna glacier (Svalbard). Chemosphere 267, 129335. doi:10.1016/j.chemosphere.2020.129335
D’Amboise, C. J. L., Müller, K., Oxarango, L., Morin, S., and Schuler, T. V. (2017). Implementation of a physically based water percolation routine in the Crocus/SURFEX (V7.3) snowpack model. Geosci. Model Dev. 10, 3547–3566. doi:10.5194/gmd-10-3547-2017
Domine, F., Lackner, G., Sarrazin, D., Poirier, M., and Belke-Brea, M. (2021). Meteorological, snow and soil data (2013-2019) from a herb tundra permafrost site at Bylot Island, Canadian high Arctic, for driving and testing snow and land surface models. Earth Syst. Sci. Data 13, 4331–4348. doi:10.5194/essd-13-4331-2021
Els, N., Larose, C., Baumann-Stanzer, K., Tignat-Perrier, R., Keuschnig, C., Vogel, T. M., et al. (2019). Microbial composition in seasonal time series of free tropospheric air and precipitation reveals community separation. Aerobiol. (Bologna) 35, 671–701. doi:10.1007/s10453-019-09606-x
Fierz, C. (2011). Temperature profile of snowpack BT - encyclopedia of snow, ice and glaciers, eds. V. P. Singh, P. Singh, and U. K. Haritashya (Dordrecht: Springer), 1151–1154. doi:10.1007/978-90-481-2642-2_569
Fierz, C., Armstrong, R. L., Durand, Y., Etchevers, P., Greene, E., McClung, D, M., et al. (2009). The international classification for seasonal snow on the ground prepared by the ICSI-UCCS-iacs working group on snow classification. Paris, France: UNESCO, 90.
Gallet, J.-C., Björkman, M., Borstad, C., Hodson, A., Jacobi, H.-W., Larose, C., et al. (2019). Snow research in svalbard: Current status and knowledge gaps. SESS: Italy, 82–107.
Gallet, J. C., Domine, F., Arnaud, L., Picard, G., and Savarino, J. (2011). Vertical profile of the specific surface area and density of the snow at Dome C and on a transect to Dumont D’Urville, Antarctica - albedo calculations and comparison to remote sensing products. Cryosphere 5, 631–649. doi:10.5194/tc-5-631-2011
Goosse, H., Kay, J. E., Armour, K. C., Bodas-Salcedo, A., Chepfer, H., Docquier, D., et al. (2018). Quantifying climate feedbacks in polar regions. Nat. Commun. 9, 1919. doi:10.1038/s41467-018-04173-0
Järvinen, O., Leppäranta, M., and Vehviläinen, J. (2013). One-year records from automatic snow stations in Western Dronning Maud Land, Antarctica. Antarct. Sci. 25, 711–728. doi:10.1017/S0954102013000187
Kinar, N. J., and Pomeroy, J. W. (2015). Measurement of the physical properties of the snowpack. Rev. Geophys. 53, 481–544. doi:10.1002/2015RG000481
Kumar, P., Saharwardi, M. S., Banerjee, A., Azam, M. F., Dubey, A. K., and Murtugudde, R. (2019). Snowfall variability dictates glacier mass balance variability in himalaya-karakoram. Sci. Rep. 9, 18192. doi:10.1038/s41598-019-54553-9
Maturilli, M., Herber, A., and König-Langlo, G. (2013). Climatology and time series of surface meteorology in Ny-Ålesund, Svalbard. Earth Syst. Sci. Data 5, 155–163. doi:10.5194/essd-5-155-2013
Mazzola, M., Viola, A. P., Lanconelli, C., and Vitale, V. (2016). Atmospheric observations at the amundsen-nobile climate change tower in ny-ålesund, svalbard. Rend. Lincei 27, 7–18. doi:10.1007/s12210-016-0540-8
Müller, M., Kelder, T., and Palerme, C. (2022). Decline of sea-ice in the Greenland Sea intensifies extreme precipitation over Svalbard. Weather Clim. Extrem. 36, 100437. doi:10.1016/j.wace.2022.100437
Pérez Díaz, C. L., Muñoz, J., Lakhankar, T., Khanbilvardi, R., and Romanov, P. (2017). Proof of concept: Development of snow liquid water content profiler using CS650 reflectometers at caribou, ME, USA. Sensors 17, 647. doi:10.3390/s17030647
Pfeffer, W. T., and Humphrey, N. F. (1996). Determination of timing and location of water movement and ice-layer formation by temperature measurements in sub-freezing snow. J. Glaciol. 42, 292–304. doi:10.3189/s0022143000004159
Pinzer, B. R., Schneebeli, M., and Kaempfer, T. U. (2012). Vapor flux and recrystallization during dry snow metamorphism under a steady temperature gradient as observed by time-lapse micro-tomography. Cryosph 6, 1141–1155. doi:10.5194/tc-6-1141-2012
Pinzer, B. R., and Schneebeli, M. (2009). Snow metamorphism under alternating temperature gradients: Morphology and recrystallization in surface snow. Geophys. Res. Lett. 36, L23503–L23513. doi:10.1029/2009GL039618
Pirazzini, R., Leppänen, L., Picard, G., Lopez-moreno, J. I., Marty, C., Macelloni, G., et al. (2018). European in-situ snow measurements: Practices and purposes. Sensors (Basel) 18, 2016. doi:10.3390/s18072016
Previdi, M., Smith, K. L., and Polvani, L. M. (2021). Arctic amplification of climate change: A review of underlying mechanisms. Environ. Res. Lett. 16, 093003. doi:10.1088/1748-9326/ac1c29
Rantanen, M., Karpechko, A. Y., Lipponen, A., Nordling, K., Hyvärinen, O., Ruosteenoja, K., et al. (2022). The Arctic has warmed nearly four times faster than the globe since 1979. Commun. Earth Environ. 3, 168. doi:10.1038/s43247-022-00498-3
Royer, A., Picard, G., Vargel, C., Langlois, A., Gouttevin, I., and Dumont, M. (2021). Improved simulation of arctic circumpolar land area snow properties and soil temperatures. Front. Earth Sci. 9, 1–19. doi:10.3389/feart.2021.685140
Salzano, R., Lanconelli, C., Esposito, G., Giusto, M., Montagnoli, M., and Salvatori, R. (2021). On the seasonality of the snow optical behaviour at Ny ålesund (svalbard islands, Norway). Geosciences 11, 112. doi:10.3390/geosciences11030112
Salzano, R., Salvatori, R., Valt, M., Giuliani, G., Chatenoux, B., and Ioppi, L. (2019). Automated classification of terrestrial images: The contribution to the remote sensing of snow cover. Geosciences 9, 97. doi:10.3390/geosciences9020097
Serreze, M. C., Gustafson, J., Barrett, A. P., Druckenmiller, M. L., Fox, S., Voveris, J., et al. (2021). Arctic rain on snow events: Bridging observations to understand environmental and livelihood impacts. Environ. Res. Lett. 16, 105009. doi:10.1088/1748-9326/ac269b
Singh, A. K. (2011). Snow metamorphism BT - encyclopedia of snow, ice and glaciers, eds. V. P. Singh, P. Singh, and U. K. Haritashya (Dordrecht: Springer), 1060–1061. doi:10.1007/978-90-481-2642-2_675
Spolaor, A., Moroni, B., Luks, B., Nawrot, A., Roman, M., Larose, C., et al. (2021). Investigation on the sources and impact of trace elements in the annual snowpack and the firn in the hansbreen (southwest spitsbergen). Front. Earth Sci. 8, 1–10. doi:10.3389/feart.2020.536036
Spolaor, A., Vallelonga, P., Gabrieli, J., Martma, T., Björkman, M. P., Isaksson, E., et al. (2014). Seasonality of halogen deposition in polar snow and ice. Atmos. Chem. Phys. 14, 9613–9622. doi:10.5194/acp-14-9613-2014
Urbański, J. A., and Litwicka, D. (2022). The decline of Svalbard land-fast sea ice extent as a result of climate change. Oceanologia 64, 535–545. doi:10.1016/j.oceano.2022.03.008
Valt, M., and Salvatori, R. (2016). Snowpack characteristics of brøggerhalvøya, svalbard islands. Rend. Lincei 27, 129–136. doi:10.1007/s12210-016-0509-7
Keywords: snow, physical properties, arctic, svalbard, automated nivometric station
Citation: Scoto F, Pappaccogli G, Mazzola M, Donateo A, Salzano R, Monzali M, de Blasi F, Larose C, Gallet J-C, Decesari S and Spolaor A (2023) Automated observation of physical snowpack properties in Ny-Ålesund. Front. Earth Sci. 11:1123981. doi: 10.3389/feart.2023.1123981
Received: 14 December 2022; Accepted: 16 March 2023;
Published: 30 March 2023.
Edited by:
Mathias Bavay, WSL Institute for Snow and Avalanche Research SLF, SwitzerlandReviewed by:
Hannah Vickers, Norwegian Research Institute (NORCE), NorwayLingmei Jiang, Beijing Normal University, China
Copyright © 2023 Scoto, Pappaccogli, Mazzola, Donateo, Salzano, Monzali, de Blasi, Larose, Gallet, Decesari and Spolaor. This is an open-access article distributed under the terms of the Creative Commons Attribution License (CC BY). The use, distribution or reproduction in other forums is permitted, provided the original author(s) and the copyright owner(s) are credited and that the original publication in this journal is cited, in accordance with accepted academic practice. No use, distribution or reproduction is permitted which does not comply with these terms.
*Correspondence: Federico Scoto, Zi5zY290b0Bpc2FjLmNuci5pdA==