 Kristina Penn
 Shawn J. Marshall1,2
- 1Department of Geography, University of Calgary, Calgary, AB, Canada
- 2Environment and Climate Change Canada, Gatineau, QC, Canada
Glacier melt provides an important source of freshwater, particularly during dry years and late in the summer, after most of the seasonal snow has melted. Glaciers are losing mass in most of the world’s mountain regions, which leads to uncertainties around the availability of freshwater to the downstream catchments. While contributions of glacial meltwater to rivers can be quantified through hydrograph separation methods, changes in the chemical characteristics of glacial meltwater may impact these calculations. We collected samples of supraglacial snow and ice and proglacial stream water over the course of a melt season at Haig Glacier in the Canadian Rocky Mountains and analyzed these samples for stable water isotopes (oxygen-18 and deuterium) and dissolved major ions to assess their seasonal variability. We identify isotopic enrichment in stable water isotopes on the surface of Haig Glacier as dry snow turns to wet snow and eventually in the bare ice that remains. This enrichment is reflected in isotopic ratios in the proglacial stream. Two possible explanations include: 1) isotopic enrichment through sublimation or liquid water evaporation on the glacier surface, 2) isotopic fractionation during diurnal freeze-thaw cycles, with the heavier isotopes preferentially refreezing. We evaluate both of these scenarios and conclude that both processes are likely active, with evaporation effects sufficient to explain much of the observed isotopic enrichment in the glacial runoff.
1 Introduction
Glaciers in the world’s mountainous regions are losing mass, contributing to global sea level rise, and impacting regional water resources (Hock et al., 2019). As temperatures continue to rise, the quantity and timing of glacial runoff will adjust to the changing climate conditions. Glaciers provide an important source of freshwater, particularly in otherwise dry environments. The Bow River in Alberta, Canada is fed by glaciers and snow-melt in the Canadian Rocky Mountains and is an important source of water supporting agriculture, industry, and communities within its watershed, including the City of Calgary. Since glacial runoff is a significant source of water in this region (Marshall et al., 2011; Bash and Marshall, 2014), it is important to identify the glacially-sourced portion of the Bow River discharge at different times of year in order to monitor forthcoming changes in glacial melt regimes and their implications for water resources.
Mixing models for hydrograph separation are a promising technique for separating different source waters in streamflow. These have been used to separate outflow at glacier terminus locations into fractional components of rainfall, surface meltwater, and meltwater that passes through the subglacial environment (e.g., Hall, 1970; Collins, 1979; Tranter et al., 1993; Sharp et al., 1995; Arendt et al., 2015). Hydrograph separation methods have also been used at catchment scale in glacier-fed basins to identify fractional components of groundwater, soil outflow, rainfall, snowmelt, and glacier melt (e.g., Williams et al., 2006; Baraer et al., 2009; Cable et al., 2011; Ohlanders et al., 2013; Wang et al., 2015). These studies apply mixing models using one or more conservative tracers to calculate the fraction of each component in the total runoff.
The efficacy of hydrograph separation techniques for estimating glacial contributions to streamflow at downstream sites has yet to be demonstrated in western Canada or in other mid-latitude mountain regions, to our knowledge. This may be limited by the small fraction of glacier input to streams at distances of 10 s of km downstream from the glacier terminus, relative to the typical uncertainty within mixing models (e.g., ±11% in Schmieder et al., 2018). Other limitations involve the assumptions within mixing models; the constituent (end-member) tracer values need to be known with high confidence, these values need to be distinct, and there is a requirement for limited spatial and temporal variability in the tracer values for each constituent. These constraints can be difficult to meet, but the requirement with respect to temporal variability can be circumvented through a better understanding of how constituent tracer values evolve in time, treating this as a dynamic variable within mixing models.
Here we examine the utility of stable water isotopes, δ2H and δ18O, as tracers of glacial runoff, specifically focused on the evolution of stable water isotopes in glacial runoff over a summer melt season. Stable water isotope ratios have been used to separate glacier runoff associated with seasonal snow, glacial ice, subglacial waters, groundwater, and summer precipitation (e.g., Behrens et al., 1971; Baraer et al., 2009; Bhatia et al., 2011; La Frenierre and Mark, 2014; Arendt et al., 2015; Schmieder et al., 2018). There can be considerable overlap in isotopic values between these sources, and prior studies also indicate that end-member values of these sources may vary over a summer melt season (e.g., Zhou et al., 2013; Schmieder et al., 2018), challenging the application of mixing models.
For extratropical glaciers, the isotopic distinction between glacier snow/ice and summer precipitation is relatively clear. Snow is deposited in the winter months when cold temperatures cause 18O and 2H isotopes to be depleted in the air mass, particularly for inland, continental locations (Gat, 1996). Summer precipitation is deposited when air temperatures are warmer and precipitation is enriched in 18O and 2H (Moser and Stichler, 1980), due to both lower fractionation of the source vapour and less fractional rainout. Hence it is generally simple to isotopically discriminate between winter and summer precipitation. The glacier snowpack and the firn and ice are primarily associated with cold-season accumulation. Summer precipitation events on the glacier can take the form of either rain or snow, but summer snows are generally removed from the system by melting when fair-weather systems return, such that summer snows do not contribute significantly to the accumulation of glacier firn or ice. Glacier firn and ice should therefore be isotopically close to the seasonal (winter) snowpack.
Some studies suggest that it is possible to isotopically distinguish supraglacial snow from glacial ice, partly by constraining the source elevation for meltwater runoff, where glaciers are large enough to span broad elevation bands (e.g., Raben and Theakstone, 1998; Theakstone, 2003; Yde et al., 2016). It may be difficult to distinguish between supraglacial snow and glacier ice in the early melt season, when snowmelt is contributing across a wide range of elevation on the glacier, but isotopic separation may be possible in late summer, when exposed glacier ice at lower elevations can be more enriched in heavy isotopes than the residual high-elevation snowpack on the upper glacier (e.g., Arendt et al., 2015). This is an important consideration where glaciers span a large range of elevation.
Post-depositional fractionation processes can also alter the isotopic ratios of snow (e.g., Sinclair and Marshall, 2008). Wind redistribution, vapour diffusion, and melting all lead to isotopic modification. It has long been argued that sublimation does not lead to systematic fractionation (Dansgaard et al., 1973), since surface ablation through this mechanism removes the outer layer of ice crystals without systematic fractionation. However, lab studies and field observations indicate that sublimation of the snowpack may be accompanied by near-surface enrichment in 18O and 2H (Stichler et al., 2001; Sokratov and Golubev, 2009; Ala-aho et al., 2017), associated with vapour diffusion in the pore space of the snow and isotopic exchange with ambient moisture.
Additionally, fractionation during freezing of liquid water onto snow/ice leads to enrichment of 18O and 2H in the solid (refrozen) phase. In supraglacial environments where the snowpack or the underlying firn and ice are below the melting point, enrichment occurs upon percolation and subsurface refreezing of meltwater (Moran and Marshall, 2009). If there is complete refreezing, there should be no bulk enrichment (i.e., integrated over the depth of the snowpack), but where some portion of meltwater runs off, it will be depleted in the heavier isotopes. As the melt season progresses, runoff derived from the remaining snow should become increasingly enriched in the heavy isotopes.
Seasonal enrichment of heavy isotopes in snowpacks has been documented in both laboratory and field experiments (Taylor et al., 2001; Moran and Marshall, 2009; Sokratov and Golubev, 2009; Ala-aho et al., 2017). Taylor et al. (2001) monitored snowmelt runoff at a non-glacial site during a melt season and observed progressive enrichment in heavy isotopes in the liquid runoff, associated with progressive enrichment of the snowpack. Additionally, they found the highest isotopic variability in newly deposited spring snow and lowest isotopic variability in the snowmelt. Similar enrichment of meltwater runoff during a melt season was reported by Williams et al. (2006) at a rock glacier in Green Lakes Valley, Colorado. The δ18O value in melt runoff increased from −17.5‰ to −10‰, which was attributed to refreezing, i.e., fractionation during accretion of interior, subsurface ice.
This process requires subsurface temperatures below the freezing point, and it can be expected to shut off when the snowpack and glacier ice are temperate, as molecular exchange is limited when meltwater runs off without refreezing. In temperate environments such as mid-latitude glaciers, this transition to isothermal or temperate snow conditions often happens quickly (e.g., over a few days) at the start of the melt season. Net enrichment and homogenization of the isotopic profile in the snowpack are expected during this stage (Moser and Stichler, 1980), and have been documented in supraglacial environments (Raben and Theakstone, 1998; Sinclair and Marshall, 2008). Ongoing enrichment of the seasonal snowpack or the meltwater runoff after this point are not theoretically expected in temperate environments.
At Haig Glacier in the Canadian Rocky Mountains, isotopic homogenization of the supraglacial snowpack has been documented in association with the onset of melt in the spring (Sinclair and Marshall, 2008). However, the isotopic evolution of the supraglacial snow and meltwater runoff through the rest of the melt season has received relatively little attention. Studies indicate that there may be ongoing evolution of the supraglacial meltwater signal over the course of the melt season (Zhou et al., 2013; Schmieder et al., 2018. Consistent with this, Theakstone and Knudsen (1996) documented δ18O values in July glacier snow of −12.1‰ compared to −11.6‰ for glacier ice at Austre Okstindbreen Glacier in Norway. The seasonal development of meltwater isotopes is important to understand, as changes in the end-member isotopic ratios need to be accounted for in melt-season hydrograph separation studies for assigning the end-member values of snowmelt, firn, and glacier ice to help quantify their contributions to runoff in a drainage basin.
We present evidence of the seasonal evolution of isotopic ratios in supraglacial snow and ice on Haig Glacier and in the proglacial stream waters over the course of summer 2017. We observe a systematic enrichment in heavy isotopes and propose two processes that may lead to this: 1) enrichment of melting surface snow and ice via evaporation of the near-surface liquid water, and 2) fractionation during near-surface diurnal freeze-thaw cycles, a process which removes lighter isotopes and can be thought of as a form of isotopic elution.
2 Study area
Extensive glaciation is present along the continental divide of the Canadian Rockies. Snow accumulation is dominated by moist Pacific air masses, associated with persistent westerly flows and orographic uplift (Sinclair and Marshall, 2009), but the summer melt season is warm and dry, typical of continental influences. Haig Glacier is located approximately 100 km southwest of Calgary, Alberta, in the southwestern section of the Bow River Basin (Figure 1). It is the largest outlet of a 3.3-km2 icefield that straddles the continental divide between British Columbia and Alberta. The glacier flows southeast from the continental divide, has a 2.7-km long central flowline, an elevation range of 2,435–2,960 m above sea level, and a median elevation of 2,660 m (Marshall, 2014). The relatively small size of the glacier and year-round access provide excellent opportunities for glaciohydrological and glacioclimatic studies.
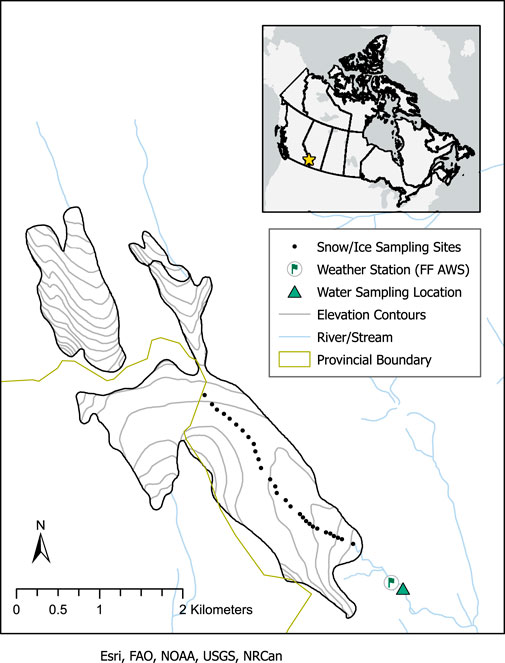
FIGURE 1. Map (inset) showing the location of Haig Glacier in Canada, on the border of Alberta and British Columbia. In the enlarged study area map, glacier snow and ice sampling sites, weather station location, and stream sampling location are identified. The snow and ice sampling sites also coincide with the glacier centreline. Snow was sampled at each point during the May 2017 survey, and at every third point during the July and August surveys. The glacier outline is based on a geological map of Alberta’s Kananaskis region (McMechan, 2013).
The Haig Glacier research site was established in 2000. An automatic weather station (AWS) installed in the glacier forefield (Figure 1) records meteorological conditions each 30 min, providing the basis for glacier melt modeling (Marshall, 2014; Ebrahimi and Marshall, 2016). Continuous weather records for the study area are available since August 2001. An additional AWS was established and maintained on the glacier surface from 2001 to 2015 (Marshall, 2014), near the glacier equilibrium line altitude (ELA), 2,665 m, providing a long record of overlap with the forefield AWS that informs the relation between forefield and glacier weather conditions. The 2002–2013 total winter accumulation (October to May) averaged approximately 1,700 mm water equivalent (w.e.) at the head of Haig Glacier and 1,360 mm w. e. over the full glacier (Marshall, 2014). In comparison, October to May precipitation in Calgary averaged 176 mm w. e. during this time (Environment Canada, 2014), indicative of the strong decline in precipitation in the lee of the Rockies.
Supraglacial snow and proglacial stream samples were collected at Haig Glacier and analyzed for stable water isotopes, δ2H and δ18O, in several different field campaigns between 2004 and 2017 (e.g., Sinclair and Marshall, 2008; Miller, 2018). These studies focused on stable isotopes in the snowpack (i.e., precipitation isotopes that are potentially modified by post-depositional processes), rather than the in-cloud isotopic composition of water vapour, water droplets, and ice crystals and isotopic exchange processes within the clouds. Orographic precipitation at the site is associated with super-saturated, mixed-phase clouds at the altitude of the upper glacier, and there are likely to be interesting non-equilibrium isotope fractionation processes associated with in-cloud ice crystal formation processes (e.g., Lowenthal et al., 2016; Dütsch et al., 2019), but these are beyond the scope of our studies. Our starting point is the snow deposited on the glacier surface as a result of these processes.
Some of the meltwater runoff from the glacier drains through numerous small supraglacial channels, but most of the surface runoff enters the glacier system through crevasses and moulins and drains subglacially. Runoff is funneled through a single bedrock drainage channel in the glacier forefield, Haig Stream, which feeds into the Upper Kananaskis River. Haig Stream catchment is approximately 5 km2 and captures runoff primarily from the glacier (Figure 2) (Heberger, 2022). Stream samples in this study were collected approximately 850 m downstream of the glacier terminus where the stream is accessible (Figure 3).
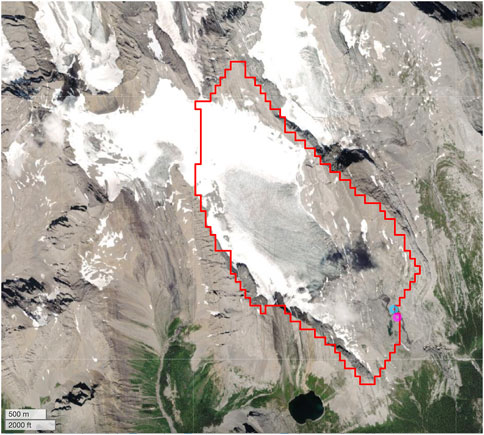
FIGURE 2. Catchment area delineated using an online tool developed by Heberger (2022) based on global data from MERIT-Hydro, MERIT-Basins, and HydroSHEDS models. The stream sampling site has been set as the catchment area outlet. According to the modeled catchment area, most of the watershed is glacierized and captures some snowpack meltwater. The catchment area is 5 km2.
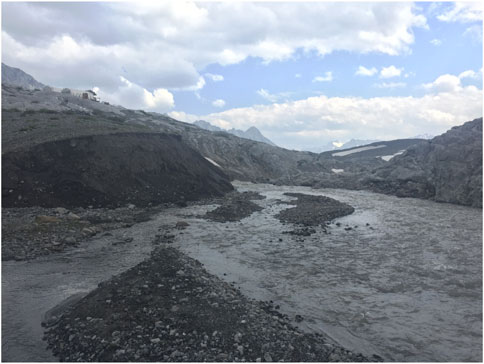
FIGURE 3. Photograph showing the Haig Stream sampling site, on 12 July 2017. The site is located approximately 800 m downstream of the glacier terminus. The glacier runoff flows via a gravel-bedded Haig Stream, which is a tributary of the Kananaskis River.
A seasonal (summer) streamflow gauge was installed in Haig Stream intermittently from 2003–2016 (Shea et al., 2005; Marshall, 2014), but the site suffered damage from a grizzly bear in September 2016, and no stream gauge data are available during the 2017 study period. However, based on long-term automatic weather station (AWS) data from the glacier forefield and observations during field visits we can describe the seasonal hydrologic cycle of the glacier-stream system. Stream data from earlier years provide a good understanding of diurnal discharge cycles, lags between surface melting and stream discharge (Shea et al., 2005), and the character of meltwater vs rainfall runoff (Marshall, 2014). The summer melt season on the glacier typically concludes in mid-to late-September, at which point snow begins to accumulate on the glacier and the proglacial outlet stream ices over. The stream contains a low level of baseflow under the surface ice for several more weeks, fed by ongoing subglacial drainage and potentially groundwater discharge. Over the winter the stream channel fills with 3–4 m of snow and there is no evidence of streamflow at the waterfall via which water flows from the glacier into the stream, so Haig Stream is either dried up or reduced to a slow trickle that freezes. During annual snow surveys in early May, the glacier snowpack is typically just beginning to melt and there is no evidence of surface water or streamflow. Sub-nival flow begins by late May in most years, and the stream typically opens up in mid-to late-June.
Haig Stream joins the Kananaskis River catchment which feeds the Bow River. The Bow River drains eastward from the Canadian Rockies and is an essential source of water for the Canadian Prairie provinces. The Bow River supports hydroelectric, agricultural, industrial, and municipal water demands throughout the semi-arid environment of southern Alberta (Marshall, 2014). The Bow River and its alpine tributaries also provide essential ecological services, with glacial runoff providing a critical source of low-temperature water in support of aquatic ecology (Giersch et al., 2017).
3 Methods
3.1 Data collection
Data collection at Haig Glacier took place during the 2017 melt season, consisting of a snow survey in May and four field visits, each 2 weeks apart, in July and August (see Table 1 for dates). The May snow survey included probing of snow depth at 33 sites along the glacier centerline. At three of these sites, snow density measurements were collected from snow pits dug through to the underlying glacier ice. Snow densities were measured at 10-cm intervals using a 100-cm3 box cutter. Average values of snowpack density from the snow pits were used to interpolate density to probed sites for calculation of snow water equivalent (SWE).
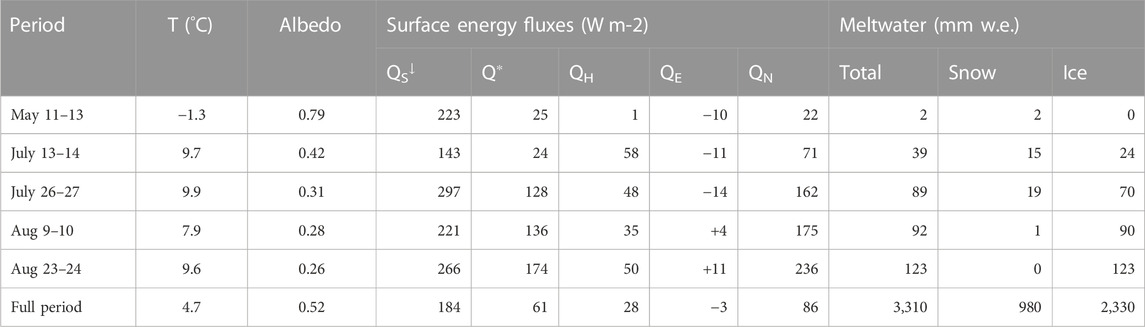
TABLE 1. Weather conditions, energy fluxes, and meltwater production during the summer 2017 field visits. Values are averaged (temperature, albedo, energy fluxes) or summed (meltwater) over the full glacier surface, based on a distributed model of surface energy and mass balance driven by meteorological forcing from the forefield AWS. The full period refers to May 1 to September 16, 2017.
The winter snow distribution is used to seed a distributed energy balance model of glacier melt (Ebrahimi and Marshall, 2016), using meteorological forcing from the forefield AWS, which is at an elevation of 2,340 m. The AWS measures incoming and outgoing longwave and shortwave radiation, temperature, wind speed and direction, humidity, air pressure, rainfall, and snow depth. From 2001–2015, an additional AWS was maintained at an elevation of 2,665 m on the glacier surface. This period of overlap informs transfer functions to map off-glacier AWS data onto the glacier surface (Marshall, 2014), providing the meteorological fields that are needed to drive the energy balance model. The data are further distributed as a function of elevation on the glacier surface using lapse rates for temperature, humidity, and incoming longwave radiation (Ebrahimi and Marshall, 2016). The distributed energy balance model runs on 30-min time steps over grid cells of ∼30 m, with outgoing longwave and shortwave radiation calculated locally as a function of surface temperature and albedo (Marshall, 2014). Surface albedo evolves in space and time as a function of surface type (snow vs ice), with melt-season reductions in snow albedo calculated as a function of cumulative positive degree days (Marshall and Miller, 2020). The energy balance model provides an estimate of daily meltwater production and runoff, as well as the transition from seasonal snow cover to exposed glacier ice across the glacier.
During each July and August field visit, samples of Haig Glacier runoff water were collected from the stream site every 2 hours into plastic 20-mL sampling bottles over a 24-h period starting around 8 a.m. each morning and continuing until the same time the following day. The water samples were filtered through a 0.20-µm filter to remove particulates.
Glacier surface snow/ice samples were collected at eleven of the sampling points (Figure 1) on the same days as stream samples, approximately between 9 a.m. and 3 p.m. Snow/ice samples were collected using a trowel into freezer bags. The surface layer (approximately 1 cm) was scraped clear and samples represent depths of 1–5 cm in the snow and ice. Samples were melted upon return to the base camp, and transferred into 20-mL plastic bottles.
Additional water samples were collected on 14 October 2017 from the proglacial stream. The stream was still flowing at this time, though it was covered by a thin layer of ice. There was no supraglacial meltwater generation or runoff at this time, since the surface of Haig Glacier was snow-covered, the waterfall at the glacier terminus was frozen (though with water running behind it), and temperatures had been below 0°C for several days. The ice cover on the stream will have eliminated atmospheric snow/rainfall inputs as well as evaporation. The sample collected from underneath the stream ice cover is therefore interpreted to be subglacial outflow, which may have also passed through the shallow groundwater system. The meltwater likely originated in summer 2017, but spent a period of many days to weeks in transit through the glacier drainage system, passing through the subglacial environment.
3.2 Supporting data
Data from 2004–2007 (Sinclair and Marshall, 2008) and are used in this study to place 2017 summer samples in context with winter and spring samples. Data from 2004–2007 are divided into dry and wet snow samples. Samples considered “dry snow” were collected in the months of January through early May, corresponding to measured snow temperature below 0°C. Samples considered “wet snow” were collected from May through August, when either snow temperatures of 0°C were measured or liquid water was observed in the snowpack.
3.3 Laboratory analyses
Laboratory analyses of major ions and stable isotopes of the proglacial stream and glacier surface samples were conducted at the University of Calgary. Stable isotopes of oxygen (δ18O) and hydrogen (δ2H) were analyzed at the Isotope Science Laboratory. Since snow/ice samples from the glacier surface were not filtered in the field, filtration of these samples took place before each sample was pipetted into a 1.5-mL glass test vial. The samples were run on a Los Gatos Research Isotopic Water Analyzer (model IWA-45EP), and the delta value was reported in per mil (‰) with a precision of ±0.1‰ for δ18O and ±1.0 for δ2H relative to Vienna–Standard Mean Ocean Water (V-SMOW).
Major ions, including sulphate (SO42-), were analyzed on a Metrohm 930 Compact Iron Chromatography (IC) Flex system connected to a Metrohm 858 Professional Sample Processor (an autosampler). The concentration was reported in mg L-1 with a precision of 5% and a detection limit of 0.10 mg L-1. The bedrock underlying Haig Glacier is mainly dominated by sandstone. Pyrite (FeS2) and gypsum (CaSO4) are often found in sandstone. Sulphate (SO42-) is produced by pyrite oxidation and gypsum dissolution making SO42- the best ionic fingerprint for water that has been in contact with the bedrock.
3.4 Data interpretation methods
3.4.1 Local meteoric water line
At the data interpretation stage, we analyze the isotope results using the meteoric water line method, which plots the line of best fit between δ18O and δ2H in precipitation samples from a location. The global meteoric water line (GMWL),
Deuterium fractionation factors are approximately eight times greater than those of oxygen-18 (Sodemann, 2006) under equilibrium fractionation processes. During kinetic fractionation (e.g., evaporation in unsaturated conditions), this ratio changes as deuterium atoms have a higher diffusivity in air (Dansgaard, 1964; Sodemann, 2006). Consequently, the ratio of oxygen-18 to deuterium can be a indicator of kinetic fractionation processes, such as evaporation of liquid water during or after precipitation. Deuterium excess (d-excess) is a parameter used to characterize the enrichment of deuterium relative to oxygen-18,
3.4.2 Isotope kinetic fractionation
We assess the potential effects of evaporation on the residual liquid water content of the supraglacial snow and ice. For these calculations, we consider the depth of meltwater that needs to evaporate to lead to observed change in δ18O values in the supraglacial environment, following Sodemann’s (2006) discussion on Rayleigh distillation processes. The δ18O evolution of the reservoir (liquid meltwater in the near-surface snow or at the glacier surface) as it undergoes evaporation is described mathematically:
where
The equilibrium fractionation factor
The energy required (in W m−2) to evaporate water can be calculated as:
where
3.4.3 End-member mixing calculation
We use a mixing model as follows,
where θ is the discharge fraction, S is sulphate concentration, and the subscripts indicate runoff reservoirs: 1) basal water and groundwater, 2) glacier surface ice/snow), to perform a hydrograph separation for the proglacial stream. We assume a blend of subglacial and supraglacial water sources, with SO42- diagnostic of the latter. Previous studies (e.g., Schmieder et al., 2018) have also incorporated precipitation as a third constituent in mixing analyses, which is isotopically distinct from the glacier runoff, but there was no fresh precipitation within 48 h of or during our sampling periods, so our mixing model collapses to a two-component system.
4 Data interpretation and results
4.1 Glacier mass balance, 2017
Snow depths ranged from 2.84 m on the lower glacier to 4.70 m at the continental divide site in the upper accumulation area in May 2017, with average snowpack densities from 395 to 440 kg m−3. Peak annual accumulation typically occurs in late May. Averaged over the glacier, winter specific mass balance was Bw = 1.49 m w. e., about 15% above normal (Adhikari and Marshall, 2013). The summer of 2017 was warm and dry, with sustained temperatures above 0°C from June through August and few precipitation events. Warm conditions drove extensive melting, with the snowline retreating to the upper accumulation area by mid-August. Modelled melt season (May through September) runoff was Bs = 3.31 m w. e., giving a net annual mass balance of Bn = −1.82 m w. e. Geodetic (LiDAR) mass balance measurements from 2017 are in good agreement with the glaciological (field- and model-based) estimates, giving Bn = −1.91 ± 0.21 m w. e. (Pelto et al., 2019).
Figure 4 shows the modelled daily surface energy balance and meltwater production from May 1 through 16 September 2017, at which point fresh snow began accumulating on the glacier and the summer melt season abruptly ended. Within the model, meltwater runoff can be partitioned into seasonal snow vs the underlying glacier ice and firn. The firn area of the glacier is small, roughly 5% of the total glacier area, so the combined meltwater from firn and ice is dominated by the component from exposed glacier ice. In 2017, snow melt accounted for 1.25 m w. e. (38%) of the summer runoff, while ice and firn melt made up 2.06 m w. e. (62%). Based on model results, the transition from snow-to ice-dominated runoff took place around July 13 (Figure 4D). Snowmelt from the upper glacier continued to contribute to runoff through the rest of the summer, but at low levels after the first week of August.
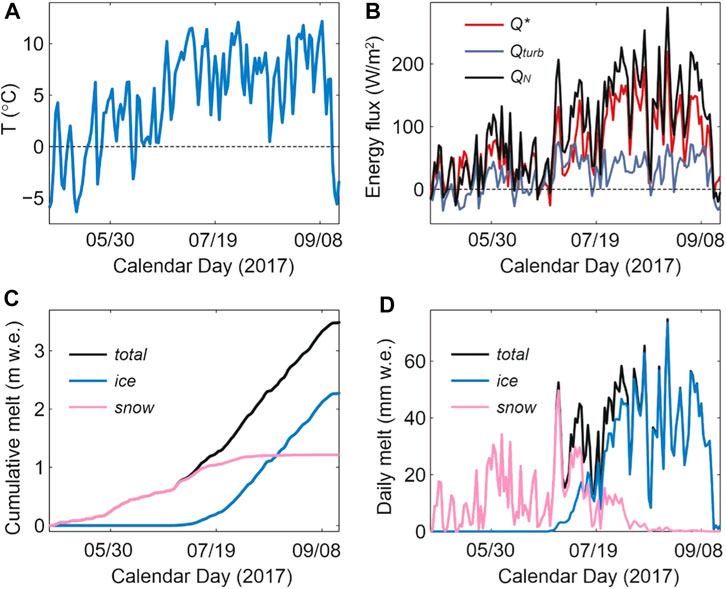
FIGURE 4. Modelled surface energy balance and meltwater on Haig Glacier, summer 2017, forced by meteorological data from the forefield AWS and observed snow conditions. The top plots show mean daily (A) air temperature and (B) energy fluxes, averaged over the glacier. Q* is the net radiation and Qturb is the sum of sensible and latent heat flux, and QN is the net energy that is available for melting. The lower plots indicate aggregated glacier-wide (C) cumulative and (D) daily snow, ice, and total glacier meltwater.
Table 1 reports the estimated meltwater runoff derived from seasonal snow vs glacier ice and firn for the four sample collection periods. All four periods were warm (average daily temperatures of 8°C–10°C on the glacier), with meltwater production of 19–62 mm w. e. d−1, averaged over the glacier. There was extensive seasonal snow cover on the glacier during the first sampling visit (July 13–14), with roughly equal amounts of snow and ice melt on these days. The glacier albedo was higher during this visit and conditions were overcast for much of the period, so net energy and meltwater production were close to the average daily values on Haig Glacier for summer 2017, despite the warm conditions. Snow cover was largely depleted on the remaining three visits. Combined with clear-sky conditions and warm temperatures, net energy levels and melt rates were high (roughly twice the mean daily values for summer 2017).
In earlier work at Haig Glacier, Shea et al. (2005) report time lags of ∼3 h for meltwater runoff to reach the stream site during the late summer, when glacier ice is exposed and crevasses are open to funnel the water efficiently through the glacier drainage system. Daily meltwater production therefore provides a reasonable estimate of total daily runoff in the proglacial stream, but meltwater storage and delays in runoff can occur, particularly from the upper glacier, and base flow may also contain older water. The surface meltwater values (Table 1) therefore do not precisely reflect the amount of meltwater flowing through the stream site on a given day.
4.2 Isotopic variation in the glacier-stream system
The δ18O and δ2H values of snow, ice, and meltwater runoff measured at Haig Glacier are averaged over multiple years (Figure 8). AWS temperature and snow accumulation (winter mass balance) data indicate interannual variability but no statistically significant trends in temperature or precipitation at the site from 2001–2017. Insofar as these are the main expected controls on isotopic ratios within the snowpack, we argue that snow isotopic values from different years can be compared and combined. While there is no expectation or evidence of changes in the mean annual precipitation isotopes with time, we observe a systematic shift in isotopic ratios associated with post-depositional processes on the glacier. Specifically, the average δ18O value increases from −20.1‰ for dry snow to −19.2‰ for wet snow and −18.6‰ for glacier ice, the same trend is observed for δ2H values.
The δ18O in the Haig proglacial stream varies diurnally (Figure 7). Runoff near the end of the melt season (August 22) is most enriched compared to the earliest sampled runoff (July 13), which is most depleted in 18O (the same trend is observed in deuterium ratios, see Figure 5). Meltwater runoff had a distinct peak in δ18O in the mid-afternoon of July 26, indicating enrichment in 18O at this time of high meltwater production. Stable water isotope ratios in the proglacial stream on each sampling day are summarized in Figure 5.
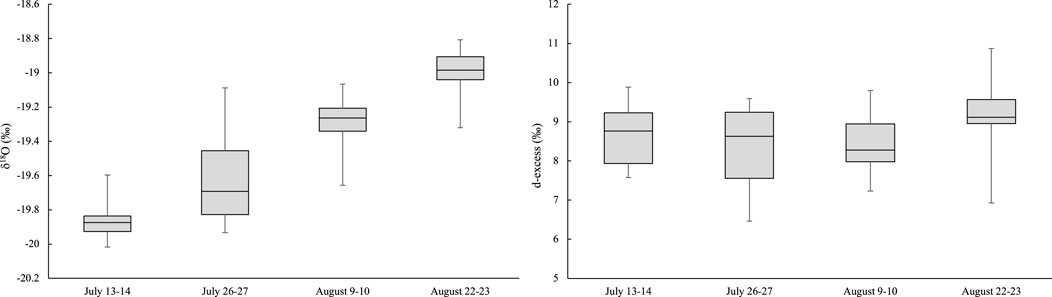
FIGURE 5. δ18O (‰) values and d-excess (‰) in proglacial Haig Stream in 2017, N = 14 for each sampling period.
In the stream, average values of δ18O and δ2H increased as the melt season progressed, indicating a systematic enrichment in heavy isotopes through the melt season. Shapiro-Wilk normality test showed that the data for each stream sampling interval are normally distributed. Analysis of Variance statistical tests were used to compare the mean δ18O values for all four stream-sampling intervals. In all cases, statistical tests have values of p < 0.001, which indicate that the river samples from each day are from different populations, and confirming the statistically-significant change in isotopic values of the glacier runoff over the melt season.
4.3 Meteoric water line evolution
The δ18O- δD relationship is examined for Haig Glacier through a series of meteoric water lines (MWL). Dry snow samples (sampled in winter and early spring, with snow temperatures below 0°C) are assumed to represent local Haig Glacier precipitation, and have been used to construct a local meteoric water line (LMWL)for the study area (Figure 6). Meteoric water lines have also been constructed for wet snow samples (snow temperatures of 0°C) from 2004–2007 and 2017 (Figure 6B), 2017 ice (Figure 6C), and the 2017 proglacial stream (Figure 6D).
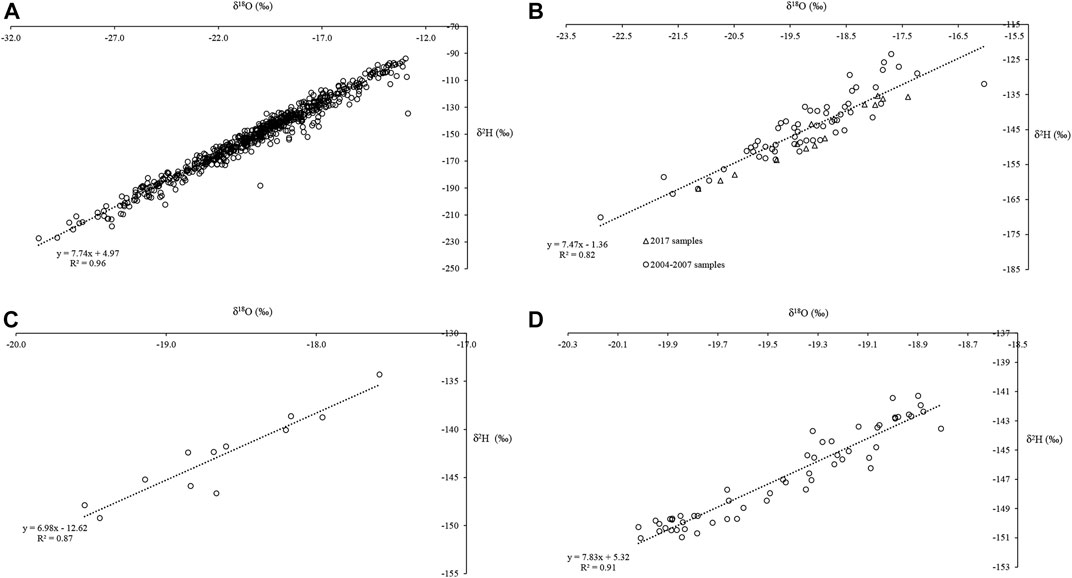
FIGURE 6. Meteoric water lines (MWL) for Haig Glacier: (A) LMWL for dry snow samples collected between 2004 and 2007 (N = 610); (B) MWL for wet snow samples (N = 73); (C) MWL for glacier ice based on samples collected in 2017 (N= 12); (D) MWL for proglacial stream samples collected in 2017 (N = 56).
Table 2 summarizes the MWL parameters at Haig Glacier. From the dry-snow samples, the slope of the LMWL is 7.74. The wet snow from 2004–2007 and the 2017 field seasons has a steeper slope of 7.47. MWL values for the glacier ice sampled in 2017 are significantly lower, 6.98 and the MWL for the proglacial stream samples was equal to 7.83, similar to the wet-snow value.
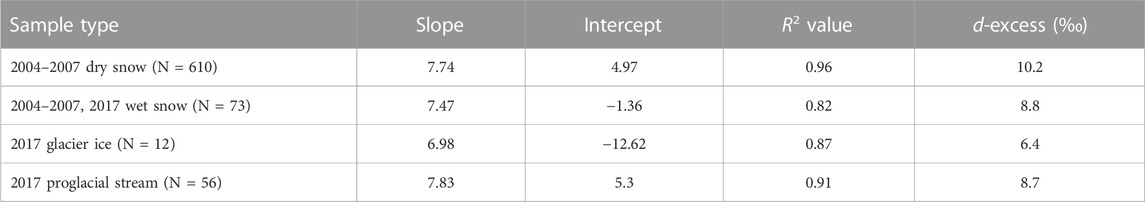
TABLE 2. Summary of Haig Glacier meteoric water line parameters.
We also calculated d-excess values for the proglacial stream and the sampled water sources. As summarized in Figure 5, in the proglacial stream the d-excess varies between 8.4‰ and 8.6‰ for the first three sample periods and increases to 9.3‰ for 22 August. The average summer d-excess in the proglacial stream was 8.7‰, similar to the value for wet snow (8.8‰). Glacier ice (6.4‰) and dry snow (10.2‰) bracket the wet-snow value (Table 2), indicating a reduction in d-excess through the transition from dry snow to wet snow to glacier ice.
4.4 Diurnal streamflow characteristics and mixing model results
The diurnal variation of stream δ18O values (Figure 7) indicates the role of different source water in contributing to stream runoff. This is further supported by ion concentrations measured in the stream (Miller, 2018), in particular sulphate (SO42-), which is present in the glacier runoff but undetectable in the glacier snow and ice. SO42- is in the bedrock underlying the glacier and any water in contact with the bedrock acquires a sulphate signal. A subglacial water sample collected on 14 October 2017 from the proglacial stream has the highest SO42- (26.75 mg L−1) concentration of all the stream samples. The subglacial water is rich in numerous other dissolved ions, such as calcium and magnesium, but sulphate is the most pronounced in the suite of measured ions, making it the best tracer for subglacial water at this site. This single sample does not capture temporal variability of SO42- concentration in the Haig Stream. SO42- concentration was measured in surface ice samples and the proglacial stream in the summer, with average concentration of <0.1 mg L-1 (n = 44) and 2.54 ±1.3 mg L-1 (n = 57), respectively. The concentration of SO42- in surface ice and Haig Stream when it is diluted with meltwater is very low compared to the autumn sample. Therefore, we assume that the measured concentration of SO42- is a fingerprint of subglacial water.
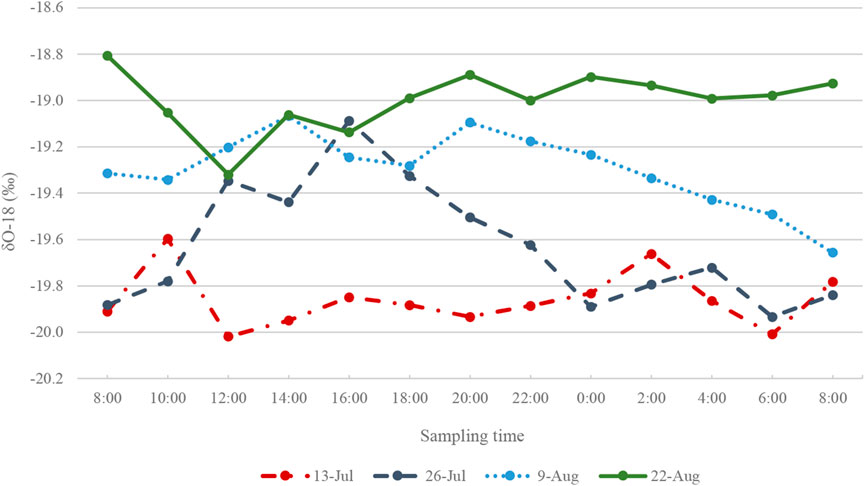
FIGURE 7. δ18O (‰) isotope ratios in Haig Stream for four sample collection periods in 2017. For each sampling period, N = 12.
The results of the mixing analysis indicate that water from the subglacial component in the stream increases from 5.5% in early July to 10.5% in late August. This signals an evolution of water routing through the glacier. As the melt season progresses, pathways open up for meltwater generated at the surface to connect to the subglacial environment. While the contribution of subglacial water to the proglacial stream increases, the stream volume is still dominated by supraglacial water during the late melt season, or water that passes quickly through the englacial and subglacial systems, with limited contact with the bed.
4.5 Isotope kinetic fractionation on the glacier surface
We consider the potential enrichment of surface snow associated with evaporation of liquid water in the pore space or ponded on the glacier surface. Assuming an initial isotopic value equal to the dry-snow value,
The average summer (JJA) net energy, Q, available for evaporation or melting on Haig Glacier in summer (JJA) 2017 was calculated to be 112 W m−2. If all of this energy was directed to evaporation, the rate of evaporation E) would be 4.5 x 10⁻⁸ m s−1. Based on this, 3 h would be required to evaporate 0.48 mm of water. Not all available net energy is used for evaporation; most is used for melting. If 10% of the available energy is consumed by evaporation (i.e., for an evaporative energy flux of −11 W/m2, typical of early summer), this would require ∼30 h of active evaporation (a few days) to produce enough evaporation to explain a 1‰ enrichment of the residual water.
5 Discussion
5.1 Seasonal isotopic enrichment on the glacier
Dry snow spans a large range of δ18O (Figure 8), as a function of the weather system that conveys moisture to the study site (Sinclair and Marshall, 2009). Wet snow δ18O values are less varied, and this pattern continues for glacier ice and stream samples, which have low variability compared to dry snow. Homogenization of the snowpack at the onset of the melt season at Haig Glacier was previously reported by Sinclair and Marshall (2008), consistent with the observations of Raben and Theakstone (1998). The progressive enrichment in heavy isotopes in meltwater runoff over the course of the melt season echoes the results of Taylor et al. (2001) and Williams et al. (2006). This systematic seasonal enrichment is also recorded in the supraglacial snow and ice at Haig Glacier, with an increase in δ18O of ∼1.0‰ from dry to wet snow and an additional increase of ∼0.5‰ from wet snow to glacier ice (Figure 8). The latter shift is identical to that reported by Theakstone and Knudsen (1996), who document δ18O values of −11.6‰ for glacier ice, compared with −12.1‰ for July snow.
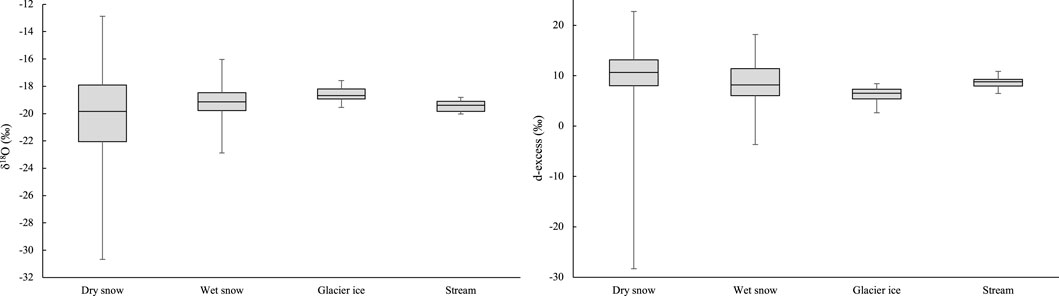
FIGURE 8. δ18O (‰) values and d-excess (‰) for proglacial Haig Stream and for endmembers in the hydrological system: dry snow (2004–2007, N = 610), wet snow (2004–2017, N = 73), glacier ice (2017, N = 12), Haig Stream (2017, N = 56).
The glacier ice that we sampled is not contemporaneous with the seasonal snowpack. It takes several years for the snow to transition from firn to ice at this site, and glacier ice is then transported downslope over timescales of decades. Mechanical deformation of the firn and ice will not change its bulk isotopic composition, but multi-year firn and ice have had more time and exposure for isotopic exchange in freeze-on processes that we describe in Section 5.3. This may explain the enrichment in heavy isotopes (see below). It is also possible that the original isotopic ratios of the glacier ice were different, since it developed from snow that was deposited on the glacier at higher elevations and in prior decades. The glacier is low-sloping and slow-moving (velocities of about 5 m yr−1 reported by Adhikari and Marshall, 2013), with a total elevation range of about 325 m, so the altitude effects will be minor and surface ice that we sampled may not have travelled far from its source. Moreover, ice that originated higher up on the glacier and in earlier (cooler) decades is expected to be more depleted in heavy isotopes; therefore, the inferred ∼0.5‰ enrichment in heavy isotopes through post-depositional modification is a minimum, and the enrichment processes are enough to overcome the potential source effects that act in the opposite direction.
Proglacial stream δ18O values are intermediate between those of snow and ice, but the progressive isotopic enrichment over the course of the melt season (Figure 5) is consistent with the seasonal evolution of the meltwater source. At the beginning of the sampling period, most runoff from the glacier is from melting snow. As the melt season progresses and glacier ice becomes exposed, the more enriched ice contributed an increasingly larger fraction to the meltwater, giving isotopically heavier stream water at the end of the sampling period (late August).
The enrichment of ice in δ18O compared to supraglacial snow helps to explain the seasonal evolution of δ18O in the meltwater runoff, consistent with previous studies, but the reason for the isotopic enrichment in wet snow and ice is uncertain. We suggest two potential mechanisms for enrichment of ice compared to supraglacial snow after the onset of melt.
5.2 Mechanism 1: Fractionation during evaporation
The enrichment of oxygen isotopes in ice relative to snow is consistent with evaporative processes that take place from the liquid water fraction as snow melts. Wet snow contains liquid water on the surfaces of snow grains and in the pore spaces of the snowpack, and liquid water can also pool at the snow-ice interface. The wet snowpack eventually melts and drains away, leaving the ice surface exposed, but liquid water commonly pools on the glacier surface where surface slopes are low. Because lighter isotopes are favoured during evaporation, residual water remains enriched with heavier isotopes of oxygen and hydrogen as evaporative processes take place (Gonfiantini et al., 2018). Wet snow and meltwater that remain on the glacier past the summer melt season turn to firn and eventually to glacier ice, leaving ice enriched relative to the meteoric snowfall.
The analysis of local meteoric water lines shows a reduction in the MWL slope for the glacier ice, relative to the 2017 snow samples (Table 2), which may be indicative of post-depositional kinetic fractionation processes during evaporation. Zhou et al. (2013) documented a decrease in slope from precipitation to glacier firn to glacier runoff on the Tibetan Plateau, and attributed this in part to kinetic evaporative processes. Where the residual water eventually contributes to the glacier ice, evaporation leads to enrichment of δ18O isotopes in glacier ice compared to glacier snow, as well as a lower MWL slope (Williams et al., 2006; Zhou et al., 2014; Wang et al., 2015).
We numerically illustrate a scenario in which evaporation leads to a 1‰ change in δ18O values of liquid water on the glacier surface over the course of 30 h. This amount of evaporation is readily achieved in the spring and early summer, when near-surface water in the snow aquifer can have a residence time of days to weeks. Evaporation is likely reduced once the seasonal snow cover is depleted in late summer, since supraglacial drainage is more efficient on the exposed ice and the residence time of water declines.
Evaporation can explain the enrichment in heavy isotopes seen in the meltwater runoff, but it does not necessarily account for the observed enrichment in the snow and ice itself. Enriched meltwater that refreezes or is retained within the surface snow and ice will cause an enrichment of the snow and ice matrix, but much greater amounts of evaporation would be needed to shift the bulk matrix fraction of the snowpack by 1‰ through this mechanism.
5.3 Mechanism 2: Freeze-on fractionation
Freeze-thaw processes offer an alternative mechanism to explain the isotopic enrichment of wet snow and glacier ice. When there is meltwater refreezing and drainage, equilibrium fractionation processes cause preferential refreezing of the heavier isotopes, leaving lighter isotopes in the residual pore water of the snowpack (the opposite effect to evaporation). If the isotopically lighter residual water drains, this results in an overall enrichment of heavy isotopes in the remaining bulk snow (Taylor et al., 2001; Ohlanders et al., 2013). The initial meltwater runoff should therefore be isotopically depleted, but as the melt season progresses the enriched snow and ice is melted, and runoff should become progressively more enriched in heavy isotopes.
Williams et al. (2006) initially proposed this idea to explain the seasonal evolution of δ18O observed in the runoff from Green Lake 5 rock glacier in Colorado, but specific to the englacial environment of the rock glacier. When liquid water infiltrates to the subsurface, any freeze-on during contact with englacial (or buried) ice leaves the ice enriched in heavier isotopes compared to the meltwater runoff and the initial surface snow. Williams et al. (2006) also report higher values of deuterium excess in late-season runoff relative to the initial conditions. Taken together with the enrichment in heavy isotopes, they interpret this as an indication that meltwater from the buried glacier ice has undergone multiple freeze-thaw episodes.
Consistent with the observations of Williams et al. (2006), d-excess in the Haig Glacier proglacial stream increased over the course of the 2017 melt season, from 8.6‰ to 9.3‰ (Figure 5). However, there was no progressive increase in d-excess for the supraglacial snow samples collected at Haig Glacier in July and August 2017, and glacier ice values had significantly lower d-excess (6.4‰) than the snow samples (8.8‰) (Figure 8). This could reflect the effects of evaporation in wet snow and during the multi-year transition from firn to ice; kinetic fractionation processes during evaporation favour 2H over 18O (e.g., Benetti et al., 2014), which increases d-excess in water vapour while leaving the residual water in the snow/ice reservoir with lower values of d-excess. Additionally, this argues against the Williams et al. (2006) freeze-thaw process as an explanation for the enrichment in heavy isotopes in glacier ice, relative to the supraglacial snowpack. D-excess may be a potential tracer of glacial melt, and it may be worth considering river water deviations from the local meteoric water line, a method known as line-conditioned excess, lc-excess, after Landwehr and Coplen (2006). Future work to trace these signals could be rewarding.
This process is most effective if snow, firn, or ice are below 0°C, to promote refreezing. This is not the case at Haig Glacier, so englacial and subglacial refreezing are unlikely, but diurnal freeze-thaw cycles occur at the glacier surface through much of the summer, with overnight refreezing of ponded surface water and near-surface pore water (Samimi and Marshall, 2017). These freeze-thaw cycles may lead to preferential freeze-on of heavy isotopes and removal of lighter isotopes via drainage. Fractionation by this process could also occur through the depth of the snowpack during spring, as the snow warms to an isothermal state and surface meltwater infiltrates and refreezes. Glacier energy balance modeling from summer 2017 indicates that there were an estimated 108°days with freeze-thaw cycles on the glacier from 1 May through 30 September, with 89°days on the upper glacier and 119°days at the lowest elevations. This is based on days with melting where the net energy QN was negative for 1 hour or more, most commonly associated with overnight refreezing. The supraglacial freeze-thaw cycles could explain the progressive seasonal enrichment of the residual snow and glacier ice, assuming that some of the isotopically depleted liquid meltwater drains (leaves the system) through percolation and runoff.
This process could also be occurring in conjunction with daytime liquid water evaporation, which would explain the mixed signals within the supraglacial water system and meltwater runoff. Freeze-on processes deplete this water in heavy isotopes, while evaporation enriches it in heavy isotopes, with these processes partially offsetting each other. The seasonal evolution of the stable isotopes in the meltwater runoff largely reflects the melt source (snow vs ice), accounting for the progressive seasonal enrichment.
6 Conclusion
In this study, we have captured systematic changes on the surface and the proglacial stream of Haig Glacier in the Canadian Rocky Mountains over the course of a melt season. Our data show a seasonal evolution of water chemistry, indicating a statistically significant isotopic enrichment of the glacier surface from −20.1‰ for dry snow to −18.6‰ for glacier ice. There is also progressive isotopic enrichment of meltwater runoff in the proglacial stream over the course of the melt season, consistent with a greater contribution from glacier ice in the late summer.
We consider two possible mechanisms that may contribute to the enrichment of heavy isotopes in the glacier ice: evaporation and freeze-on fractionation. Surface ice may become enriched in heavy isotopes through evaporation, whereby lighter isotopes are mobilized and evaporate more readily, leaving behind isotopically heavier water. This increases the bulk isotopic value of the wet snow, which eventually forms the firn and ice. The freeze-on fractionation or “elution” hypothesis could also explain enrichment in the supraglacial environment, and isotopic enrichment may be caused by both processes. At Haig Glacier, the supraglacial and englacial systems are at the melting point for most of the melt season, limiting the efficacy of refreezing. However, diurnal freeze-thaw cycles (i.e., overnight refreezing) at the glacier surface along with evaporation of surface water during the day may both contribute to the observed enrichment.
The findings of this project have several implications for research in glacier hydrology. We have described the seasonal evolution of supraglacial chemistry as it transitions from dry snow to wet snow to glacier ice, with systematic enrichment in heavy isotopes of water through these transitions. Isotopic enrichment over time has been documented in snowpack studies and laboratory experiments, but to the best of our knowledge, this is the first account of systematic isotopic shifts in the supraglacial snow and ice. This progressive enrichment is reflected in the seasonal evolution of meltwater runoff through the summer, particularly as meltwater sources shift to exposed glacier ice in later summer. These findings of seasonal evolution in supraglacial hydrochemistry could be incorporated into mixing-model estimates of snow and ice runoff in proglacial environments, i.e., through time-evolving end-member isotopic values. They may also help to distinguish between snow and ice in meltwater runoff, particularly in the early melt season when the seasonal snow is isotopically depleted relative to the glacier ice. The evaporation and melt-freeze cycles that are assessed can also help to inform the interpretation of isotopic ratios in melt-affected firn and ice cores, which will become increasingly necessary as climate change impacts high-elevation and high-latitude glacier environments.
Data availability statement
The raw data supporting the conclusions of this article will be made available by the authors, without undue reservation.
Author contributions
KP and SM collected field data in 2017, while KS and SM collected the 2004–2007 field data used in this study. KP ran the 2017 lab analyses for ice and water chemistry, and SM provided and analyzed the weather and climate data. SM provided supervision during the project. KP analyzed the data and wrote the manuscript, with contributions from SM and KS.
Funding
This was supported by the Natural Sciences and Engineering Research Council (NSERC) of Canada Discovery Grant to SM, “Modelling Glacier and Ice Sheet Response to Climate Change.”
Acknowledgments
We thank Patrick Coulas and many friends and colleagues who lent a hand in conducting fieldwork, and Caitlynn Macdonald for assisting with mapping for this manuscript. WinSport Canada generously shared their amenities at Haig Glacier base camp. Stephen Taylor, Farzin Malekani, and Rick Smith at the University of Calgary assisted with lab analyses and data processing. We are grateful to the Natural Science and Engineering Research Council (NSERC) of Canada for long-term funding of the Haig Glacier project, and to Alberta Environment and Parks for permission to carry out this research in Peter Lougheed Provincial Park. Insightful comments from the Editor, Stefano Brighenti, and two reviewers helped to improve this manuscript.
Conflict of interest
The authors declare that the research was conducted in the absence of any commercial or financial relationships that could be construed as a potential conflict of interest.
Publisher’s note
All claims expressed in this article are solely those of the authors and do not necessarily represent those of their affiliated organizations, or those of the publisher, the editors and the reviewers. Any product that may be evaluated in this article, or claim that may be made by its manufacturer, is not guaranteed or endorsed by the publisher.
References
Adhikari, S., and Marshall, S. J. (2013). Influence of high-order mechanics on simulation of glacier Response to climate change: Insights from Haig Glacier, Canadian Rocky mountains. Cryosphere 7, 1527–1541. doi:10.5194/tc-7-1527-2013
Ala-aho, P., Tetzlaff, D., McNamara, J. P., Laudon, H., Kormos, P., and Soulsby, C. (2017). Modeling the isotopic evolution of snowpack and snowmelt: Testing a spatially distributed parsimonious approach. Water Resour. Res. 53, 5813–5830. doi:10.1002/2017WR020650
Arendt, C. A., Aciego, S. M., and Hetland, E. A. (2015). An open source bayesian Monte Carlo isotope mixing model with applications in Earth surface processes. Geochem. Geophys. Geosystems 16, 1274–1292. doi:10.1002/2014gc005683
Baraer, M., McKenzie, J. M., Mark, B. G., Bury, J., and Knox, S. (2009). Characterizing contributions of glacier melt and groundwater during the dry season in a poorly gauged catchment of the cordillera blanca (Peru). Adv. Geosciences 22, 41–49. doi:10.5194/adgeo-22-41-2009
Bash, E. A., and ShawnMarshall, J. (2014). Estimation of glacial melt contributions to the Bow River, Alberta, Canada, using a radiation – temperature melt model. Ann. Glaciol. 55 (66), 138–152. doi:10.3189/2014AoG66A226
Behrens, H., Bergmann, H., Moser, H., Rauert, W., Stichler, W., Ambach, W., et al. (1971). “Study of the discharge of alpine glaciers by means of environmental isotopes and dye tracers,” in Snow and ice symposium Moscow, 219–224.
Benetti, M., Reverdin, G., Pierre, C., Merlivat, L., Risi, C., Steen-Larsen, H. C., et al. (2014). Deuterium excess in marine water vapor: Dependency on relative humidity and surface wind speed during evaporation. J. Geophys. Res. Atmos. 119, 584–593. doi:10.1002/2013JD020535
Bhatia, M. P., Das, S. B., Kujawinski, E. B., Henderson, P., Burke, A., Charette, M. A., et al. (2011). Seasonal evolution of water contributions to discharge from a Greenland outlet glacier: Insight from a new isotope-mixing model. J. Glaciol. 57 (205), 929–941. doi:10.3189/002214311798043861
Bowen, G. J., Putman, A., Brooks, J. R., Bowling, D. R., Oerter, E. J., and Good, S. P. (2018). Inferring the source of evaporated waters using stable H and O isotopes. Oecologia 187, 1025–1039. doi:10.1007/s00442-018-4192-5
Cable, J., Ogle, K., and Williams, D. (2011). Contribution of glacier meltwater to streamflow in the wind river range, Wyoming, inferred via a bayesian mixing model applied to isotopic measurements. Hydrol. Process. 25, 2228–2236. doi:10.1002/hyp.7982
Collins, D. N. (1979). Hydrochemistry of meltwaters draining from an alpine glacier. Arct. Alp. Res. 11 (3), 307–324. doi:10.2307/1550419
Craig, H. (1961). Isotopic variations in meteoric waters. Science 133 (3465), 1702–1703. doi:10.1126/science.133.3465.1702
Dansgaard, W., SigfusJohnsen, J., Clausen, H. B., and Gundestrup, N. (1973). Stable isotope glaciology. Meddelelser Om. Gronl. 197 (2), 1–53.doi:10.3402/tellusa.v16i4.8993
Dansgaard, W. (1964). Stable isotopes in precipitation. Tellus 16 (4), 436–468. doi:10.3402/tellusa.v16i4.8993
Dütsch, M., Blossey, P. N., Steig, E. J., and Nusbaumer, J. M. (2019). Nonequilibrium fractionation during ice cloud formation in iCAM5: Evaluating the common parameterization of supersaturation as a linear function of temperature. J. Adv. Model. Earth Syst. 11, 3777–3793. doi:10.1029/2019MS001764
Ebrahimi, S., and Marshall, S. J. (2016). Surface energy balance sensitivity to meteorological variability on Haig Glacier, Canadian Rocky mountains. Cryosphere 10, 2799–2819. doi:10.5194/tc-10-2799-2016
Gat, J. R. (1996). Oxygen and hydrogen isotopes in the hydrologic cycle. Annu. Rev. Earth Planet. Sci. 24, 225–262. doi:10.1146/annurev.earth.24.1.225
Giersch, J. J., Hotaling, S., Kovach, R. P., Jones, L. A., and Muhlfeld, C. C. (2017). Climate-induced glacier and snow loss imperils alpine stream insects. Glob. Change Biol. 23 (7), 2577–2589. doi:10.1111/gcb.13565
Gonfiantini, R., Wassenaar, L. I., Araguas-Araguas, L., and Aggarwal, P. K. (2018). A unified craig-gordon isotope model of stable hydrogen and oxygen isotope fractionation during fresh or saltwater evaporation. Geochimica Cosmochimica Acta 235, 224–236. doi:10.1016/j.gca.2018.05.020
Hall, F. R. (1970). Dissolved solids-discharge relationships: 1. Mixing models. Water Resour. Res. 6 (3), 845–850. doi:10.1029/wr006i003p00845
Heberger, Matthew (2022). delineator.py: fast, accurate global watershed delineation using hybrid vector- and raster-based methods. doi:10.5281/zenodo.7314287 Available at: https://mghydro.com/watersheds/help.html
Hock, R. G., Rasul, C., Adler, B., Cáceres, S., Gruber, Y., Hirabayashi, M., et al. (2019). “High mountain areas,” in IPCC Special Report on the Ocean and Cryosphere in a Changing Climate, Cambridge University Press, Cambridge, United Kingdom and New York, NY, United States, October 5–8, 2009. Editor H.-O. Pörtner, D. C. Roberts, V. Masson-Delmotte, P. Zhai, E. Tignor, K. Poloczanskaet al. 131–202. doi:10.1017/9781009157964.004
La Frenierre, J., and Mark, B. G. (2014). A review of methods for estimating the contribution of glacial meltwater to total watershed discharge. Prog. Phys. Geogr. 38 (2), 173–200. doi:10.1177/0309133313516161
Landwehr, J. M., and Coplen, T. B. (2006). Line-conditioned excess: A new method for characterizing stable hydrogen and oxygen isotope ratios in hydrologic systems (IAEA-CSP--26/P). Vienna, Austria: IAEA.
Lowenthal, D., Hallar, A. G., McCubbin, I., David, R., Borys, R., Blossey, P., et al. (2016). Isotopic fractionation in wintertime orographic clouds. J. Atmos. Ocean. Technol. 33 (12), 2663–2678. doi:10.1175/jtech-d-15-0233.1
Majoube, M. (1971). Fractionnement en oxygène 18 et en deutérium entre l’eau et sa vapeur. J. de chimie physique de physicochimie Biol. 68 (10), 1423–1436. doi:10.1051/jcp/1971681423
Marshall, S. J., White, E. C., Demuth, M. N., Tobias, B., Wheate, R., Menounos, B., et al. (2011). Glacier water resources on the eastern slopes of the Canadian Rocky mountains. Can. Water Resour. J. 36 (2), 109–134. doi:10.4296/cwrj3602823
Marshall, S. J. (2014). Meltwater run-off from Haig Glacier, Canadian Rocky mountains, 2002-2013. Hydrology Earth Syst. Sci. 18, 5181–5200. doi:10.5194/hess-18-5181-2014
McMechan, M. E. (2013). Geology, Kananaskis lakes, British Columbia - Alberta. Geol. Surv. Can. Can. Geoscience Map 11, 1–50. doi:10.4095/288953
Moran, T., and Marshall, S. (2009). The effects of meltwater percolation on the seasonal isotopic signals in an arctic snowpack. J. Glaciol. 55 (194), 1012–1024. doi:10.3189/002214309790794896
Moser, H., and Stichler, W. (1980). “Environmental isotopes in ice and snow,” in Handbook of environmental isotope geochemistry. Editors P. Fritz, and J. C. Fontes Amsterdam, Netherlands: Elsevier B.V.
Ohlanders, N., Rodriguez, M., and McPhee, J. (2013). Stable water isotope variation in a central andean watershed dominated by Glacier and snowmelt. Hydrology Earth Syst. Sci. 17, 1035–1050. doi:10.5194/hess-17-1035-2013
Pelto, B. M., Menounos, B., and Marshall, S. J. (2019). Multi-year evaluation of airborne geodetic surveys to estimate seasonal mass balance, Columbia and Rocky mountains, Canada. Cryosphere 13 (6), 1709–1727. doi:10.5194/tc-13-1709-2019
Raben, P., and Theakstone, W. H. (1998). Changes of ionic and oxygen isotopic composition of the snowpack at the glacier Austre okstindbreen, Norway, 1995. Nord. Hydrol. 29 (1), 1–20. doi:10.2166/nh.1998.0001
Samimi, S., and Marshall, S. J. (2017). Diurnal cycles of meltwater percolation, refreezing, and drainage in the supraglacial snowpack of Haig Glacier, Canadian Rocky mountains. Front. Earth Sci. 5 (6), 1–15. doi:10.3389/feart.2017.00006
Schmieder, J., Garvelmann, J., Marke, T., and Strasser, U. (2018). Spatio-temporal tracer variability in the glacier melt end-member — how does it affect hydrograph separation results? Hydrol. Process. 32, 1828–1843. doi:10.1002/hyp.11628
Sharp, M., Tranter, M., Brown, G. H., and Skidmore, M. (1995). Rates of chemical denudation and CO drawdown in a glacier-covered alpine catchment. Geology 23 (1), 61–64. doi:10.1130/0091-7613(1995)023<0061:rocdac>2.3.co;2
Shea, J. M., Anslow, F. S., and Marshall, S. J. (2005). Hydrometeorological relationships on Haig Glacier, Alberta, Canada. Ann. Glaciol. 40, 52–60. doi:10.3189/172756405781813465
Sinclair, K. E., and Marshall, S. J. (2008). Post-depositional modification of stable water isotopes in winter snowpacks in the Canadian Rocky mountains. Ann. Glaciol. 49, 96–106. doi:10.3189/172756408787814979
Sinclair, K. E., and Marshall, S. J. (2009). Temperature and vapour-trajectory controls on the stable-isotope signal in Canadian Rocky mountain snowpacks. J. Glaciol. 55 (191), 485–498. doi:10.3189/002214309788816687
Sodemann, H. (2006). Tropospheric transport of water vapour. Lagrangian and eulerian perspectives. Swiss Fed. Inst. Technol. 12. doi:10.3929/ethz-a-005215132
Sokratov, S. A., and Golubev, V. N. (2009). Snow isotopic content change by sublimation. J. Glaciol. 55 (193), 823–828. doi:10.3189/002214309790152456
Stichler, W., Schotterer, U., Frohlich, K., Ginot, P., Kull, C., Gaggeler, H., et al. (2001). Influence of sublimation on stable isotope records recovered from high-altitude glaciers in the tropical andes. J. Geophys. Res. 106 (19), 22613–22620. doi:10.1029/2001jd900179
Taylor, S., Feng, X., Kirchner, J. W., Osterhuber, R., Klaue, B., and Renshaw, C. E. (2001). Isotopic evolution of a seasonal snowpack and its melt. Water Resour. Res. 37 (3), 759–769. doi:10.1029/2000wr900341
Theakstone, W. H. (2003). Oxygen isotopes in glacier-river water, Austre okstindbreen, okstindan, Norway. J. Glaciol. 49 (165), 282–298. doi:10.3189/172756503781830700
Theakstone, W. H., and Tvis Knudsen, N. (1996). Isotopic and ionic variations in glacier river water during three contrasting ablation seasons. Hydrol. Process. 10, 523–539. doi:10.1002/(sici)1099-1085(199604)10:4<523::aid-hyp390>3.0.co;2-8
Tranter, M., Brown, G., Raiswell, R., Sharp, M., and Gurnell, A. (1993). A conceptual model of solute acquisition by alpine glacial meltwaters. J. Glaciol. 39 (133), 573–581. doi:10.1017/S0022143000016464
Wang, X., Li, Z., Ross, E., Tayier, R., and Zhou, P. (2015). Characteristics of water isotopes and hydrograph separation during the spring flood period in Yushugou River Basin, Eastern Tianshans, China. J. Earth Syst. Sci. 124 (1), 115–124. doi:10.1007/s12040-014-0517-x
Williams, M. W., Knauf, M., Caine, N., Liu, F., and Verplanck, P. L. (2006). Geochemistry and source waters of rock glacier outflow, Colorado front range. Permafr. Periglac. Process. 17, 13–33. doi:10.1002/ppp.535
Yde, J. C., Knudsen, N. T., Steffensen, J.P., Bent Hasholt, J. L. C., Ingeman-Nielsen, T., Kronborg, C., Ingeman-Nielsen, T., et al. (2016). Stable oxygen isotope variability in two contrasting glacier river catchments in Greenland. Hydrology Earth Syst. Sci. 20 (3), 1197–1210. doi:10.5194/hess-20-1197-2016
Keywords: Alpine glacier, oxygen-18, deuterium, isotopic fractionation, isotopic enrichment, hydrology
Citation: Penn K, Marshall SJ and Sinclair KE (2023) Seasonal enrichment of heavy isotopes in meltwater runoff from Haig Glacier, Canadian Rocky Mountains. Front. Earth Sci. 11:1125877. doi: 10.3389/feart.2023.1125877
Received: 16 December 2022; Accepted: 22 March 2023;
Published: 11 May 2023.
Edited by:
Stefano Brighenti, Free University of Bozen-Bolzano, ItalyReviewed by:
Jan Schmieder, University of Innsbruck, AustriaNaveen Kumar, Jawaharlal Nehru University, India
Copyright © 2023 Penn, Marshall and Sinclair. This is an open-access article distributed under the terms of the Creative Commons Attribution License (CC BY). The use, distribution or reproduction in other forums is permitted, provided the original author(s) and the copyright owner(s) are credited and that the original publication in this journal is cited, in accordance with accepted academic practice. No use, distribution or reproduction is permitted which does not comply with these terms.
*Correspondence: Kristina Penn, a3Jpc3RpbmEucGVubkB1Y2FsZ2FyeS5jYQ==
†Present address: Kate E. Sinclair, WSP Canada Inc., Calgary, AB, Canada