 EnBing Yi
 ZongLong Mu3
- 1School of Energy Science and Engineering, Henan Polytechnic University, Jiaozuo, Henan, China
- 2China Coal Technology Engineering Group Chongqing Research Institute, Chongqing, China
- 3Jiangsu Engineering Laboratory of Mine Earthquake Monitoring and Prevention, School of Mines, China University of Mining and Technology, Xuzhou, China
The vibration wave CT detection technology could be used for forecasting dynamic disasters such as coal and gas outburst and rock burst in coal mines as well as for dynamic monitoring and warning of impact risks. Based on the positive correlation between stress and vibration wave velocity and the positive abnormal distribution of vibration wave velocity, the impact danger area could be determined. Two evaluation indexes on the impact risk were constructed: the anomalous coefficient An and abnormal value Am of the gradient variation coefficient (VG) of wave velocity. The critical values of the two indexes corresponding to the impact risk degree were given. In addition, the field engineering practice was carried out by using the inversion results of vibration wave CT detection technology. Combined with the field engineering geological conditions, the impact risk area of the F15-24080 working face was defined comprehensively. The results showed high precision of this CT detection technology. Vibration wave CT detection technology could make dynamic prediction and evaluation of the impact risk on a site and provide guidance and test for the formulation and implementation effect of pressure relief measures in high-impact danger areas.
1 Introduction
Rock burst is characterized by sudden, sharp, and violent destruction, which seriously threatens the safety of coal mine production and causes huge economic losses and casualties (Gong et al., 2012a). It may also induce coal and gas outburst, gas explosion, and other serious and exceptionally serious accidents (GAO, 2019; Zhu et al., 2019). For example, the 5•13 rock burst accident in the Luling Coal Mine of Huaibei Coalfield Group Co., Ltd., in 2003 occurred due to the roof impact, resulting in a gas rush in the goaf and even gas explosion. A total of 84 people died in this accident. The 2•14 rock burst and gas explosion occurred in the Sunjiawan Coal Mine of the Fuxin Mining Bureau in Liaoning Province in 2005. The magnitude (ML) of the mine earthquake reached as high as 2.5, and 214 people died in this accident (Cai et al., 2014). The 11•26 rock burst and coal dust burning accident occurred in Liaoning Hengda Coal Industry Co., Ltd., in 2014. The magnitude of the mine earthquake reached ML 1.6, and 26 people died in this accident. A stress-led coal and gas rush accident occurred in the Sangshuping Coal Mine of Shaanxi Shanmei Hancheng Mining Industry Co., Ltd., on 6 July 2015, even though the gas extraction was up to the standard, resulting in four deaths. The risk of rock burst is highly related to the fracture behavior of rock mass (Cao et al., 2016; ZhaoWangWang et al., 2019; Zhao et al., 2020). The monitoring and effective early warning of its induced dynamic process is the key to preventing disasters and a worldwide problem (Zuo et al., 2019; Wang et al., 2020; Tian and Yiliang, 2020; GAO, 2021; Zhu et al., 2022; Zhuoyue et al., 2022). The monitoring and early warning research is an urgent scientific and technological problem to be solved (Dou et al., 2014).
At present, the monitoring methods of rock burst mainly include microseismic monitoring (Lu et al., 2010), electromagnetic radiation monitoring (Wang et al., 2011), acoustic emission monitoring (Hu et al., 2011), drilling cuttings monitoring (Gu et al., 2012), and stress monitoring (Wang et al., 2010). In recent years, as a new geophysical method, seismic wave CT technology has been widely used in engineering and geological diagnosis. A large number of experiments show that CT technology can reconstruct the three-dimensional structure of a coal body when it is damaged (Du et al., 2022) and intelligently identify cracks (Yu et al., 2022). At present, it has become a powerful tool for exploring faults (ZHANG et al., 2020), loose circles (ZHAO and Baojie, 2020), hidden cracks, and stress states in underground mining (Wang et al., 2021). Particularly, the combination of vibration wave CT detection technology and microseismic real-time monitoring is the latest development direction of rock burst hazard-level assessment and prediction. Peng et al. (2002) and Zhang and Liu (2006) applied vibration wave CT technology for geological structure exploration. The comparative analysis of the exploration showed that this technology had high detection accuracy and obvious structural traces and features. Lurka (2008) evaluated the impact hazard level of Zabrze Bielszowice Coal Mine and other coal mines in Poland using vibration wave CT technology and found that the impact or strong mine earthquake often happened in the high wave velocity and high wave-velocity gradient areas. Dou et al. (2011) studied the relationship between the distribution of wave velocity and distribution of strong mine earthquakes in the 16302C working face of the Yanzhou Jisan Coal Mine by using the vibration wave CT method and found that the accuracy of strong mine earthquakes falling into the rock burst hazard-level warning area was high, which proved the feasibility of vibration wave CT technology in monitoring and warning of the distribution of rock bursts or strong mine earthquake danger. Therefore, the vibration wave CT technology is feasible for detecting a large range of stress-led impact dynamic disasters or the hazard-level distributions of strong mine earthquakes. It may become a strong and favorable monitoring means in the study of stress-led impact dynamic disasters, which will be a general trend and direction of development at home and abroad in the future.
In this paper, a positive correlation between vibration wave velocity and stress was determined; then, the degree of stress concentration in coal and rock could be reflected by measuring wave velocity, and it can be used to analyze the bursting liability of dynamic disasters of coal and rock. The vibration wave CT technology was used to invert and solve the coal (rock) wave velocity distribution map of the F15-24080 working face. The abnormal prediction index of the wave velocity gradient (VG) was put forward based on the theory of rock burst, and then the overall distribution of the rock bursting area of the F15-24080 working face was mastered, so as to effectively decrease the rock bursting tendency.
2 Coupling relationship between vibration wave velocity and stress
The stress–strain curves of coal samples from compression to failure and ultrasonic tests were studied by the uniaxial compression experiment. The results showed that the vibration wave velocity (Wang et al., 2020) of coal samples has a high gradient at the beginning of stress action, with an increase in stress, and the rise in vibration wave velocity slows down and tends to decrease gradually. When the stress rises to a certain stage, the factors affecting the wave velocity no longer changed with the increase in stress. This phenomenon indicated that there is a certain power function relationship between stress and wave velocity (Dou et al., 2014), which indicates an obvious positive correlation.
Many coal samples at the F15-24080 working face were collected in site for test fitting analysis of stress and vibration wave velocity. The test results of some coal samples are shown in Figure 1. It showed that the calculated vibration wave changed rapidly at the stage of low axial stress. With an increase in axial stress, the curve flattened out gradually, which was consistent with the actual monitoring results, indicating that the power function relationship between stress and wave velocity can reflect a change in the law of vibration wave velocity at the elastic and plastic stages. By fitting the correlation coefficient between stress and wave velocity, it appears that there is a strong correlation between these two factors. The average correlation coefficient of a large number of coal samples was above 0.75, indicating that the vibration wave velocity increases with the increase in stress and in the form of a power function. In addition, the test relation model showed a good fit under uniaxial compression and could accurately describe the positive power function correlation between stress and vibration wave velocity before the failure in the limit state.
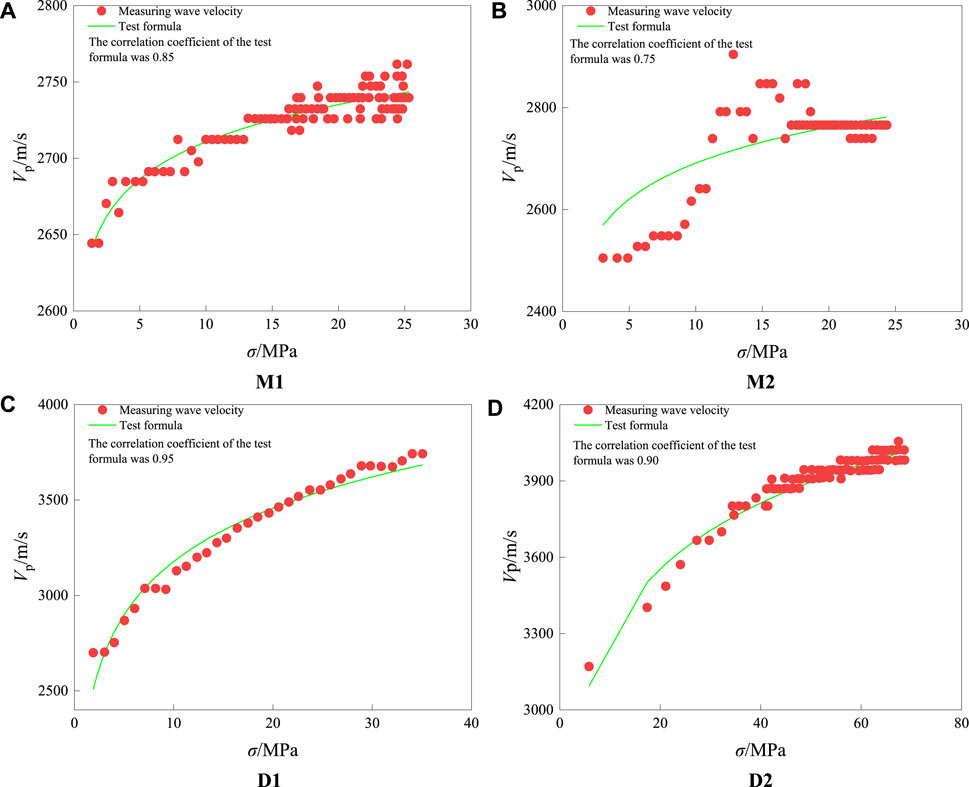
FIGURE 1. Positive correlation between stress and vibration wave velocity. (A) M1, (B) M2, (C) D1, and (D) D2.
3 Principle of vibration wave CT technology
The wave velocity distribution in the “probe–rock burst” spatial envelope region was retrieved according to the distance L between the probe and the rock burst and the first arrival time T received by the station. The rock burst was caused by manual blasting, hammering, or mining. The probe was placed downhole or above the ground (geophone or station). The detection diagram is shown in Figure 2.
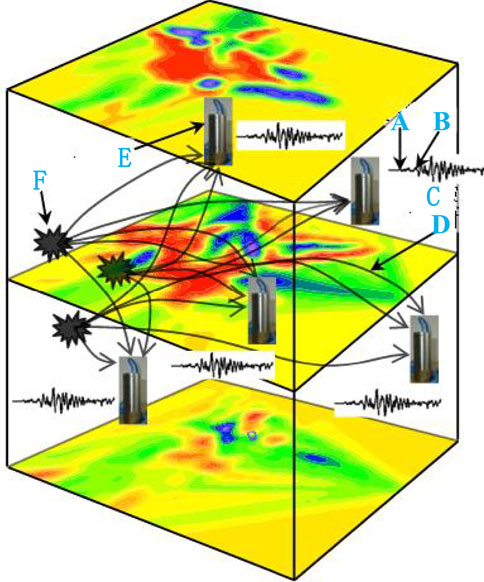
FIGURE 2. Schematic diagram of vibration wave CT detection (Cao et al., 2015). A, P-wave; B, S-wave; C, vibration waveform; D, shock wave rays; E, vibration station; F, epicenter.
The vibration wave propagated in the medium inside the detection area in the form of radiation (as seen in Figure 2). Before inversion, the rock burst location should be specified first, and then the rock burst event and the first arrival time marked on the probe in the corresponding detection target area (the first arrival of the P-wave or the first arrival of the S-wave) were collected as the original inversion data. Then, the “probe–rock burst” spatial envelope region was divided into a series of small rectangular grids. Finally, the high approximation method for inversion was used, and its formula was as follows (ZHANG et al., 2020; GAO, 2021):
that is,
where Ti is the travel time of the vibration wave, s; Li is the ray path of the ith vibration wave; V (x, y, z) is the vibration wave propagation velocity, m/s; S (x, y, z) = 1/V (x, y, z) is the slowness, s/m; dij is the jth grid length through which the ith vibration wave ray passed; N is the total number of rays; and M is the number of grids. It was further expressed in the matrix form as follows:
that is,
where T is the column vector of the vibration wave travel time (N × 1); S is the column vector of slowness (M × 1); and D is the length matrix of the ray (N × M). In general, Eq. 6 was an underdetermined or overdetermined system of equations, and the effective algorithm for solving this kind of an equation was generally iterative algorithm. At present, most of the referenced iterative algorithms included ART algorithm and SIRT algorithm (Luxbacher et al., 2008).
4 The establishment of evaluation indexes
The occurrence of rock burst needs to satisfy the strength, energy, and bursting tendency conditions at the same time, namely, the three criteria theory. When the stress exceeded the strength limit of coal (rock) itself, that is, as the strength condition was met, the rock burst might occur. This relationship was shown as follows:
where σ and σc are the stress and strength of coal (rock), respectively.
The strength condition can be reflected by the relation between
The required spatial conditions of stress and deformation for a rock fracture are shown in Figure 3. Due to the goaf, the overburden strata weight was loaded onto its adjacent support area C, forming a stress reduction area on one side and a high-stress concentration area on the other side, and the two areas always complemented each other in the absence of an additional force.
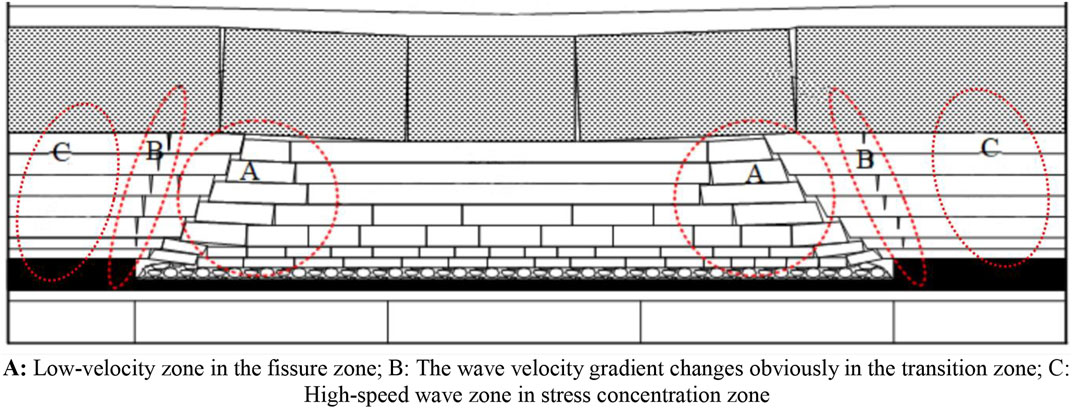
FIGURE 3. Distribution of wave velocity in overburden strata after excavation. A, low-velocity zone in the fissure zone; B, the wave velocity gradient changes obviously in the transition zone; C, high-speed wave zone in the stress concentration zone.
According to the experimental relationship model between vibration wave velocity and stress, the crack area A corresponded to a low wave velocity area, while the stress concentration area corresponded to the high wave velocity area. The area between these two areas was a transition from high wave velocity to low wave velocity, that is, the larger gradient change in wave velocity in area B. It was shown that (Gilbert, 1972; Qi et al., 2006; Wulin et al., 2007; Lurka, 2008; Li et al., 2009; Dou et al., 2014) strong mine earthquakes occur not only in areas with high wave velocity but also in areas with an obvious gradient change in wave velocity. Therefore, areas with large gradient change were also the high rock burst areas.
As shown in Figure 3, region C corresponded to the high-stress concentration area, and there would be a positive anomaly in the vibration wave velocity in other relative areas; while region A was the stress reduction area, there would be a negative anomaly in the vibration wave velocity. Therefore, the abnormal coefficient An of the vibration wave was constructed as follows (Gong, 2010):
where
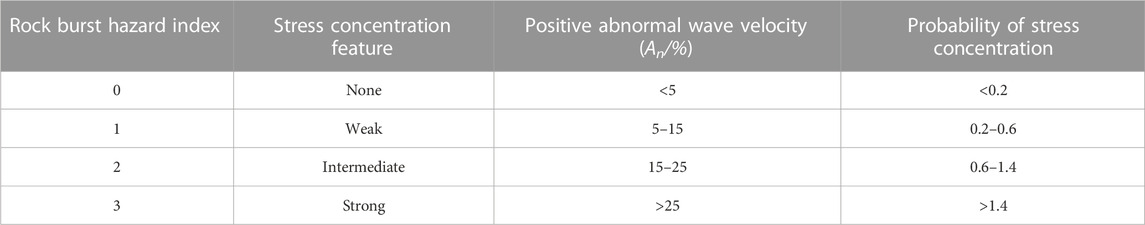
TABLE 1. Relationship between positive anomalies of the wave velocity and stress concentration degree (Dou et al., 2012).
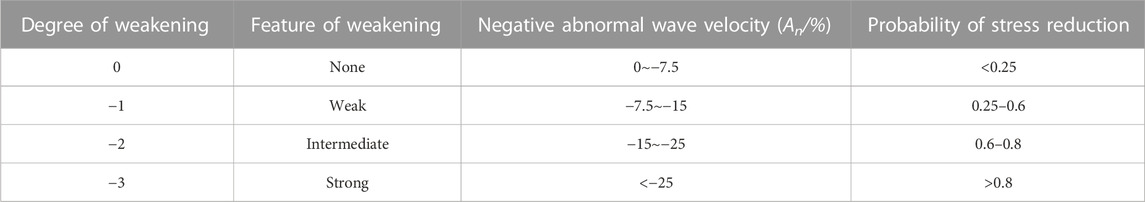
TABLE 2. Relationship between negative abnormal changes in the wave velocity and weakening degree (Dou et al., 2012).
For area B, in order to evaluate the rock burst hazard level by using the gradient outliers of wave velocity variation, the following wave velocity gradient variation coefficient VG (unit: m/s2) was constructed (Gong, 2010):
where Grad is the wave velocity vibration gradient at a point in the inversion region (unit: 1/s). For the abnormal change in VG, Eq. 10 similar to Eq. 8 was used to describe the rock burst hazard level (Dou and He, 2002; Gong, 2010; Dou et al., 2012):
where VGa is the average of VG constructed in the model. The rock burst hazard level corresponding to Am calculated according to the abnormal change in VG is shown in Table 3. When Am<0, the abnormal change was not obvious, and it was considered that there is no danger feature, and the corresponding outlier degree is 0.
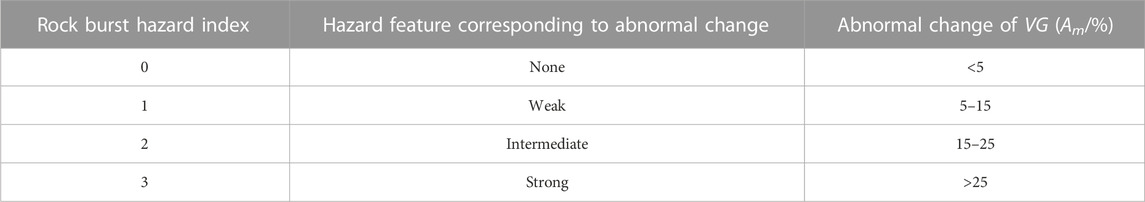
TABLE 3. Relationship between the abnormal change value of the VG value and rock burst hazard level (Wu et al., 2016).
The strength condition indicated that the failure of coal (rock) would occur when the stress exceeded its ultimate strength, which may cause the dynamic instability of coal (rock). The stress value at a certain point of the model could be estimated by the relationship between stress and vibration wave velocity obtained from the experiment. Based on the two parameters constructed previously, the vibration wave CT technology could be used for monitoring and warning about the stress-led impact dynamic disaster.
5 Field application
5.1 Geological situation
The No. 10 Ping Coal Mine has witnessed more than 50 coal and gas outburst accidents. With the increase in mining depth, rock burst disasters had begun to appear obviously. In addition, a dynamic disaster occurred in the F15-24110 working face of the Jisi mining area with a huge sound of coal firing and 21,760 m3 of gas and 385 t of coal rushing out, without holes in the coal body. This complex dynamic disaster had seriously threatened the mine safety production. The F15-24080 working face of the Jisi mining area was at an elevation of −460.8∼−629.5 m, the strike length of the working face was 1,579 m, and the inclined width was 215 m. The average thickness of the F15 coal seam mined in the working face was 2.2 m, and the roof was 18 m thick with medium fine sandstone. In order to ensure safe mining of this working face, the vibration wave CT technology was used to detect the high-stress concentration rock burst area before mining.
5.2 Rock burst hazard evaluation by vibration wave CT inversion
5.2.1 Field implementation plan
In order to conduct a fine and comprehensive detection of the stress distribution state in the F15-24080 working face as far as possible, the implementation plan layout of vibration wave CT was designed as shown in Figure 4. The receiving points were arranged in the transport groove of the working face. The total construction length was 1,650 m, the distance between the receiving points was 7 m, and the receiving points were 236, numbered from left to right as 2001–2236. The excitation points were arranged along the track groove. The total construction length was 1584 m, the distance between the shooting points was 16 m, and the shooting points were 100 in total, numbered from left to right as 1001–1100.
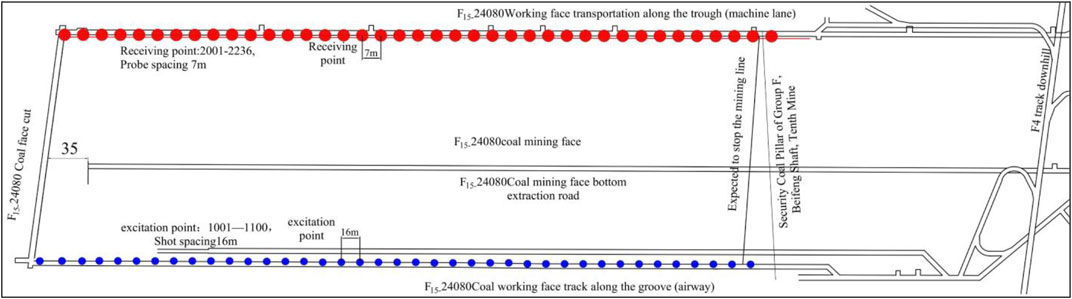
FIGURE 4. Arrangement of the excitation point and receiving point of vibration wave CT.
5.2.2 Analysis of the inversion results
The distribution of stress and Am on the F15-24080 working face were calculated using the aforementioned two indexes with the vibration wave CT inversion technology. Figure 5 shows the contour map of wave velocity distribution of the coal seam and its roof of the F15-24080 working face obtained through vibration-wave CT inversion. According to the distribution of coal wave velocity, two main stress concentration regions could be identified. One was located in the region extending from the cutting head of a mechanical roadway to the middle part of a wind alley. The other was located on the side of the wind alley near the stop mining line. In the middle of the working face, there was an obvious negative anomaly, which was determined by the inversion, and stress on the roof and coal was relatively lower, which indicates that the roof and coal were relatively broken and the pressure release measures were more effective.
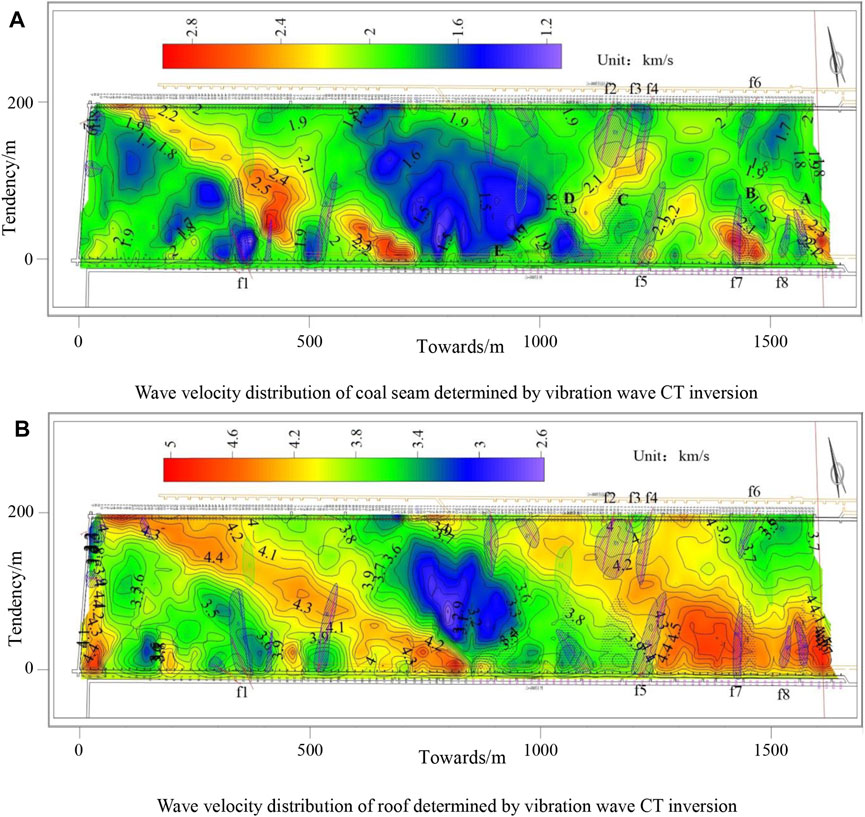
FIGURE 5. Wave velocity distribution of the coal seam and its roof in the F15-24080 working face. (A) Wave velocity distribution of the coal seam determined by vibration wave CT inversion. (B) Wave velocity distribution of the roof determined by vibration wave CT inversion.
As shown in Figure 6, Am of the coal seam and its roof also had two main rock burst hazard areas, which corresponded to the stress concentration area in Figure 4. It indicated that there is an obvious low wave velocity area in the middle of the working face. Compared with the wave velocity on both sides of the roadway, there was an obvious gradient change. Therefore, the Am distribution map showed that there is a rock burst hazard area near the two grooves in the middle of the working face, and the distribution of the air lane is wider than that of the mechanical lane.
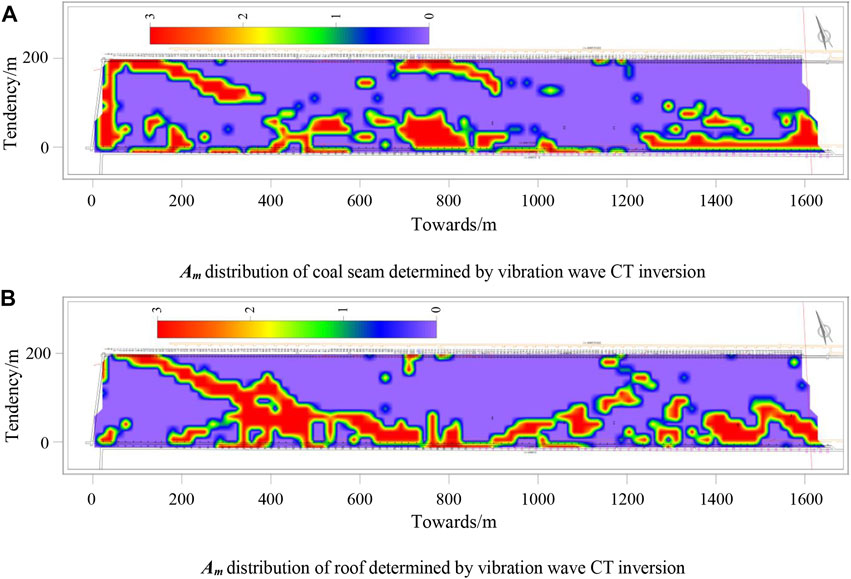
FIGURE 6. Am distribution of the coal seam and its roof in the F15-24080 working face. (A) Am distribution of the coal seam determined by vibration wave CT inversion. (B) Am distribution of the roof determined by vibration wave CT inversion.
5.3 Rock burst hazard area delineation of the F15-24080 working face
As shown in Figure 7, five rock burst hazard areas were determined by comprehensive analysis based on the retrieved stress of the coal seam and its roof of the F15-24080 working face, distribution of Am, and actual production conditions. It included area A near the open cutter side, area E at 400 m from the air tunnel, area D near the machine-lane side in the middle of the working face, area B near the air-return tunnel side in the middle of the working face, and area C on the air-return tunnel side near the stop mining line. Combined with Am and the stress distribution, A, B, and C were determined as the high rock burst hazard areas, but D and E were identified as the middle rock burst hazard areas.
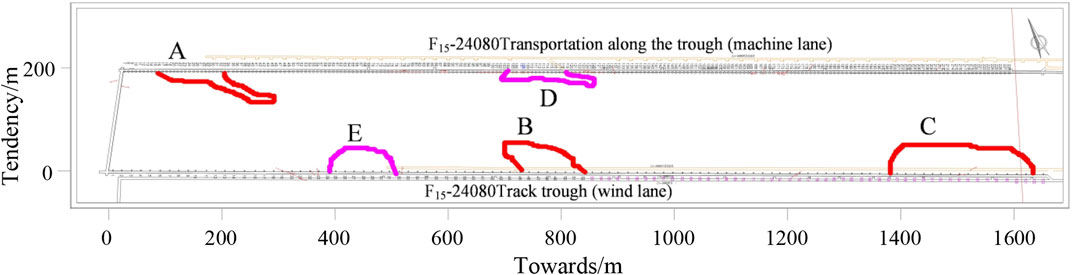
FIGURE 7. Rock burst hazard area delineation of the F15-24080 working face.
Area A was in the range of 60–178 m away from the eye cutter of the air tunnel and extended to 58 m along the working face tendency. Area B was in the range of 728–838 m away from the eye cutter of the air tunnel and extended to 55 m along the working face tendency. Area C was in the range of 1,378–1636 m away from the eye cutter of the air tunnel and extended to 15 m along the working face tendency. In addition, area E was in the range of 387–514 m away from the open cutter of the air tunnel and extended to 45 m along the working face tendency.
5.4 Reliability analysis of rock burst hazard areas in the F15-24080 working face
In order to verify the accuracy of the inversion results and the reliability of the five divided hazard areas, tracking investigation was carried out during the mining process of the working face, and acoustic emission sensors were installed in the leading abatement pressure area in front of the working face and the high stress concentration area obtained from the inversion for tracking and warning.
In the process of excavation at the working face advancing to 400–450 m, three large gas over-load accidents led by ground stress occurred in the high-wave velocity abnormal area obtained by inversion (i.e., high stress concentration area) on 3 July, 8 July, and 19 July 2013. The location of the occurrences is shown in Figure 8. In addition, in the subsequent mining process, different degrees of stress-led rock burst dynamic disasters occurred in the high-stress concentration areas.
(1) On 3 July 2013, a gas over-load occurred when the excavation in the working face area advanced to about 400 m from the eye cutter area. The gas volume concentration of the working face was detected by the probe to reach a maximum of 3.34% and reached 4.7% of the upper corner. A large number of oblique cutting longitudinal cracks from the top to the bottom appeared in the coal wall, and the width of the cracks was about 2∼5 mm. Specular joints caused by tectonic stress could be observed at the coal wall collapse area. The floor heave with a length of 6–9 m and a height of 0.1–0.2 m appeared in the roadway floor. In addition, at the same time, the acoustic emission probes had also detected the disaster warning information, as shown in Figure 9.
(2) On 8 July 2013, the gas over-load occurred when the excavation in the working face area advanced to about 414 m from the eye cutter area. The maximum depth of coal rib spalling was about 1.1 m, the height was 1.2–1.4 m, and the length was 7∼9 m. A large area of coal rib spalled by the high rock burst caused a large amount of gas to rush out instantly, leading to a gas over-load accident.
(3) On 19 July 2013, the gas over-load occurred when the excavation in the working face area advanced to about 421 m from the eye cutter area. The gas volume concentration of the eye cutter area was detected to reach a maximum of 4.8% and reached 1.05% of the upper corner. Cracks appeared in the coal wall and developed in a wedge-shaped pattern. Its width was 0.02–0.27 m, and its depth was about 0.5–1.1 m. When the rink was raised, the floor heave was about 0.4 m and the rib spalling appeared with a height of 0.1–1.2 m and a depth of 0.4–0.6 m. Furthermore, at the same time, the acoustic emission probes had also detected the disaster warning information, as shown in Figure 10.
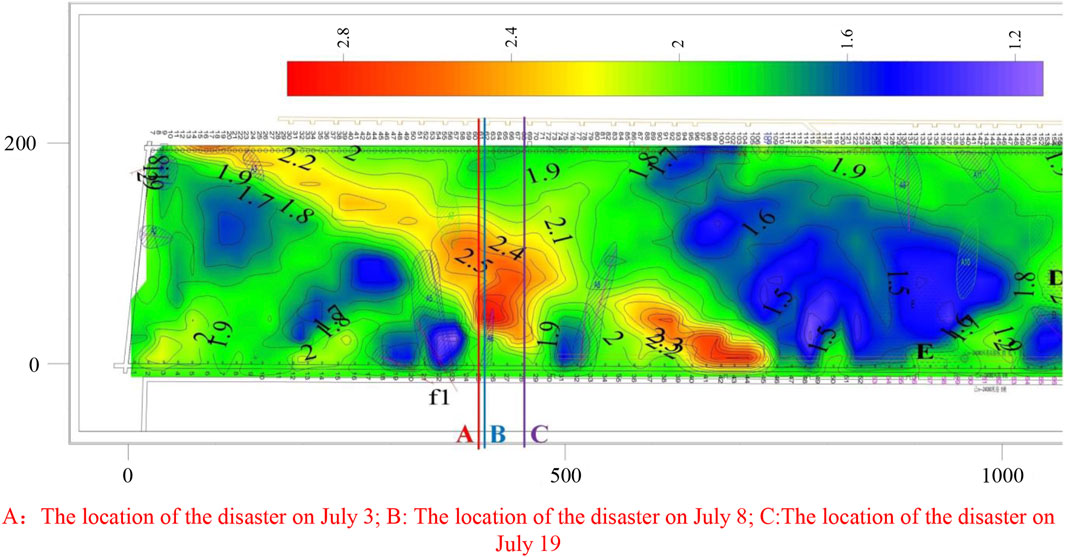
FIGURE 8. High wave velocity abnormal location where dynamic disasters have occurred in the F15-24080 working face. A, location of the disaster that occurred on 3 July 2013; B, location of the disaster that occurred on 8 July 2013; C, location of the disaster that occurred on 19 July 2013.
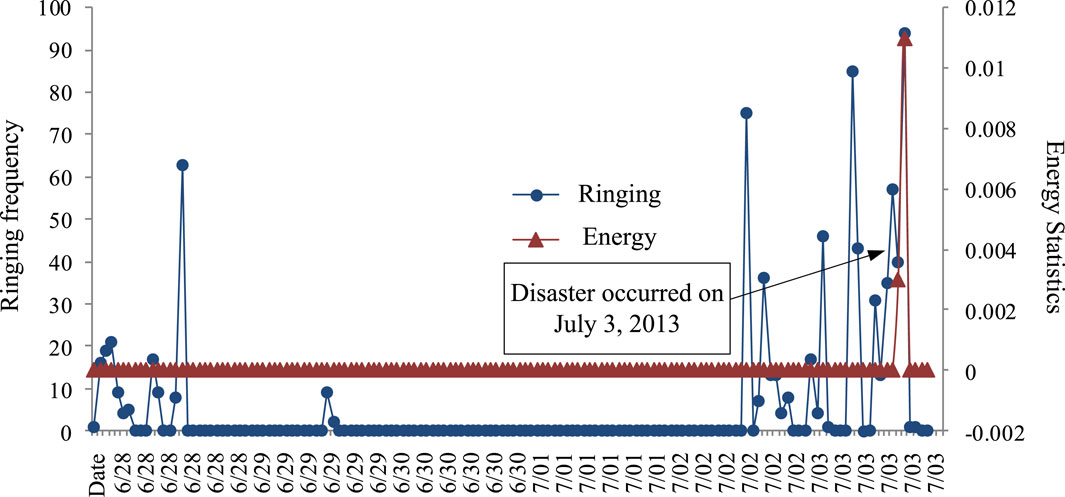
FIGURE 9. Real-time corresponding permutation diagram of the frequency and energy of acoustic emission events during the gas over-load accident on 3 July 2013.
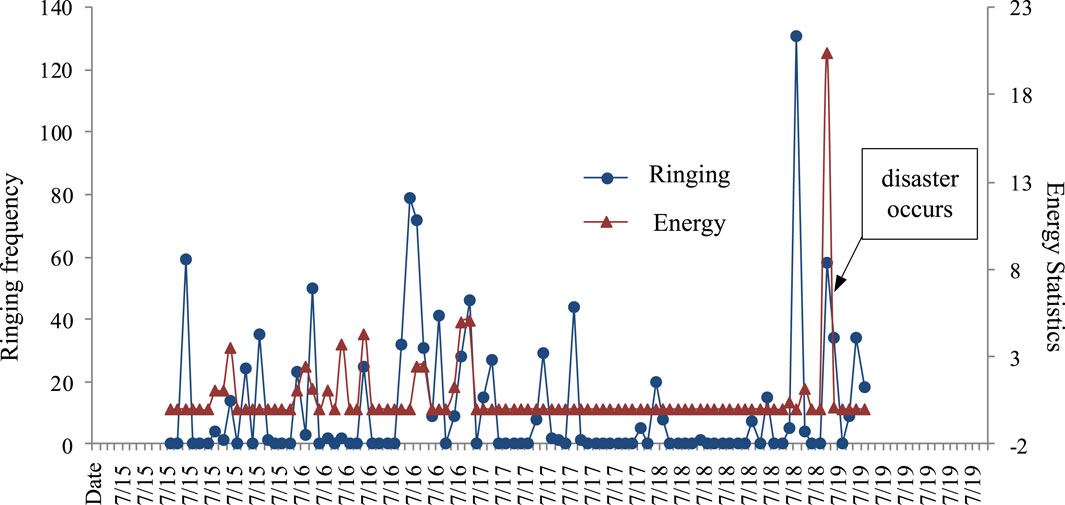
FIGURE 10. Real-time corresponding permutation diagram of the frequency and energy of acoustic emission events during the gas over-load accident on 19 July 2013.
It was found that the vibration wave CT technology had better applicability to predict the stress-led rock burst dynamic disaster. In addition, the rock burst areas presented high accuracies, which were determined based on the anomalous distribution of the retrieved wave velocity of the coal seam and its roof in the F15-24080 working face and distribution of stress and Am. It could also provide guidance and test whether the formulation and implementation effect of the pressure relief measures at the in-site specific location was valid or not.
5 Conclusion
1) In the process of uniaxial compression, the wave velocity of coal samples showed a large gradient variation at the elastic stage but flattened out gradually at the plastic stage, which indicates that there is a power function relationship between stress and vibration wave velocity that can also be established. The results show that the measured values have a high degree of fit to the calculated results of the model, which can describe the relationship between stress and vibration wave velocity and be used for the CT inversion calculation of the field rock burst hazard.
2) By analyzing the relationship model between vibration wave velocity and stress, the anomalous Am and An values of the wave velocity gradient variation were constructed. Furthermore, the contour cloud maps of distributions of stress and the anomalous Am in the roof and coal seam were drawn, respectively. It could give a dynamic evaluation of the in-site rock bursting liability and provide guidance and test for the formulation and implementation effect of the pressure relief measures.
3) Five rock burst areas were determined comprehensively, combining the abnormal stress of the coal seam and its roof of the F15-24080 working face, the anomalous Am, and the actual production conditions. Among them, A, B, and C were determined as the high rock burst hazard areas, but D and E were identified as the middle rock burst hazard areas. It was proved by practice that these partition results show high accuracy. Before the implementation of pressure relief measures, the high value of Am could represent the high rock bursting liability, while after the implementation of pressure relief measures, the high value of Am represents the effectiveness of the effect of pressure relief measures, that is, the degree of weakening was significant (Gong et al., 2012b; Gong et al., 2012c).
Data availability statement
The original contributions presented in the study are included in the article/supplementary material; further inquiries can be directed to the corresponding author.
Author contributions
EY is the first author and contributed to the experiment and numerical simulations. ZM contributed to the experiment and numerical simulations. HW contributed to writing of the manuscript.
Funding
This study was jointly supported by the National Natural Science Foundation of China (nos 52274147, 52174175, and 51774110), the Program for Science and Technology Innovation Talents in Universities of Henan Province (no. 19HASTIT047), and the Science and Technology Project of Henan Province (no. 222102320096).
Conflict of interest
The authors declare that the research was conducted in the absence of any commercial or financial relationships that could be construed as a potential conflict of interest.
Publisher’s note
All claims expressed in this article are solely those of the authors and do not necessarily represent those of their affiliated organizations, or those of the publisher, the editors, and the reviewers. Any product that may be evaluated in this article, or claim that may be made by its manufacturer, is not guaranteed or endorsed by the publisher.
References
Cai, W., Dou, L. M., Li, Z. L., Liu, J., Gong, S. Y., and He, J. (2014). Microseismic multidimensional information identification and spatio-temporal forecasting of rock burst: A case study of Yima Yuejin coal mine, Henan, China. Chin. J. Geophys. 57 (8), 2687–2700. doi:10.6038/cjg20140827
Cao, A., Dou, L., Cai, W., Gong, S., Liu, S., and Jing, G. (2015). Case study of seismic hazard assessment in underground coal mining using passive tomography. Int. J. Rock Mech. Min. Sci. 78, 1–9. doi:10.1016/j.ijrmms.2015.05.001
Cao, R., Cao, P., Fan, X., Xiong, X., and Lin, H. (2016). An experimental and numerical study on mechanical behavior of ubiquitous-joint brittle rock-like specimens under uniaxial compression. Rock Mech. Rock Eng. 49, 4319–4338. doi:10.1007/s00603-016-1029-6
Dou, L., Chen, T., Gong, S., He, H., and Zhang, S. (2012). Rockburst hazard determination by using computed tomography technology in deep workface. Saf. Sci. 50 (4), 736–740. doi:10.1016/j.ssci.2011.08.043
Dou, Linming, Chen, Tongjun, Gong, Siyuan, He, H., and Zhang, S. (2011). Rockburst hazard determination by using computed tomography technology in deep workface. Saf. Sci. 50 (4), 736–740. doi:10.1016/j.ssci.2011.08.043
Dou, L. M., Cai, W., Gong, S. Y., Han, R. J., and Liu, J. (2014). Dynamic risk assessment of rock burst based on the technology of seismic computed tomography detection. J. China Coal Soc. 39 (2), 238–244. doi:10.13225/j.cnki.jccs.2013.2016
Dou, L. M., and He, X. Q. (2002). Mining geophysics. Beijing China: China Science and Culture Press.
Du, F., Wang, K., Zhang, G., Zhang, Y., and Wang, G. (2022). Damage characteristics of coal under different loading modes based on CT three-dimensional reconstruction. Fuel 310, 122304. doi:10.1016/j.fuel.2021.122304
Gao, F. (2021). Influence of hydraulic fracturing of strong roof on mining-induced stress-insight from numerical simulation[J]. J. Min. Strata Control Eng. 3 (2), 023032.
Gao, F. (2019). Use of numerical modeling for analyzing rock mechanic problems in underground coal mine practices. J. Min. Strata Control Eng. 1 (1), 013004.
Gilbert, P. (1972). Iterative methods for the three-dimensional reconstruction of an object from projections. J. Theor. Biol. 36, 105–117. doi:10.1016/0022-5193(72)90180-4
Gong, S. Y., Dou, L. M., Ma, X. P., Mu, Z. L., and Lu, C. P. (2012a). Optimization algorithm of network configuration for improving location accuracy of microseism in coal mine. Chin. J. Rock Mech. Eng. 31 (1), 8–17. doi:10.3969/j.issn.1000-6915.2012.01.002
Gong, S. Y., Dou, L. M., Ma, X. P., Mu, Z. L., and Jiang, H. (2012b). Study on the construction and solution technique of anisotropic velocity model in the location of coal mine tremor. Chin. J. Geophys. 55 (5), 1757–1763. doi:10.6038/j.issn.0001-5733.2012.05.033
Gong, S. Y., Dou, L. M., Xu, X. J., He, J., Lu, C. P., and He, H. (2012c). Experimental study on the correlation between stress and P-wave velocity for burst tendency coal-rock samples. J. Mining&Safety Eng. 29 (1), 67–71. doi:10.3969/j.issn.1673-3363.2012.01.012
Gong, Siyuan (2010). Research and application of using mine tremor velocity tomography to forecast rockburst danger in coal mine. Xuzhou China: China University of Mining and Technology.
Gu, S. T., Wang, C. Q., Jiang, B. Y., Tan, Y. L., and Li, N. N. (2012). Field test of rock burst danger based on drilling pulverized coal parameters. Disaster Adv. 5 (4), 237–240.
Hu, H. E., Dou, L. M., Gong, S. Y., Zhou, P., Xue, Z. J., Jiang, H. E., et al. (2011). Study of acoustic emission monitoring technology for rockburst. Rock Soil Mech. 32 (4), 1262–1268. doi:10.1007/s12583-011-0163-z
Li, Y., Chen, L., Hong, L., and Jiyang, Y. (2009). Research on relationship between tectonic stress field and strong seismic activity in yunnan area. J. Of Geodesy Geodyn. 29 (4), 26–29. doi:10.3969/j.issn.1671-5942.2009.04.006
Lu, C. P., Dou, L. M., Wang, Y. F., and Du, T. T. (2010). Microseismic effect of coal materials rockburst failure induced by hard roof. Chin. J. Geophys. 53 (2), 450–456. doi:10.3969/j.issn.0001-5733.2010.02.024
Lurka, A. (2008). Location of high seismic activity zones and seismic hazard assessment in Zabrze Bielszowice coal mine using passive tomography. J. China Univ. Mining&Technology 18 (2), 177–181. doi:10.1016/s1006-1266(08)60038-3
Luxbacher, K. D., Westman, E., Swanson, P., and Karfakis, M. (2008). Three-dimensional time-lapse velocity tomography of an underground longwall panel. Int. J. Rock Mech. Min. Sci. 45, 478–485. doi:10.1016/j.ijrmms.2007.07.015
Peng, S., Ling, B., and Liu, S. (2002). Application of seismic tomography in longwall top-coal caving face. Chin. J. Rock Mech. Eng. 21 (12), 1786–1790. doi:10.3321/j.issn:1000-6915.2002.12.008
Qi, C., Chen, Y., Chen, Q. F., and Wang, B. S. (2006). 3-D P and S wave velocity structures and their relationship to strong earthquakes in the Chinese capital region. Chin. J. Geophys. 49 (3), 805–815. doi:10.3321/j.issn:0001-5733.2006.03.024
Tian, Z. H. A. N. G., and Yiliang, W. A. N. G. (2020). Study on deformation evolution law and support technology of surrounding rock in multiple mining roadway. J. Min. Strata Control Eng. 2 (2), 023016.
Wang, D., Zeng, F., Wei, J., Zhang, H., Wu, Y., and Wei, Q. (2021). Quantitative analysis of fracture dynamic evolution in coal subjected to uniaxial and triaxial compression loads based on industrial CT and fractal theory. J. Petroleum Sci. Eng. 196, 108051. doi:10.1016/j.petrol.2020.108051
Wang, E. Y., He, X. Q., Wei, J. P., Nie, B., and Song, D. (2011). Electromagnetic emission graded warning model and its applications against coal rock dynamic collapses. Int. J. Rock Mech. Min. Sci. 48 (4), 556–564. doi:10.1016/j.ijrmms.2011.02.006
Wang, J., Zhang, C., Zheng, D., Song, W. D., and Ji, X. F. (2020). Stability analysis of roof in goaf considering time effect. J. Min. Strata Control Eng. 2 (1), 013011.
Wang, P., Jiang, F., Wang, C., Wang, L., Kong, L., Feng, Z., et al. (2010). The stress incremental forecasting method of rock burst. J. China Coal Soc. 35 (S), 5–9.
Wu, C., Lin-Ming, D., Zhen-Lei, L., Si-Yuan, G., Rong-Jun, H., and Jun, L. (2016). Verification of passive seismic velocity tomography in rock burst hazard assessment. Chin. J. Geophys. 59 (1), 252–262 [in Chinese]. doi:10.6038/cjg20160121
Wulin, L., Yunsheng, Y., Zhifeng, D., and Lifen, Z. (2007). Tomographic imagery of p-wave velocity structure in three gorges region. J. Of Geodesy Geodyn. 27 (3), 80–84. doi:10.3969/j.issn.1671-5942.2007.03.018
Yu, J., Wu, C., Li, Y., and Zhang, Y. (2022). Intelligent identification of coal crack in CT images based on deep learning [J]. Comput. Intell. Neurosci., 2022. doi:10.1155/2022/7092436
Zhang, D. D., Li, S. J., Zhang, X., Yang, Y. Y., and Chai, J. (2020). Experimental study on mining fault activation characteristics by a distributed optical fiber system. J. Min. Strata Control Eng. 2 (1), 013018.
Zhang, P., and Liu, S. (2006). Character appearance of fault structure in seism ic wave CT inversion form ine work faces detecting. J. China Coal Soc. 31 (1), 35–39. doi:10.3321/j.issn:0253-9993.2006.01.008
Zhao, Q., and Baojie, F. U. (2020). Study on loose zone testing and support technology of roadway surrounding rock affected by dynamic pressure. J. Min. Strata Control Eng. 2 (2), 023031.
Zhao, Y., Wang, Y., Tang, L., Liu, Q., and Cheng, G. (2019). Modeling of rheological fracture behavior of rock cracks subjected to hydraulic pressure and far field stresses. Theor. Appl. Fract. Mech. 101, 59–66. doi:10.1016/j.tafmec.2019.01.026
Zhao, Y., Zhang, L., Liao, J., Wang, W., Liu, Q., and Tang, L. (2020). Experimental study of fracture toughness and subcritical crack growth of three rocks under different environments. Int. J. Geomechanics 20 (8), 04020128. doi:10.1061/(ASCE)GM.1943-5622.0001779
Zhu, J., Yin, Q., Zhang, J., and Jing, H. (2022). Deformation evolution and asymmetric support of deep-buried surrounding rock mass with a gently inclined weak interlayer. J. Min. Strata Control Eng. 4 (5), 053031.
Zhu, W. C., Niu, L. L., Li, S. H., and Li, S. (2019). Creep-impact test of rock: Status-of-theart and prospect. J. Min. Strat. Control Eng. 1 (1), 013003.
Zhuoyue, S. U. N., Yongzheng, W. U., and Jiuzheng, S. U. N. (2022). Length-to-diameter ratio effect of dynamic deformation modulus of coal samples under three-dimensional dynamic and static loading. J. Min. Strata Control Eng. 4 (4), 043021.
Keywords: impact risk, vibration wave CT detection, anomalous coefficient of wave velocity, outliers of wave velocity gradient change, dynamic prediction of shock hazard
Citation: Yi E, Mu Z and Wang H (2023) Application of vibration wave CT technology in the dynamic prediction of shock hazards. Front. Earth Sci. 11:1126388. doi: 10.3389/feart.2023.1126388
Received: 17 December 2022; Accepted: 15 March 2023;
Published: 04 April 2023.
Edited by:
Yong Wang, Southwest Petroleum University, ChinaReviewed by:
Yanlin Zhao, Hunan University of Science and Technology, ChinaWenlong Zhang, China University of Mining and Technology, China
Copyright © 2023 Yi, Mu and Wang. This is an open-access article distributed under the terms of the Creative Commons Attribution License (CC BY). The use, distribution or reproduction in other forums is permitted, provided the original author(s) and the copyright owner(s) are credited and that the original publication in this journal is cited, in accordance with accepted academic practice. No use, distribution or reproduction is permitted which does not comply with these terms.
*Correspondence: EnBing Yi, eWllbmJpbmc5NUAxNjMuY29t