 Talal Alharbi
 Kamal Abdelrahman
- Geology and Geophysics Department, College of Science, King Saud University, Riyadh, Saudi Arabia
The groundwater potential zones in the Rapigh-Yanbu area, on the west coast of Saudi Arabia, were evaluated using remote sensing and geographic information system data leading to the establishment of major watershed development and management strategies. Many factors, including slope, drainage density, land use, geology, lineament density, elevation, yearly precipitation, and soil type distribution, affect the hydrogeological characteristics of coastal aquifers. The Rabigh-Yanbu coastline groundwater potential zones were located and mapped using these characteristics. The annual precipitation rate is categorized into 2–28 mm, 29–52 mm, 53–76 mm,77–107 mm, and 108–164 mm within the study area. The highest elevation was ordered with the lowest rank of 1, while the lowest elevation was given the highest rank of 5. Slopes of 0°–9° were present in the majority of the study region, while slopes of 9°–63° were present in the northwest. Based on the slope, the research area was separated into five classes; 0-3o; 4-9o; 10–16o; 17–25o; 26–63o. Based on the drainage density map; 0–0.36 km2, 0.37–0.53 km2, 0.54–0.73 km2, 0.74–1.32 km2, 1.33–3.31 km2. The majority of the fractures trended NE–SW and NW–SE. A map of lineament density was made using the line density method. This map makes it obvious that the region was divided into five classes; 0–0.02 km2, 0.03–0.08 km2, 0.09–0.13 km2, 0.14–0.2 km2, and 0.21–0.34 km2. The classification of soil types in the study region into four classes such as clay loam, clay, sandy clay, and loam. Accordingly, the clay soil was ranked 1, while the loam soil was given the highest rank of 4. The Precambrian rocks had low groundwater potential because of their reduced porosity and were ranked 1, while Quaternary deposits had a high porosity and good groundwater potential and were given a high rank of 3. According to the likelihood of groundwater supply, the area is divided into four categories: very good, good, moderate, and poor. The area with very good groundwater potential covered 1,384 km2, while the area with good groundwater potential covered 30,498 km2, according to the findings. The study area had 34,412 km2 of somewhat appropriate land for groundwater development. In contrast, 1,734 km2 of the study area is scarce. The best zones featured the lowest slopes, the least number of lineaments, and the most drainage. The lineaments, which serve as the main conduits for groundwater flow and storage, have significant levels of groundwater recharge capacity in the study area. Managing groundwater according to these identified potential zones will maximize their benefits and increase the groundwater yield. This will help in creating new agricultural, urban, and industrial communities in this strategic area and contribute toward achieving the goals of Saudi Vision 2030.
1 Introduction
One of the most significant and essential natural resources is groundwater and exists in the subsurface geological formations (Fitts, 2002; Dailey et al., 2015). It is the main water source for home, commercial, industrial, agricultural, and other development projects (Pradhan, 2009; Ayazi et al., 2010; Manap et al., 2013; Nampak et al., 2014). Groundwater occurs naturally and is distributed based on various anthropogenic and natural factors (Banks et al., 2002; Greenbaum, 1992; Lee et al., 2012; Mukherjee 1996; Oh et al., 2011; Shahid et al., 2000; Saraf and Choudhury, 1998). Ground surveys utilizing geophysical, geological, and hydrogeological tools-which are typically pricy and time-consuming-are the mainstay of traditional methods used to identify, delineate, and map the groundwater potential zones (Changnon et al., 1988; Sander et al., 1996; Sturchio et al., 2004; Kumar et al., 2005; Mall et al., 2006; Jha et al., 2007; Singh et al., 2013; Senanayake et al., 2016; Asoka et al., 2018; Echogdali et al., 2022a; Mondal et al., 2022a; Echogdali et al., 2022b; Mondal et al., 2022b). On the other hand, geospatial technologies can quickly and affordably produce and model useful data in a variety of geoscience fields (Ganapuram et al., 2009; Oh et al., 2011; Adiat et al., 2012; Moghaddam et al., 2015; Russo et al., 2015). From documented reports, the groundwater potential zones have been defined and mapped using various techniques. For instance, some researchers have used probabilistic models like the frequency ratio (Ozdemir 2011; Razandi et al., 2015), logistic regression (Ozdemir 2011; Pourtaghi and Pourghasemi 2014; Pourghasemi and Beheshtirad, 2015), weights of evidence (Corsini et al., 2009; Ozdemir 2011; Lee et al., 2012; Echogdali et al., 2023), evidential belief function (Mogaji et al., 2015; Pourghasemi and Beheshtirad, 2015), certainty factor (Razandi et al., 2015), decision tree (Chenini and Mammou 2010), artificial neural network model (Lee et al., 2012), Shannon’s entropy (Naghibi et al., 2015), on the whole, remote sensing and GIS are powerful tools that can quickly estimate natural resources. The methods are affordable and can be utilized to successfully explore groundwater (Faust et al., 1991; Hinton 1996; Jha et al., 2010; Benjmel et al., 2022) before utilizing more involved and expensive surveying techniques. The success of the application of remote sensing and geographic information system (GIS) techniques for mapping groundwater potential zones in various regions of the world has been reported (Madrucci et al., 2003; Jaiswal et al., 2003; Solomon and Quiel, 2006; Madrucci et al., 2008; Prasad et al., 2008; Chowdhury et al., 2009; Yeh et al., 2009; Dar et al., 2010; Dar et al., 2010; Saha et al., 2010).
The demand for water resources has grown dramatically over time in Saudi Arabia. Between 2011 and 2015, the overall water demand in Saudi Arabia increased from 19.2 BCM to 24.6 BCM, with an average annual growth of 7%. The demand decreased to 17.4 BCM in 2019, but the demand has increased since then (Owuor et al., 2016). The key sectors with high demands are agriculture (84% of the demand), urban (13%), and industrial (3%). Although almost everyone in the nation has access to fresh water, numerous major concerns persist, including excessive per capita water use, lack of reliable renewable water sources, depleted groundwater supplies, and unsustainable use in agriculture (Jat et al., 2017). This has led Saudi Arabia to use additional water harvesting techniques such as seawater desalination. However, this strategy costs much and is not environmentally friendly, as it uses 10%–20% of the country’s energy (Scott, 2018). The nation’s population is expected to increase along the Red Sea coast due to a number of development projects that aim to draw people and foreign investment. One of the most ambitious projects in the Middle East is the Red Sea Development, which is anticipated to make Saudi Arabia one of the world’s most popular tourist destinations (Samanta, 2012). The Saudi Arabian government fully backs it, and the Red Sea Development Company runs it. Because of their strategic placement, Rabigh and Yanbu are significant industrial cities for the Red Sea Development (Alyusuf, 2021). At present, these cities have a combined population of over 250,000, but they are anticipated to accommodate up to 4.5 million people and provide around 1.3 million new jobs.
Studies of water resources have taken a new direction because of the use of remote sensing and geographic information systems (GIS). Generating the baseline data for groundwater targeting involves analyzing remote sensing data along with topographical maps, auxiliary data, and collateral information with essential field verifications. Based on an indirect study of directly observable terrain features such as geological formations, geomorphology, and their hydrologic characteristics, groundwater potential zones can be identified using remote sensing data. Similarly, lineaments are crucial for finding groundwater in all kinds of terrain. For multi-criteria analysis in resource appraisal and hydrogeomorphological mapping for water resource management, GIS and RS applications can also be taken into consideration. As a result, the primary goal of this study is to create a digital database and thematic maps that consider the variables (Slope, Lineament Density, Lithology, Elevation, Soil, Land Use/Land Cover, Precipitation, and Drainage Density) that affect groundwater potential and use GIS software to delineate groundwater potential zones in the Rapigh-Yanbu area. Decision-makers, government agencies, stakeholders, and the host community will be able to use the research’s findings to design sustainable groundwater management strategies and determine the best places to dig boreholes.
2 Study area
2.1 Geographic location
The study area was set to Rabigh and Yanbu and extends between latitudes 22.80489o–24.31324oN, and longitudes 38.48264o–40.88616oE (Figure 1). The city of Rabigh is 13 m above sea level and close to Madinah Province. Because of its advantageous location along the coastline of the Red Sea, it is the home of various high-profile projects such as King Abdullah Economic City and Petro Rabigh. Furthermore, Aramco, the Saudi Oil Company, chose the city as the location for the new port and refinery, while the city of Yanbu belongs to Al Madinah Province in western Saudi Arabia. The distance from Jeddah to it is about 300 km. Yanbu is the second-largest Saudi Arabian city within the coastline of the Red Sea. Three oil refineries, a plastics plant, and other petrochemical facilities are located in Yanbu, which also serves as a significant petroleum shipping terminal.
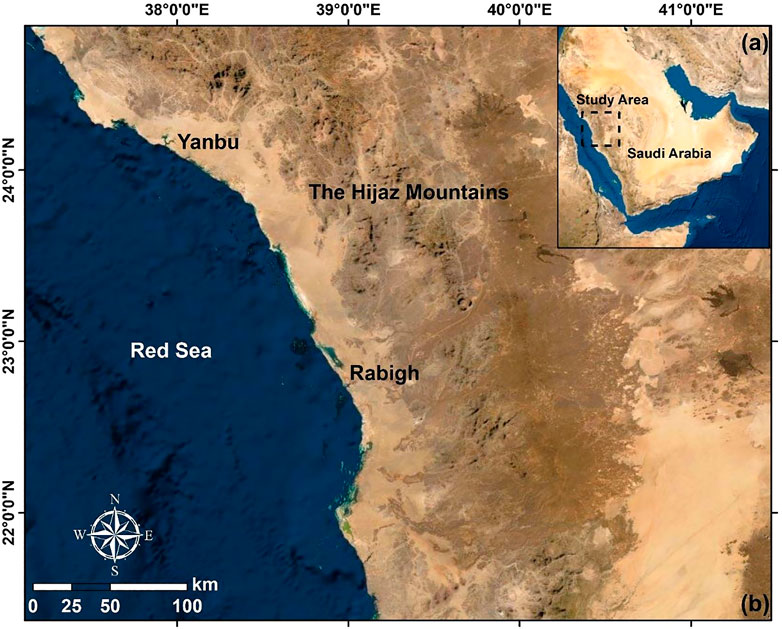
FIGURE 1. Location map for the Rapigh-Yanbu study area.
2.2 Geologic setting
Geological mapping and delineation of the depth, viscosity, parallel and perpendicular continuities of the rock layer, layers of superimposing deposits, and seawater penetration have all been done in the research region (Alyousef et al., 2015). Tertiary and Quaternary deposits are anticipated in the region. The Red Sea floor, a thin plain with a consistent width of 5–10 km, has deposited varying thicknesses of 2.0–5.0 m (Kahil et al., 2015). Syn-depositional tectonic activities in the Red Sea were used to gauge the dispersion of the deposits. The region’s coastal lowlands comprise coralline reef terraces several meters in length that were primarily produced by marine Quaternary deposits. The lowest zones are characterized by alluvial deposits, particularly silt, loose sand, gravel, and mud (Fnais et al., 2010; Almadani et al., 2015). Under the discernible projection in Yanbu’s metropolitan area, the vault is abruptly faulted in wedges (Alyousef et al., 2015). The Red Sea’s formation and growth are related to the surrounding landscape. Most of the boreholes dug in the area are between 20 and 60 m deep. The shallowest layer, filled with silty sand, has revealed a shallow groundwater table that is often less than 1 m deep (Nofal and Abboud, 2016). This confirms that deposits were penetrated by seawater from Yanbu Port, which is more than 100 m to the west.
2.3 Topography, climate, and hydrology
The Rabigh–Yanbu area is distinguished by a low-lying, flat coastal plain constrained by a string of tall, craggy mountains to the east. The Arabian Shield has a slope that goes from north to south. Most valleys receive water from these western mountains, which travel across the coastal plain to its final destination which is the Red Sea (Harris et al., 2014). Most of the towns and cities in the coastal plain are lateral to or near the mouths of these valleys. Because of the dryness of the area and lack of long-term planning, most of the population clusters along the trails and margins of the valley.
3 Materials and methods
Remote sensing (RS) is a favored technique for quickly collecting spatiotemporal data of large areas based on analysis of specific and consistently perceptible ground topographies (Alesheikh et al., 2007). RS can deliver substantial hydrogeological monitoring data in the spatial and temporal domains to develop and validate water resource models. The ability of satellite imagery to capture enormous spatial scales is essential to describing physiographic elements of basins, such as the slope, land cover, and drainage mass, as well as geologic structures like fractures, cleavages, and faults (Subyani et al., 2009; Visalatchi and Padmanaban, 2012). Such information is essential for assessing and investigating groundwater resources.
In this study, the following spatial products and datasets were created. A 30-m-resolution digital elevation model (DEM) was obtained to extract the study area’s primary watersheds, slope distribution, and drainage density. Such a DEM and resolution are crucial for mapping and evaluating disaster risks as well as for preparing for, responding to, and preventing disasters. Each pixel in the DEM was used to represent an elevation value (Al-Djazouli et al., 2020). In addition, the Copernicus DEM was used, which is an updated digital surface model that perfectly captures Earth’s surface with vegetation, infrastructure, and buildings (Green and Cruise, 2005; Petry et al., 2005). The Copernicus DEM GLO-30 provides complete topographical data at a 30-m resolution.
Subsequently, 10-m-resolution land-cover maps from the Environmental Services Research Institute (ESRI) were obtained for the study area. The most recent land-cover map from ESRI uses Sentinel-2 imagery from 2020 and is publicly available through an online portal (Hantson and Chuvieco, 2011). The Food and Agriculture Organization (FAO), which until recently was one of the only worldwide overviews of soil resources for continents and significant regions, provided digital soil maps at a scale of 1:5,000,000 (Heyns, 2020). Because North and Central Asia was the main area of this investigation, the FAO digital soil maps were studied. The Ministry of Environment, Water, and Agriculture provided information on precipitation for the research area.
ArcGIS was used to create the essential features for analysis. A geodatabase was built to house the datasets created for spatial analysis. The geodatabase collected datasets on several types of geographic information. It was with numerous sophisticated capabilities so GIS behavior in the study area could be modeled with networks and topographies (Sankar, 2012). Raster datasets were created for the slope, drainage density, and watersheds. The raster datasets included numerical data and pictures. Raster datasets describe any raster data model kept on a disk or in a geodatabase (Al-Djazouli et al., 2020). The information was stored in a matrix with rows and columns, where each cell represented the data (slope, drainage density, and watersheds). Thematic and continuous data were used to depict elements, including satellite photos, soil data, and data on land use.
After the precipitation data were reclassified and converted to a raster format, vectors were created from the data. The soil and land cover data were converted from vector to raster format in two phases. The first phase was to create a standard grid frame using the FISHNET module in ArcGIS, with each grid having a length and breadth of 1 km and being identified by a single ID. Then, the grid frame was georeferenced at a scale of 1:10,000 to the sink border map. In the second phase, the land usage data were connected to the grid frame, and the input data was assembled into each cell (Wilk and Anderson, 2012). To identify and reinforce the conversion path, the area ratio vector data were finally transformed into a grid raster. The Universal Transverse Mercator projection was used to create the products for spatial analysis. The spatial datasets were weighted based on their significance to identify the desired phenomena.
These thematic layers were then subjected to a weighted overlay analysis. The area ratio vector data were finally transformed into a grid raster to identify and reinforce the conversion path. Then, groundwater potential zones were located using the overlay analysis tool in ArcGIS (Figure 2). Areas on the map were classified into five types depending on potential: very good, good, moderate, poor, and very poor.
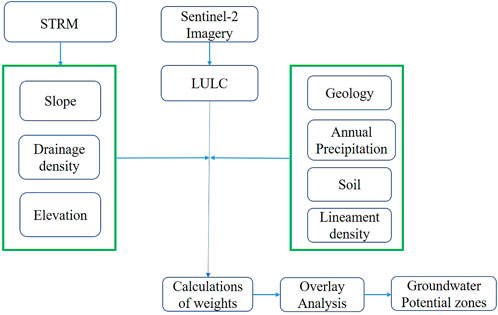
FIGURE 2. Flowchart of the methodology of this study.
4 Results
The description of various thematic maps generated for groundwater potential zone mapping is given below. The number of theme layers utilized in this investigation affected the quality of the findings. This study was limited to the yearly precipitation, slope, drainage density, land use/land cover, geology, lineament density, and geomorphological parameters based on the information and resources available. The following spatial products and datasets were obtained.
4.1 Annual precipitation
The climate of Saudi Arabia varies widely depending on the region and time of year where Saudi Arabia has a desert climate. The highest intensity of rainfall is in the spring and winter. Saudi Arabia has sporadic, infrequent rainfall, usually from October to April (Ministry of Agriculture and Water, 1984). Figure 3 displays the annual precipitation rate for the research area (Ministry of Environment, Water, and Agriculture, 1984). The annual precipitation rate is categorized into 2–28 mm, 29–52 mm, 53–76 mm, 77–107 mm, and 108–164 mm within the study area. Accordingly, the lower rate of precipitation was given the lowest rank of 1, while the highest rate of precipitation was given the highest rank of 5 (Table 1).
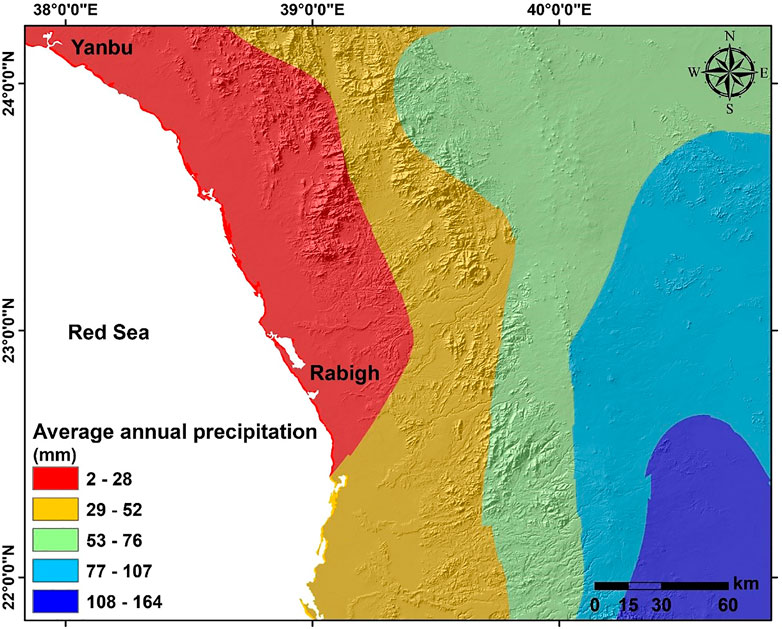
FIGURE 3. The annual rate of precipitation map in the area.
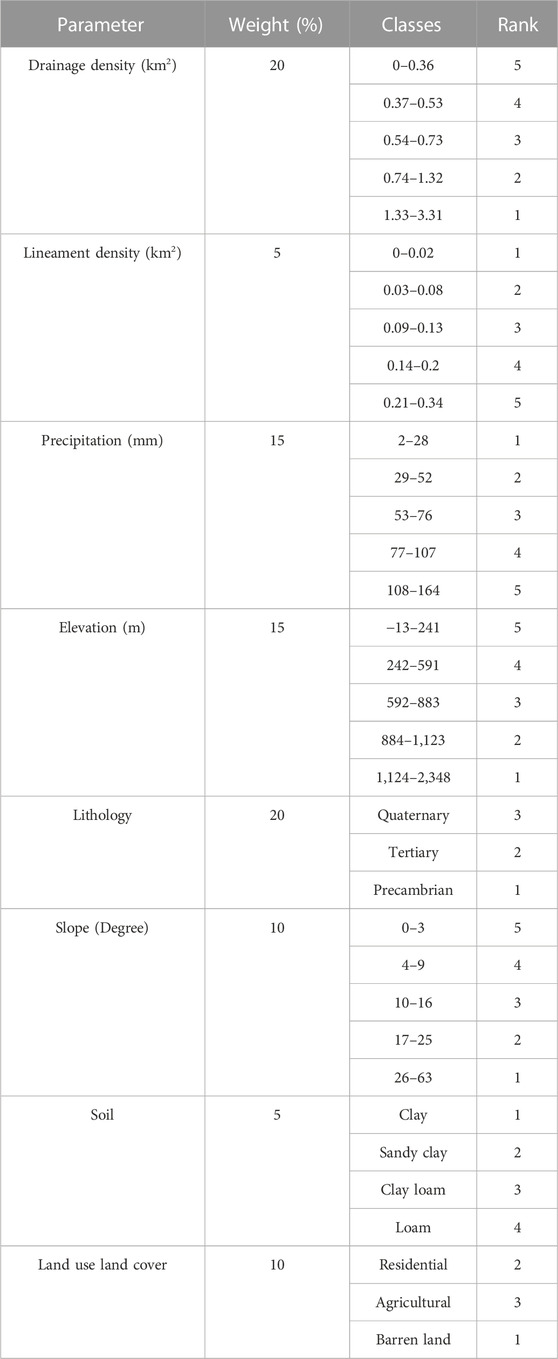
TABLE 1. Ranks and weights for conditioning and triggering factors and their classes in accordance with their relative impacts on groundwater potential zones.
4.2 Elevation
The research area’s elevation ranges from 2348 m above mean sea level to a minimum of 13 m (Figure 4). Generally, the ground’s surface slopes toward the Red Sea. The study area’s elevation was divided into five categories (Table 1). Accordingly, the highest elevation was ordered with the lowest rank of 1, while the lowest elevation was given the highest rank of 5.
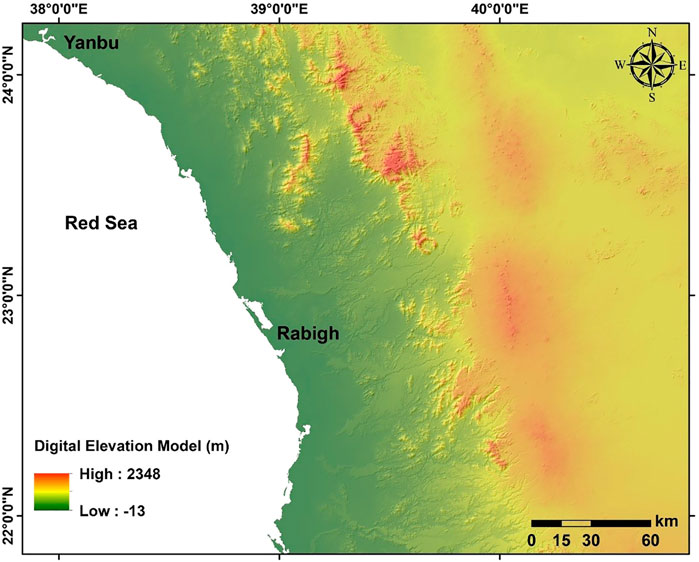
FIGURE 4. The digital elevation model map for the area.
4.3 Slope
The slope degree greatly impacts how much surface water infiltrates into the ground. When it comes to groundwater, the regions with low slopes may hold the rainwater and allow it to percolate into the subsurface, replenishing the groundwater. However, a steep slope causes runoff to travel more quickly, allowing less time for water to settle on the ground surface and consequently lowering the capacity for groundwater recharge. Because the slope depends on the elevation, this information requires recognizing topographic features. In the study area, the slope ranged from 0° to 63° (Figure 5). Slopes of 0°–9° were present in the majority of the study region, while slopes of 9°–63° were present in the northwest. Based on the slope, the research area was separated into five classes; 0–3°; 4–9°; 10–16°; 17–25°; 26–63°. According to Lone et al. (2013), the category with a lower slope (0°–3°) was given the highest rank of 5, whereas the range with a higher slope (26°–63°) was given the lowest rank of 1 (Bagyaraj et al., 2013). These groups have thus been given ratings of very good, good, moderate, poor, and very poor.
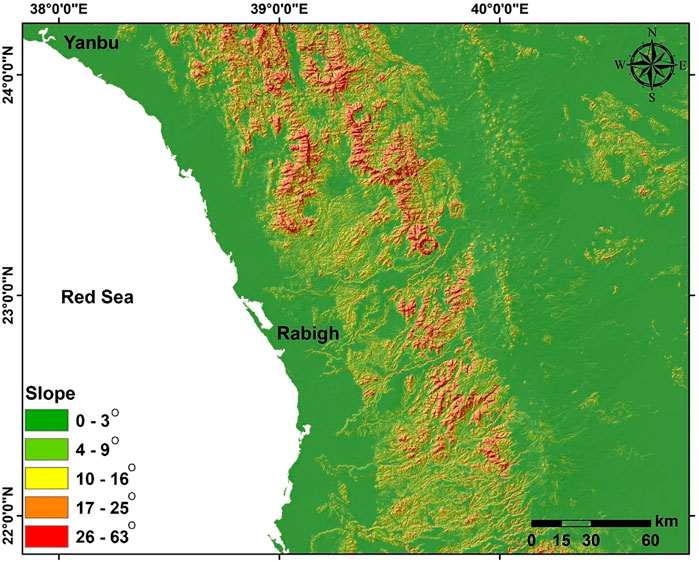
FIGURE 5. The slope variation map of the study area.
4.4 Drainage density
Groundwater occurrence in the area is greatly influenced by drainage and drainage density. The amounts of surface water runoff and infiltration into the subsurface increased with the drainage density. If drainage density is higher, they will be less infiltration of water into the subsurface (Horton, 1945). Moreover, the topography and slope affect a region’s drainage. Figure 6 shows the drainage density as determined by the kernel density approach to help visualize the watershed’s ability to collect groundwater. Five categories are used to categorize the area based on the drainage density map; 0–0.36 km2, 0.37–0.53 km2; 0.54–0.73 km2; 0.74–1.32 km2; 1.33–3.31 km2. Accordingly, these classes have been assigned very good, good, moderate, poor, and very poor categories, respectively.
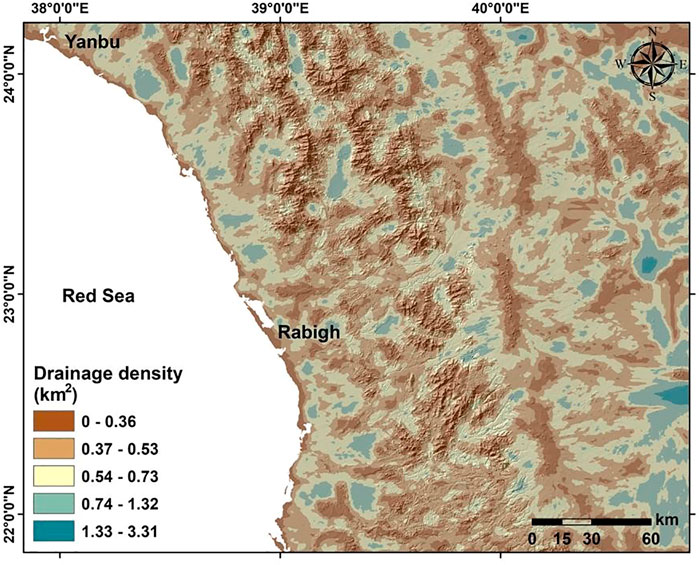
FIGURE 6. Drainage density map of Rapigh-Yanbu area.
4.5 Lineament density
The porosity and permeability of the underlying materials are reflected by lineaments, which are the surface manifestation of subsurface geologic structures (Subba Rao, 2006). Around the world, the main channels for groundwater flow and storage are joints and faults in impermeable rocks (Preeja et al., 2011). This study used a geological map, satellite photos, and on-site observations to identify the lineaments in the studied area. The majority of the fractures trended NE–SW and NW–SE. A map of lineament density was made using the line density method (Figure 7). This map makes it obvious that the region was divided into five classes; 0–0.02 km2; 0.03–0.08 km2; 0.09–0.13 km2; 0.14–0.2 km2, and 0.21–0.34 km2. Accordingly, the lowest class was given the lowest rank of 1, while the highest class was given the highest rank of 5.
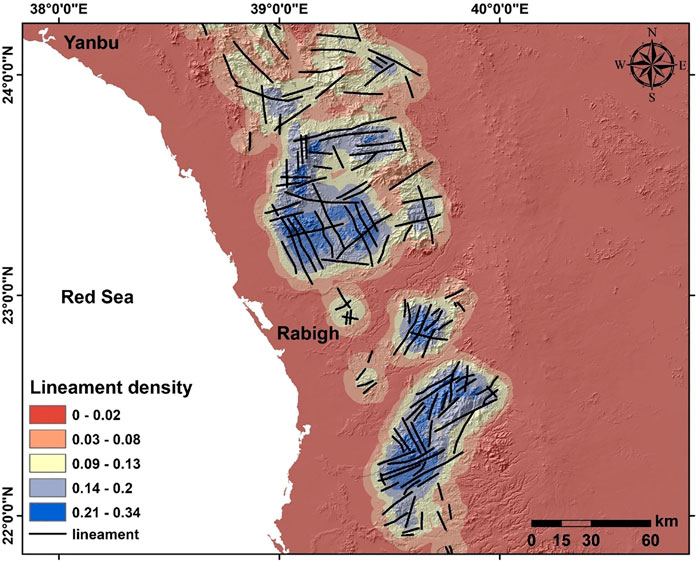
FIGURE 7. Lineament density map of the Rapigh-Yanbu area.
4.6 Lithology
The groundwater conditions in an area can be studied by geological mapping. The geological units that influence groundwater’s occurrence, flow, and quality should receive extra consideration. Precambrian, Tertiary rocks, and Quaternary deposits were the three primary types of lithological units in the study area (Figure 8). The Precambrian rocks had low groundwater potential because of their reduced porosity and were ranked 1. Generally, consolidated rock lacks porosity, and groundwater can only penetrate because of secondary porosity formed by fractures and weathering (Vittala et al., 2005). The Quaternary deposits (Table 1) had a high porosity and good groundwater potential and were given a high rank of 3.
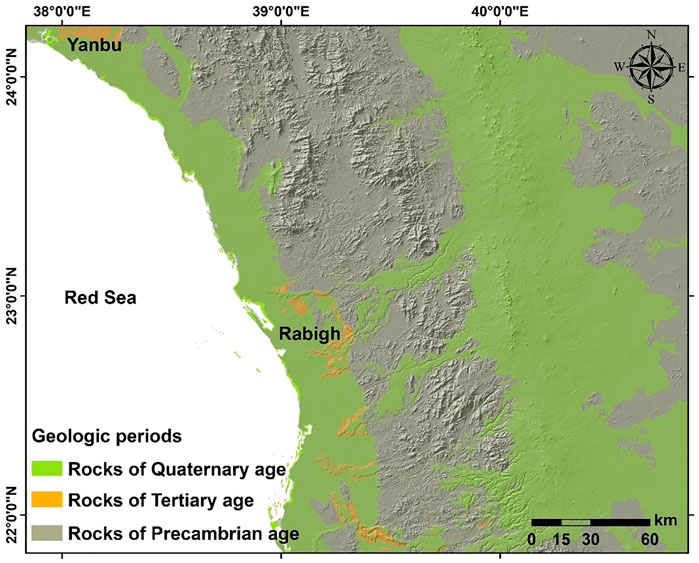
FIGURE 8. Lithology map of the Rapigh-Yanbu area.
4.7 Soil
Figure 9 illustrates the classification of soil types in the study region into four classes such as clay loam, clay, sandy clay, and loam. Accordingly, the clay soil was ranked 1, while the loam soil was given the highest rank of 4 (Table 1).
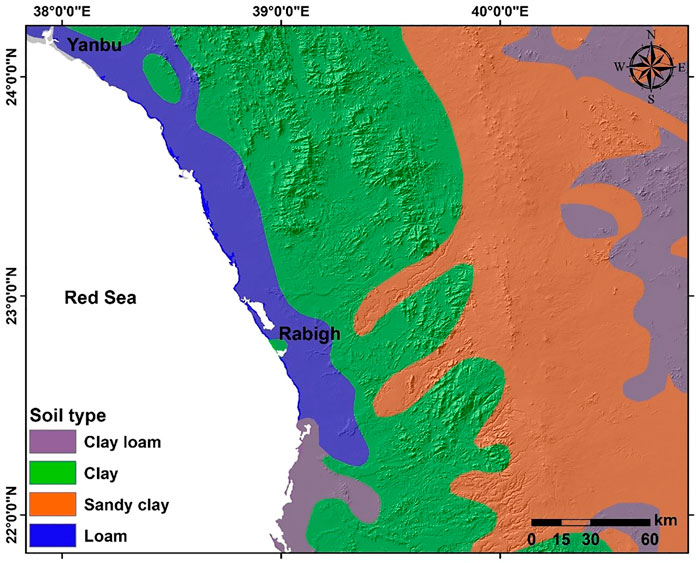
FIGURE 9. Soil types map of the Rapigh-Yanbu area.
4.8 Land use/land cover
In terms of how much water seeps into the ground, land use and land cover of an area reflect its reliance on groundwater. Present Land use/land cover (LU/LC) is assessed for suitability for groundwater prospects. LU/LC controls many hydrological processes like; evapotranspiration, runoff, and recharge of the groundwater system (Chaudhary and Kumar, 2018). The climate and accessibility of water sources affect crop patterns, where the main source of income is agriculture and related activities. The study area is primarily divided into three classes, as shown in Figure 10; barren land, residential areas, and agricultural land. Accordingly, the barren land was ordered the lowest rank of 1, the residential land had a moderate rank of 2, and the agricultural land was given the highest rank of 3.
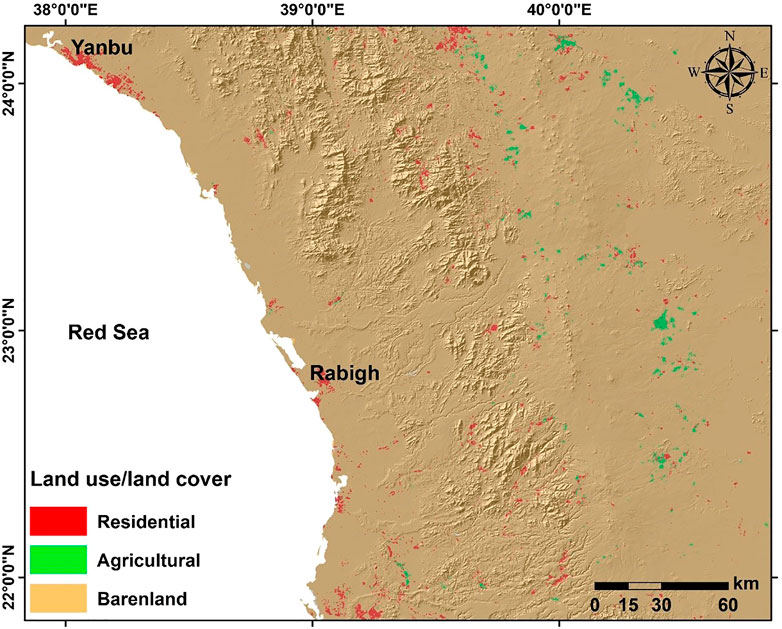
FIGURE 10. Land use/Land cover map of the Rapigh-Yanbu area.
5 Groundwater potential zonation
Several factors can be used to determine groundwater potential. Based on RS data and GIS methods, five features were used in this study to evaluate the groundwater potential. For computational simplicity, each thematic layer’s unique features and sub-features were ranked. The groundwater potential zones were determined after a weighted overlay of the thematic layers (as shown in Table 1). There were weightings and rankings assigned to each parameter. Lineament density and soil received lower weights, while drainage density and lithology received higher weights. After assigning weight to different parameters, individual ranks were assigned to classes within those parameters. The highest possibility is that groundwater will be rated at a maximum of 5. The minimum rank is assigned to the lowest potential of groundwater. Table 1 shows the category-wise description of rank and weightage. The final groundwater potential zone map is created and may be seen in Figure 11 once all criteria have been given weight and rank. The details of the category are shown in Table 2.
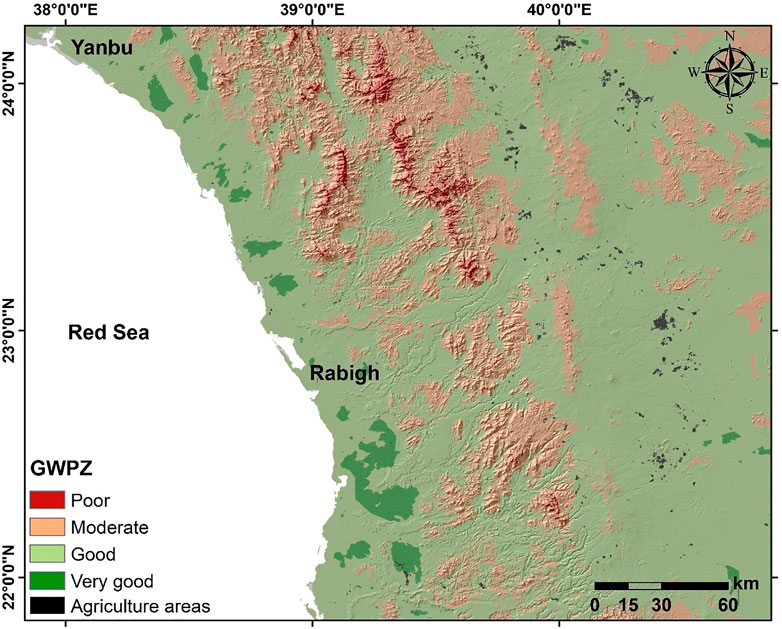
FIGURE 11. Groundwater Potential zones (GWPZ) map of the Rapigh-Yanbu area.
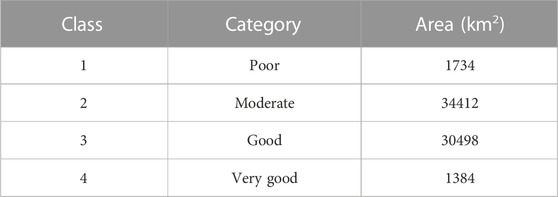
TABLE 2. Groundwater Potential zones are based on Table 1.
According to Figure 11, the study area can be subdivided into four categories based on groundwater potential: bad, moderate, good, and very good. Both the very good and good groundwater potential areas were 1,384 km2 and 30,498 km2, respectively. The study area had 34,412 km2 of appropriate land for groundwater development. In contrast, 1,734 km2 of the study area was in scarcity. Areas with shallow slopes had high groundwater potential. However, the groundwater potential was unaffected by lineaments. Groundwater was only present in the geomorphological pediplains, valleys, and pediments. Precambrian rocks could primarily identify areas with low groundwater potential zones. The study area’s complex geology, geomorphology, and land use were thus represented in the area’s different levels of groundwater potential.
5.1 Validation of the results
The research results were verified by conducting a field trip to the study area to compare the potential groundwater zones resulting from the study with the presence of farms and groundwater wells on the ground. The field trip was focused on two regions, southeast of Rabigh and east of Yanbu, due to their accessibility, while the other regions were found to be located in hard-to-reach areas. During the trip, it was found that the two areas contain farms and groundwater wells, where groundwater levels range from 30 m to about 190 m below the earth’s surface (Figure 12).
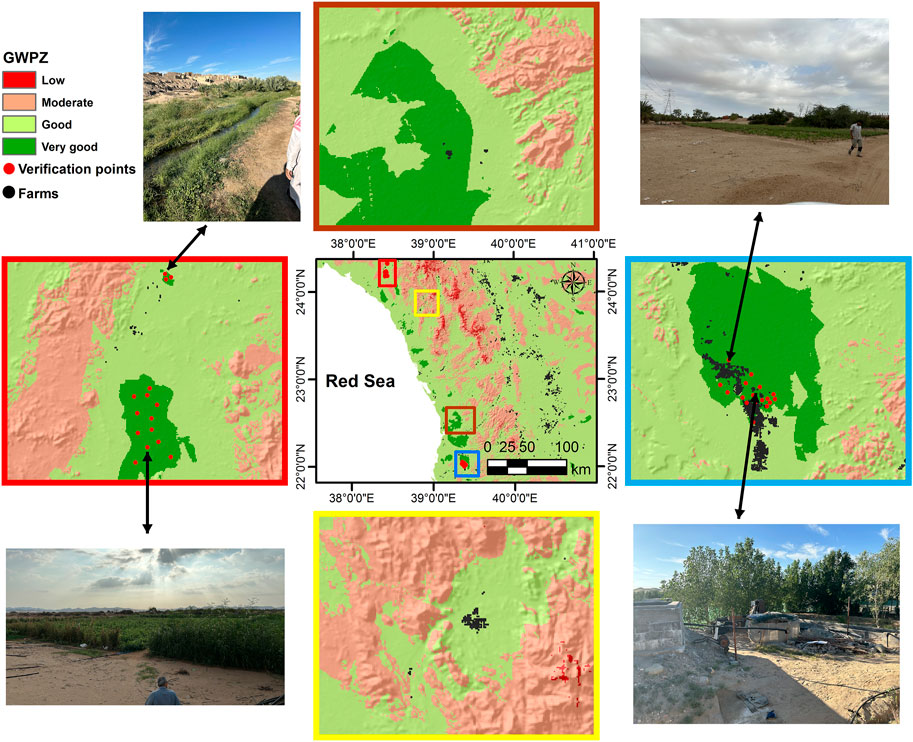
FIGURE 12. Field Verification for the results.
6 Conclusion
Mapping the potential groundwater zones in the Rabigh-Yanbu region was constructed using slope, drainage density, precipitation, elevation, land use, geology, lineament density, and soil type. The assessment shows that zones with very good groundwater potential are 1384 km2, while areas with good groundwater potential are 30,498 km2. In addition, about 34,412 km2 of land was appropriate for groundwater development, whereas around 1,734 km2 was in poverty. The assessment revealed that appropriate locations for groundwater development had minor slopes, low lineament density, and high drainage density, which are common characteristics of agricultural areas with high groundwater potential, whereas areas with low potential concentrate in Precambrian rock areas. The majority of the research region has a significant capacity for groundwater recharge. The research’s outcome was validated in the field by farms and groundwater wells in the suggested areas.
Such investigations will significantly benefit the area’s agronomists in terms of further targeting sites under various zones for groundwater exploration. Municipalities and decision-makers can also use the findings of this study to streamline planning and management. In addition, this study will assist the community in general, and farmers in particular, by providing them with other probable locations for the presence of groundwater, particularly in remote areas that have not previously been used.
Future work is required to confirm the potential groundwater zones found in the present study in remote areas using electrical and magnetic geophysical surveys. Also, it is essential to investigate the possibility of saltwater intrusion that may occur if the shallow coastal aquifer is exploited.
Data availability statement
The raw data supporting the conclusions of this article will be made available by the authors, without undue reservation.
Author contributions
All authors listed have made a substantial, direct, and intellectual contribution to the work and approved it for publication.
Funding
This research was funded by the National Plan for Science, Technology, and Innovation (MAARIFAH), King Abdulaziz City for Science and Technology, Kingdom of Saudi Arabia, Award Number (2-17-01-001-0041).
Conflict of interest
The authors declare that the research was conducted in the absence of any commercial or financial relationships that could be construed as a potential conflict of interest.
Publisher’s note
All claims expressed in this article are solely those of the authors and do not necessarily represent those of their affiliated organizations, or those of the publisher, the editors and the reviewers. Any product that may be evaluated in this article, or claim that may be made by its manufacturer, is not guaranteed or endorsed by the publisher.
References
Adiat, K. A. N., Nawawi, M. N. M., and Abdullah, K. (2012). Assessing the accuracy of GIS-based elementary multi-criteria decision analysis as a spatial prediction tool–a case of predicting potential zones of sustainable groundwater resources. J. Hydrol. 440, 75–89. doi:10.1016/j.jhydrol.2012.03.028
Al-Djazouli, M., Elmorabiti, K., Rahimi, A., Amellah, O., and Fadil, O. (2020). Delineating of groundwater potential zones based on remote sensing, GIS and analytical hierarchical process: A case of waddai, eastern Chad. GeoJournal 86, 1881–1894. doi:10.1007/s10708-020-10160-0
Alesheikh, A., Ghorbanali, A., and Nouri, N. (2007). Coastline change detection using remote sensing. Int. J. Environ. Sci. Technol. 4, 61–66. doi:10.1007/bf03325962
Almadani, S., Al-Amri, A., Fnais, M., Abdelrahman, K., Ibrahim, E., and Abdel-Moneim, E. (2015). Seismic hazard assessment for Yanbu metropolitan area, Western Saudi Arabia. Arab. J. Geosci. 8, 9945–9958. doi:10.1007/s12517-015-1930-4
Alyousef, K., Al-Amri, A., Fnais, M., Abdelrahman, K., and Loni, O. (2015). Site effect evaluation for Yanbu City urban expansion zones, Western Saudi Arabia, using microtremor analysis. Arab. J. Geosci. 8, 1717–1729. doi:10.1007/s12517-014-1310-5
Alyusuf, A. (2021). Sustainable tourism development in the red sea of the kingdom of Saudi Arabia: Threats and opportunities. Reading: Academic Conferences International Limited.
Asoka, A., Wada, Y., Fishman, R., and Mishra, V. (2018). Strong linkage between precipitation intensity and monsoon season groundwater recharge in India. Geophys. Res. Lett. 45, 5536–5544. doi:10.1029/2018gl078466
Ayazi, M. H. A., Pirasteh, S, Pili, A. K., Biswajeet, P., Nikouravan, B., and Mansor, S. (2010). Disasters and risk reduction in groundwater: Zagros Mountain Southwest Iran using geoinformatics techniques. Disaster Adv. 3, 51–57.
Bagyaraj, M., Ramkumar, T., Venkatramanan, S., and Gurugnanam, B. (2013). Application of remote sensing and GIS analysis for identifying groundwater potential zone in parts of Kodaikanal Taluk, South India. Front. Earth Sci. 7, 65–75. doi:10.1007/s11707-012-0347-6
Banks, D., Robins, N., and Robins, N. (2002). An introduction to groundwater in crystalline bedrock. Trondheim, Norway: Norges geologiske undersøkelse.
Benjmel, K., Amraoui, F., Aydda, A., Tahiri, A., Yousif, M., Pradhan, B., et al. (2022). A multidisciplinary approach for groundwater potential mapping in a fractured semi-arid terrain (kerdous inlier, western anti-atlas, Morocco). Water 14, 1553. doi:10.3390/w14101553
Changnon, S. A., Huff, F. A., and Hsu, C.-F. (1988). Relations between precipitation and shallow groundwater in Illinois. J. Clim. 1, 1239–1250. doi:10.1175/1520-0442(1988)001<1239:rbpasg>2.0.co;2
Chaudhary, B. S., and Kumar, S. (2018). Identification of groundwater potential zones using remote sensing and GIS of K-J watershed, India. J. Geol. Soc. India 91, 717–721. doi:10.1007/s12594-018-0929-3
Chenini, I., and Mammou, A. B. (2010). Groundwater recharge study in arid region: An approach using GIS techniques and numerical modeling. Comput. Geosci. 36, 801–817. doi:10.1016/j.cageo.2009.06.014
Chowdhury, A., Jha, M. K., Chowdary, V. M., and Mal, B. C. (2009). Integrated remote sensing and GIS-based approach for assessing groundwater potential in West Medinipur district, West Bengal, India. Int. J. Remote Sens. 30, 231–250. doi:10.1080/01431160802270131
Corsini, A., Cervi, F., and Ronchetti, F. (2009). Weight of evidence and artificial neural networks for potential groundwater spring mapping: An application to the Mt. Modino area (northern apennines, Italy). Geomorphology 111, 79–87. doi:10.1016/j.geomorph.2008.03.015
Dailey, D., Sauck, W., Sultan, M., Milewski, A., Ahmed, M., Laton, W. R., et al. (2015). Geophysical, remote sensing, GIS, and isotopic applications for a better understanding of the structural controls on groundwater flow in the Mojave Desert, California. J. Hydrol. Reg. Stud. 3, 211–232. doi:10.1016/j.ejrh.2014.12.002
Dar, I. A., Sankar, K., and Dar, M. A. (2010). Remote sensing technology and geographic information system modeling: An integrated approach towards the mapping of groundwater potential zones in Hardrock terrain, Mamundiyar basin. J. Hydrol. 394, 285–295. doi:10.1016/j.jhydrol.2010.08.022
Echogdali, F. Z., Boutaleb, S., Abioui, M., Aadraoui, M., Bendarma, A., Kpan, R. B., et al. (2023). Spatial mapping of groundwater potentiality applying geometric average and fractal models: A sustainable approach. Water 15, 336. doi:10.3390/w15020336
Echogdali, F. Z., Boutaleb, S., Bendarma, A., Saidi, M. E., Aadraoui, M., Abioui, M., et al. (2022). Application of analytical hierarchy process and geophysical method for groundwater potential mapping in the tata basin, Morocco. Water 14, 2393. doi:10.3390/w14152393
Echogdali, F. Z., Boutaleb, S., Kpan, R. B., Ouchchen, M., Bendarma, A., El Ayady, H., et al. (2022). Application of fuzzy logic and fractal modeling approach for groundwater potential mapping in semi-arid akka basin, southeast Morocco. Sustainability 14, 10205. doi:10.3390/su141610205
Faust, N. L., Anderson, W. H., and Star, J. L. (1991). Geographic information systems and remote sensing future computing environment. Photogramm. Eng. Remote Sens. 57, 655–688.
Fnais, M., Abdelrahman, K., and Al-Amri, A. (2010). Microtremor measurements in Yanbu city of western Saudi Arabia: A tool for seismic microzonation. J. King Saud. Univ. Sci. 22, 97–110. doi:10.1016/j.jksus.2010.02.006
Ganapuram, S., Kumar, G. T. V., Krishna, I. V. M., Kahya, E., and Demirel, M. C. (2009). Mapping of groundwater potential zones in the Musi basin using remote sensing data and GIS. Adv. Eng. Softw. 40, 506–518. doi:10.1016/j.advengsoft.2008.10.001
Green, R. G., and Cruise, J. F. (2005). Urban watershed modeling using geographic information systems. J. Water Resour. Plan. Manag. 121 (4), 318–325.
Greenbaum, D. (1992). Structural influences on the occurrence of groundwater in SE Zimbabwe. Geol. Soc. Lond. Spec. Publ. 66, 77–85. doi:10.1144/gsl.sp.1992.066.01.04
Hantson, S., and Chuvieco, E. (2011). Evaluation of different topographic correction methods for Landsat imagery. Int. J. Appl. Earth Obs. Geoinf 13, 691–700. doi:10.1016/j.jag.2011.05.001
Harris, I., Jones, P., Osborn, T., and Lister, D. (2014). Updated high-resolution grids of monthly climatic observations - the CRU TS3.10 dataset. Int. J. Climatol. 34, 623–642. doi:10.1002/joc.3711
Heyns, P. (2020). “Water conservation in arid and semi-arid regions,” in Water resources management-vol. I. Editors H. H. G. Saveniji, and A. Y. Hoekstra (Abu Dhabi, UAE: Encyclopedia of Life Support Systems (EOLSS)/UNESCO).
Hinton, J. C. (1996). GIS and remote sensing integration for environmental applications. Int. J. Geogr. Inf. Syst. 10, 877–890. doi:10.1080/026937996137765
Horton, R. E. (1945). Erosional development of streams and their drainage basin, hydrophysical approach to quantitative morphology. Geol. Soc. Amer. Bull. 56, 275–370.
Jaiswal, R. K., Mukherjee, S., Krishnamurthy, J., and Saxena, R. (2003). Role of remote sensing and GIS techniques for generation of groundwater prospect zones towards rural development–an approach. Int. J. Remote Sens. 24, 993–1008. doi:10.1080/01431160210144543
Jat, M., Khare, D., and Garg, P. (2017). Urbanization and its impact on groundwater: A remote sensing and GIS-based assessment approach. Environmentalist 29, 17–32. doi:10.1007/s10669-008-9176-2
Jha, M. K., Chowdary, V. M., and Chowdhury, A. (2010). Groundwater assessment in Salboni Block, West Bengal (India) using remote sensing, geographical information system and multi-criteria decision analysis techniques. Hydrogeol. J. 18, 1713–1728. doi:10.1007/s10040-010-0631-z
Jha, M. K., Chowdhury, A., Chowdary, V. M., and Peiffer, S. (2007). Groundwater management and development by integrated remote sensing and geographic information systems: Prospects and constraints. Water Resour. Manag. 21, 427–467. doi:10.1007/s11269-006-9024-4
Kahil, M., Dinar, A., and Albiac, J. (2015). Modeling water scarcity and droughts for policy adaptation to climate change in arid and semiarid regions. J. Hydrol. 522, 95–109. doi:10.1016/j.jhydrol.2014.12.042
Lee, S., Kim, Y.-S., and Oh, H.-J. (2012). Application of a weights-of-evidence method and GIS to regional groundwater productivity potential mapping. J. Environ. Manage. 96, 91–105. doi:10.1016/j.jenvman.2011.09.016
Lone, M. S., Nagaraju, G., Mahadavesamy, G., and Siddalingamurthy, S. (2013). Applications of GIS and remote sensing to delineate artificial recharge zones (DARZ) of groundwater in H.D. Kote taluk, Mysore district, Karnataka, India. Int. J. Remote Sens. Geosci. 2 (3), 92–97.
Madrucci, V., Taioli, F., and de Arajo, C. C. (2003). Groundwater favorability map using GIS multicriteria data analysis on crystalline terrain, Sao Paulo State. Brazil. J. Hydrol. 357, 153–173.
Madrucci, V., Taioli, F., and de Araújo, C. C. (2008). Groundwater favorability map using GIS multicriteria data analysis on crystalline terrain, Sao Paulo State, Brazil. J. Hydrol. 357, 153–173. doi:10.1016/j.jhydrol.2008.03.026
Mall, R. K., Gupta, A., Singh, R., Singh, R. S., and Rathore, L. S. (2006). Water resources and climate change: An Indian perspective. Curr. Sci. 90, 1610–1626.
Manap, M. A., Sulaiman, W. N. A., Ramli, M. F., Pradhan, B., and Surip, N. (2013). A knowledge-driven GIS modeling technique for groundwater potential mapping at the Upper Langat Basin, Malaysia. Arab. J. Geosci. 6, 1621–1637. doi:10.1007/s12517-011-0469-2
Mogaji, K. A., Lim, H. S., and Abdullah, K. (2015). Regional prediction of groundwater potential mapping in a multifaceted geology terrain using GIS-based Dempster–Shafer model. Arab. J. Geosci. 8, 3235–3258. doi:10.1007/s12517-014-1391-1
Moghaddam, D. D., Rezaei, M., Pourghasemi, H. R., Pourtaghie, Z. S., and Pradhan, B. (2015). Groundwater spring potential mapping using bivariate statistical model and GIS in the Taleghan watershed, Iran. Arab. J. Geosci. 8, 913–929. doi:10.1007/s12517-013-1161-5
Mondal, B. K., Kumari, S., Ghosh, A., and Mishra, P. K. (2022). Transformation and risk assessment of the east Kolkata wetlands (India) using fuzzy MCDM method and geospatial technology. Geogr. Sustain. 3 (3), 191–203. doi:10.1016/j.geosus.2022.07.002
Mondal, B. K., Sahoo, S., Das, R., Mishra, P. K., Abdelrahman, K., Acharya, A., et al. (2022). Assessing groundwater dynamics and potentiality in the lower ganga plain, India. Water 14, 2180. doi:10.3390/w14142180
Mukherjee, S. (1996). Targeting saline aquifer by remote sensing and geophysical methods in a part of Hamirpur-Kanpur, India. Hydrogeol. J. 19, e64.
Naghibi, S. A., Pourghasemi, H. R., Pourtaghi, Z. S., and Rezaei, A. (2015). Groundwater qanat potential mapping using frequency ratio and Shannon’s entropy models in the Moghan watershed, Iran. Earth Sci. Inf. 8, 171–186. doi:10.1007/s12145-014-0145-7
Nampak, H., Pradhan, B., and Manap, M. A. (2014). Application of GIS-based data driven evidential belief function model to predict groundwater potential zonation. J. Hydrol. 513, 283–300. doi:10.1016/j.jhydrol.2014.02.053
Nofal, R., and Abboud, I. A. (2016). Geomorphological evolution of marine heads on the eastern coast of Red Sea at Saudi Arabian region, using remote sensing techniques. Arabian J. Geosciences 9 (2), 163. doi:10.1007/s12517-015-2234-4
Oh, H.-J., Kim, Y.-S., Choi, J.-K., Park, E., and Lee, S. (2011). GIS mapping of regional probabilistic groundwater potential in the area of Pohang City, Korea. J. Hydrol. 399, 158–172. doi:10.1016/j.jhydrol.2010.12.027
Owuor, S., Butterbach-Bahl, K., Guzha, A., Rufino, M., Pelster, D., Díaz-Pinés, E., et al. (2016). Groundwater recharge rates and surface runoff response to land use and land cover changes in semi-arid environments. Ecol. Process 5, 16. doi:10.1186/s13717-016-0060-6
Ozdemir, A. (2011). GIS-based groundwater spring potential mapping in the Sultan Mountains (Konya, Turkey) using frequency ratio, weights of evidence, and logistic regression methods and their comparison. J. Hydrol. 411, 290–308. doi:10.1016/j.jhydrol.2011.10.010
Petry, F. E., Cobb, M. A., and Robinson, V. B. (2005). Fuzzy modeling with spatial information for geographic problems. Berlin, Heidelberg: Springer-Verlag Berlin Heidelberg.
Pourghasemi, H. R., and Beheshtirad, M. (2015). Assessment of a data-driven evidential belief function model and GIS for groundwater potential mapping in the Koohrang Watershed, Iran. Geocarto Int. 30, 662–685. doi:10.1080/10106049.2014.966161
Pourtaghi, Z. S., and Pourghasemi, H. R. (2014). GIS-based groundwater spring potential assessment and mapping in the Birjand Township, southern Khorasan Province, Iran. Hydrogeol. J. 22, 643–662. doi:10.1007/s10040-013-1089-6
Pradhan, B. (2009). Groundwater potential zonation for basaltic watersheds using satellite remote sensing data and GIS techniques. Open Geosci. 1, 120–129. doi:10.2478/v10085-009-0008-5
Prasad, R. K., Mondal, N. C., Banerjee, P., Nandakumar, M. V., and Singh, V. S. (2008). Deciphering potential groundwater zone in hard rock through the application of GIS. Environ. Geol. 55, 467–475. doi:10.1007/s00254-007-0992-3
Preeja, K. R., Joseph, S., Thomas, J., and Vijith, H. (2011). Identification of groundwater potential zones of a tropical river basin (Kerala, India) using remote sensing and GIS techniques. J. Indian Soc. Remote Sensing 39, 83–94. doi:10.1007/s12524-011-0075-5
Razandi, Y., Pourghasemi, H. R., Neisani, N. S., and Rahmati, O. (2015). Application of analytical hierarchy process, frequency ratio, and certainty factor models for groundwater potential mapping using GIS. Earth Sci. Inf. 8, 867–883. doi:10.1007/s12145-015-0220-8
Russo, T. A., Fisher, A. T., and Lockwood, B. S. (2015). Assessment of managed aquifer recharge site suitability using a GIS and modeling. Groundwater 53, 389–400. doi:10.1111/gwat.12213
Saha, D., Dhar, Y. R., and Vittala, S. S. (2010). Delineation of groundwater development potential zones in parts of marginal Ganga Alluvial Plain in South Bihar, Eastern India. Environ. Monit. Assess. 165, 179–191. doi:10.1007/s10661-009-0937-2
Samanta, K. (2012). Modeling coastal floo d hazard using ArcGIS spatial analysis tools and satellite images. Int. J. Sci. Res. 3, 961–967.
Sander, P., Chesley, M. M., and Minor, T. B. (1996). Groundwater assessment using remote sensing and GIS in a rural groundwater project in Ghana: Lessons learned. Hydrogeol. J. 4, 40–49. doi:10.1007/s100400050086
Sankar, K. (2012). Evaluation of groundwater potential zones using Remote Sensing data in upper Vaigai river basin, Tamil Nadu, India. Indian Soc. Remote Sens. 30, 119–129. doi:10.1007/bf02990644
Saraf, A. K., and Choudhury, P. R. (1998). Integrated Remote Sensing and GIS for Groundwater Exploration and Identification of artificial recharge sites. Intl. J. Rem. Sen. 19 (10), 1825–1841.
Scott, K. (2018). Can the Middle East solve its water problem? Available at: https://edition.cnn.com/2018/07/11/middleeast/middle-east-water/index.html.
Senanayake, I. P., Dissanayake, D., Mayadunna, B. B., and Weerasekera, W. L. (2016). An approach to delineate groundwater recharge potential sites in Ambalantota, Sri Lanka using GIS techniques. Geosci. Front. 7, 115–124. doi:10.1016/j.gsf.2015.03.002
Shahid, S., Nath, S., and Roy, J. (2000). Groundwater potential modelling in a soft rock area using a GIS. Int. J. Remote Sens. 21, 1919–1924. doi:10.1080/014311600209823
Singh, P., Thakur, J. K., and Kumar, S. (2013). Delineating groundwater potential zones in a hard-rock terrain using geospatial tool. Hydrol. Sci. J. 58, 213–223. doi:10.1080/02626667.2012.745644
Solomon, S., and Quiel, F. (2006). Groundwater study using remote sensing and geographic information systems (GIS) in the central highlands of Eritrea. Hydrogeol. J. 14, 1029–1041. doi:10.1007/s10040-006-0096-2
Sturchio, N. C., Du, X., Purtschert, R., Lehmann, B. E., Sultan, M., Patterson, L. J., et al. (2004). One-million-year-old groundwater in the Sahara revealed by krypton-81 and chlorine-36. Geophys. Res. Lett. 31. doi:10.1029/2003gl019234
Subba Rao, N. (2006). Groundwater potential index in a crystalline terrain using remote sensing data. Environ. Geol. 50, 1067–1076.
Subyani, A. M., Qari, M. H., Matsah, M. I., Al-Modayan, A. A., and Al-Ahmadi, F. S. (2009). Utilizing remote sensing and GIS techniques to evaluate and reduce hydrological and environmental hazards in some wadis, Western Saudi Arabia. Riyadh, Saudi Arabia: King Abdulaziz City for Sciences and Technology. Project No. APR-25-101.
Vittala, N., Govindaiah, S., and Gowda, H. H. (2005). Evaluation of groundwater potential zones in the sub-watersheds of North Pennar river basin around Pavagada, Karnataka, India using remote sensing and GIS techniques. J. Indian Soc. Remote Sensing 33, 483–493.
Visalatchi, A., and Padmanaban, R. (2012). Land use and land cover mapping and shoreline change studies in Tuticorin coastal area using remote sensing. Int. J. Remote Sens. 1, 1–12.
Wilk, J., and Anderson, L. (2012). GIS-support modeling of areal rainfall in a mountainous river basin with monsoon climate in southern India. Hydrological Sci. J. 45 (2), 185–201. doi:10.1080/02626660009492319
Keywords: Groundwater potential zones, remote sensing, GIS, Rabigh-Yanbu, Saudi Arabia
Citation: Alharbi T, Abdelrahman K, El-Sorogy AS and Ibrahim E (2023) Identification of groundwater potential zones in the Rabigh-Yanbu area on the western coast of Saudi Arabia using remote sensing (RS) and geographic information system (GIS). Front. Earth Sci. 11:1131200. doi: 10.3389/feart.2023.1131200
Received: 24 December 2022; Accepted: 23 January 2023;
Published: 07 February 2023.
Edited by:
Ahmed M. Eldosouky, Suez University, EgyptReviewed by:
Prabuddh Kumar Mishra, Shivaji College, University of Delhi, IndiaMohamed Yassien, National Research Institute of Astronomy and Geophysics, Egypt
Stephen Eguba Ekwok II, University of Calabar, Nigeria
Copyright © 2023 Alharbi, Abdelrahman, El-Sorogy and Ibrahim. This is an open-access article distributed under the terms of the Creative Commons Attribution License (CC BY). The use, distribution or reproduction in other forums is permitted, provided the original author(s) and the copyright owner(s) are credited and that the original publication in this journal is cited, in accordance with accepted academic practice. No use, distribution or reproduction is permitted which does not comply with these terms.
*Correspondence: Kamal Abdelrahman, a2hhc3NhbmVpbkBrc3UuZWR1LnNh