 Jie Hou
 Qingju Wu1*
- 1Institute of Geophysics, China Earthquake Administration, Beijing, China
- 2The First Monitoring and Application Center, China Earthquake Administration, Tianjin, China
In this paper, the 3-D S-wave velocity structure of the crust and upper mantle in the Abaga volcanic area of Inner Mongolia was inverted by using the surface-wave tomography method, with a resolution of 0.5°×0.5°. For the first time, the vertical continuous data recorded by 36 and 25 broadband mobile seismic stations in Abaga volcanic area from October 2012 to May 2015 (NM array) and October 2017 to October 2018 (AB array) were adopted together. The results showed that there was a significant high velocity anomaly structure in the upper mantle at 80–140 km depth in the Abaga volcanic area, and there was a significant low velocity anomaly structure above the high velocity anomaly, which reflected that lithospheric delamination may occurr in the Abaga volcanic area. The overlying NW-SE low-velocity anomaly extended northwest to the boundary of the study area, then to the South Gobi of the Mongolian Plateau; spread southeast to the crustal thinning area and the exposed position of the Abaga volcanic group on the surface. According to the analysis of previous research results, it speculated that this low velocity anomaly may reflect the upwelling asthenosphere, suggesting that the Abaga volcanic group and the South Gobi of the Mongolian Plateau were homologous in depth. Also there was a NEE-SWW low velocity anomaly in the depth range of 40–150 km in the east of Honggeertu volcano, which implied the upwelling of local mantle material formed by the lithospheric delamination in Songliao basin.
1 Introduction
Since the Central Asian Orogenic Belt (CAOB) was adjacent to the Siberian Craton (SC) in the north and the North China Craton (NCC) in the south, as one of the largest Paleozoic orogenic belts in the world, it was formed by overlapping a series of island arcs, ophiolites, oceanic islands, seamounts, accretive wedges, oceanic plateaus and micro landmasses (Badarch et al., 2002; Xiao et al., 2003; Xiao et al., 2004; Windley et al., 2007). Among ophiolite belts, high-pressure blueschist belts and volcanic plutonic rock belts (Huang et al., 2006), it reveals that the area has experienced multiple tectonic movements since its formation, i.e., subduction and extinction of the ancient Asian Ocean, collision and amalgamation of the Indian plate and the Eurasian plate, along with regional extension after collision (Sengör et al., 1993; Jahn et al., 2000; Jahn, 2004; Xiao et al., 2004), accompanied by complex crustal deformation (Petit et al., 2002; Jahn, 2004; Xiao et al., 2004; Kröner et al., 2007; Tiberi et al., 2008) and massive intrusion of granite magma (Jahn et al., 2000). Since the Cenozoic era, a series of intraplate volcanoes have developed in the eastern part of the CAOB, including Wudalianchi volcanoes, Changbaishan volcanoes, Nuomin River volcanoes, Alshan volcanoes and Abaga volcanoes. At present, there are still many controversies on the study of the origin of intraplate volcanoes in this area, mainly including the following three speculations:1) The volcanic activity may be detained by subduction in the mantle transition zone due to the dehydration of the western Pacific plate, resulting in the melting of the upper mantle wedge material and upwelling (Lei and Zhao, 2005; Lei and Zhao, 2006; Zhao et al., 2007; Zhao et al., 2009; Zhao et al., 2011). The evidences of this conjecture include: High content of Nb and Ta elements in Cenozoic basalt widely distributed in the area (Guo et al., 2016), with low content of 18O in peridotite (Wang et al., 2015), indicating that subducted oceanic crust components exist in the magma source. While the basalt contains incompatible elements suggest that the magma source may be a melting metasomatic substance (Guo et al., 2016). 2) Upwelling asthenosphere. The continental collision between the Indian plate and the Eurasian plate, and the high-speed subduction of the Western Pacific plate along the edge of the Eurasian plate, may lead to the passive expansion of the East Asian continental lithosphere, along with the upwelling of asthenosphere through gap in the front of the plate subduction, thus forming small-scale asthenosphere convection and the collision and delamination of the lower lithosphere (Faure and Natal’ln, 1992; Chung et al., 1994; Smith, 1998; Smith, 2013). 3) Some scholars believe that there are mantle plumes or hot spots in this area (Deng et al., 2004). According to the research results of basalt in the Mongolian Plateau, the Cenozoic volcanic activity is the result of interaction between mantle plumes and their overlying lithosphere (Windley and Allen, 1993).
The Abaga Volcanic Group is located in Xilingol, Inner Mongolia which crosses the border area between China and Mongolia with serveal studies, it is connected with the Dariganga Volcano in the Mongolian Plateau (Figure1), bringing widely developed early Mesozoic intracontinental strike slip faults and Cenozoic basalt in this area (Barry et al., 2003), with strong crust mantle interaction (Webb and Johson, 2006; Wang et al., 2013; Guo et al., 2016). As for the intraplate volcanic group with the largest number of volcanoes and the most widely distributed Quaternary volcanic basalt in East Asia (Bai et al., 2012), the Abaga volcanic group provides an excellent sample for studying the formation and evolution process of the eastern margin of Eurasia and the genesis of Cenozoic intraplate volcanoes. Previous seismological studies have shown that the upper mantle of South Gobi, Mongolia, has a low velocity structure extending southeast to Dariganga volcano at a depth of 410 km, indicating that the formation is related to the mantle plume (Zhang et al., 2014; Zhang et al., 2017). Based on ambient noise adjoint tomography, it is revealed that there is a shear wave velocity anomaly smaller than the lowest value of the global orogenic belt model within the depth range of 15–70 km in the Abaga volcanic area. It is believed that there may be about 1% partial melting from the lower crust to the upper mantle, which may be the source of magma provided to the Xilinhot-Abaga volcanic formation (Liu et al., 2017). The receiver function found that the Abaga volcanic area has the characteristics of crustal thinning and high Vp/Vs ratio value by the underplating of Cenozoic volcanic activities (He et al., 2018). The observed shear wave splitting solely null measurements in the Abaga volcanic area may suggest small-scale hot mantle upwellings (Qiang and Wu, 2019). Geochemical research shows that the Abaga volcanic group has similar thermal state and lithospheric mantle characteristics to the northern margin of western NCC (Du et al., 2006; Zhou et al., 2010; Wang et al., 2011), which is significantly different from the Alshan volcano with the residual nature of ancient refractory lithospheric mantle located in the Xingmeng orogenic belt and the Wudalianchi-Kolo volcanic belt belonging to the potassic volcanic rock series (Zhang et al., 2000; Zhao et al., 2008; Zhao and Fan, 2011). In addition, facing the younger intraplate volcanoes and the Cenozoic basalts distributed dispersedly in the Abaga volcanic area from northwest to southeast (Ho et al., 2008), the Cenozoic basalts in the North China-Mongolia-Baikal region have similar geochemical properties (Barry and Kent, 1998), suggesting that these basalts may come from the same mantle source region with similar magmatic formation process (Barry et al., 2003).
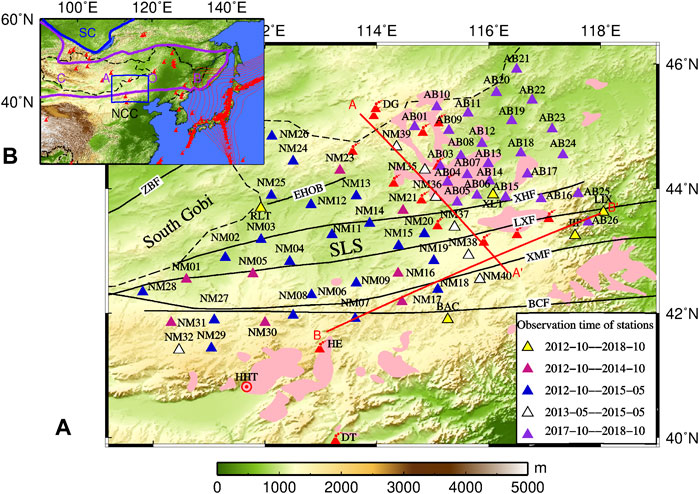
FIGURE 1. Topographic map of the study area showing seismic stations used in the study. (A)Purplish red, blue and white triangles respectively represent the temporary seismic station location of NM Array, while lotus triangle represents the temporary seismic station location of AB Array, yellow triangle represents the permanent fixed station position of China Seismological Bureau. Pink area denotes the distribution of the cenozoic basalts (Guo et al., 2016) and active faults (Xiao et al., 2003; Xu et al., 2013) are represented by black solid lines. The red triangle is the location of the volcano, in which DG is the Dariganga volcano, HE is the Honggeertu volcano, DT is the Datong volcano, and the rest is the Abaga volcano group. (B) The study area on a large scale, in which the blue solid rectangle outlines the study area. Abbreviations on the map are as follows: SLS, Solonker Suture; EHOB, Erenhot Hegenshan Ophiolite Belt; ZBF, Zuunbayan Fault; XHF, Xilinhot Fault; LXF, Linxi Fault; XMF, Xilamulun Fault; BCF, Bayan Obo-Chifeng Fault; HHT, Hohhot; SC, Siberian Craton; CAOB, Central Asia Orogenic Belt; NCC, North China Craton.
The broadband mobile seismic stations previously set up in the Abaga volcanic area and its surrounding areas include the Dandong-Dongwuzhumuqin Banner and the Zhushan-Siziwang Banner profile (Zheng et al., 2006; Zheng et al., 2007; Zhu, 2007; Zhao et al., 2009; Chen et al., 2009; Chen, 2010; Zhu et al., 2011), the Huailai-Erenhot-Bayinwendol profile (Gong et al., 2016), the necessary (Tang et al., 2014; Tao et al., 2014; Guo et al., 2015; Liu et al., 2017) and the central and southern Mongolia array (He et al., 2014; He et al., 2016; He et al., 2017; Zhang et al., 2014; Pan et al., 2015; Yu et al., 2015; Yu et al., 2016; Hou et al., 2017; Qiang et al., 2017; Zhang et al., 2017). These arrays are only located in the periphery of the Abaga Volcanic group, without effective observation of the formed structure. Therefore, although previous studies speculated that the lithospheric delamination of the Songliao Basin and the upwelling asthenosphere beneath Changbai Mountain formed a local convection system, it has not been confirmed whether the delamination of the Songliao Basin could lead to the secondary upwelling of local mantle material in the Abaga volcanic area; although predecessors have inferred that the Dariganga volcano and the Gobi Desert in central and southern Mongolia have the same heat source, even the underground low velocity anomaly of the central and southern Mongolia and the Datong volcano seems to be a unified whole in the upper mantle, it is not clear whether there are interconnected low velocity anomalies in the crust and upper mantle between the central and southern Mongolia, the Abaga volcanic group and the Datong volcano.
In this paper, almost 4 years of continuous seismic observation data obtained from 61 stations (NM array and AB array) in the Abaga volcanic area were used to present regional surface-wave tomography results. By extracting the phase velocity dispersion curve of fundamental Rayleigh-waves between two stations for waves with period of 10–80 s, with the surface-wave tomography method proposed by Yanovskaya and Ditmar. (1990); Ditmar and Yanovskaya. (1987), a 2-D phase velocity distribution map with a resolution of 0.5°×0.5° in Abaga volcanic area was reconstructed. Then, the linear inversion method (Herrmann and Ammon, 2004) was used to invert the Rayleigh-wave phase velocity under each grid point to obtain the 1-D S-wave velocity structure below the grid point. Finally, the S-wave velocity structure of the crust and upper mantle in the Abaga volcanic area was obtained through linear interpolation, which provided a basis for understanding the origin of the Abaga volcanoes and other intraplate volcanoes in the eastern part of the Central Asian orogenic belt.
2 Data and methods
2.1 Data selection and dispersion extraction
From October 2012 to June 2015 and from October 2017 to October 2018, 36 sets (NM array) and 25 sets (AB array) of broadband seismic observations were made around the Abaga volcanoes for continuous data observation by the Institute of Geophysics, China Earthquake Administration. In addition, this paper also collected continuous seismic data of five fixed stations (BAC, JIP, LIX, RLT, XLT) of China Earthquake Administration near the study area from October 2012 to October 2018 to form more ray paths to fill the gap between the two arrays. The distribution of mobile stations and fixed stations was shown in Figure 1, where the distance between NM array stations was 30–680 km, and the seismometers used included GURALP CMG-3ESPC, GURALP CMG-3T, Nanometrics Trillium G120PA and GEOLIGHT BBVS-60. The distance between AB array stations was 14–190 km, and the seismometers included GURALP CMG-3ESPC and Nanometrics Trillium G120PA. All seismometers of two arrays used GPS times and positions to ensure consistency. The seismometers used in fixed stations included GEOLIGHT BBVS-60 and GEOLIGHT BBVS-120.
In this paper, the surface-wave tomography was based on the classical ray theory and measured by the dual-station method. Referring to the seismic catalog and source parameters given by USGS, we selected vertical waveform records that meet the following standards:1) The epicentral distances were limited to 15°–100°; 2) the magnitudes were between 5.5 and 7.5, and the focal depths were less than 70 km; 3) the deviations between the azimuth from the remote station to the near station and the azimuth from the remote station to the seismic event were less than 6°(Hou et al., 2017; Hou et al., 2019). Finally, 773 and 294 global seismic events meeting the above criteria were screened out by the two arrays. Figure 2 shows that most of these seismic events are concentrated in the Pacific Rim. However, the overall coverage of stations in the study area makes uniform path distribution of the dual-station method with better resolution.
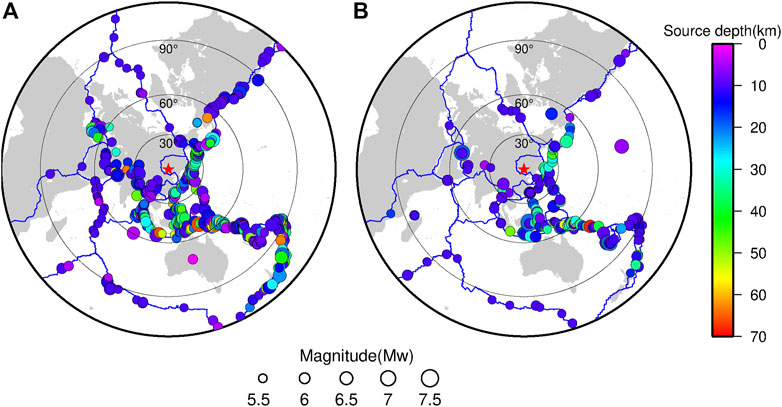
FIGURE 2. Distribution of Events of (A) NM array and (B) AB array. The red pentagram corresponds to the center of study area, and the circles of 30°, 60° and 90° represent the epicentral distance between the earthquake epicenter and the station are 30°, 60° and 90° respectively. The blue lines represent the plate boundaries.
Before extracting the Rayleigh-wave dispersion, a series of preprocessing including resampling, removing the mean and linear trends, filtering and removing instrument response were performed on the selected original seismic waveform records. Then, the frequency-time analysis based on continuous wavelet transform (Wu et al., 2009) was used for the NM array and AB array, and 13,280 and 3,547 fundamental Rayleigh-wave phase velocity dispersion curves were extracted respectively. Removing the dispersion that obviously deviates from the distribution range of most dispersion curves, then finally 12,161 and 2,996 effective dispersion curves were obtained respectively, as shown in Figure 3. After 15 s, the average dispersion curve of the study area was lower than the dispersion curve calculated by AK135, reflecting that the velocity of the lower crust and upper mantle in the study area was lower than AK135.
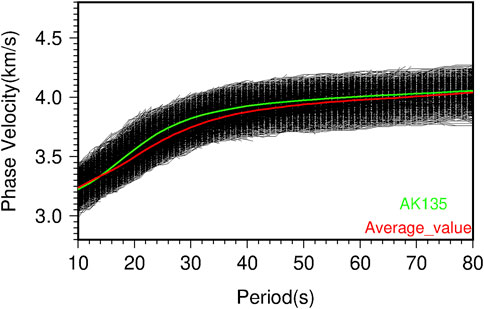
FIGURE 3. Surface-wave phase velocity dispersion curves. The black lines are 15,157 high-quality dispersion curves. The red and green solid lines represent the average phase velocity and the AK135 model respectively.fx4.
Figure 4A shows the distribution of phase velocity ray paths with periods of 10 s, 30 s, 50 s and 80 s. It can be seen that the paths inside and between NM and AB arrays are densely distributed with good azimuth coverage within a period of 50 s; during the 50–80 s period, only the paths inside the two arrays are densely distributed, with sparsely distributed paths.
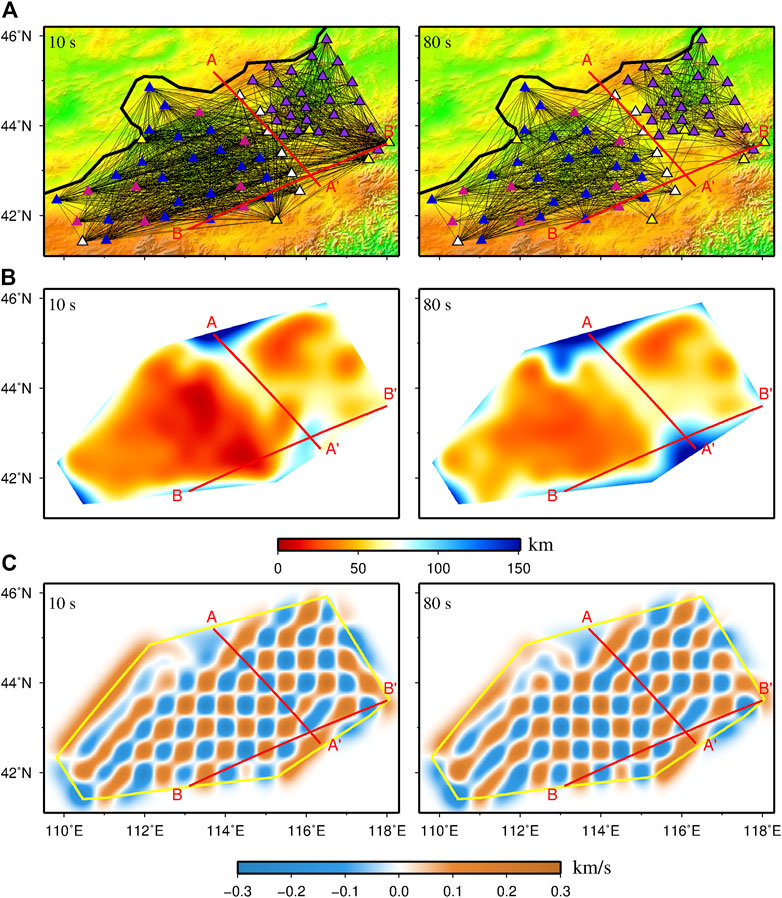
FIGURE 4. (A) Distribution of paths for Rayleigh-wave phase velocity measurements at 10 s and 80 s. Triangles indicate seismic stations, the black line between two stations indicates that there is a path coverage between this station pair. (B) Horizontal resolution map at 10 s and 80 s. The color-filled area is the station distribution area. (C) Checkerboard test at 10 s and 80 s. On Figures 4A,B and 4 (C), the red straight line represents the position of profiles AA’ and BB’.
2.2 Tomography method
In this paper, the 2-D inversion method proposed by Ditmar and Yanovskaya. (1987) and Yanovskaya and Ditmar. (1990) was used to obtain the phase velocity distribution of surface-waves with different periods. Figure 4B shows that, except for the marginal zone and the areas not covered by the ray in the north and southeast of the study area, the phase velocity resolution in the study area is basically within 50 km. After the period is greater than 40 s, there is a decrease in the resolution of the uncovered area of the mobile stations of NM and AB arrays in the study area.
In addition, we performed a checkerboard test to evaluate the ability to restore the actual model. In the test, ±5% of the corresponding periodic phase velocity value was used as the velocity anomaly, and ±5% of the corresponding theoretical travel time was used as the random error. Taking 10 s and 80 s periods, for example, the initial model velocity was set as 3.26 km s−1 and 4.10 km s−1, the velocity anomaly was ±0.16 km s−1 and ±0.21 km s−1, while the Gaussian noise with standard deviations of ±1.5 s and ±1.2 s were added to the travel time of theoretical ray. Using the same inversion method and parameters settings as described above, we calculated the ray distributions for periods of 10 s and 80 s. Figure 4C shows that under the grid of 0.5°×0.5°, the input model of the ray coverage area can be recovered for the feasible study area division.
3 Results
3.1 Phase velocity results
Using the above inversion method and parameter settings, the Rayleigh-wave phase velocity distribution of 10–80 s period with the resolution of 0.5°×0.5° in the Abaga volcanic area was obtained by inversion, as shown in Figure 5. From the depth sensitivity kernels, it can be seen that the phase velocity distribution of different periods could correspond to the structural change of different depths (Figure 6). Figure 6 shows that the phase velocity distribution in the 10–80 s period range of the Abaga volcanic area mainly reflects the structural changes of the crust and upper mantle within the depth of 10–150 km. The large range of depth sensitivity kernel of the medium and long period surface-wave indicates weak resolution to depth, with large depth range corresponding to the velocity structure (Zheng et al., 2007; Yi et al., 2008). In the following, this paper will discuss the distribution characteristics of Rayleigh-wave phase velocity of 10–80 s period in the Abaga volcanic area.
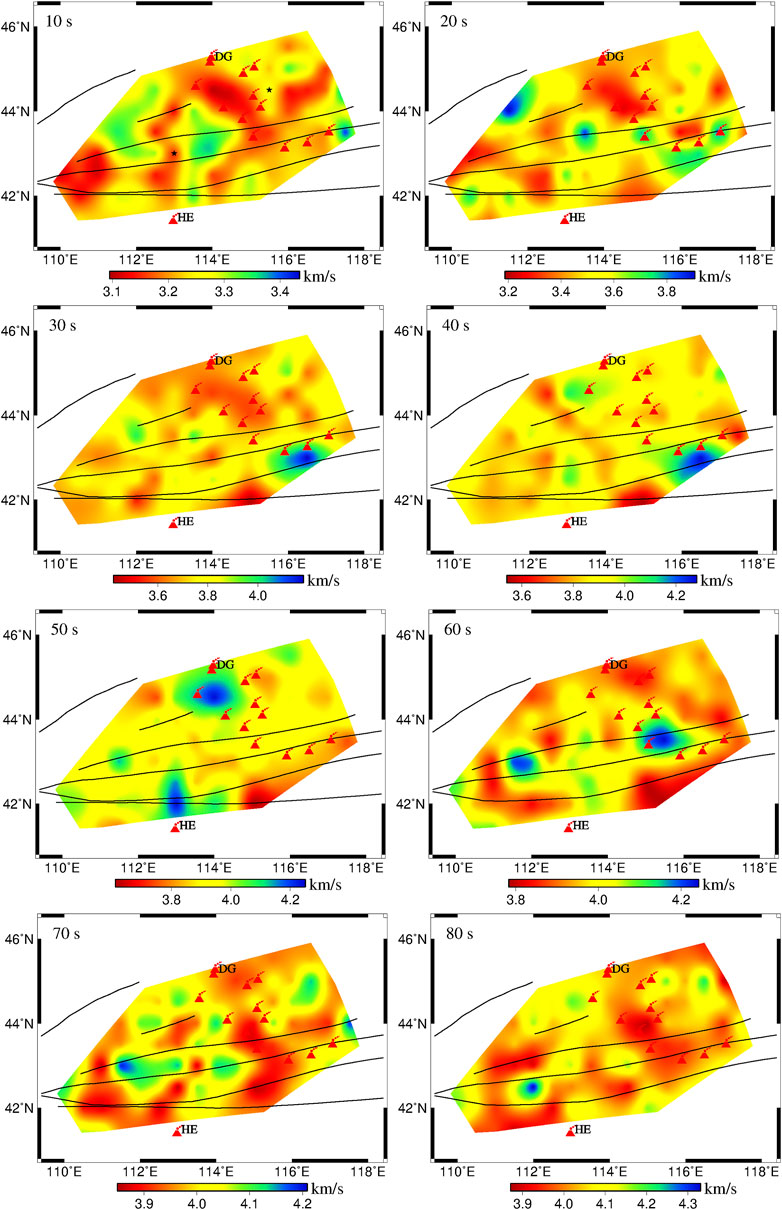
FIGURE 5. Phase velocity maps of Rayleigh-wave in the study region. The number in the upper left corner represents the period (s). The red triangles are the locations of the volcanoes, in which DG is the Dariganga volcano, HE is the Honggeertu volcano, and the rest red triangles are the Abaga volcano group. The black five-pointed stars on 10 s profile are the specific locations of the two grid points used in Figure 7.
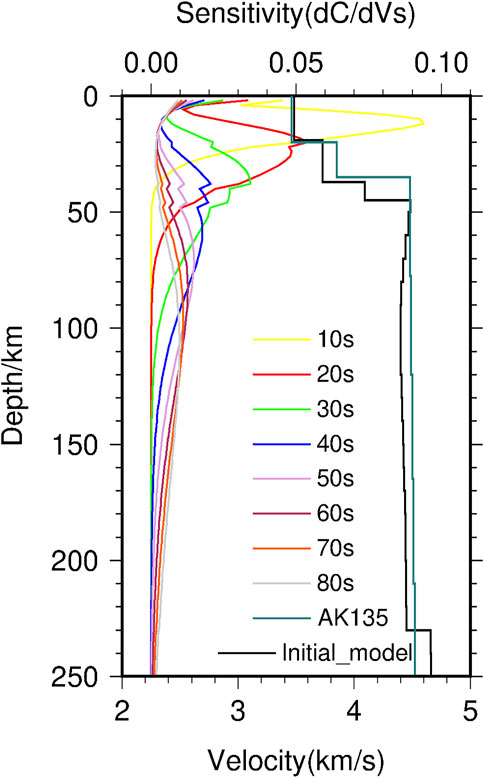
FIGURE 6. Depth sensitivity kernels of Rayleigh-wave phase velocity at different periods. The black line represents the initial model for calculating the depth sensitivity kernels, which is the model retrieved by using the mean value of the dispersion curve in the study area (the red curve in Figure 3).
Figure 6 shows that the phase velocity distribution of Rayleigh-wave with short period (10–20 s) is mainly related to the S-wave velocity structure of the surface and upper crust and its lateral variation. In the phase velocity inversion results of this period range, the middle north (NM39, NM35 and NM36) and west regions (NM28, NM01 and NM02) of the study area show low velocity anomalies, especially in the middle north regions in Figure 5. In the southeast of the study area (east of NM37, NM38 and NM40), the large-scale low velocity anomaly displayed at 10 s period began to disappear at 20 s period.
The phase velocity distribution of Rayleigh-wave with medium period (30–40 s) is mainly sensitive to the S-wave velocity structure and its lateral variation within the depth range of 40–60 km in Figure 6. In the Figure 5, the phase-velocity distribution of medium period shows that the obvious low velocity anomaly in the southeast (east of NM37, NM38 and NM40) during the 10 s period has completely disappeared in the 30–40 s period, which even turns into a high velocity anomaly (>4.2 km s−1). However, the regions of NM17, NM18 and BAC stations in the south central part show obvious low velocity anomalies (<3.6 km s−1). In addition, the range of low velocity anomaly in the north central part of the study area (NM39, NM35, NM36) is expanded to NM26, NM24, NM23 and NM13 stations in the west and AB01, AB03 and AB04 stations in the east during the 30 s period. However, the low velocity anomaly disappears gradually during the 40 s period.
The phase velocity distribution of Rayleigh-wave with medium and long periods (50–80 s) mainly reflects the velocity structure of the upper mantle and its lateral changes in Figure 6. The low velocity anomaly of NM39, NM23, NM35 stations in the north central part and the area close to Honggeertu volcano in the south when the period is less than 50 s has obviously high velocity anomaly at the 50 s period, and the anomaly value is greater than 4.2 km s−1. After reaching 60 s period, the high velocity anomaly in the north central part (NM39, NM23 and NM35) reverts to low velocity, after reaching the 70–80 s period, this low velocity anomaly range expands and extends southward to the middle and south (NM17, NM18 and BAC). In addition, the area near NM37 and AB05 stations during the 60 s period shows a high velocity anomaly (>4.2 km s−1). The location of this anomaly, together with the location of the high velocity anomaly in the north central part during the 50 s period, is within the distribution range of the Abaga volcanic group in Figure 5.
3.2 1-D S-wave velocity results
On the basis of obtaining the phase velocity distribution of each grid in the study area, the linear inversion method of Herrmann and Ammon (2004) was used to carry out 1-D S-wave velocity structure inversion for each grid of 0.5°×0.5°. 1-D layered isotropic model was used as the initial model for inversion. Based on CRUST1.0 (Laske et al., 2013), the initial crustal model used the results of the P-wave receiver function (He et al., 2018) to constrain the crustal thickness, that is, the thickness of each layer of the crust was enlarged or reduced according to the original proportion, so that the crustal thickness of the initial model could achieve the results of the P-wave receiver function. The mantle model adopted the PREM model (Dziewonski and Anderson, 1981), in which the depth of 35–50 km was divided into three layers, with 5 km for each layer; and 10 km for each layer below 50 km depth. In this paper, the linearized inversion algorithm was used to fit the theoretical dispersion and the measured dispersion through 30 iterations. The fitting is shown in Figure 7. It can be seen that the theoretical dispersion curve calculated by the final inversion model has good agreement with the measured discrete dispersion points, which indicates reliable inversion results.
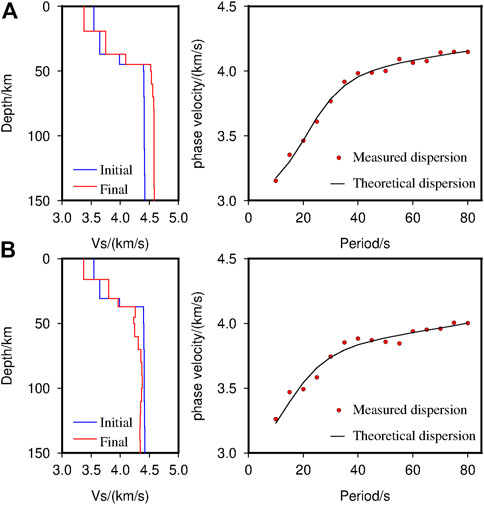
FIGURE 7. 1-D velocity structure inversion results of two grids (A) (113.0°E, 43.0°N) and (B) (115.5°E, 44.5 °N) in the study area. The left figures show the initial velocity model (blue) and the final inversion model (red). The right figures show the measured discrete dispersion points (red dots) and the theoretical dispersion curves calculated by the final model.
3.3 3-D S-wave velocity results
In this paper, the 3-D S-wave velocity structure in the study area was obtained by linear interpolation of 1-D S-wave velocity in Figure 8. It can be seen from Figure 6 and Figure 8 that the S-wave velocity anomaly at different depths has a good correspondence with the phase-velocity anomaly of the corresponding sensitive period.
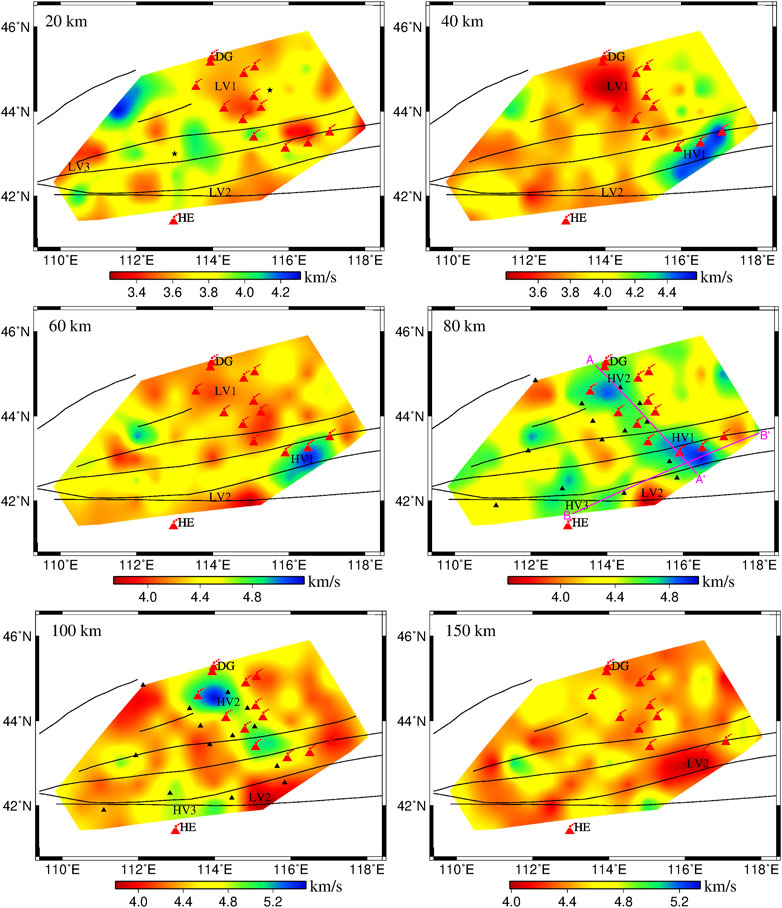
FIGURE 8. S-wave velocity profiles at different depths in the study region. On 80 km and 100 km depth profile, black triangles represent XKS invalid split result (Qiang and Wu, 2019). On 80 km depth profile, the pink straight line represents the position of profiles AA ‘and BB’. The red triangles are the locations of the volcanoes, in which DG is the Dariganga volcano, HE is the Honggeertu volcano, and the rest red triangles are the Abaga volcano group. The black five-pointed stars on 20 km depth profile are the specific locations of the two grid points used in Figure 7.
The 20 km horizontal slice shows that the distribution area of Abaga volcanic group (NM35, NM36, NM39, AB01, AB03, AB04 and the area east of NM37), the area near Honggeertu volcano (NM06, NM08, NM07 and NM17) and the area near South Gobi (NM28、NM01 and NM02) all depict obvious low velocity anomalies LV1, LV2 and LV3, while the S-wave velocity is less than 3.3 km s−1. And the northwest of the study area (to the west of NM24, NM25 and NM26) implies obvious high velocity anomaly, with S-wave velocity greater than 4.2 km s−1.
The 40 km horizontal slice shows that most areas in the southwest have a wide range of low velocity anomaly, with significant low velocity anomaly LV1 in the distribution area of the Abaga volcanic group and the low velocity anomaly LV2 in the near Honggeertu volcano area, bringing the anomaly amplitude less than 3.6 km s−1. In contrast, the northeast (east of AB06, AB07, AB08 and AB09) gradually shows a high velocity anomaly, and the southeast (east of NM38 and NM40) shows a high velocity anomaly HV1 with amplitude greater than 4.4 km s−1. In addition, the low velocity anomaly is displayed at the depth of 20 km at NM38 and 40 km at NM35, which is in good agreement with the result of the CCP profile obtained by the receiver function method, that is, there are obvious negative amplitude anomalies near the depth of 30 km at NM35 and 15 km at NM38 in Abaga volcanic area (He et al., 2018). This also shows that the inversion results in this paper have certain reliability.
The 60 km horizontal slice shows that the distribution area of the Abaga volcanic group has an obvious low velocity anomaly LV1, and the amplitude of the anomaly is less than 4.0 km s−1. However, the large-scale low velocity anomaly gradually disappears in most areas in the southwest, leaving obvious low velocity anomaly LV2 in the near Hungergatu volcanic area (NM07, NM17 and BAC), with the anomaly amplitude less than 3.9 km s−1. Moreover, the significant high velocity anomaly HV1 in the southeast (east of NM38 and NM40) has amplitude greater than 4.8 km s−1. In addition, the low velocity anomaly LV1 significantly existing in the depth range of 20–60 km obtained by inversion in this paper is similar to the 3.1–8.7% low velocity anomaly of shear-wave found by Liu et al. (2017) within 15–70 km in the Abaga volcanic area. With the increase of depth, the velocity anomaly in the study area reverses locally, that is, the low velocity anomaly LV1 in the depth of 20 km–60 km changes into the high velocity structure HV2 in the depth of 80–100 km in the distribution area of the Abaga volcano group, which is connected with the high velocity anomaly HV1 in the southeast of the study area at a depth of about 80 km, thus forming a strip high velocity anomaly that runs through the whole study area from northwest to southeast. However, the distribution range of low velocity anomaly LV2 within the depth range of 20–60 km near Honggeertu volcano area gradually moves eastward, and small-scale high velocity structure HV3 has appeared near NM07 and NM17 stations.
Figure 9 shows the two profiles selected in this paper, and their positions are shown in Figures 1, 4, and 8. Profile AA’ starts from Dariganga Volcano in the north, crosses the distribution area of Abaga Volcano Group and Suolun suture zone from northwest to southeast, then connects two high velocity anomalies HV1 and HV2 within the distribution range of Abaga Volcano Group. Profile BB’ intersects profile AA’ at a large angle by passing through the low velocity anomaly LV2 connected between the southernmost end of the Abaga volcano group and Honggeertu volcano, then connecting the high velocity anomaly HV1 at the southeast end of the study area with the high velocity anomaly HV3 near Honggeertu volcano. These two profiles are used to focus on the S-wave velocity changes near Dariganga volcano, Abaga volcanic group, Soren suture zone and Honggeertu volcano, as well as the distribution range of multiple high velocity anomalies in the upper mantle. Figure 9 shows that there are several high velocity anomaly structures HV1, HV2 and HV3 in the upper mantle of the study area, with anomaly amplitude of about 4.8–5.2 km s−1. These high velocity anomalies are located in different depth ranges, among which HV1 is the shallowest, extending to the Moho and down to the depth of 80–90 km. Facing same depth ranges of the high velocity anomaly HV2 and HV3 at about 70–150 km, they have different horizontal scales. Profile AA’, 80 km and 100 km horizontal slices show that the high velocity anomaly HV2 is distributed horizontally from 43.2°N to 45.2°N in a northwest to southeast direction, while Profile BB’, 80 km and 100 km horizontal slices show that the high velocity anomaly HV3 is distributed in a cluster from 112°E to 114.5°E. There are obvious low velocity anomalies above the high velocity anomaly structures HV1, HV2 and HV3. Profile BB’ shows that the low velocity anomaly LV2 between the high velocity anomaly HV1 and HV3 has the trend of upward extension in SWW direction, which can extend down to the depth of about 150 km in the area of 115°E∼117.5°E, then up to the lower crust boundary in the area of 113°E∼114°E. The upward pointing position of LV2 is located near Honggeertu volcano in the south of the study area, suggesting that LV2 may represent the ascending asthenosphere thermal material.
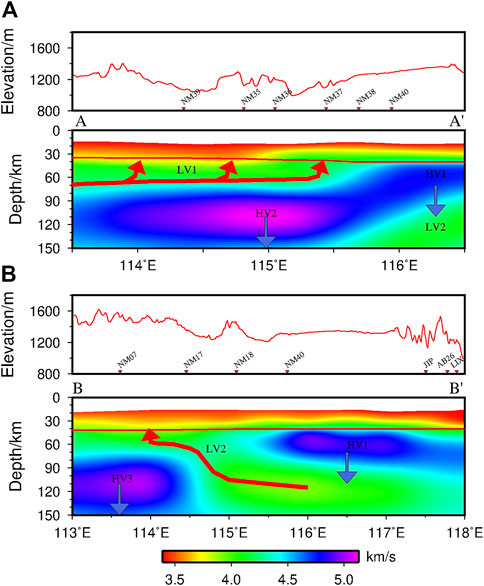
FIGURE 9. Terrain Elevation and S-velocity map plotted along the Profile AA’ and BB' (A, B). The positions of the profiles are shown in Figures 1, 4, and 8. The red curve in the S-wave velocity profile is Moho surface (He et al., 2018). The blue and red arrows represent the direction of lithospheric delamination and hot material upwelling respectively. The long period surface-wave datap have poor resolution on the velocity structure of the shallow crust and the shallow surface. Therefore, the inversion results of the first layer depth range of CRUST1.0 model at each node in the profile are removed without further discussion.
4 Discussion
4.1 Characteristics of S-wave velocity structure in crust
At the depth of 20 km, from the perspective of terrain and surface, it is found that there are a large number of Cenozoic basalt exposed in the central north to southeast (Guo et al., 2016), while the distribution range of low velocity anomaly LV1 in this area is highly coincident with the surface exposure position of the Abaga volcanic group; the western part is the vast South Gobi Desert, which is rich in sediment; the range of low velocity anomaly LV2 in the south central part is close to the distribution range of Honggeertu volcano. The analysis suggests that the low velocity anomaly LV1 and LV2 in the study area may be related to the Cenozoic volcanic exposure in the area, while the low velocity anomaly LV3 may be related to the thickness of the sedimentary layer below the area. In addition, the high-velocity anomaly distribution area in the northwest (to the west of NM24, NM25 and NM26 stations) is characterized by high Vp/Vs ratio value in previous receiver function research results, for example, the Vp/Vs ratio values of NM03 and NM25 stations in the NM array are 1.87 and 1.83 respectively (He et al., 2018), and the Vp/Vs ratio values of L11 and L12 in the China Mongolia joint array are 1.77 and 1.79 respectively (He et al., 2014). In general, the average crustal Vp/Vs ratio value is mainly related to its composition, age, water content and other factors, which is more sensitive to the content of SiO2, specifically, low SiO2 content means abundant mafic composition with the decrease of the Vp/Vs ratio value (Zandt and Ammon, 1995; Christensen, 1996; Lowry and Pérez-Gussinyé, 2011). On the contrary, high SiO2 content implies felsic composition with the increase of he Vp/Vs ratio value accordingly (Tarkov and Vavakin, 1982). There are two ways to increase the average crustal Vp/Vs ratio value, one is caused by the intrusion of mafic mantle material into the crust, such as Changbaishan volcano and Datong volcano (Zhang et al., 2013; Gao and Li, 2014), and the other is caused by partial melting (Watanabe, 1993). According to the analysis, the high velocity anomaly in the northwest may be a reflection of the residual mafic material in the crust. Previous scholars have also interpreted a large-scale high velocity anomaly in the middle and lower crust in the Sayan-Baikal fold belt similarly (Nielsen and Thybo, 2009). To sum up, the distribution characteristics of S-wave velocity in the middle and upper crust may be jointly controlled by many factors, i.e., Cenozoic volcanic exposure, thickness of sedimentary layer and content of mafic material.
In addition, near the depth of 40 km, the S-wave velocity in the southeast shows an obvious high velocity anomaly HV1, while the crustal thickness in this area is relatively thin at about 40 km, bringing low Vp/Vs ratio value at about 1.73, which is obviously lower than the global continental average value of 1.78 (He et al., 2018). Previous studies have shown that the global granitoid bedrock regions are characterized by low Vp/Vs ratio values, such as Idaho region and the Sierra Nevada (Lowry and Pérez-Gussinyé, 2011). Since Paleozoic and Mesozoic granites are widely distributed in the study area (Wu et al., 2003a; Wu et al., 2003b; Tong et al., 2010), and the southeast of the study area generally corresponds to the late Mesozoic granite distribution area to the east of Xilinhot and the north of Xilamulun fault. It is believed that the late Mesozoic granites in this area may be similar to other Mesozoic granites in North China in origin, which are all caused by lithospheric delamination in the late orogenic period and large-scale extension in Northeast Asia (Tong et al., 2010). The analysis shows that the crustal thickening in the early stage of orogeny, the high velocity anomaly HV1 at a depth of 40 km in the southeast, may be a reflection of the stratification of the lower crust at the crust-mantle boundary; in the later stage of the orogeny, due to the gravity instability, the delaminated and stripped mafic material in the lower crust may lead to the crustal thickness thinning, followed by the activity of granite magma, bringing the evolution of the overall composition of the lower crust to felsic (Guo et al., 2015), and finally to the decline of the Vp/Vs ratio value. This inference is also basically consistent with the conclusion obtained by Tang et al. (2022), that is the Triassic magmatism in the southwest of Songliao Basin has experienced a transition from crustal thickening to delamination or lithospheric dripping due to the closure of the ancient Asian Ocean. In conclusion, the distribution characteristics of S-wave velocity in the lower crust may be jointly affected by the thickness of the crust, the underplating of the upper mantle and the delamination of the lower crust.
4.2 The origin of the Abaga volcanic group
Figures 8, 9 show that there are many high velocity anomalies HV1, HV2 and HV3 within the depth range of 40–150 km in the upper mantle of the Abaga volcanic area, with there are obvious low velocity anomalies above these high velocity anomaly structures. Generally, the high velocity structure represents low temperature and hard material such as subducted plate or lithosphere, with the low velocity structure represents the high temperature and soft material such as the asthenosphere thermal material or magma. The 80 km and 100 km depth slices in Figure 8 show that in the upper mantle anisotropy results obtained from the XKS splitting of the NM array in the same period, only pure ineffective splitting could be observed in the Abaga volcanic area, without effective splitting (Qiang and Wu, 2019), suggesting that there is lithospheric delamination or vertical movement of mantle thermal material in this area (Walker et al., 2005; Long et al., 2010). Therefore, we speculate that the high velocity anomaly HV2 within the depth range of 80–140 km in this area is the delaminated lithospheric material. In general, delamination will cause volcanic activity, with basalt exposed on the surface, such as the Qinghai Tibet Plateau (Bird, 1978), the Colorado Plateau (Bird, 1979) and the Nuomin River volcanoes in Northeast China (Hou et al., 2022). Cenozoic basalt (Guo et al., 2016) is widely exposed in the distribution area of Agaba volcanic group, whose exposure range is highly corresponding to the distribution range of the upper mantle delamination in this paper, thus providing petrological evidence for the lithospheric delamination in the study area.
The delamination of lithosphere can also cause the asthenosphere upwelling and the crust thinning (Nelson, 1992; Guo et al., 2016). In this study area, the crust of the Abaga volcanic area is significantly thinner (He et al., 2018). According to previous P-wave tomography, South Gobi in the southwest of the study area shows a large range of high velocity anomaly at a shallow depth of 200 km, and the high velocity anomaly has a tendency to extend to the Abaga area (Zhang et al., 2014), while the S-wave tomography reveals that the Abaga volcanic area shows an obvious low velocity anomaly LV1 within the depth range of 40–70 km, thus indicating that there may be partial melting in the Abaga volcanic area within this depth range. The AA’ profile in Figure 9 also shows that there is a low velocity anomaly LV1 above the high velocity anomaly HV2 of the upper mantle in the Abaga volcanic area. Its distribution direction is the same as that of the Abaga volcanic group on the surface, that is NW-SE. Moreover, it crosses the boundary in the northwest direction, and extends to the south central Mongolia; then extends southeast to the crustal thinning area and the exposed position of the Abaga volcanic group on the surface. Furthermore, it speculates that the low velocity anomaly LV1 may be an upwelling asthenosphere, which is also mutually supported by the above inference that there may be basic magma underplating in the lower crust of the Abaga volcanic area.
The existing tomography research results show that the low velocity anomaly in the Gobi Desert in central and southern Mongolia may have the same heat source as the Dariganga volcano connected to the north of the Abaga volcanic group (Zhang et al., 2014). The geochemical results show that the age of Abaga volcanic group and Cenozoic basalt is gradually younger from northwest to southeast (Ho et al., 2008), while the Cenozoic basalt in the whole NCC-Mongolia-Baikal Lake area has similar geochemical properties (Barry and Kent, 1998), which suggests that Abaga volcanic group, Dariganga volcano and South Gobi of Mongolia have the same magma source. Considering that the flow direction of the asthenosphere thermal material LV1 is from northwest to southeast, this paper speculates that the magma source of the Abaga volcanic group is from the direction of the Mongolian plateau, that is, the large-scale lithospheric delamination in the study area provides a channel for the Mongolian plateau to transport mantle magma to the Abaga region in Inner Mongolia, then large-scale Cenozoic basalt magma flows up to the crust-mantle boundary along the NW-SE trend, bringing underplating in the lower crust. Finally, the magma rises to the surface by forming a large-scale volcanic eruption from northwest to southeast in the Abaga volcanic area.
4.3 The origin of honggeertu volcano
The 100 km and 150 km horizontal slices in Figure 8 show that most of the western part between South Gobi and Honggeertu volcano has large-scale low velocity anomaly. Although having limited inversion depth of the surface-wave method, it cannot obtain a deeper S-wave velocity structure, while the location of this low velocity anomaly is roughly the same as that of the large-scale low velocity anomaly found by Li et al. (2006); Li and Van der Hilst. (2010) in East Asia. Their research shows that the low velocity anomaly can be traced continuously to the lower mantle from a depth range of about 100 km, which seems to be a unified whole with the low velocity anomaly under the Datong volcano 200 km south of Honggeertu in the upper mantle (Li et al., 2006; Li and Van der Hilst. 2010). On a larger scale, the southern part is close to the Ordos block (Figure 1). The results of previous studies show that the Ordos block is a high velocity anomaly within the depth range of 100–150 km (Huang and Zhao, 2006; Li et al., 2006; Tian et al., 2009; Obrebski et al., 2012), thus forming a clear contrast with the large-scale low velocity anomaly in the western part. In addition, body-wave imaging shows that the low velocity anomaly beneath the Datong volcano tends to extend westward (Ding et al., 2009; Tian et al., 2009; Lei, 2012). Therefore, the inversion results in this paper still do not rule out the conclusion obtained by using the NM array data previously (Hou et al., 2019), that is, the low velocity anomaly under South Gobi of the Mongolian Plateau and the deep material of Honggeertu volcano and even Datong volcano may have connectivity or interaction, or both may come from the upwelling of the same thermal region.
In addition, the profile BB’ in Figure 9 shows that there is a low velocity anomaly LV2 above the high velocity anomaly HV3 of the upper mantle in the Honggeertu volcanic area, which extends up to the exposed position on the surface, then extends down to the asthenosphere below the high velocity anomaly HV1 in the southeast of the study area, indicating that LV2 may represent the asthenosphere thermal material upwelling of small-scale mantle convection. It can be seen from the profile AA’ that the low velocity anomaly LV2 is not horizontally connected with the asthenosphere thermal material LV1 under the Abaga volcanic group, suggesting that the magma source of LV2 is not from the Mongolian Plateau as LV1. This paper speculates that its genesis may be the lithospheric delamination of Songliao Basin, which has formed secondary local mantle material upwelling in the southern area of Abaga volcanic group (Guo et al., 2016), and supplied Honggeertu volcano along the NEE-SWW direction through the low velocity channel formed by lithospheric delamination HV1 and HV3. To sum up, on the basis of including that Honggeertu volcano and the south Gobi in the Mongolian plateau may have the same magma source in the depth, there may also be other local heat sources, that is, local mantle material upwelling formed by the lithospheric delamination of the Songliao Basin.
5 Conclusion
In this paper, the vertical continuous data recorded by 36 and 25 broadband mobile seismic stations in Abaga Volcanic Group from October 2012 to May 2015 (NM array) and October 2017 to October 2018 (AB array) are used together for the first time. Then, 15,157 high-quality fundamental Rayleigh-wave phase velocity dispersion curves are extracted by using the frequency-time analysis (Wu et al., 2009) based on continuous wavelet transform. The 2-D linear inversion method (Ditmar and Yanovskaya, 1987; Yanovskaya and Ditmar, 1990) is adopted to reveal the Rayleigh-wave phase velocity distribution of 10–80 s period with the resolution of 0.5°×0.5° in study area. Finally, the 3-D S-wave velocity structure of the crust and upper mantle in the Abaga volcanic area of Inner Mongolia is obtained by using the surface-wave tomography method. The S -wave velocity anomaly results show that:
(1) There is a high velocity abnormal structure in the depth range of 80–140 km below the Abaga volcanic group, with significant low velocity abnormal structure above the high velocity anomaly. This abnormal structure reflects that lithospheric delamination may have occurred in the Abaga volcanic area, which speculates that the low velocity anomaly may reflect the upwelling asthenosphere.
(2) The low velocity anomaly of the crust and upper mantle of the Abaga volcanic group extends along the NW-SE direction, crosses the boundary to the northwest, and extends to the South Gobi of the Mongolian Plateau; it extends southeast to the crustal thinning area of the study area and the exposed position of the Abaga volcanic group on the surface. According to the analysis of previous research results, this low velocity anomaly may have the same magma source as South Gobi in Mongolia Plateau.
(3) Within the depth range of 100–150 km, most areas in the western part show large-scale low velocity anomaly, with low velocity anomaly connected up and down on the east side of Honggeertu volcano. This low velocity anomaly connects the asthenosphere and the exposed position of Honggeertu volcano on the surface, indicating that there may be a NEE-SWW upwelling channel at this position. It is not ruled out that Honggeertu volcano may have the same magma source as South Gobi in the Mongolian Plateau in the depth, since there may also be other local heat sources, that is, secondary mantle material upwelling from the lithosphere of Songliao Basin.
Data availability statement
The raw data supporting the conclusions of this article will be made available by the authors, without undue reservation.
Author contributions
All persons who meet authorship criteria are listed as authors, and all authors certify that they have participated sufficiently in the work to take public responsibility for the content, including participation in the concept, design, analysis, writing, or revision of the manuscript. Furthermore, each author certifies that this material or similar material has not been and will not be submitted to or published in any other publication before its appearance in the Frontiers.
Funding
This study is supported by National Natural Science Foundation of China (Nos. 41274088 and 41504073).
Acknowledgments
We thank everyone who participated in the selection, erection, and maintenance of the stations. Some of the figures in this paper were drawn using the GMT program (Wessel and Smith, 1998).
Conflict of interest
The authors declare that the research was conducted in the absence of any commercial or financial relationships that could be construed as a potential conflict of interest.
Publisher’s note
All claims expressed in this article are solely those of the authors and do not necessarily represent those of their affiliated organizations, or those of the publisher, the editors and the reviewers. Any product that may be evaluated in this article, or claim that may be made by its manufacturer, is not guaranteed or endorsed by the publisher.
References
Badarch, G., Cunningham, W. D., and Windley, B. F. (2002). A new terrane subdivision for Mongolia: Implications for the phanerozoic crustal growth of central Asia. J. Asian Earth Sci. 21 (1), 87–110. doi:10.1016/s1367-9120(02)00017-2
Bai, Z. D., Tan, Q. W., and Xu, G. L. (2012). Late Quaternary volcanic activity and neotectonics in the eastern Inner Mongolia. Acta Petrol. Sin. 28 (4), 1099–1107.
Barry, T. L., and Kent, R. W. (1998). “Cenozoic magmatism in Mongolia and the origin of central and east Asian basalts,” in Mantle dynamics and plate interactions in East Asia. Editor M. F. J. Flower (AGU Geodynamics Series), 347–364.
Barry, T. L., Saunders, A. D., and Kemptom, P. D. (2003). Petrogenesis of Cenozoic Basalts from Mongolia: Evidence for the role of asthenospheric versus metasomatized lithospheric mantle sources. J. Petrology 44 (1), 55–91. doi:10.1093/petrology/44.1.55
Bird, P. (1979). Continental delamination and the Colorado pateau. J. Geophys. Res. Solid Earth 84 (B13), 7516–7571.
Bird, P. (1978). Initiation of intracontinental subduction in the Himalaya. J. Geophys. Res. Solid Earth 83 (B10), 4975–4987. doi:10.1029/jb083ib10p04975
Chen, L., Cheng, C., and Wei, Z. G. (2009). Seismic evidence for significant lateral variations in lithospheric thickness beneath the central and Western North China Craton. Sci. Lett. 286, 171–183. doi:10.1016/j.epsl.2009.06.022
Chen, L. (2010). Concordant structural variations from the surface to the base of the upper mantle in the North China Craton and its tectonic implications. Lithos 120, 96–115. doi:10.1016/j.lithos.2009.12.007
Christensen, N. I. (1996). Poisson’s ratio and crustal seismology. J. Geophys. Res. 101 (B2), 3139–3156. doi:10.1029/95jb03446
Chung, S. L., Sun, S. S., Tu, K., Chen, C. H., and Lee, C. Y. (1994). Late Cenozoic basaltic volcanism around the Taiwan Strait, SE China: Product of lithosphere-asthenosphere interaction during continental extension. Chem. Geo 112, 1–20. doi:10.1016/0009-2541(94)90101-5
Deng, J. F., Mo, X. X., and Zhao, H. L. (2004). A new model for the dynamic evolution of Chinese lithosphere: Continental root-plume tectonics. Earth-Science Rev. 65 (3-4), 233–275.
Ding, Z. F., Zhou, X. F., Wu, Y., Li, G., and Zhang, H. (2009). Tomographic imaging of P wave velocity structure beneath the region around Beijing. Earthq. Sci. 22 (4), 403–408. doi:10.1007/s11589-009-0403-9
Ditmar, P. G., and Yanovskaya, T. B. (1987). A Generalization of the Backus-Gilbert method for estimation of lateral variations of surface wave velocities. Phys. Solid Earth. Izv. Acad. Sci. U.S.S.R. 3 (6), 470–477.
Du, W., Han, B. F., and Zhang, W. H. (2006). The discovery of peridotite xenoliths and megacrysts in Jining, Inner Mongolia. Acta Petrologica mineralogica 25 (1), 13–24.
Faure, M., and Natal’ln, B. A. (1992). The geodynamic evolution of the eastern Eurasian margin in Mesozoic times. Tectonophysics 208, 397–411. doi:10.1016/0040-1951(92)90437-b
Gao, Y. G., and Li, Y. H. (2014). Crustal thickness and Vp/Vs in the Northeast China-North China region and its geological implication. Chin. J. Geophys. 57 (3), 847–857. doi:10.6038/cjg20140314
Gong, C., Li, Q. S., and Ye, Z. (2016). Crustal thickness and Poisson ratio beneath the Huailai-Bayinonder profile dericed from teleseismic receiver functions. Chin. J. Geophys. 59 (3), 897–911. doi:10.6038/cjg20160312
Guo, P. Y., Niu, Y. L., Sun, P., Ye, L., Liu, J., Zhang, Y., et al. (2016a). The origin of Cenozoic basalts from central Inner Mongolia, East China: The consequence of recent mantle metasomatism genetically associated with seismically observed Paleo-Pacific slab in the mantle transition zone. Lithos 240-243, 104–118. doi:10.1016/j.lithos.2015.11.010
Guo, Z., Chen, Y. J., Ning, J. Y., Feng, Y., Grand, S. P., Niu, F., et al. (2015). High resolution 3-D crustal structure beneath NE China from joint inversion of ambient noise and receiver functions using NECESSArray data. Earth and Planetary Science Letters 416, 1–11. doi:10.1016/j.epsl.2015.01.044
Guo, Z., Chen, Y. J., Ning, J. Y., Yang, Y., Afonso, J. C., and Tang, Y. (2016b). Seismic evidence of on-going sublithosphere upper mantle convection for intra-plate volcanism in Northeast China. Earth and Planetary Science Letters 433, 31–43. doi:10.1016/j.epsl.2015.09.035
He, J., Sandvol, E., Wu, Q. J., Gao, M., Gallegos, A., Ulziibat, M., et al. (2017). Attenuation of regional seismic phases(Lg and Sn) in Eastern Mongolia. Geophysical Journal International 211 (2), 979–989. doi:10.1093/gji/ggx349
He, J., Wu, Q. J., and Gao, M. T. (2014). Crustal structure and Poisson ratio beneath the central and southern Mongolia derived from receiver functions[J]. Chinese J. Geophys. 57 (7), 2386–2394.
He, J., Wu, Q. J., Sandvol, E., Ni, J., Gallegos, A., Gao, M., et al. (2016). The crustal structure of south central Mongolia using receiver functions. Tectonics 35 (6), 1392–1403. doi:10.1002/2015tc004027
He, J., Wu, Q. J., and Zhang, R. Q. (2018). Crustal structure beneath the Abaga area of Xing’an-Mongolia Orogenic Belt using teleseismic receiver functions. Chinese J. Geophys. 61 (9), 3676–3688. doi:10.6038/cjg2018M0013
Herrmann, R. B., and Ammon, C. J. (2004). “Surface waves, receiver functions and crustal structure,” in Computer programs in seismology (Saint Louis University). Avaliable At: http://www.was.slu/People/RBHerrmann/CPS330.html.
Ho, K. S., Liu, Y., Chen, J. C., and Yang, H. J. (2008). Elemental and Sr-Nd-Pb isotopic compositions of late Cenozoic Abaga basalts, Inner Mongolia: Implications for petrogenesis and mantle process. Geochemical Journal 42 (4), 339–357. doi:10.2343/geochemj.42.339
Hou, J., Wu, Q. J., and Yu, D. X. (2022). Study on surface wave phase velocity tomography beneath the Nuomin River volcanoes in Northeast China. Chinese J. Geophys. 65 (6), 2090–2160. doi:10.6038/cjg2022P0287
Hou, J., Wu, Q. J., Yu, D. X., and Ye, Q. D. (2019). Crustal and upper mantle structure beneath Abaga area in Inner Mongolia revealed by Rayleigh-wave phase velocity tomography. Earthquake Science 32, 207–220. doi:10.29382/eqs-2019-0207-03
Hou, J., Yu, D. X., and Wu, Q. J. (2017). Preliminary study of S wave velocity structure of the crust and upper mantle beneath the south-central Mongolia. Progress in Geophysica 32 (4), 1432–1438.
Huang, J. L., and Zhao, D. P. (2006). High-resolution mantle tomography of China and surrounding regions. Journal of Geophysical Research 111 (B9), B09305. doi:10.1029/2005JB004066
Huang, J. X., Zhao, Z. D., and Zhang, H. F. (2006). Elemental and Sr-Nd-Pb isotopic geochemistry of the Wenduermiao and Bayanaobao-Jiaoqier ophiolites, Inner Mongolia: Constraints for the characteristics of the mantle domain of eastern Paleo-Asian Ocean. Acta Petrologica Sinica(in Chinese) 22 (12), 2889–2900.
Jahn, B. M., Wu, F. Y., and Chen, B. (2000). Massive granitoid generation in central Asia: Nd isotope evidence and implication for continental growth in the phanerozoic. Episodes 23 (2), 82–92. doi:10.18814/epiiugs/2000/v23i2/001
Jahn, B. M. (2004). “The central Asian orogenic belt and growth of the continental crust in the phanerozoic,” in Aspects of the tectonic evolution of China. Editors J. Malpas, C. J. N. Fletcher, and J. R. Ali (London: Geological Society of London), 73–100.
Ji, S. C., Wang, Q., and Yang, W. C. (2009). Correlation between crustal thickness and Poisson’s ratio in the North China craton and its implication for lithospheric thinning. Acta Geologica Sinica 83 (3), 324–330.
Kröner, A., Windley, B. F., and Badarch, G. (2007). “Accretionary growth and crust formation in the central asian orogenic belt and comparison with the arabian-nubian shield,” in 4-D framework of continental crust. Editors R. D. HatcherJr, M. P. Carlson, and J. H. McBride (Boulder, CO: Geological Society of America Memoir), 181–209.
Lei, J. S., and Zhao, D. P. (2006). Global P-wave tomography: On the effect of various mantle and core phases. Physics of the Earth and Planetary Interiors 154 (1), 44–69. doi:10.1016/j.pepi.2005.09.001
Lei, J. S., and Zhao, D. P. (2005). P-wave tomography and origin of the Changbai intraplate volcano in Northeast Asia. Tectonophysics 397 (3-4), 281–295. doi:10.1016/j.tecto.2004.12.009
Lei, J. S. (2012). Upper-mantle tomography and dynamics beneath the North China craton. Journal of Geophysical Research 117 (B6), B06313. doi:10.1029/2012JB009212
Li, C., and Van der Hilst, R. D. (2010). Structure of the upper mantle and transition zone beneath Southeast Asia from traveltime tomography. Journal of Geophysical Research 115 (B7), B07308. doi:10.1029/2009JB006882
Li, C., Van der Hilst, R. D., and Toksoz, M. N. (2006). Constraining P-wave velocity variations in the upper mantle beneath Southeast Asia. Physics of the Earth and Planetary Interiors 154 (2), 180–195. doi:10.1016/j.pepi.2005.09.008
Liu, Y. N., Niu, F. L., Chen, M., and Yang, W. (2017). 3-D crustal and uppermost mantle structure beneath NE China revealed by ambient noise adjoint tomography. Earth and Planetary Science Letters 461, 20–29. doi:10.1016/j.epsl.2016.12.029
Long, M. D., Benoit, M. H., and Chapman, M. C. (2010). Upper mantle anisotripy and transition zone thickness beneath southeastern North America and implications for mantle dynamics. Geochemistry, Geophysics, Geosystems 11 (10), Q10012. doi:10.1029/2020GC003247
Lowry, A. R., and Pérez-Gussinyé, M. (2011). The role of crustal quartz in controlling Cordilleran deformation. Nature 471 (7338), 353–357. doi:10.1038/nature09912
Meng, Q. R. (2003). What drove late Mesozoic extension of the northern China-Monogolia tract? Tectonophysics 369 (3-4), 155–174. doi:10.1016/S0040-1951(03)00195-1
Nelson, K. D. (1992). Are crustal thickness variation in old mountain belts like the Appalachians a consequence of lithospheric delamination? Geology 20 (6), 498–502. doi:10.1130/0091-7613(1992)020<0498:actvio>2.3.co;2
Nielsen, C., and Thybo, H. (2009). No Moho uplift below the Baikal rift zone: Evidence from a seismic refraction profile across southern Lake Baikal. J. Geophys. Res. 114 (B8), B08306. doi:10.1029/2008JB005828
Obrebski, M., Allen, R. M., Zhang, F. X., Pan, J., Wu, Q., and Hung, S. H. (2012). Shear wave tomography of China using joint inversion of body and surface wave constraints. Journal of Geophysical Research 117 (B1), B01311. doi:10.1029/2011JB008349
Pan, J. T., Wu, Q. J., and Li, Y. H. (2015). Ambient noise tomography in central-south Mongolia[J]. Chinese J. Geophys. 58 (8), 3009–3022.
Petit, C., Déverchère, J., Calais, E., San’kov, V., and Fairhead, D. (2002). Deep structure and mechanical behavior of the lithosphere in the Hangai-Hövsgöl region, Mongolia: New constraints from gravity modeling. Earth Planet Sci Lett 197 (3-4), 133–149. doi:10.1016/s0012-821x(02)00470-3
Qiang, Z. Y., Wu, Q. J., Li, Y. H., Gao, M., Demberel, S., Ulzibat, M., et al. (2017). Complicated seismic anisotropy beneath south-central Mongolia and its geodynamic implications. Earth and Planetary Science Letters 465, 126–133. doi:10.1016/j.epsl.2017.02.035
Qiang, Z. Y., and Wu, Q. J. (2019). Upper mantle anisotropy beneath Abag area in Mongolia from shear wave splitting. Chinese J. Geophys. 62 (7), 2510–2526. doi:10.6038/cjg2019M0549
Sengör, A. M. C., Natal´in, B. A., and Burtman, V. S. (1993). Evolution of the Altaid tectonic collage and Palaeozoic crustal growth in Eurasia. Nature 364 (6435), 299–307. doi:10.1038/364299a0
Smith, A. D. (1998). “The geodynamic significance of the DUPAL anomaly in Asia,” in Mantle dynamics and plate interactions in East Asia. Editors M. F. J. Floewr, S. L. Chung, and C. H. Lo (Washington D C: American Geophysical Union Monography), 89–105.
Smith, A. D. (2013). “The geodynamic significance of the DUPAL anomaly in Asia,” in Mantle dynamics and plate interactions in East Asia. Editors M. F. J. Flower, S. L. Chung, and C. H. Lo (Washington, DC: American Geophysical Union), 89–105.
Tang, Y. C., Obayashi, M., Niu, F. L., Grand, S. P., Chen, Y. J., Kawakatsu, H., et al. (2014). Changbaishan volcanism in northeast China linked to subduction-induced mantle upwelling. Nature Geosciences 7 (6), 470–475. doi:10.1038/ngeo2166
Tang, Z. Y., Sun, D. Y., and Gou, J. (2022). Triassic magmatism in Northeast China: Implications for spatiotemporal distribution, continental crustal accretion, and geodynamic evolution. International Geology Review 64 (6), 770–798. doi:10.1080/00206814.2021.1881919
Tao, K., Niu, F. L., Ning, J. Y., Chen, Y. J., Grand, S., Kawakatsu, H., et al. (2014). Crustal structure beneath NE China imaged by NECESSArray receiver function data. Earth and Planetary Science Letters 398, 48–57. doi:10.1016/j.epsl.2014.04.043
Tarkov, A. P., and Vacakin, V. V. (1982). Poisson’s ratio behaviour in various crystalline rocks: Application to the study of the earth’s interior. Physics of the Earth and Planetary Interiors 29 (1), 24–29. doi:10.1016/0031-9201(82)90134-0
Tian, Y., Zhao, D. P., Sun, R. M., and Teng, J. (2009). Seismic imaging of the crust and upper mantle beneath the North China Craton. Physics of the Earth and Planetary Interiors 172 (3-4), 169–182. doi:10.1016/j.pepi.2008.09.002
Tiberi, C., Deschamps, A., Déverchère, J., Petit, C., Perrot, J., Appriou, D., et al. (2008). Asthenospheric imprints on the lithosphere in Central Mongolia and Southern Siberia from a joint inversion of gravity and seismology (MOBAL experiment). Geophys J Int 175 (3), 1283–1297. doi:10.1111/j.1365-246x.2008.03947.x
Tong, Y., Hong, D. W., and Wang, T. (2010). Spatial and temporal distribution of granitoids in the middle segment of the sino-Mongolian border and its tectonic and metallogenic implications. Acta Geoscientica Sinica(in Chinese) 31 (3), 395–412.
Walker, K. T., Bokelmann, G. H. R., Klemperer, S. L., and Bock, G. (2005). Shear-wave splitting around the eifel hotspot: Evidence for a mantle upwelling. Geophysical Journal International 163 (3), 962–980. doi:10.1111/j.1365-246X.2005.02636.x
Wang, Q., Gao, Y., and Shi, Y. T. (2013). Seismic anisotropy in the uppermost mantle beneath the northeastern margin of qinghai-tibet plateau: Evidence from shear wave splitting of SKS, PKS and SKKS. Chinese Journal of Geophysics (in Chinese) 56 (3), 892–905. doi:10.6038/cjg20130318
Wang, X. C., Wilde, S. A., Li, Q. L., and Yang, Y. N. (2015). Continental flood basalts derived from the hydrous mantle transition zone. Nature Communications 6, 7700. doi:10.1038/ncomms8700
Wang, Y. M., Griffin, W. L., and Han, B. F. (2011). A preliminary study on the Cenozoic lithospheric mantle beneath the northern part of the Western North China Craton. Acta Petrologica Sinaca 27 (10), 2912–2926.
Watanabe, T. (1993). Effects of water and melt on seismic velocities and their application to characterization of seismic reflectors. Geophys. Res. Lett. 20 (24), 2933–2936. doi:10.1029/93GL03170
Webb, L. E., and Johnson, C. L. (2006). Tertiary strike-slip faulting in southeastern Mongolia and implications for Asian tectonics. Earth and Planetary Science Letters 241 (1-2), 323–335. doi:10.1016/j.epsl.2005.10.033
Wei, W., Hammond, J. O. S., Zhao, D. P., Xu, J., Liu, Q., and Gu, Y. (2019). Seismic evidence for a mantle transition zone origin of the wudalianchi and Halaha volcanoes in Northeast China. Geochemistry, Geophysics, Geosystems 20 (1), 398–416. doi:10.1029/2018GC007663
Wessel, P., and Smith, W. H. F. (1998). New, improved version of generic mapping tools released. Eos, Transactions American Geophysical Union 79 (47), 579. doi:10.1029/98eo00426
Windley, B. F., Alexeiev, D., Xiao, W., Kröner, A., and Badarch, G. (2007). Tectonic models for accretion of the central asian orogenic belt. Journal of the Geological Society 164 (1), 31–47. doi:10.1144/0016-76492006-022
Windley, B. F., and Allen, M. B. (1993). Mongolian plateau: Evidence for a late cenozoic mantle plume under Central Asia. Geology 21 (4), 295–298. doi:10.1130/0091-7613(1993)021<0295:mpefal>2.3.co;2
Wu, F. Y., Jahn, B. M., and Wilde, S. A. (2003a). Highly fractionated I-type granites in NE China (I): Geochronology and petrogenesis. Lithos 66 (3-4), 241–273. doi:10.1016/s0024-4937(02)00222-0
Wu, F. Y., Jahn, B. M., Wilde, S. A., Lo, C. H., Yui, T. F., Lin, Q., et al. (2003b). Highly fractionated I-type granites in NE China (II): Isotopic geochemistry and implications for crustal growth in the phanerozoic. Lithos 67 (3), 191–204. doi:10.1016/s0024-4937(03)00015-x
Wu, Q. J., Zhang, F. X., Pan, J. T., and Zhang, G. (2009). Measurement of interstation phase velocity by wavelet transformation. Earthquake Science 22 (4), 425–429. doi:10.1007/s11589-009-0425-3
Xiao, W. J., Windley, B. F., Badarch, G., Sun, S., Li, J., Qin, K., et al. (2004). Palaeozoic accretionary and convergent tectonics of the southern altaids: Implications for the growth of central Asia. Journal of the Geological Society 161 (3), 339–342. doi:10.1144/0016-764903-165
Xiao, W. J., Windley, B. F., Hao, J., and Zhai, M. (2003). Accretion leading to collision and the Permian Solonker suture, Inner Mongolia, China: Termination of the central Asian orogenic belt. Tectonics 22 (6), 1069. doi:10.1029/2002TC001484
Xu, B., Charvet, J., Chen, Y., Zhao, P., and Shi, G. (2013). Middle paleozoic convergent orogenic belts in Western inner Mongolia (China): Framework, kinematics, geochronology and implications for tectonic evolution of the central asian orogenic belt. Condwana Research 23 (4), 1342–1364. doi:10.1016/j.gr.2012.05.015
Yanovskaya, T. B., and Ditmar, P. G. (1990). Smoothness criteria in surface wave tomography. Geophysical Journal International 102 (1), 63–72. doi:10.1111/j.1365-246x.1990.tb00530.x
Yi, G. X., Yao, H. J., Zhu, J. S., and van der Hilst, R. D. (2008). Rayleigh-wave phase velocity distribution in China continent and its adjacent regions. Chinese J. Geophys. 51 (2), 265–274. doi:10.1002/cjg2.1218
Yu, D. X., Wu, Q. J., and Li, Y. H. (2015). Rayleigh wave tomography of the phase velocity in the central and southern Mongolia. Chinese J. Geophys. 58 (1), 134–142. doi:10.6038/cjg20150111
Yu, D. X., Wu, Q. J., and Wang, P. (2016). Love wave phase velocity tomography in the south-central Mongolia from earthquakes. Acta Seismologica Sinica 38 (1), 41–52. doi:10.11939/jass.2016.01.004
Zandt, G., and Ammom, C. J. (1995). Continental crust composition constrained by measurements of crustal Poisson’s ratio. Nature 374 (6518), 152–154. doi:10.1038/374152a0
Zhang, F. X., Wu, Q. J., Grand, S. P., Li, Y., Gao, M., Demberel, S., et al. (2017). Seismic velocity variations beneath central Monogolia: Evidence for upper mantle plumes? Earth and Planetary Science Letters 459, 406–416. doi:10.1016/j.epsl.2016.11.053
Zhang, F. X., Wu, Q. J., and Li, Y. H. (2014). The P wave velocity structure of the upper mantle beneath the Central and Southern Mongolia area. Chinese J. Geophys. 57 (9), 2790–2801. doi:10.6038/cjg20140906
Zhang, G. C., Wu, Q. J., and Pan, J. T. (2013). Study of crustal structure and Poisson ratio of NE China by H-ĸ stack and CCP stack methods. Chinese Journal of Geophysics (in Chinese) 56 (12), 4084–4094. doi:10.6038/cjg20131213
Zhang, M., Suddaby, P., O’Reilly, S. Y., Norman, M., and Qiu, J. (2000). Nature of the lithospheric mantle beneath the eastern part of the central asian fold belt: Mantle xenolith evidence. Tectonophysics 328, 131–156. doi:10.1016/s0040-1951(00)00181-5
Zhao, D. P., Maruyama, S., and Omori, S. (2007). Mantle dynamics of western pacific and East Asia: Insight from seismic tomography and mineral physics. Gondwana Research 11 (1-2), 120–131. doi:10.1016/j.gr.2006.06.006
Zhao, D. P., Tian, Y., Lei, J. S., Liu, L., and Zheng, S. (2009a). Seismic image and origin of the Changbai intraplate volcano in East Asia: Role of big mantle wedge above the stagnant Pacific slab. Physics of the Earth and Planetary Interiors 173 (3-4), 197–206. doi:10.1016/j.pepi.2008.11.009
Zhao, D. P., Yu, S., and Ohtani, E. (2011). East Asia: Seismotectonics, magmatism and mantle dynamics. Journal of Asian Earth Sciences 40, 689–709. doi:10.1016/j.jseaes.2010.11.013
Zhao, L., Allen, R. M., Zheng, T. Y., and Hung, S. H. (2009b). Reactivation of an archean craton: Constraints from P- and S-wave tomography in North China. Geophyscal Research Letters 36, L17306. doi:10.1029/2009gl039781
Zhao, Y. W., Fan, Q. C., and Bai, Z. D. (2008). Preliminary study on quaternary volcanoes in the halaha river and chaoer river area in daxing’an mountain range. Acta Petrologica Sinica (in Chinese) 24 (11), 2569–2575.
Zhao, Y. W., and Fan, Q. C. (2011). Characteristics of lithopheric mantle beneath the Great Xing’an Range: Evidence from spinel peridotite xenoliths in the Halaha river and Chaoer river area. Acta Petrologica Sinica (in Chinese) 27 (10), 2833–2841.
Zheng, T. Y., Chen, L., Zhao, L., Xu, W., and Zhu, R. (2006). Crust-mantle structure difference across the gravity gradient zone in North China Craton: Seismic image of the thinned continental crust. Physics of the Earth and Planetary Interiors 159 (1-2), 43–58. doi:10.1016/j.pepi.2006.05.004
Zheng, T. Y., Chen, L., Zhao, L., and Zhu, R. (2007). Crustal structure across the Yanshan belt at the northern margin of the North China Craton. Physics of the Earth and Planetary Interiors 161 (1-2), 36–49. doi:10.1016/j.pepi.2007.01.004
Zhou, Y. T., Zheng, J. P., and Yu, C. M. (2010). Peridotite xenoliths in jining cenozoic basalts: Mineral-chemistry and significance for lithospheric mantle evolution beneath the North China craton. Acta Petrologica et mineralogica 29 (3), 243–357.
Zhu, R. X., Chen, L., Wu, F. Y., and Liu, J. (2011). Timing, scale and mechanism of the destruction of the North China Craton. Sci China Earth Sci 54, 789–797. doi:10.1007/s11430-011-4203-4
Keywords: the Abaga volcanic group, volcanic activity, surface-wave tomography, S-wave velocity structure, lithospheric delamination
Citation: Hou J, Wu Q, Yu D, Ye Q and Zhang R (2023) Study on surface-wave tomography in Abaga volcanic area, Inner Mongolia. Front. Earth Sci. 11:1131393. doi: 10.3389/feart.2023.1131393
Received: 25 December 2022; Accepted: 06 February 2023;
Published: 17 February 2023.
Edited by:
Xijun Liu, Guilin University of Technology, ChinaReviewed by:
Guiping Yu, Guilin University of Technology, ChinaYangfan Deng, Guangzhou Institute of Geochemistry, Chinese Academy of Sciences (CAS), China
Copyright © 2023 Hou, Wu, Yu, Ye and Zhang. This is an open-access article distributed under the terms of the Creative Commons Attribution License (CC BY). The use, distribution or reproduction in other forums is permitted, provided the original author(s) and the copyright owner(s) are credited and that the original publication in this journal is cited, in accordance with accepted academic practice. No use, distribution or reproduction is permitted which does not comply with these terms.
*Correspondence: Qingju Wu, d3VxakBjZWEtaWdwLmFjLmNu