 Bailong Li
 Youliang Fang1,2,3*
 Chun Zhu
- 1College of Civil Engineering and Architecture, Hebei University, Baoding, China
- 2Hebei Civil Engineering Monitoring and Evaluation Technology Innovation Center, Baoding, China
- 3Engineering Research Center of Zero-Carbon Energy Buildings and Measurement Techniques, Ministry of Education, Baoding, China
- 4College of Construction Engineering, Jilin University, Changchun, China
- 5School of Earth Sciences and Engineering, Hohai University, Nanjing, China
The dynamics of debris flow impact considering the material source erosion-entrainment process is analyzed using a coupled SPH-DEM-FEM method. A complex coupled dynamic model of a debris flow, the erodible material source, and a rigid barrier is established in this paper. The applicability of the coupled SPH-DEM-FEM method for calculating the impact force of debris flow on the rigid barrier is verified by comparing the model with the laboratory test. The strain softening model is used to simulate the process from solid state to transition state and finally to liquid state of erodible material source. The impact force caused by debris flow considering the source erosion-entrainment process and the dynamic response of a rigid barrier is also analyzed. The results show that the volume of debris fluid, impact force, and dynamic response of a rigid barrier considering source erosion–entrainment are significantly greater than those of the original model. According to the calculation results, the existing formula for the impact force of a debris flow is then modified. The coupled numerical analysis method and the calculated results help to clarify the influence of erosion-entrainment, modify the calculation of the impact force of debris flow, and optimize the design of the rigid barrier.
1 Introduction
Debris flows are widespread in mountainous areas around the world. It is a unique flood caused by rainstorms and earthquakes (Yin et al., 2016). A debris flow typically is high-speed, has a large volume of sediment and water, and is highly destructive. It can produce a tremendous impact on structures along the way (Tang et al., 2012). The initial volume does not always determine the debris flow volume, according to the literature (Hungr et al., 2005; Wang et al., 2021; Lei et al., 2022). In general, debris flows with small initial volumes can rapidly increase by several or even tens of orders of magnitude in volume through source erosion and entrainment processes (Shang et al., 2003; Wang et al., 2003; Zaginaev et al., 2019; Wang et al., 2022). Source erosion and entrainment processes significantly increase the debris flow volume and impact, which should be considered in the dynamic model (Chen et al., 2006; Wang et al., 2020; Guo et al., 2022; Wang et al., 2022; Wang et al., 2023).
Debris flows erosion and entrainment of the material are caused by the high-speed collision between debris flow particles and the fluidization effect on the erodible material source (Federico and Cesali, 2015; Wang et al., 2021). When a debris flow passes through an erodible material source, it erodes if the shear stress on the source body is greater than the strength of the material source (Armanini et al., 2009; Luna et al., 2012). At this point, the erodible material source changes from a solid state to a transition state. Fluidization occurs when the erodible material source is eroded, and entrainment occurs and forms part of the debris flow. At this point, the erodible material source changes from a transition state to a liquid state (Mangeney et al., 2007; Mangeney et al., 2010; Li et al., 2022a). To improve the reliability of the debris flow dynamic model, a complex constitutive model of the erodible material source should be considered (Lee and Jeong, 2018). Research on the impact force of debris flows considering the erosion—entrainment process is performed through theoretical research, laboratory tests, and numerical simulations (Gao et al., 2017; Choi et al., 2021). However, the research and application of complex constitutive model of erosion is limited.
The impact force caused by debris flow causes the barrier to break, so the theoretical calculation of the peak value of debris flow impact force is essential (Scheidl et al., 2013; Thouret et al., 2020). Hydrostatic, hydrodynamic, and hybrid theories are commonly used to calculate the peak impact force (Calvetti et al., 2017; Li S. et al., 2020; Sha et al., 2023). Hydrostatic theory estimates the impact pressure by considering the empirical coefficient k based on static pressure (Armanini, 1997; Proske et al., 2011; Bugnion et al., 2012). Fluid dynamics theory is derived from the momentum conservation equation and is the peak impact pressure theory related to the flow rate change rate and impact pressure (Hungr et al., 1984; Hu et al., 2011; Scheidl et al., 2021). The hybrid theory of debris flow considers both hydrostatics and hydrodynamics theories. By adding or multiplying the two theories, a calculation model suitable for the actual situation in the field can be obtained (Arattano et al., 2003; Huang et al., 2007). However, the theory of debris flow impact force considering erosion is relatively little in the present literature. Moreover, the impact of the impact coefficient of debris flow needs further study (Liu et al., 2020; Roelofs et al., 2022).
Many researchers have conducted laboratory tests on debris flow considering the erosion-entrainment process (Hungr et al., 1984; Mangeney et al., 2010; Lee et al., 2022). Mangeney et al. (2010) conducted laboratory tests on the debris flow erosion-entrainment process to study the influencing factors such as topographic slope, flow distance, and thickness of the erodible layer. The results indicated that the erosion process increases liquidity by almost 40%. Haas et al. (2016) studied the influence of different types of debris flow on the erosion-entrainment process. It was concluded that the average erosion depth increased with increased water content and particle size. Tian et al. (2014) studied the calculation of debris flow resistance during the erosion-entrainment process. The literature shows that fluid resistance on an erodible material source was significantly greater than that of a rigid rock bed. The calculation formula of debris flow resistance considering the erosion-entrainment process was obtained through dimensionless multiple regression analysis. However, there are many factors influencing the laboratory tests of debris flow erosion and the test are relatively expensive (Fuchu et al., 1999).
Many scholars have used numerical methods to study the debris flow impact in the erosion-entrainment process (Peng et al., 2011; Fan et al., 2019; Li X. et al., 2022). Due to the entrainment process of debris flow erosion and the complexity of its interaction with a barrier, the mixed media method has a natural advantage (Liu and He, 2020). Lee et al. (Lee and Jeong, 2018; Jeong and Lee, 2019; Lee et al., 2019) conducted a series of studies on the impact of debris flow and barrier in the erosion-entrainment process by adopting the coupled CEL method. The traditional static impact force model was modified by coupling numerical analysis. Leonardi et al. (Leonardi et al., 2013; Leonardi et al., 2015; Leonardi et al., 2016) used the coupled LBM-DEM to calculate the numerical value of a debris flow. The calculation results provided an essential reference for considering the interaction between debris flow and the barrier in the erosion-entrainment process. The failure mechanism of the barrier was also analyzed. Li et al. (2018) adopted the coupled CFD - DEM to study the interaction between debris flow and the barrier. A debris flow study considering the erosion process was performed. The research results helped to determine the impact force of debris flow. Li et al. (Li B. et al., 2020; Li et al., 2022b) adopted the SPH-DEM-FEM method to study the interaction model of two-phase debris flow and the barrier. The research results were of great significance to the design of the barrier. However, current research focuses on the effect of single-phase flow on erosion. Literature on the effects of two-phase flow on erosion is relatively rare.
In summary, current research on the interaction between debris flow and the barrier in the erosion-entailing process primarily uses laboratory experiments, while coupled numerical analysis methods are rarely used. Coupled SPH-DEM-FEM technology can be well adapted to the simulation and calculation in the complex case of particle-fluid-structure. The coupled SPH-DEM-FEM method cannot only avoid the mesh distortion and analysis failure of two-phase debris flow but also accurately simulates the strain softening model of erodible material source and accurately calculate the barrier (Li et al., 2022b). This technique can be used to construct and calculate the complex coupled dynamic model of debris flow, erodible material source, and rigid barrier.
2 Computational assumptions and construction of coupled numerical model
2.1 Computational assumptions
The following calculation assumptions were made for debris flow and the barrier model considering erosion-entrainment processes.
1. Because the actual source of erodible material is rock mass, deformation can be neglected. The bottom of the channel is simplified as rigid material in this paper.
2. Because the movement law of the material source satisfies Newton’s second law when the debris flow starts, to simplify the complexity of the model, the DEM is used to calculate.
3. The main research objects are the impact force of debris flow and the dynamic response of the barrier, so the channel is simplified.
4. Due to the considerable differences in the performance of particles, fluids, and barrier structures, the SPH-DEM-FEM coupled numerical analysis method is used for numerical analysis and calculation to reflect their respective characteristics.
Based on the above calculation assumptions and model simplification, the schematic diagram of the interaction model between debris flow and the barrier considering the erosion-entrainment process is shown in Figure 1. The erodible material source was calculated by the SPH method and strain softening constitutive model. The DEM numerical analysis method was used to analyze the loose material source particles during debris flow initiation. The barrier and channel were numerically simulated by the finite element method.
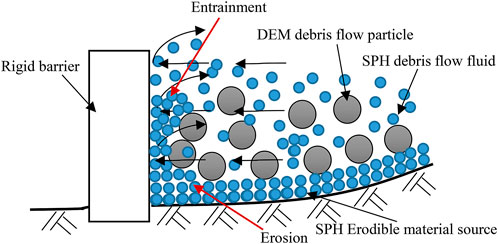
FIGURE 1. Schematic diagram of the erosion-entrainment model.
2.2 Construction of DEM model for debris flow particles
Because the motion of debris f l o w particles conforms to Newton’s second law, DEM is used for calculations, as shown in Eq. 1 (Džiugys and Peters, 2001):
Where
The resultant external force and torque on debris flow particles are shown in Eq. 2:
In the formula,
2.3 Construction of SPH model for debris flow fluid and erodible material source
The debris flow fluid and erodible material source body are constructed using the SPH method, and the approximate function of the example is shown in Eq. 3 (Li B. et al., 2020):
The function W can be expressed by Eq. 4:
Where h is the smooth length and d is the dimension.
The smooth kernel function adopts Eq. 5:
Where C is a constant.
2.4 Construction of SPH-DEM-FEM coupling mode
The algorithm between debris flow particles and a rigid barrier is calculated by Eq. 6 (Li et al., 2022a):
Where fa is the load of FE; fb is the contact force among DEM-FEM.
The coupling algorithm between debris flow fluid, erodible material source and a rigid barrier is calculated with Eq. 7:
Where F is the external load; FC is the contact force among SPH-FEM.
The coupling algorithm between debris flow fluid, erodible material source body, and debris flow particles is calculated using Eq. 8 (Li et al., 2022a). The schematic diagram of SPH-DEM-FEM coupling numerical model is shown in Figure 2:
Where, b, s and f represent FE, DEM and SPH.
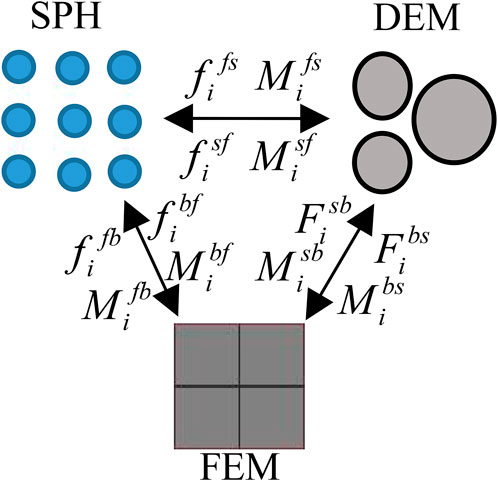
FIGURE 2. Schematic diagram of SPH-DEM-FEM coupling numerical model.
2.5 Constitutive model of erodible material source
Erosion occurs when the shear stress exerted by debris flow on an erodible material source exceeds the strength of the material source. It goes from a solid state to a transition state. Then entrainment is generated and transformed into a flow state. In this paper, the strain softening model proposed by Lee et al. (Lee and Jeong, 2018; Jeong and Lee, 2019; Lee et al., 2019) is used to simulate the erosion-entrainment process. The strain softening model of an erodible material source is shown in Figure 3.
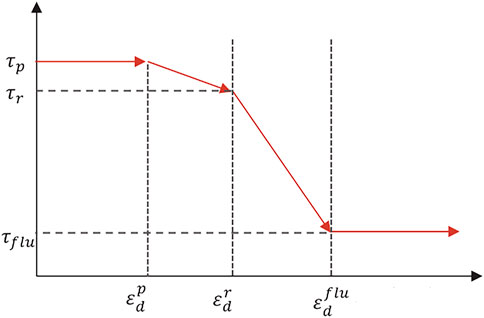
FIGURE 3. Strain softening model of an erodible material source Lee et al. (2019).
3 Model verification
3.1 DEM-FEM debris flow model verification
The indoor debris flow impact tests conducted by Jiang et al. (2013) were used to verify the model. The schematic diagram of the indoor test is shown in Figure 4. The DEM-FEM coupling numerical model is consistent with the indoor test. The channel is 2.93 m long. The gradient of the channel is 40°, and the initial source volume is 0.019 m3. The diameter of debris flow particles ranges from 10 mm to 25 mm. As the proportion of particles less than 10 mm in the sample is relatively low, the particles less than 10 mm are ignored in this paper.
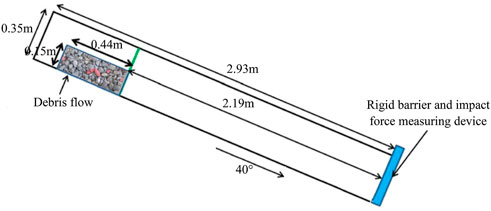
FIGURE 4. Schematic diagram of laboratory test of debris flow Jiang et al. (2013).
The simulation parameters are consistent with the indoor test and simulation parameters conducted by Jiang et al. (2013). The whole process of the test is entirely reproduced by using the coupled DEM-FEM method. The initial volume and starting conditions of debris flow in the DEM particle simulation test are consistent with the test. Because the fraction of particles below 10 mm in the sample is relatively low, the fraction smaller than 10 mm is ignored in the numerical simulation. The slope of the debris flow channel is 40°, and a rigid body element is used for simulation. The geometric model is shown in Figure 5A, and the mesh model is shown in Figure 5B.
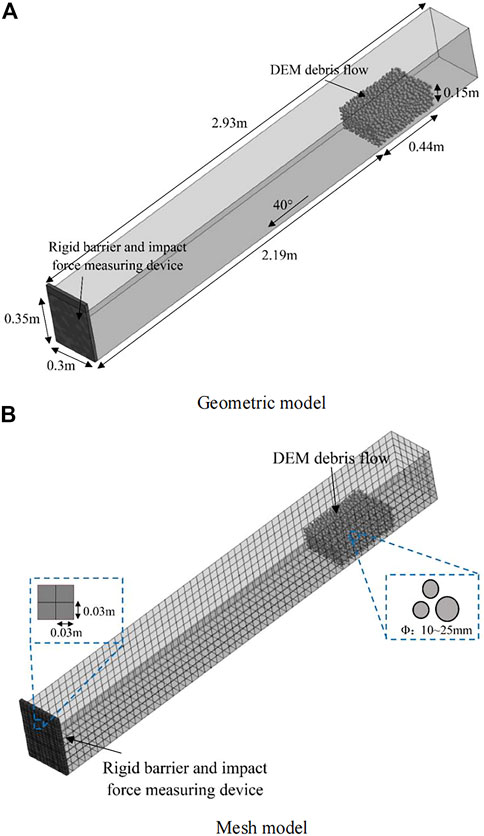
FIGURE 5. The coupled DEM-FEM numerical model of debris flow impact (A) Geometric model (B) Mesh model.
The barrier structure material of the numerical model is consistent with the test. C40 concrete is selected, and the elastic model is used as the constitutive model. The specific material parameters are consistent with the literature (Jiang et al., 2013). DEM particles are adopted for debris flow, and the elastic model is adopted for the constitutive model. As the minimum dry weight in the test is 1,350 kg/m3, the DEM particle density is set as 2,500 kg/m3 according to the literature. The friction coefficients of particle, rigid barrier, and channel are 1.4, 0.466, and 0.384, respectively. The specific parameters are consistent with the numerical simulation parameters conducted by Shen et al. (2018) and Law (2015), as shown in Table 1.
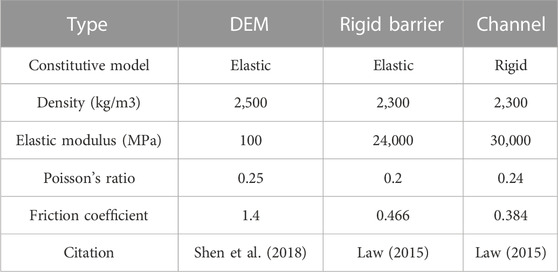
TABLE 1. DEM-FEM coupling numerical simulation parameters.
The effectiveness of the DEM-FEM coupling method is verified by comparison with the impact test of debris flow, as shown in Figure 6. Figure 6A shows the indoor test results, and Figure 6B shows the simulation results. The impact process and debris flow shape of numerical simulation laboratory test results are consistent with those of laboratory physical model tests. The process of debris flow impact in different time periods is compared in the paper, and the experimental results are basically consistent with the numerical simulation results.
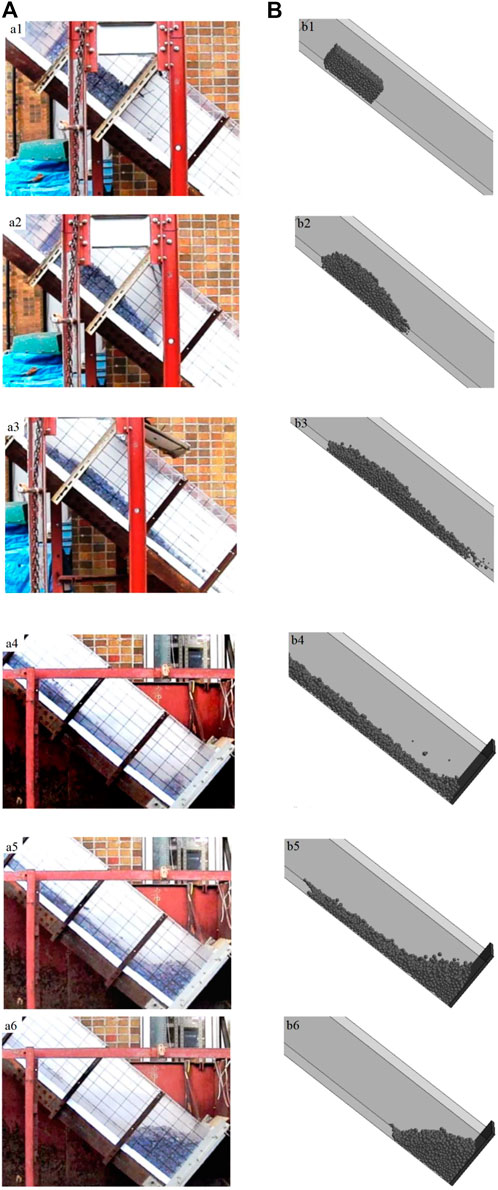
FIGURE 6. Comparison of debris flow impact process: (A) Laboratory test Jiang et al. (2013); (B) Numerical simulation results.
Figure 7 shows the time history curves of the impact force for the indoor test and the numerical simulation. The two time history curves are in agreement. Although there are some errors in the comparison results, the error rate ranges between 2.1%–7.7%, indicating the model’s applicability and reliability.
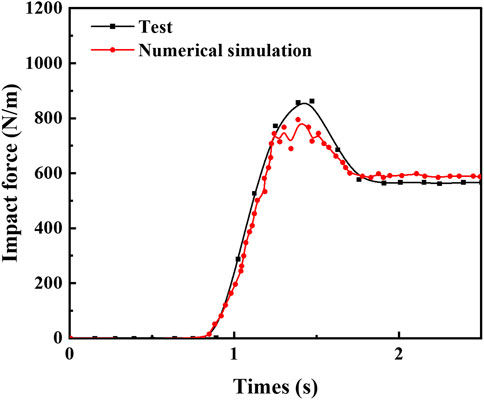
FIGURE 7. Comparison of the time history curves of the indoor test and numerical simulation impact force.
3.2 Verification of SPH-FEM debris flow model
The debris flow indoor test conducted by Moriguchi et al. [54] is used for model verification. Figure 8 shows the laboratory test. The coupled SPH-FEM model is consistent with the indoor test. The length of the debris flow flume is 1.8 m, the width is 0.3 m, and the slope is adjustable between 45° and 65°.
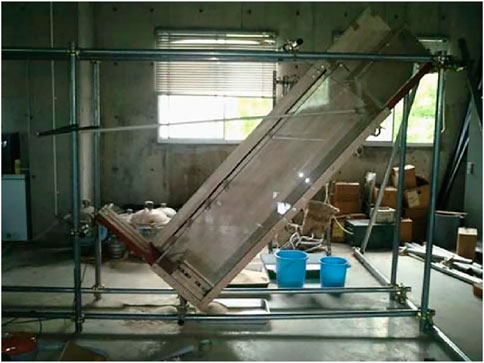
FIGURE 8. Laboratory test diagram of debris flow (Moriguchi et al. [54]).
The simulation parameters are consistent with the indoor test of debris flow conducted by Moriguchi et al. (2009). The whole test process is entirely reproduced by the coupling SPH-FEM numerical analysis method. The initial volume and starting conditions of debris flow in the SPH particle simulation test are consistent with the test. The adopted slope of the debris flow flume varied between 45°, 50°, 55°, 60°, and 65°. The geometric model is shown in Figure 9A, and the mesh models are shown in Figure 9B. The numerical model parameters are entirely consistent with the test [54]. The simulation parameters are shown in Table 2.
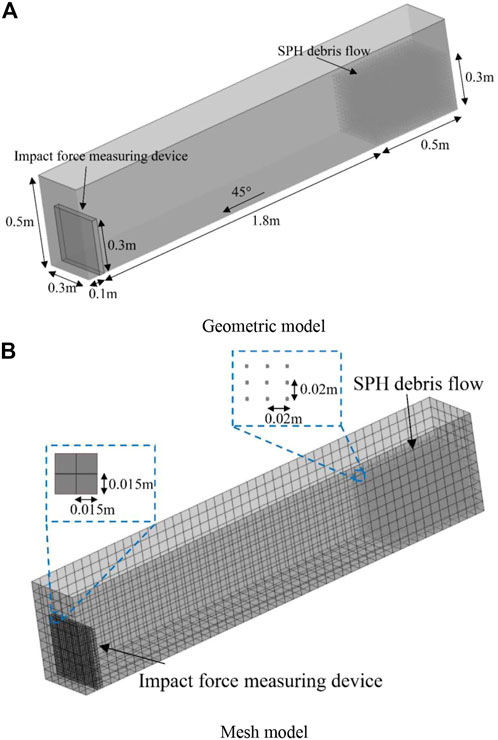
FIGURE 9. The coupled SPH-FEM numerical debris flow impact model (A) Geometric model (B) Mesh model.

TABLE 2. The coupled SPH-FEM numerical simulation parameters.
The comparison of the impact process between the indoor test and numerical simulation of debris flow at different times (t=0.4 s, t=0.8 s, t=1.2 s, t=1.6 s) is shown in Figure 10. Figure 10A shows the impact process of the laboratory test, and Figure 10B shows the impact process of coupled numerical simulation. The impact process of the indoor test is consistent with the coupled numerical simulation.
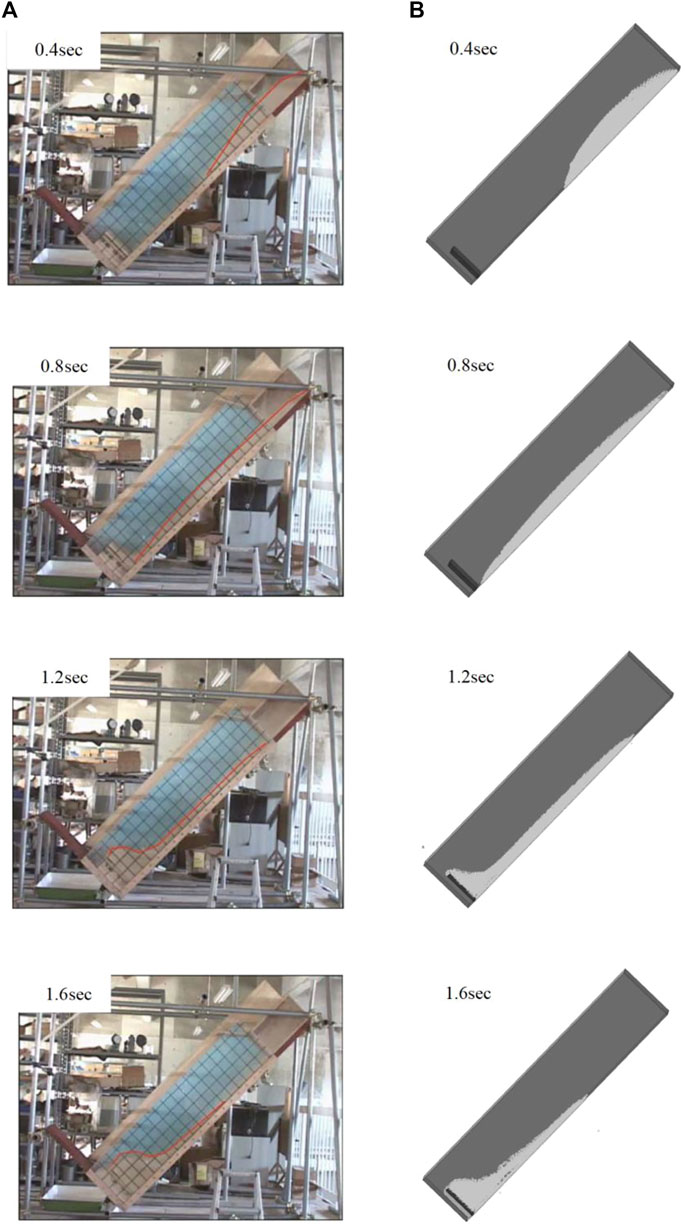
FIGURE 10. Comparison of debris flow impact process (A) Laboratory test (Moriguchi et al. [54]); (B) Numerical simulation results.
Figure 11 shows the comparison of the impact force time history curve when the slope of the debris flow flume is 45°, 55°, 60°, and 65°, respectively. Although there are some errors in the comparison of the results, the error rate ranges 1.9%–8.6%, indicating the applicability of the model.
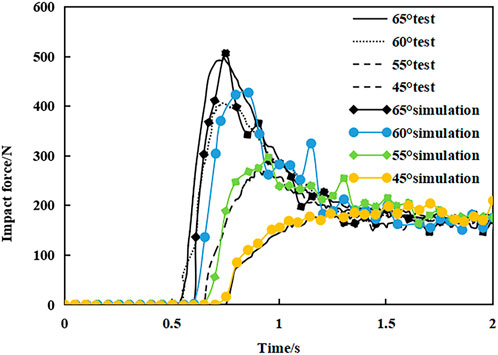
FIGURE 11. Comparison of impact force time history curve between test and numerical simulation.
4 Establishment of model
4.1 Geometric model and mesh model
The model is established according to the actual terrain of a typical debris flow channel in Nanjiao Gully, Fangshan District, Beijing. The model is simplified using the calculation assumptions in Section 2.1. The simplified slope of the channel in the debris flow forming area is 35°, and the slope of the channel in the debris flow erosion area is 20°. According to the field investigation results, the thickness of the erodible material source is set to 0.5 m. The geometric model of debris flow and rigid barrier considering the source erosion-entrainment process is shown in Figure 12A. The model consists of the DEM debris flow initiating material source, SPH erodible material source, FEM rigid barrier, and the channel. The width of the model is 1 m. The starting length of debris flow is 5 m, and the length of the erosion area is 10 m.
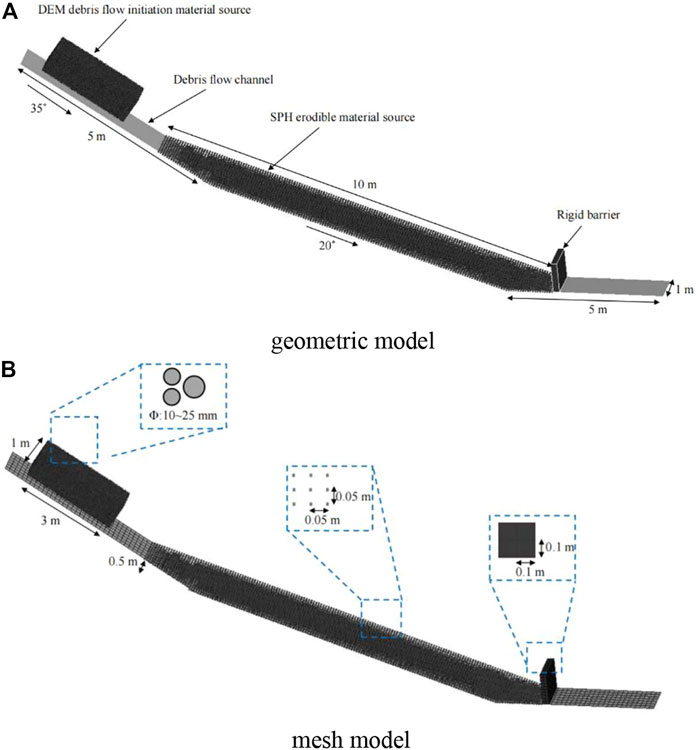
FIGURE 12. Debris flow and barrier model considering the erosion-entrainment process (A) geometric model (B) mesh model.
The mesh models of the debris flow and rigid barrier considering the source erosion-entrainment process are shown in Figure 12B. C3D8R hexahedron element with the size of 0.1 m is used for the rigid barrier. DEM particles with a particle diameter of 10–25 mm are used as the starting source of debris flow. SPH particles with a spacing of 0.05 m are used as the erodible source.
4.2 Basic parameters and boundary conditions of the simulation
The strain softening model in Section 2.5 is used for the erodible material source. The elastic constitutive model is used for the DEM material source particles. The elastic constitutive model is used for the rigid barrier. The rigid constitutive model is adopted for the channel. Specific simulation parameters are shown in Table 3. The volume of initial provenance and the erosion thickness of soil layer were determined based on field investigation and field tests.
TABLE 3. Basic parameters of numerical simulation.
All degrees of freedom of the channel are fixed, and the bottom of the barrier is fixed. The debris flow starts under gravity and enters the flow area, producing an erosion-entrainment effect and finally impacting the barrier. The calculation time is 10 s, and the process from the debris flow starting to erosion-entrainment to impact is simulated.
5 Results and discussion
In this paper, the coupled numerical simulation analysis of the debris flow impact process, debris flow impact force time history, and barrier displacement time history with or without considering the erosion-entrainment process is carried out by the established model. Finally, the parameters of the debris flow impact force formula are modified, which provides a reference for debris flow prevention and the design of a barrier.
5.1 Comparison of debris flow impact process
The impact process and velocity vector results of debris flow with and without the erosion-entrainment process are analyzed in this section to study the impact of the erosion-entrainment process on the debris flow impact process. Figure 13A shows the impact process and velocity vector results of debris flow without the erosion-entrainment process. Figure 13B compares the effects of including or excluding the erosion-entrainment process.
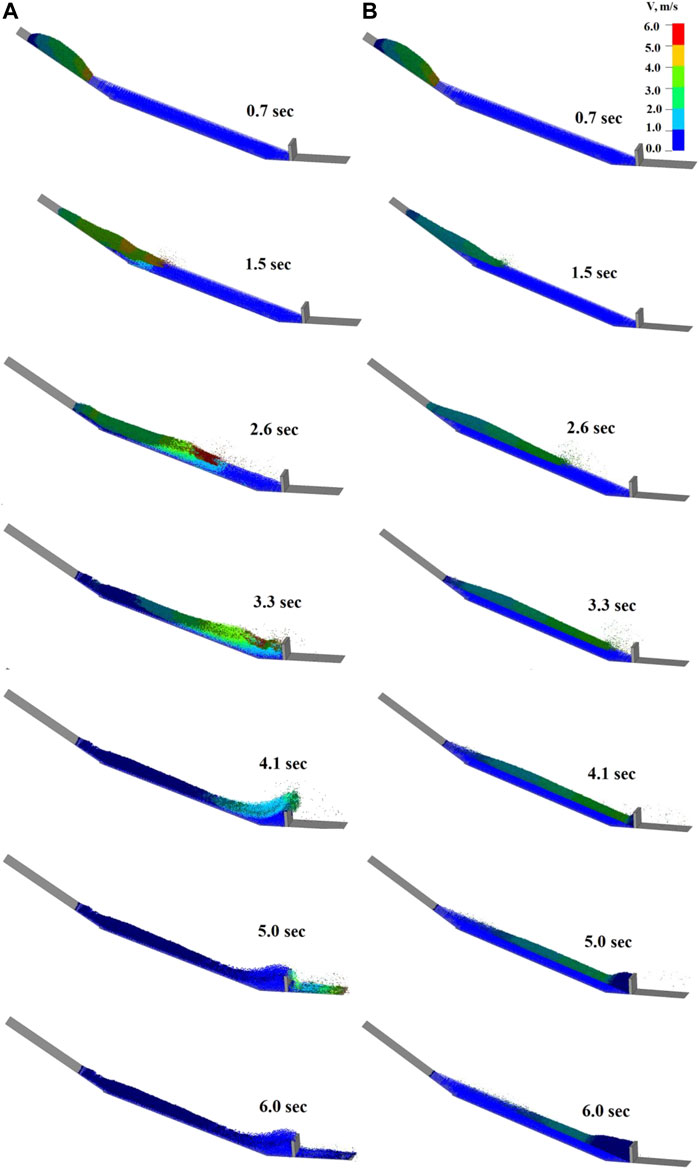
FIGURE 13. Comparison of debris flow impact process and velocity vector results with and without erosion-entrainment process.
The volume of debris flow is always the source volume when the debris flow starts, and all of the debris flow is intercepted by the barrier. The case considering the erosion-entrainment process is shown in Figure 13A. The debris flow volume increases rapidly with the erosion-entrainment process and significantly impacts the barrier. Due to the increased debris flow volume, many debris flows rush out of the rigid barrier.
When the time is 0.7 s, the debris flow starts and flows through the erosion area to produce an erosion-entrainment effect on the erodible material source. At 1.5 s, apparent concave erosion occurs, further intensifying the entrainment process. At 2.6 s, the debris flow velocity reaches a maximum of 5.98 m/s, while the maximum velocity without the erosion-entrainment process is only 3.02 m/s. At 3.3 s, the debris flow starts to impact the barrier, and the debris flow velocity rapidly drops. At 4.1 s, the debris flow rushes out of the barrier. At this time, the impact height reaches the maximum, about 2.16 times higher than without the erosion-entrainment process. When the time is 5.0 s, the debris flow is deposited at the bottom of the barrier. When the time is 6.0 s, the debris flow finally becomes a static load. However, the impact process of debris flow without considering erosion at the same time is significantly different. Both impact velocity and impact height, the former is significantly greater than the latter.
5.2 Flow velocity and impact height of debris flow
The comparison of debris flow velocity with and without the erosion-entrainment process is shown in Figure 14. When the time is 2.6 s, the debris flow velocity reaches the maximum of 5.98 m/s. The maximum velocity without the erosion-entrainment process is only 3.02 m/s. The debris flow velocity considering the erosion-entrainment process is 1.98 times that without the erosion-entrainment process.
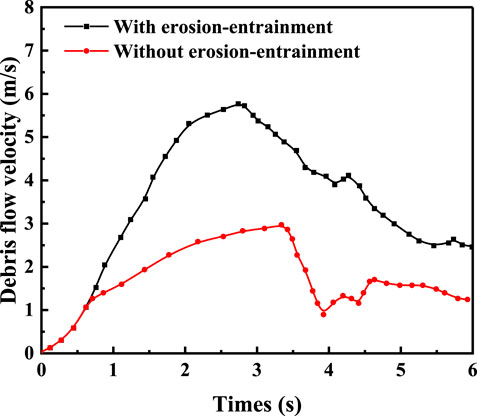
FIGURE 14. Comparison of debris flow velocity results.
Figure 15 compares the impact height of debris flow with and without the erosion-entrainment process. At 4.1 s, the impact height of debris flow reaches a maximum of 2.07 m. The maximum impact height without the erosion-entrainment process is only 0.96 m. The impact height of debris flow considering the erosion-entrainment process is 2.16 times higher than without the process.
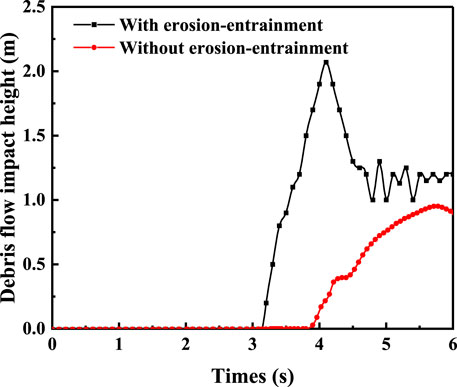
FIGURE 15. Comparison of impact height results.
5.3 Impact force of debris flow and dynamic response of barrier
The comparison of the impact force of a debris flow with and without the erosion-entrainment process is shown in Figure 16. When the time is 4.1 s, the impact force of debris flow reaches the maximum of 155.65 kN/m2. The maximum impact force without the erosion-entrainment process is only 75.22 kN/m2. The debris flow velocity considering the erosion-entrainment process is 2.07 times that without the erosion-entrainment process.
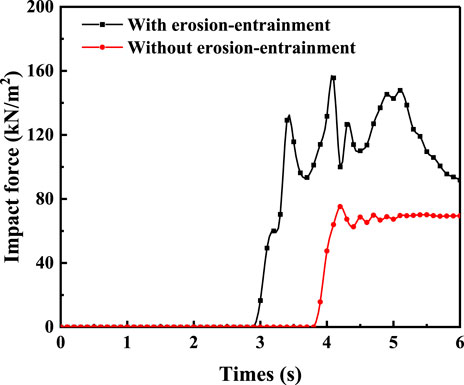
FIGURE 16. Time history results of the impact force.
Figure 17 compares the displacement time history of the barrier with and without the erosion-entrainment process. At 4.1 s, the displacement time history of the barrier reaches a maximum of 1.75 mm. The maximum impact height without the erosion-entrainment process is only 0.82 mm. The impact height of debris flow considering the erosion-entrainment process is 2.13 times that without the process.
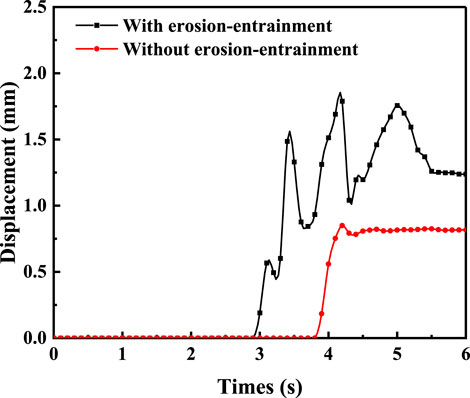
FIGURE 17. Time history results of the displacement.
5.4 Analysis and discussion
As seen from Figure 14, without considering the erosion-entrainment effect, the debris flow is in direct contact with the soil layer and deposits, and the flow velocity significantly decreases. The maximum velocity of debris flow with and without the erosion-entrainment process is 5.98 m/s and 3.02 m/s, respectively, and the time of maximum velocity is inconsistent. In the case of erosion-entrainment, the properties of erodible material sources change, and the thickness and velocity of the debris flow are significantly improved. This also shows the validity of the strain softening constitutive model in coupled numerical analysis.
As shown in Figure 15, the impact height of debris flow also significantly differs when the erosion-entrainment effect is considered or not. The maximum impact height is 2.07 m, rapidly dropping to 1.24 m after reaching the peak. Regardless of the erosion-entrainment process, the maximum impact height is only 0.96 m, and it slowly rises to its peak. This shows that the impact trend of debris flow is significantly different when the erosion-entrainment process is considered or not, and the former has prominent movement characteristics.
As shown in Figure 16, the time history of debris flow impact force is also significantly different with and without the consideration of erosion-entrainment. The maximum impact force in the erosion-entrainment process is 155.65 kN/m2 and rapidly drops to 91.77 kN/m2 after reaching the peak value. Regardless of the erosion-entrainment process, the maximum impact force is only 75.22 kN/m2, slowly rising to its peak. This shows that the impact force law of debris flow is significantly different when the erosion-entrainment process is considered. The former mainly corresponds to the fluid dynamics theory, while the latter is more suitable for calculation using the hydrostatic theory.
As seen in Figure 17, the dynamic response of the barrier is consistent with the law of debris flow impact force. In the design of the barrier, the hydrodynamic model is recommended because the law of debris flow impact force considering the erosion-entrainment process is significantly different from that without considering the process. It is suggested to modify the empirical formula of the debris flow impact force to consider erosion-entrainment. The existing calculation formula of debris flow impact force based on hydrodynamics is shown in Eq. 9 (Hungr et al., 2005):
Here
It is suggested to use the erosion-entrainment correction coefficient
Here, γ is the erosion-entrainment correction coefficient.
As a result of this paper’s numerical calculation, the debris flow velocity considering the erosion-entrainment process is 2.07 times that without the process. It is recommended that the erosion-entrainment correction coefficient ranges from 2 to 10.
6 Conclusion
This paper establishes a complex coupled dynamic model of debris flow, erodible material source, and rigid barrier based on the coupled SPH-DEM-FEM algorithm. The following research has been carried out:
A complex coupling dynamic model of debris flow, erodible material source, and a rigid barrier is established in this paper. By comparing the model with the laboratory test, the applicability of the coupled SPH-DEM-FEM method to the analysis of the impact force caused by debris flow is verified. The strain softening model is used to simulate the process of the erodible material source from solid state to transition state and finally to liquid state. The impact force caused by debris flow and the dynamic response of a rigid barrier, considering the process of source erosion-entrainment, is analyzed. The results show that the volume of debris flow, impact force, and dynamic response of a rigid barrier considering source erosion entrainment are significantly greater than the original model. The existing formula of debris flow impact force is modified in this paper according to the calculation results. The coupled numerical analysis method and research results help to clarify the impact of erosion-entrainment, the calculation of debris flow impact force, and the design of a rigid barrier.
(1) Using the coupled SPH-DEM-FEM algorithm, a complex coupling dynamic model of debris flow, erodible material source, and rigid barrier is established using the strain softening model. By comparing the model with the laboratory tests, the applicability of the coupled SPH-DEM-FEM method to the analysis of the impact force caused by debris flow is verified.
(2) The impact process and velocity vector of debris flow with and without source erosion-entrainment are analyzed. In the former, due to the increase of debris flow volume, many debris flows rush out of the barrier, while the latter is completely intercepted. The coupled numerical model can simulate the erosion-entrainment process of the erodible material source.
(3) Comparative analysis of flow velocity and impact height of debris flow with and without source erosion-entrainment is shown. Considering the erosion-entrainment process, the maximum velocity and impact height of debris flow are 5.98 m/s and 2.07 m, respectively, 1.98 times and 2.16 times than when not considering the process. The results show that the erosion-entrainment effect significantly changes the debris flow.
(4) A comparative analysis of the time history of debris flow impact force and the time history of the rigid barrier displacement is carried out with and without considering source erosion-entrainment action. Considering the erosion-entrainment process, the peak impact force of debris flow and the peak displacement of the rigid barrier are 155.65 kN/m2 and 1.75 mm, respectively, which are 2.07 times and 2.13 times than without considering the process. The erosion-entrainment correction coefficient is introduced to modify the parameters of the existing calculation formula of debris flow impact force based on hydrodynamics based on the calculation results. The research results have a reference value for calculating the debris flow impact force and the barrier design.
Data availability statement
The raw data supporting the conclusions of this article will be made available by the authors, without undue reservation.
Author contributions
Writing—original draft preparation, software, methodology BL; validation, investigation, writing—review and editing YF; data curation, writing—review and editing YL; validation and investigation CZ. All authors have read and agreed to the published version of the manuscript.
Funding
This work was funded by the High-level Innovative Talents Program of Hebei University (grant numbers 521100222055).
Conflict of interest
The authors declare that the research was conducted in the absence of any commercial or financial relationships that could be construed as a potential conflict of interest.
Publisher’s note
All claims expressed in this article are solely those of the authors and do not necessarily represent those of their affiliated organizations, or those of the publisher, the editors and the reviewers. Any product that may be evaluated in this article, or claim that may be made by its manufacturer, is not guaranteed or endorsed by the publisher.
References
Arattano, M., Franzi, L. J. N. H., and Sciences, E. S. (2003). On the evaluation of debris flows dynamics by means of mathematical models. Nat. Hazards Earth Syst. Sci. 3, 539–544. doi:10.5194/nhess-3-539-2003
Armanini, A., Fraccarollo, L., and Rosatti, G. (2009). Two-dimensional simulation of debris flows in erodible channels. Comput. Geosciences 35, 993–1006. doi:10.1016/j.cageo.2007.11.008
Armanini, A. (1997). “On the dynamic impact of debris flows,” in Recent developments on debris flows. Editors A. Armanini, and M. Michiue (Berlin, Heidelberg: Springer), 208–226.
Bugnion, L., Mcardell, B. W., Bartelt, P., and Wendeler, C. (2012). Measurements of hillslope debris flow impact pressure on obstacles. Landslides 9, 179–187. doi:10.1007/s10346-011-0294-4
Calvetti, F., Di Prisco, C. G., and Vairaktaris, E. (2017). DEM assessment of impact forces of dry granular masses on rigid barriers. Acta Geotech. 12, 129–144. doi:10.1007/s11440-016-0434-z
Chen, H., Crosta, G. B., and Lee, C. F. (2006). Erosional effects on runout of fast landslides, debris flows and avalanches: A numerical investigation. debris flows avalanches a Numer. investigation 56, 305–322. doi:10.1680/geot.2006.56.5.305
Choi, S.-K., Park, J.-Y., Lee, D.-H., Lee, S.-R., Kim, Y.-T., and Kwon, T.-H. (2021). Assessment of barrier location effect on debris flow based on smoothed particle hydrodynamics (SPH) simulation on 3D terrains. Landslides 18, 217–234. doi:10.1007/s10346-020-01477-5
Džiugys, A., and Peters, B. J. G. M. (2001). An approach to simulate the motion of spherical and non-spherical fuel particles in combustion chambers. Granul. Matter 3, 231–266. doi:10.1007/pl00010918
Fan, X., Scaringi, G., Korup, O., West, A. J., Van Westen, C. J., Tanyas, H., et al. (2019). Earthquake-induced chains of geologic hazards: Patterns, mechanisms, and impacts. Rev. Geophys. 57, 421–503. doi:10.1029/2018rg000626
Federico, F., and Cesali, C. (2015). An energy-based approach to predict debris flow mobility and analyze empirical relationships. Can. Geotechnical J. 52, 2113–2133. doi:10.1139/cgj-2015-0107
Fuchu, D., Lee, C., and Sijing, W. J. E. G. (1999). Analysis of rainstorm-induced slide-debris flows on natural terrain of Lantau Island, Hong Kong. Hong Kong 51, 279–290. doi:10.1016/s0013-7952(98)00047-7
Gao, L., Zhang, L. M., and Chen, H. X. (2017). Two-dimensional simulation of debris flow impact pressures on buildings. Eng. Geol. 226, 236–244. doi:10.1016/j.enggeo.2017.06.012
Guo, J., Cui, Y., Xu, W., Yin, Y., Li, Y., and Jin, W. (2022). Numerical investigation of the landslide-debris flow transformation process considering topographic and entrainment effects: A case study. Landslides 19, 773–788. doi:10.1007/s10346-021-01791-6
Haas, T. D., and Woerkom, T. V. J. E. S. P. (2016). Bed scour by debris flows: Experimental investigation of effects of debris-flow composition. Earth Surf. Process. Landforms, 41(13), pp.1951–1966.https://doi.org/doi:10.1002/esp.3963
Hu, K. H., Wei, F. Q., and Li, Y. (2011). Real-time measurement and preliminary analysis of debris-flow impact force at Jiangjia Ravine, China. Earth Surf. Process. Landforms 36, 1268–1278. doi:10.1002/esp.2155
Huang, H.-P., Yang, K.-C., and Lai, S.-W. J. M. (2007). Impact force of debris flow on filter dam. momentum 9 (2), 03218.
Hungr, O., Mcdougall, S., and Bovis, M. (2005). “Entrainment of material by debris flows,” in Debris-flow hazards and related phenomena. Editors M. Jakob, and O. Hungr (Berlin, Heidelberg: Springer), 135–158.
Hungr, O., Morgan, G. C., and Kellerhals, R. (1984). Quantitative analysis of debris torrent hazards for design of remedial measures. Can. Geotechnical J. 21, 663–677. doi:10.1139/t84-073
Jeong, S., and Lee, K. J. C. (2019). Analysis of the impact force of debris flows on a check dam by using a coupled Eulerian-Lagrangian (CEL) method. Comput. Geotechnics 116, 103214.
Jiang, Y.-J., Towhata, I. J. R. M., and Engineering, R. (2013). Experimental study of dry granular flow and impact behavior against a rigid retaining wall. Rock Mech. Rock Eng. 46, 713–729. doi:10.1007/s00603-012-0293-3
Law, P. H. (2015). Computational study of granular debris flow impact on rigid barriers and baffles. Hong Kong: Hong Kong University of Science and Technology.
Lee, K., and Jeong, S. (2018). Large deformation FE analysis of a debris flow with entrainment of the soil layer. Comput. geotechnics 96, 258–268. doi:10.1016/j.compgeo.2017.11.008
Lee, K., Kim, Y., Ko, J., and Jeong, S. (2019). A study on the debris flow-induced impact force on check dam with-and without-entrainment. Comput. Geotech. 113, 103104. doi:10.1016/j.compgeo.2019.103104
Lee, S., An, H., Kim, M., Lee, G., and Shin, H. (2022). Evaluation of different erosion–entrainment models in debris-flow simulation. Landslides 19, 2075–2090.
Lei, Z., Wu, B., Wu, S., Nie, Y., Cheng, S., and Zhang, C. (2022). A material point-finite element (MPM-FEM) model for simulating three-dimensional soil-structure interactions with the hybrid contact method. Comput. geotechnics 152, 105009. doi:10.1016/j.compgeo.2022.105009
Leonardi, A., Wittel, F. K., Mendoza, M., and Herrmann, H. J. (2015). “Lattice-Boltzmann method for geophysical plastic flows,” in Recent advances in modeling landslides and debris flows (Berlin/Heidelberg, Germany: Springer), 131–140.
Leonardi, A., Wittel, F. K., Mendoza, M., and Herrmann, J. (2013). "Multiphase debris flow simulations with the discrete element method coupled with a lattice-Boltzmann fluid", in: Procdeedings of the Particles III: proceedings of the III International Conference on Particle-Based Methods: fundamentals and applications: CIMNE), 276–287.September 2013
Leonardi, A., Wittel, F. K., Mendoza, M., Vetter, R., Herrmann, H. J. J. C. a. C., and Engineering, I. (2016). Particle–fluid–structure interaction for debris flow impact on flexible barriers. Computer-Aided Civ. Infrastructure Eng. 31, 323–333. doi:10.1111/mice.12165
Li, B.-L., Wang, C.-M., and Li, Y.-Y. J. L. (2022b). Study on dynamic response of blocking structure and debris flow impulsive force considering. Mater. Source Eros. 2022, 1252637.
Li, B.-L., Wang, C.-M., and Li, Y.-Y. (2022a). Study on dynamic response of blocking structure and debris flow impulsive force considering material source erosion. Lithosphere 2022, 1252637. doi:10.2113/2022/1252637
Li, B., Wang, C., Li, Y., Liu, Y., Jiang, N., Liang, Z., et al. (2020a). Dynamic response analysis of retaining dam under the impact of solid-liquid two-phase debris flow based on the coupled SPH-DEM-FEM method. Geofluids 2020, 6635378. doi:10.1155/2020/6635378
Li, S., Peng, C., Wu, W., Wang, S., Chen, X., Chen, J., et al. (2020b). Role of baffle shape on debris flow impact in step-pool channel: An SPH study. Landslides 17, 2099–2111. doi:10.1007/s10346-020-01410-w
Li, X., Sovilla, B., Ligneau, C., Jiang, C., and Gaume, J. (2022c). Different erosion and entrainment mechanisms in snow avalanches. Mech. Res. Commun. 124, 103914.
Li, X., Zhao, J. J. I. J. F. N., and Geomechanics, A. M. I. (2018). A unified CFD-DEM approach for modeling of debris flow impacts on flexible barriers. Int. J. Numer. Anal. Methods Geomech. 42, 1643–1670. doi:10.1002/nag.2806
Liu, W., and He, S. J. L. (2020). Comprehensive modelling of runoff-generated debris flow from formation to propagation in a catchment. Landslides 17, 1529–1544. doi:10.1007/s10346-020-01383-w
Liu, W., Yan, S., and He, S. J. E. G. (2020). A simple method to evaluate the performance of an intercept dam for debris-flow mitigation. Eng. Geol. 276, 105771.
Luna, B. Q., Remaître, A., Van Asch, T. W. J., Malet, J. P., and Van Westen, C. J. (2012). Analysis of debris flow behavior with a one dimensional run-out model incorporating entrainment. Eng. Geol. 128, 63–75. doi:10.1016/j.enggeo.2011.04.007
Mangeney, A., Roche, O., Hungr, O., Mangold, N., Faccanoni, G., and Lucas, A. (2010). Erosion and mobility in granular collapse over sloping beds. J. Geophys. Res. Earth Surf. 115, F03040. doi:10.1029/2009jf001462
Mangeney, A., Tsimring, L. S., Volfson, D., Aranson, I. S., and Bouchut, F. (2007). Avalanche mobility induced by the presence of an erodible bed and associated entrainment. Geophys. Res. Lett. 34, L22401. doi:10.1029/2007gl031348
Moriguchi, S., Borja, R. I., Yashima, A., and Sawada, K. J. a. G. (2009). Estimating the impact force generated by granular flow on a rigid obstruction. Acta Geotech. 4, 57–71. doi:10.1007/s11440-009-0084-5
Peng, H., Zhao, Y., Cui, P., Zhang, W., Chen, X., and Chen, X. J. J. O. M. S. (2011). Two-dimensional numerical model for debris flows in the jiangjia gully, yunnan province. Yunnan Prov. 8, 757–766. doi:10.1007/s11629-011-2043-5
Proske, D., Suda, J., and Hübl, J. (2011). Debris flow impact estimation for breakers. Georisk Assess. Manag. Risk Eng. Syst. Geohazards 5, 143–155. doi:10.1080/17499518.2010.516227
Roelofs, L., Colucci, P., and De Haas, T. (2022). How debris-flow composition affects bed erosion quantity and mechanisms: An experimental assessment. Earth Surf. Process. Landforms 147, 2151–2169.
Scheidl, C., Chiari, M., Kaitna, R., Müllegger, M., Krawtschuk, A., Zimmermann, T., et al. (2013). Analysing debris-flow impact models, based on a small scale modelling approach. Surv. Geophys. 34, 121–140. doi:10.1007/s10712-012-9199-6
Scheidl, J., Vetyukov, Y., Schmidrathner, C., Schulmeister, K., and Proschek, M. J. I. J. O. M. S. (2021). Mixed Eulerian–Lagrangian shell model for lateral run-off in a steel belt drive and its experimental validation. Int. J. Mech. Sci. 204, 106572.
Sha, S., Dyson, A. P., Kefayati, G., and Tolooiyan, A. (2023). Simulation of debris flow-barrier interaction using the smoothed particle hydrodynamics and coupled Eulerian Lagrangian methods. Finite Elem. Analysis Des. 214, 103864. doi:10.1016/j.finel.2022.103864
Shang, Y. J., Yang, Z. F., Li, L. H., Liu, D., Liao, Q. L., and Wang, Y. C. (2003). A super-large landslide in tibet in 2000: Background, occurrence, disaster, and origin. Geomorphology 54, 225–243. doi:10.1016/s0169-555x(02)00358-6
Shen, W., Zhao, T., Zhao, J., Dai, F., and Zhou, G. G. J. E. G. (2018). Quantifying the impact of dry debris flow against a rigid barrier by DEM analyses. Eng. Geol. 241, 86–96. doi:10.1016/j.enggeo.2018.05.011
Tang, C., Van Asch, T. W. J., Chang, M., Chen, G. Q., Zhao, X. H., and Huang, X. C. (2012). Catastrophic debris flows on 13 August 2010 in the Qingping area, southwestern China: The combined effects of a strong earthquake and subsequent rainstorms. Geomorphology 139-140, 559–576. doi:10.1016/j.geomorph.2011.12.021
Thouret, J. C., Antoine, S., Magill, C., and Ollier, C. (2020). Lahars and debris flows: Characteristics and impacts. Earth-Science Rev. 201, 103003. doi:10.1016/j.earscirev.2019.103003
Tian, M., Hu, K.-H., Ma, C., and Lei, F.-H. J. J. O. H. E. (2014). Effect of bed sediment entrainment on debris-flow resistance. J. Hydraulic Eng. 140, 115–120.
Wang, G., Hu, B., Tian, S., Ai, M., Liu, W., and Kong, X. (2021). Seepage field characteristic and stability analysis of tailings dam under action of chemical solution. Sci. Rep. 11, 4073. doi:10.1038/s41598-021-83671-6
Wang, G., Sassa, K., and Fukuoka, H. (2003). Downslope volume enlargement of a debris slide–debris flow in the 1999 Hiroshima, Japan, rainstorm. Eng. Geol. 69, 309–330. doi:10.1016/s0013-7952(02)00289-2
Wang, G., Tian, S., Hu, B., Kong, X., and Chen, J. (2020). An experimental study on tailings deposition characteristics and variation of tailings dam saturation line. Geomechanics Eng. 23, 85–92.
Wang, G., Zhao, B., Lan, R., Liu, D., Wu, B., Li, Y., et al. (2022). Experimental study on failure model of tailings dam overtopping under heavy rainfall. Lithosphere, 5922501.
Wang, G., Zhao, B., Wu, B., Zhang, C., and Liu, W. (2023). Intelligent prediction of slope stability based on visual exploratory data analysis of 77 in situ cases. Int. J. Min. Sci. Technol. 33, 49–61.
Wang, W., Yin, Y., Wei, Y., Zhu, S., Li, J., Meng, H., et al. (2021). Investigation and characteristic analysis of a high-position rockslide avalanche in Fangshan District, Beijing, China. Bull. Eng. Geol. Environ. 80, 2069–2084. doi:10.1007/s10064-020-02098-x
Yin, Y., Cheng, Y., Liang, J., and Wang, W. (2016). Heavy-rainfall-induced catastrophic rockslide-debris flow at sanxicun, dujiangyan, after the wenchuan ms 8.0 earthquake. Landslides 13, 9–23. doi:10.1007/s10346-015-0554-9
Keywords: erosion-entrainment, SPH-DEM-FEM, rigid barrier, debris flow-induced impacting, dynamic response analysis
Citation: Li B, Fang Y, Li Y and Zhu C (2023) Dynamics of debris flow-induced impacting onto rigid barrier with material source erosion-entrainment process. Front. Earth Sci. 11:1132635. doi: 10.3389/feart.2023.1132635
Received: 27 December 2022; Accepted: 23 January 2023;
Published: 03 February 2023.
Edited by:
Guangjin Wang, Kunming University of Science and Technology, ChinaCopyright © 2023 Li, Fang, Li and Zhu. This is an open-access article distributed under the terms of the Creative Commons Attribution License (CC BY). The use, distribution or reproduction in other forums is permitted, provided the original author(s) and the copyright owner(s) are credited and that the original publication in this journal is cited, in accordance with accepted academic practice. No use, distribution or reproduction is permitted which does not comply with these terms.
*Correspondence: Youliang Fang, ZmFuZ195b3VsaWFuZ0AxMjYuY29t; Yanying Li, bGl5eTIxQG1haWxzLmpsdS5lZHUuY24=