 Shuping Ma
 Ren Cai3*
 Lingkun Ran
 Baofeng Jiao
- 1Key Laboratory of Cloud–Precipitation Physics and Severe Storms, Institute of Atmospheric Physics (LACS), Chinese Academy of Sciences, Beijing, China
- 2School of Geography and Planning, Ningxia University, Yinchuan, China
- 3Xinjiang Meteorological Observatory, Urumqi, China
- 4University of Chinese Academy of Sciences, Beijing, China
- 5National Marine Environmental Forecasting Center (NMEFC), Beijing, China
To better understand the triggering mechanisms of extreme precipitation events in Central Asia due to the complex terrain, a case study of a topographic blizzard that occurred in Xinjiang Province on 30 November 2018 is conducted. The near-surface wind field is decomposed into flow-around and flow-over components to analyze the dynamic and thermodynamic effects of the flow around and over the topography in the Ili River valley and the northern slope of the Tianshan Mountains. The results reveal that the flow around the topography is the dominant component of the flow field that transports water vapor and causes moisture convergence. The symmetric instability observed at the lower level of the snowfall area is attributed to the flow-around wind field, which leads to advective transport of generalized potential temperature and causes changes in potential vorticity, ultimately resulting in symmetric instability. The local variation of stratified instability in the snowfall area is caused by flow-over potential divergence, specifically, the advection of the flow-over wind vertical shear to equivalent potential temperature causes the change of flow-over potential divergence, thus promotes stratified instability. Moreover, the flow-over potential divergence is negatively correlated with the amount of topographic snowfall to a certain extent, which can provide reference for topographic snowfall forecast in the future. Additionally, the cyclonic vorticity in the snowfall area is mainly caused by the flow around topography and flow-around wind produces favorable vortical circulation conditions for snowfall, while the vertical movement near the ground at the snowfall triggering stage is mainly caused by the flow-over component. Furthermore, the flow-over kinetic energy in the snow area is stronger and the work done by the pressure gradient force caused by flow over terrain drives kinetic energy changes.
1 Introduction
The evaluation results of recently published IPCC AR6 indicate that significant global warming drives the water cycle to accelerate, and extreme precipitation events become stronger and more frequent (IPCC, 2021; Zhao and Abhishek, 2022; Zhao and Abhishek, 2023). Xinjiang is situated in Central Asia (CA), the world’s largest arid zone. Far from the sea, it is rich in mountains, Gobi, and desert, with a unique landform of mountains and basins, and is sensitive to global climate change. Under the background of global warming and accelerated water cycle, precipitation in CA increases significantly (Bothe et al., 2012; Duan et al., 2015; Jiang et al., 2021), and studies show that precipitation in Xinjiang has increased in recent years, with extreme precipitation events occurring frequently (Ding et al., 2006). Meteorologists have carried out many in-depth studies on extreme precipitation events in Xinjiang at the climate scale, synoptic scale and mesoscale (Yang et al., 2015; Zeng and Yang, 2020; Guo et al., 2021; Ma S. et al., 2022). Topography plays an important role in extreme precipitation, thus heavy rains and snowstorms are found to occur in mountainous areas and along windward slopes (Shi et al., 2008; Ma et al., 2021). The trumpet-shaped terrain makes it easier for the Ili River valley to receive water vapor from the west, thus becoming the region with the largest snowfall in winter (Wang et al., 2020).
Precipitation is closely related to topography in that airflow will produce flow-over and flow-around components when it is blocked by terrain (Ye and Gao, 1979; Smith, 2004; Wells et al., 2005; Winters and Armi, 2012; 2014; Jagannathan et al., 2017; Jagannathan et al., 2019; Jagannathan et al., 2020). The relative size of these components mainly depends on the slope of the terrain (Manabe and Terpstra, 1974; Wu, 1984; Trenberth and Chen, 1988). Li et al. (2012) analyzed the climatic characteristics of the flow-over and flow-around components and revealed the dynamic effects of the large topography of the Qinghai-Tibet Plateau. Huang and Zhou (2004) pointed out that the strength of the flow-around component can measure the flow-around effect in the precipitation process. Jin and Li (2021) analyzed and compared the role of flow around and over currents in the process of topographic rainstorms.
Based on the above investigation, precipitation in the Ili River valley in Xinjiang can be considered to be closely related to topographic effects. Airflow enters the valley from its western side and is blocked by the Tianshan Mountains, resulting in flow around and over the terrain. However, the influence of both airflows on precipitation still lacks an in-depth understanding, and further research is necessary. Therefore, based on the topography of the northern slope of the Tianshan Mountain and the Ili River valley in Xinjiang, this paper selected the winter snowfall process triggered on 30 November 2018 to conduct diagnostic analysis on the role of flow around and flow over terrain at the time when the snowfall triggered from the aspects of atmospheric instability, water vapor, heating, and energy.
2 Data and methods
Based on the Global Forecast System of the National Center for Environmental Prediction in the United States (NCEP GFS) analysis and forecast data as the background field and lateral boundary conditions, the Global Data Assimilation System (GDAS) observation data were assimilated by the Gridpoint Statistical Interpolation analysis system (GSI) to form the initial field. The WRF4.0 model (Weather Research and Forecasting modeling system, Skamarock et al., 2019) was used to simulate the heavy snowfall process in the Ili River valley and the northern slope of the Tianshan Mountains on 30 November 2018 with a horizontal resolution of 3 km. For details on the physical parameterization scheme configuration of the numerical simulation, a comparison between simulated and observation precipitation, and synoptic-scale circulation, please refer to Ma et al. (2021).
By decomposing the near-surface wind field, dynamic and thermodynamic equations involving flow-around wind field and flow-over wind field in the terrain-following coordinate system are derived (Figure 1, refer to the appendix for details).
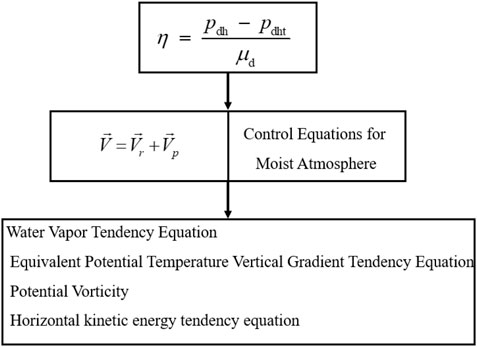
FIGURE 1. Flow chart of equations deduction.
The horizontal wind field in the near-surface model layer is divided into flow-around and flow-over components in terrain-following coordinates for the WRF model to quantitatively analyze the dynamic effect of topography. This is defined as:
The vertical velocity forced by near-surface topography can be written as:
Terrain blocking produces local vorticity, convergence, and divergence, which can be expressed as follows:
where the subscript
The water vapor tendency equation can be written as:
where
The stratified-stability tendency equation can be further written as:
where
The potential vorticity is derived and decomposed into three terms: flow-around potential vorticity, flow-over potential vorticity, and vertical potential vorticity, that is,
where
The horizontal kinetic energy tendency equation in the mass terrain-following coordinate system can be written as:
3 Analysis of characteristics of water vapor transport
The earliest snowfall mainly occurred on the northern slope of the Tianshan Mountains (Figure 2), and there was strong hourly snowfall on the eastern side of the Ili River valley. The simulated snowfall mainly occurred on the northern slope of Tianshan Mountain, which is in the northwestern Ili River valley, and the hourly snowfall was slightly stronger than that of the observations; however, the location of the simulated snowfall center was consistent with that of the observations, and their ranges were similar; therefore, the simulation could well reproduce the development and evolution of the snowfall process and it belongs to cold front snowfall (Ma et al., 2021; Ma et al., 2022 S. P.). The simulation output data are used to calculate the flow-over and flow-around components and analyze their dynamic effects in the snowstorm process.
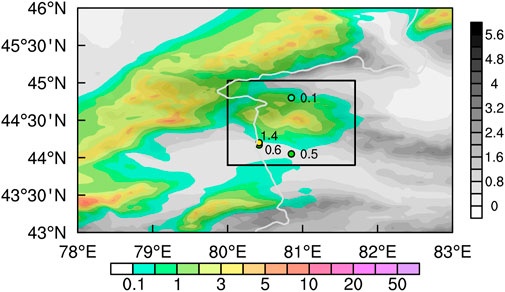
FIGURE 2. 1-h accumulated snowfall from observations (color dot, units: mm), and 1-h accumulated snowfall from simulations (shading, units: mm) at 1600 UTC on Nov. 30, 2018, where the gray shading denotes the terrain height (units: km), the researched domains marked in black rectangular.
Figure 3 shows the horizontal flow field near the surface layer and the vertical velocity forced by topography. There is westerly airflow near the surface of the Ili River valley; as it climbs over the northern slope of Tianshan, the wind direction turns northerly on the east side and westerly on the west side of the snow belt. Figure 3C shows that there is northwest climbing wind in the snowfall area after the horizontal wind field near the ground is decomposed into flow-around and flow-over components, and the wind speed weakens after the airflow passes the mountain. Additionally, there is also strong westward flow around the area of snowfall (Figure 3B), and its strength is slightly greater than that of the flow-over component. The distribution of vertical velocity near the ground calculated by Eq. 2 (Figure 3D) is exactly the same as that of the original vertical velocity of the model (figure omitted). This shows that the vertical movement near the ground is generated by terrain-forced climbing flows, thus, the higher the horizontal wind speed is, the stronger the vertical speed.
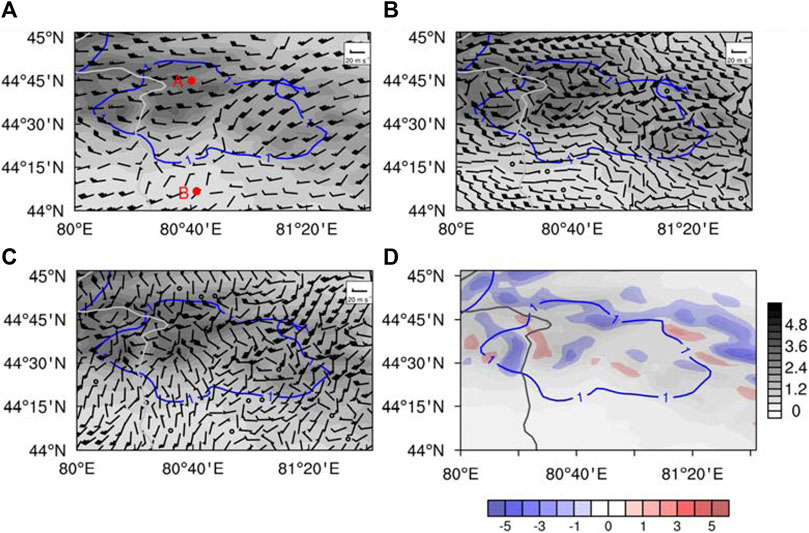
FIGURE 3. (A) Horizontal flow field (vector, units: m s−1), points A, B indicate the locations of the Ili River valley and the northern slope of the Tianshan Mountains, (B) horizontal flow-around field (vector, units: m s−1), (C) horizontal flow-over field (vector, units: m s−1) on the first layer of the model layer overlaid by snow belt (blue contour, 1-h accumulated stimulated snowfall, units: mm), and (D) vertical velocity forced by terrain (color shading, units: m s−1) overlaid by snow belt (blue contour, 1-h accumulated stimulated snowfall, units: mm) on the first layer of the model layer at 1600 UTC on Nov. 30, 2018, where the gray shading denotes the terrain height (units: km).
Topography can cause low-level airflow convergence and water vapor concentration, resulting in stratification instability and promoting convection development. This paper further analyzes the contribution of water vapor transport by flow over and around terrain to precipitation. There was westerly water vapor transport before snowfall, transporting the water vapor from Lake Balkhash to the Ili River valley. The water vapor tendency equation under terrain-following coordinates is Eq. 7, the left side is the local variation term of water vapor, the first term at the right side is water vapor flux divergence caused by flow over terrain, the second term is water vapor flux divergence caused by flow around terrain, the third term is water vapor vertical flux divergence, and the fourth term is water vapor comprehensive forcing term including water vapor phase transformation.
The model-layer data was used to calculate the first and second terms on the right side of Eq. 7. The results show (Figure 4) there was a strong water vapor flux and a water vapor convergence zone, and a weaker water vapor divergence zone in the snowfall area when snowfall was triggered at 1600 UTC. The convergence of water vapor on the west side of the snowfall area is caused by the greater water vapor transportation of flow-around component, and flow over terrain also causes weaker water vapor convergence in the snowfall area. However, the large-scale water vapor convergence in the snowfall area is mainly caused by flow-around component of water vapor flux.
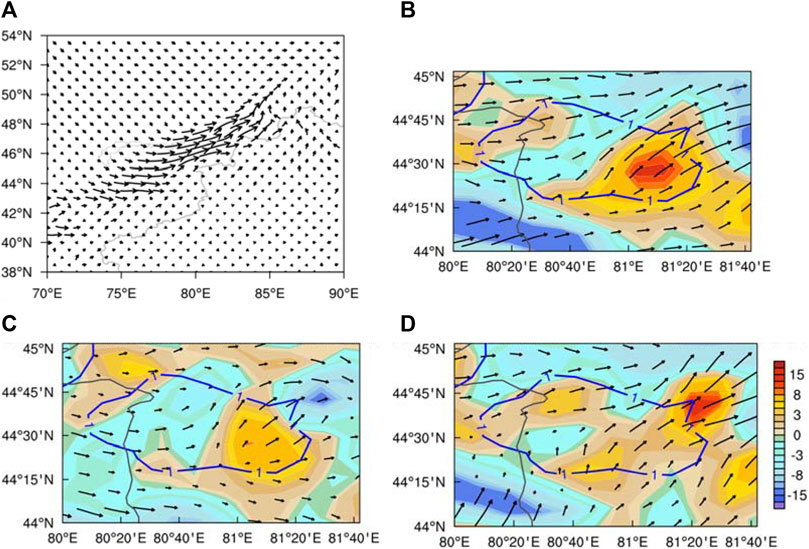
FIGURE 4. (A) 850-hPa water vapor fluxes (vector, units: kg/(cm hPa s)) at 1200 UTC, (B) water vapor fluxes (vector, units: pa m s−1) overlaid by water vapor flux divergence (shaded, units: 10−2 pa s−1), (C) flow-around water vapor fluxes (vector, units: pa m s−1) overlaid by flow-around water vapor flux divergence (shaded, units: 10−2pa s−1) and (D) flow-over water vapor fluxes (vector, units: pa m s−1) overlaid by flow-over water vapor flux divergence (shaded, units: 10−2 pa s−1) on the first layer of the model layer at 1600 UTC on Nov. 30, 2018, where the blue contour is 1-h accumulated stimulated snowfall (units: mm).
4 Analysis of the instability development mechanism
The reasons for the water vapor convergence in topographic precipitation is analyzed above, to better understand the instability development mechanism for terrain-induced precipitation, we now turn to a discussion. Zhou et al. (2018) pointed out that potential divergence is the main forcing term that forces the development and changes in atmospheric potential stability, which can in turn comprehensively characterize vertical wind shear, atmospheric moist baroclinicity, horizontal convergence and divergence, and atmospheric potential stability. The potential vorticity, potential divergence and stratified-stability tendency equation under terrain-following coordinate is further analyzed in this subsection. In the WRF model mass terrain-following coordinate system, the stratified-stability tendency equation is Eq. 8, the left side of the above equation is the individual change of stratified stability, the first term at the right side is the potential divergence term, the second term is the vertical gradient term including the comprehensive forcing of diabatic heating and friction dissipation. Potential divergence can be divided into two parts: flow-around potential divergence (
As shown in Figure 5, there was stratified instability in the upper reaches of the snowfall area at 1400UTC, and it was located in the middle and lower layers (η=0.9969 to η=0.8631). As the snow zone moved eastward, the unstably stratified area moved eastward and gradually increased in intensity. The time evolution of stratification instability shows (Figure 6) that stratified stability is positive and atmospheric stratification is stable before snowfall. With the development of snowfall system, stratified stability gradually decreases, and the atmosphere changes from stratified stability to instability. Therefore, in this subsection, the vertical gradient tendency equation of equivalent potential temperature (Eq. 8) is calculated to analyze the variation trend and reasons of stratified stability.
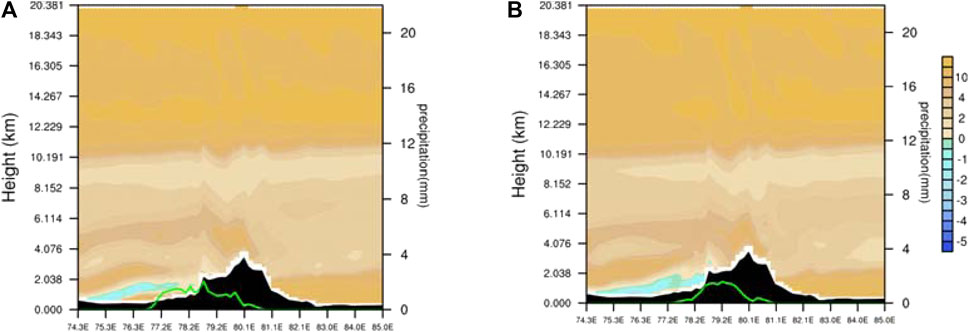
FIGURE 5. Vertical profile of stratified stability (shaded, units: 10−3 k m−1) along 44.5°N at 1400 UTC (A) and 1600 UTC (B) 30 November 2018. Green solid line denotes 30-min accumulated snowfall (right ordinate; units: mm).
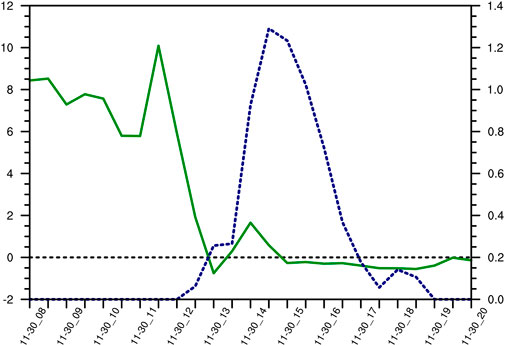
FIGURE 6. Time series of stratified stability (solid line, the left ordinate; units: 10−3 k m−1) and snowfall (dashed line, the right ordinate; units: mm) at 6 km at 77.7°E, 44°N.
Figure 7 shows the vertical profile of individual variations of stratified stability, there are negative centers in the lower and middle layers of the snowfall area, and the intensity reaches −3 × 10⁻⁶ k m-1 s-1 and −5 × 10⁻⁶ k m-1 s-1, respectively. In addition, the negative centers in the middle and lower layers are located in the easterly region of the snow zone (around 80.2°E), and the snow zone also moves to the southeast in the next stage, thus the snowfall occurs in the area where stratified instability is significant. As the snowfall develops, the stratified stability in the snowfall area shows a decreasing trend, the stability decreases, and the instability increases. The vertical distribution of the potential divergence is similar to that of stratified stability individual variations. A negative center in the lower layer with an intensity reaches −5 × 10⁻⁶ K m-1 s-1, it develops upward in a fluctuating pattern, triggering instability (Figure 7B). Consequently, during the snowfall triggering stage, the variation of stratified stability mainly depends on the potential divergence. Additionally, the vertical gradient of potential-temperature comprehensive force is related to frictional dissipation. However, compared with the potential divergence, the vertical gradient of potential-temperature comprehensive force hardly causes the variation of stratified stability (Figure 7C), therefore, it can be neglected.
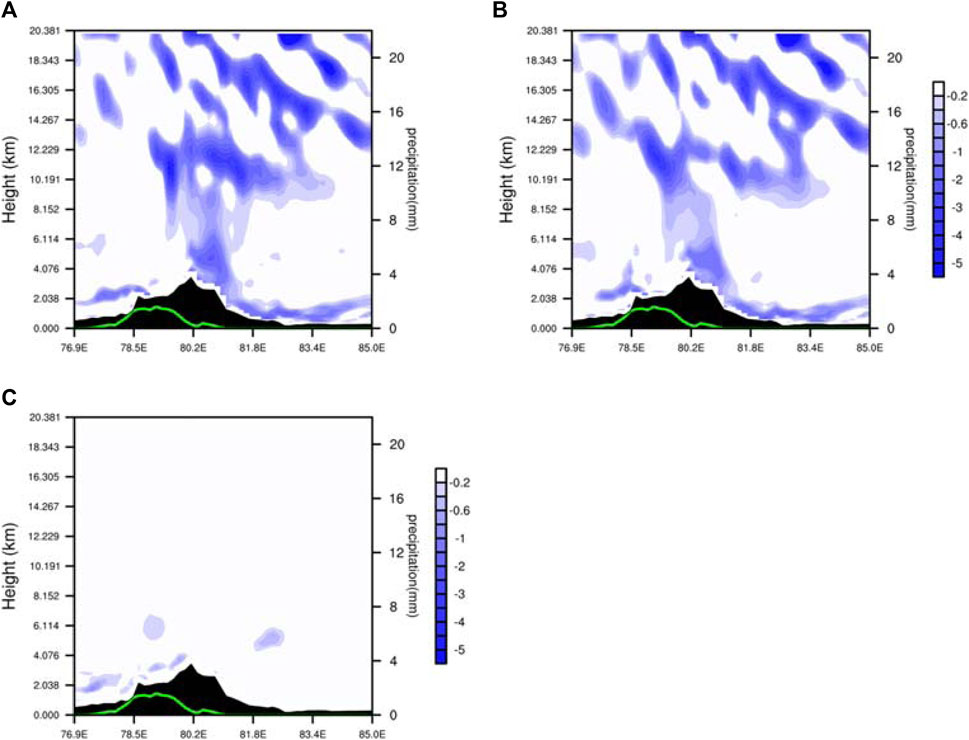
FIGURE 7. Vertical profile of the variations of stratified stability [(A), shaded, units: 10−6 k m-1 s-1), potential divergence (B), shaded, units: 10−6 k m-1 s-1) and the vertical gradient of potential-temperature comprehensive force (C), shaded, units: 10−6 k m-1 s-1] along 44.5°N at 1300 UTC 30 November 2018. Green solid line denotes 30-min accumulated snowfall (the right ordinate; units: mm).
The above diagnostic analysis found that potential divergence is the key factor of atmospheric stratified stability to instability. Potential divergence is decomposed into flow-around and flow-over components, and the topographic effect on the variation of stratified stability is analyzed. Figures 8B,C show the horizontal distribution of flow-around and flow-over components on the first layer of the model layer during the snowfall triggering stage, both the flow over and flow around terrain will lead to potential divergence variation, of which the flow-over effect is more significant. Flow-over potential divergence is the main component of potential divergence, which is mainly manifested as a large range of negative values in the snowfall area, and the central strength reaches −6 × 10⁻⁶ K m-1 s-1. The negative center of the flow-over potential divergence is located in the southeast side of the snow belt, which is consistent with the previous analysis.
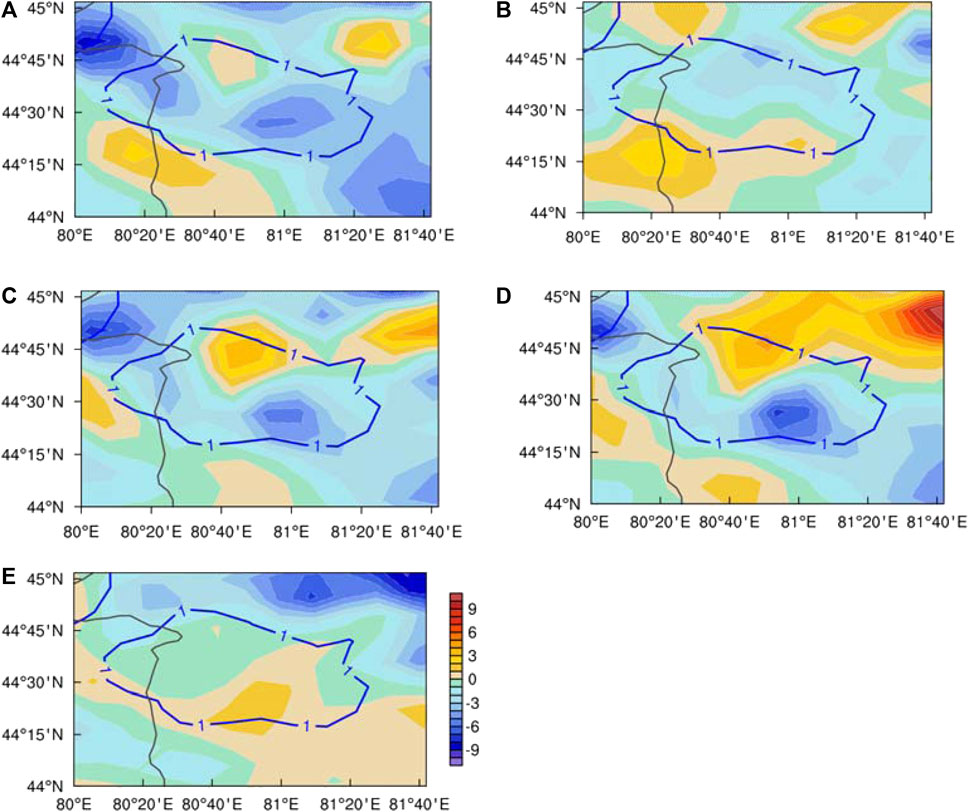
FIGURE 8. (A) Potential divergence (shaded), (B) flow-around potential divergence (shaded), (C) flow-over potential divergence (shaded), (D) vertical shear component of flow-over potential divergence (shaded) and (E) divergence component of flow-over potential divergence (shaded, units: 10−6 k m-1 s-1) on the first layer of the model layer at 1600 UTC on Nov. 30, 2018, where the blue contour is 1-h accumulated stimulated snowfall (units: mm).
Flow-over potential divergence can be divided into vertical wind shear and horizontal divergence. The vertical wind shear component has a negative center in the southeast side of the snowfall area, and the center intensity reaches −8 × 10⁻⁶ K m-1 s-1 (Figure 8D), while the value of the horizontal divergence component is small, which contributes little to the variation of flow-over potential divergence (Figure 8E). In conclusion, the negative anomaly of flow-over potential divergence is mainly caused by vertical wind shear. Vertical wind shear is formed by the coupling effect of vertical gradient of horizontal wind and horizontal gradient of equivalent potential temperature, that is, the horizontal advection effect of flow-over vertical shear to equivalent potential temperature. The horizontal advection transport of equivalent potential temperature caused by the flow-over vertical shear induces the instability of snowfall area, which is a process of combining dynamic and thermodynamic. The essence of this process is that when airflow passes through the terrain, the horizontal wind field formed by the flow-over dynamic effects is unevenly distributed in the vertical direction, leading to heat transport and the fomation of thermal advection.
In the snowfall triggering stage, the vertical shear of zonal flow-over component increases with height at the lower level (
Since there is a flow-over potential divergence anomaly when snowfall is triggered, the regional average flow-over potential divergence and snowfall in the snowfall area during the snowy period are further fitted to test the relationship between them. The fit between the values of flow-over potential divergence and snowfall is performed by linear regression (y = ax+b, where y represents snowfall and x represents the flow-over potential divergence). Figure 9 shows the derived relationship with a = −0.28 and b = 1.44 when hourly snowfall amount is more than 1 mm, that is:
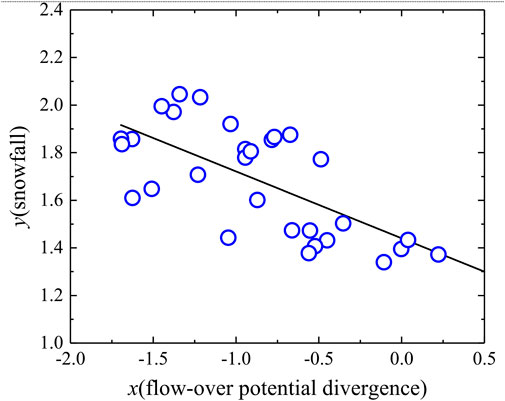
FIGURE 9. The fit between the values of flow-over potential divergence (units: 10−6 k m-1) and snowfall (units: mm) by linear regression (y = ax+b, where y is snowfall and x is flow-over potential divergence).
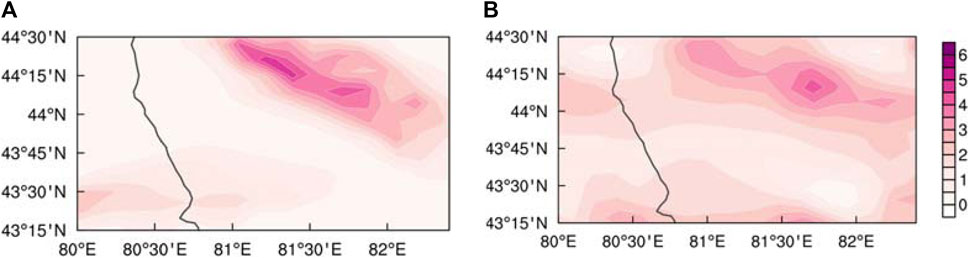
FIGURE 10. (A) 1-h accumulated stimulated snowfall (units: mm) and (B) 1-h accumulated snowfall retrieval of the fitted relation on the first layer of the model layer at 1600 UTC on 30 Nov 2018.
At this time, the correlation coefficient between these two variables reaches up to 0.71. And the root mean square error between the snowfall retrieval of the fitted relation and the simulated snowfall is small (about 0.187). Since flow-over potential divergence may provide a negative correlation with the topographic snowfall to some extent, it is helpful for topographic snowfall forecasting in the future. As shown in Figure 9, in order to verify the validity of the fitted relation, the horizontal distribution of the hourly snowfall retrieved by the fitted relation and the simulated hourly snowfall are compared. It is found that hourly snowfall retrieval of the fitted relation has a similar distribution with hourly simulated snowfall, and the snowfall center is retrieved. Therefore, flow-over potential divergence holds predictive significance for snowfall. Nevertheless, further work is required to validate this relationship. However, in the present study, we have taken an important first step, that is, to derive flow-over potential divergence in the WRF model mass terrain-following coordinate system and attempt to test flow-over potential divergence’s correlation with topographic snowfall via snowfall case studies. Thus, we have laid the foundations for further topographic snowfall studies in Central Asia in the future. It is worth noting that the precision of the forecast outcomes is highly dependent on the accuracy of the wind field that is directly predicted by the numerical model. In case the numerical model predicts the wind field inaccurately, particularly in regions with intricate terrain, the flow-over divergence diagnosis-based precipitation forecast results would also likely be considerably erroneous.
Symmetric instability refers to the phenomenon that an air parcel is convectively stable and inertially stable when moving vertically or horizontally but becomes unstable when it experiences tilted ascent. It can be diagnosed by potential vorticity, and a negative value of potential vorticity indicates the existence of conditionally symmetric instability in the atmosphere (Hoskin, 1974), thus when potential vorticity is negative, the atmosphere is symmetrically unstable. As shown in Figure 11, in the lower layer of the snowfall area (η=0.9969 to η=0.9558), symmetric instability occurs in the stably stratified area, with a central intensity of −6 × 10⁻⁶ m K s−3 Pa−1. Furthermore, the effect of topography on the symmetric instability is analyzed, and the potential vorticity in the lower layer are decomposed into flow-around potential vorticity, flow-over potential vorticity and vertical potential vorticity. The flow-around component is the main component of the potential vorticity (Figure 12A), and the vertical distribution at the lower level is similar to that of the total potential vorticity. Therefore, symmetric instability mainly depends on flow-around wind field. Flow over also causes weak symmetric instability near the surface (Figure 12B), while vertical potential vorticity term is negligible (Figure 12C). The flow-around potential vorticity is composed of horizontal divergence and vertical wind shear, vertical wind shear in the lower levels causes symmetric instability (Figure 12E), that is, by the coupling effect of the vertical gradient of the horizontal wind and the horizontal gradient of the generalized potential temperature. Moreover, both in the lower and upper levels, strong vertical advection transport of the generalized potential temperature contributes to symmetric instability in the snowfall area.
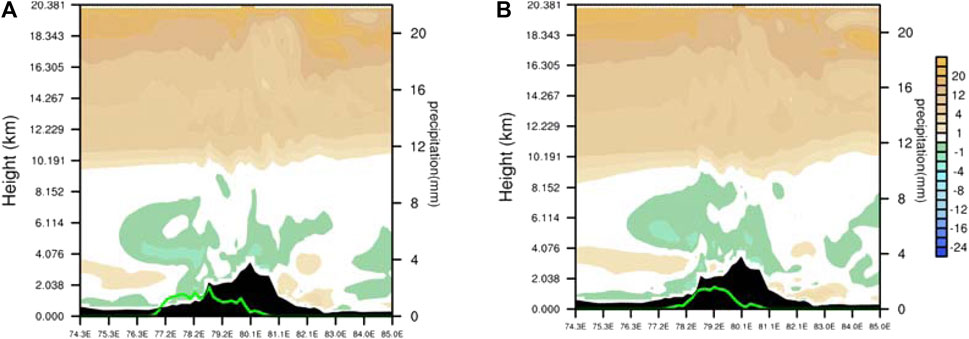
FIGURE 11. Vertical profile of potential vorticity (shaded, units: 10−6 m k s−3 pa−1) along 44.5°N at 1400 UTC (A) and 1600 UTC (B) 30 November 2018. Green solid line denotes 30-min accumulated snowfall (the right ordinate units mm).
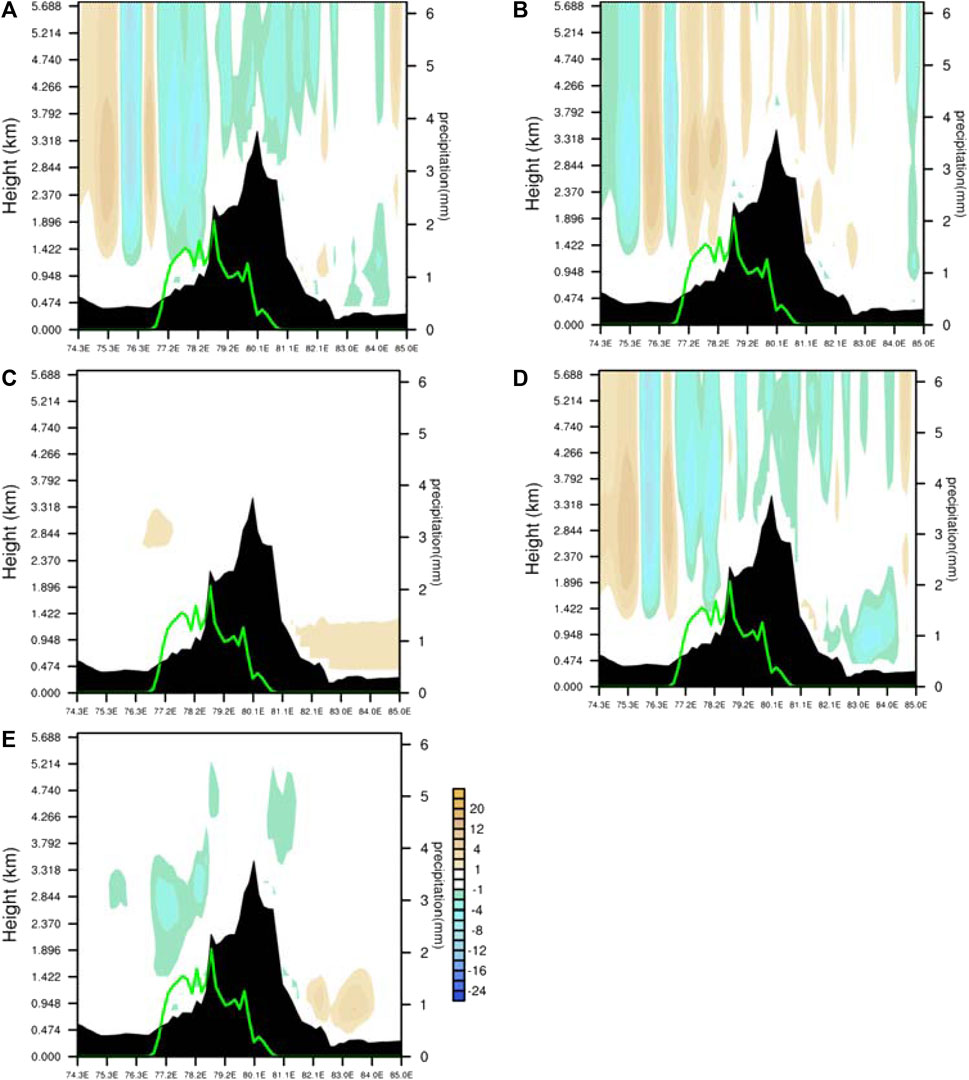
FIGURE 12. Vertical profile of flow-around potential vorticity [(A), shaded, units: 10−6 m k s−3 pa−1], flow-over potential vorticity [(B), shaded, units: 10−6 m k s−3 pa−1], vertical potential vorticity [(C), shaded, units: 10−6 m k s−3 pa−1], the divergence component [(D), shaded, units: 10−6 m k s−3 pa−1] and the vertical shear component of flow-around potential vorticity [(E), shaded, units: 10−6 m k s−3 pa−1] along 44.5ºN at 1400 UTC 30 November 2018. Green solid line denotes 30-min accumulated snowfall (the right ordinate; units: mm).
5 Dynamic analysis
In addition to the thermal effects on the precipitation process, terrain also exerts dynamic influences which will be discussed in detail here. Vorticity and divergence are calculated using model-layer data. As shown in Figure 13, there is weak anticyclonic vorticity in the lower layer of snowfall region, in addition, the east side of the snowfall area has a strong divergence, and the west side has a weaker convergence at 1600 UTC (Figures 13A, B). The distribution of the total vorticity is basically the same as the vorticity from flow over terrain, indicating that the anticyclonic vorticity in the snowfall area is mainly caused by the flow-over component (Figure 13E). On the other hand, the distribution of the total divergence is closer to the flow-around component, which means that the weak convergence on the west side and the strong divergence on the east side of the snow belt are mainly caused by the flow-around component (Figure 13D).
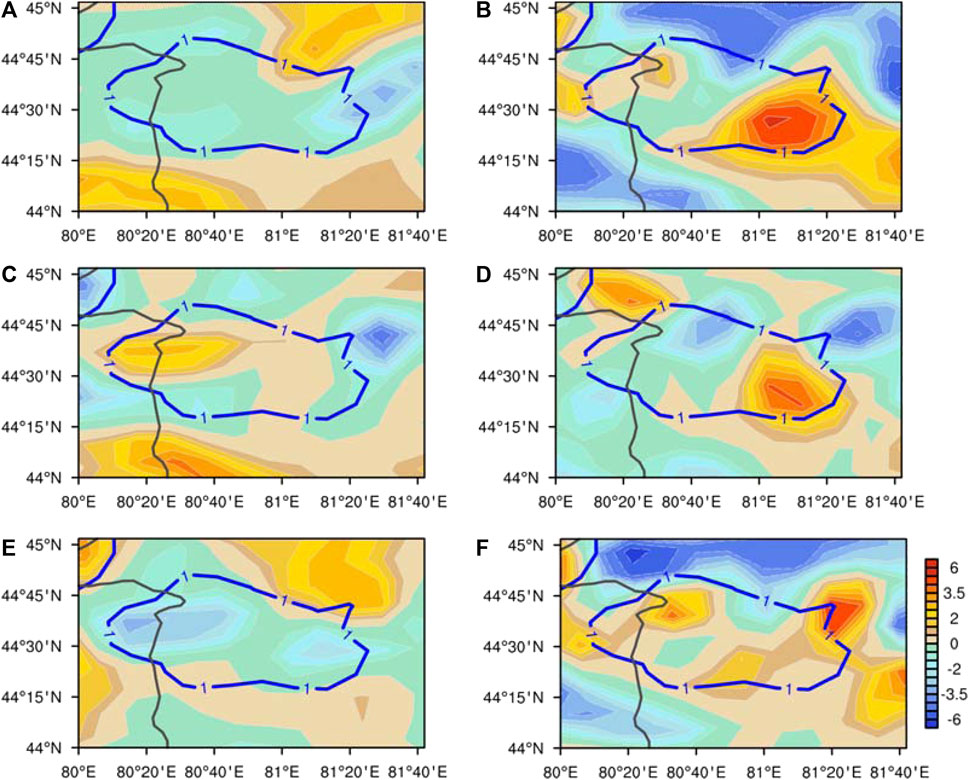
FIGURE 13. (A) Total vorticity (shaded, units: 10−4 s -1), (B) total divergence (shaded units: 10−4 s -1) (C) vorticity of the flow-around component (shaded, units: 10−4 s -1), (D) divergence of the flow-around component (shaded, units: 10−4 s -1) (E) vorticity of the flow-over component (shaded, units: 10−4 s -1) and (F) divergence of the flow-over component (shaded, units: 10−4 s -1) overlaid by snow belt (blue contour, 1-h accumulated stimulated snowfall, units: mm), on the first layer of the model layer at 1600 UTC on 30 Nov 2018.
Overall, cyclonic vorticity and divergence in the snowfall area are mainly caused by flow-around wind, while anticyclonic and convergence are caused by flow-over wind.
The development of precipitation is accompanied by changes in energy. Khouider et al. (2012) demonstrated that convective motion restricts the production and conversion of atmospheric kinetic energy, which is characterized by kinetic energy transfer from a small-scale system to a large-scale system. Based on the kinetic energy tendency equation of the terrain-following coordinate system, the contribution of near-surface flow around and over terrain to the horizontal kinetic energy of the snowfall process was analyzed.
Time series of domain averaged kinetic energy and its components in Figure 14 shows that before the snow, kinetic energy increased over time. Once snowfall is triggered, kinetic energy reaches the strongest in the first layer of the model, with a maximum kinetic energy of 180 m2 s−2. Furthermore, the averaged flow-over kinetic energy in the first and fifth layers is greater than the averaged flow-around kinetic energy, indicating that the intensity of flow-over energy is stronger than flow-around energy on the lower layer of the snow area. Additionally, the magnitude of the coupling kinetic energy of the flow around and flow over terrain is small and can be ignored.
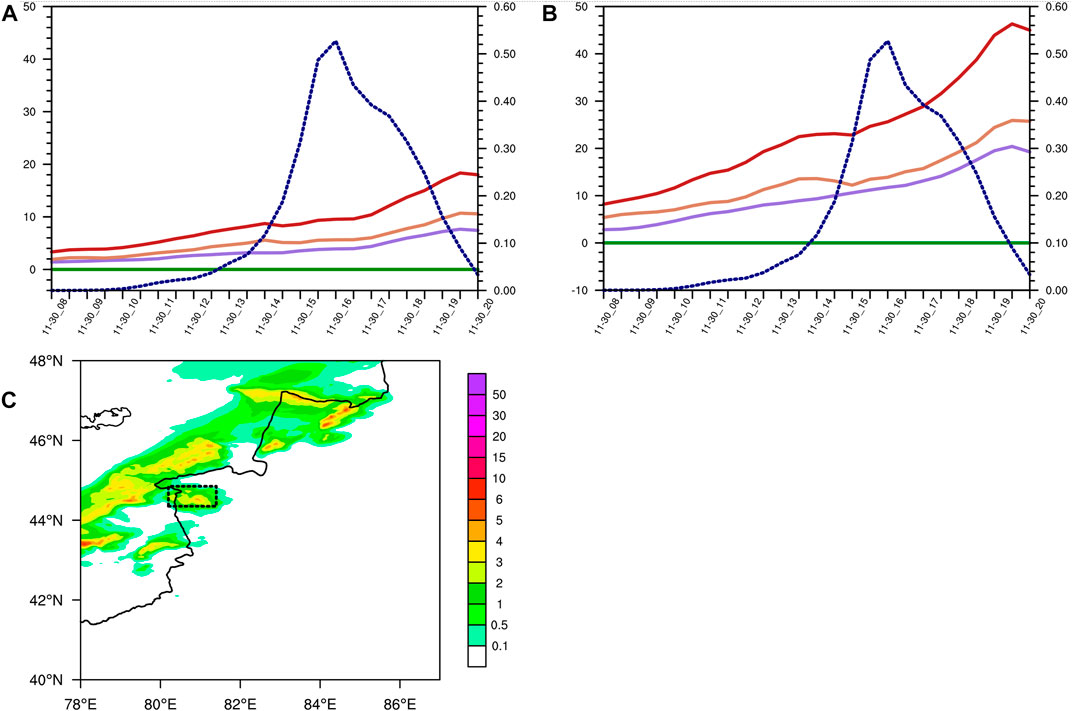
FIGURE 14. Time series of domain averaged kinetic energy (red solid line) kinetic energy of the flow-around component (purple solid line), flow-over component (brown solid line), coupling kinetic energy of the flow around and flow over terrain (green solid line, the left ordinate; units: 101 m2 s−2) and snowfall (dashed line, the right ordinate; units: mm) on the first layer (A) and the fifth layer (B) of the model layer. The target domain is marked by black rectangular in Figure 13C (C) The simulation of 1 hour accumulated precipitation at 1600UTC on 30 November Units are mm, black rectangular is the target domains for the following analysis.
The left-side and right-side terms of the horizontal kinetic energy tendency Eq. 12 are calculated with the model layer data to analyze the reasons for the local variation of horizontal kinetic energy. Figure 15 shows the zonal profiles of the local variation term of kinetic energy and terms forcing the variation of kinetic energy in the snowfall triggering stage. As shown in Figure 15A, there is a positive high value region of local kinetic energy variation in the snow zone, which extends upward from the lower layer of the snow zone, and the maximum value center is located in the middle layer above the snow zone (η=0.8631 to η=0.1858). The intensity reaches 20 × 10−2 m2 s−3, and the fluctuation is upward-tilting. The high value of the local variation of kinetic energy is mainly caused by the zonal velocity forcing, and the vertical distribution of the zonal velocity forcing is most similar to the local variation of kinetic energy (Figure 15C). The zonal velocity forcing has a large value area in the center of the snow belt, with a central intensity as high as 20 × 10−2 m2 s−3. In addition, the large value center is also located in the middle layer (η=0.1858), and the fluctuation demonstrates an upward-tilting and eastward pattern. Figures 15B,D show the vertical distribution of meridional velocity forcing term and vertical advection forcing term, respectively. These two terms also have positive contributions to the change of kinetic energy in the snowfall area, and both propagate upward in a fluctuating pattern. However, they are relatively smaller than the zonal velocity forcing. Therefore, the kinetic energy in the snowfall area will gradually increase under the influence of these forcing terms. We will further analyze the key factor causing the development and variation of kinetic energy, namely the zonal velocity forcing.
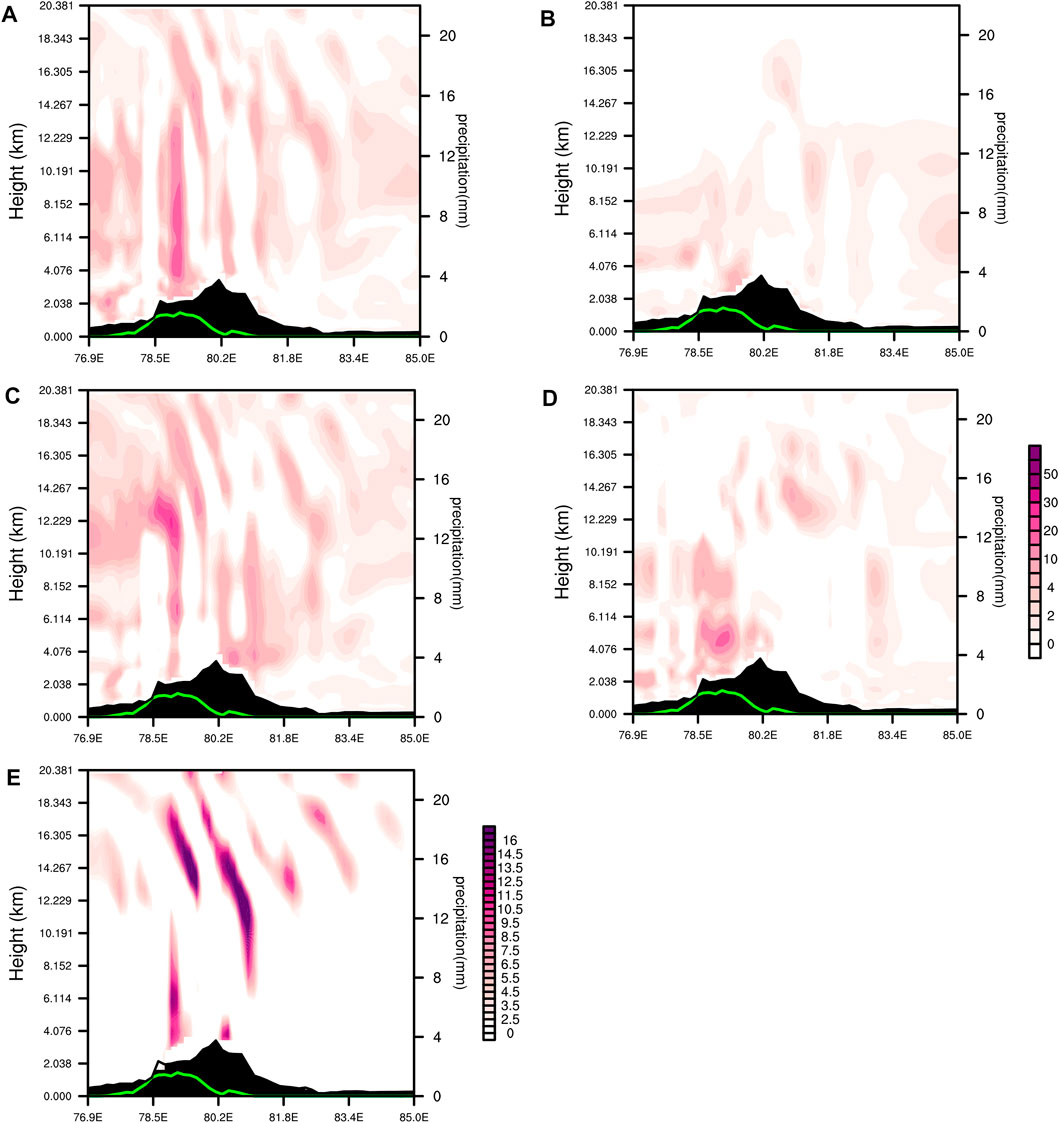
FIGURE 15. Vertical profile of local change of kinetic energy [(A), shaded, units: 10−2 m2 s−3], meridional velocity forcing [(B), shaded, units: 10−2 m2 s−3], zonal velocity forcing [(C), shaded, units: 10−2 m2 s−3], vertical advection forcing [(D), shaded, units: 10−2 m2 s−3] and zonal pressure work [(E), shaded, units: m2 s−3] along 44.5°N at 1300 UTC 30 November 2018. Green solid line denotes 30-min accumulated snowfall (the right ordinate; units: mm).
Zonal velocity forcing
According to Eq. 12, the work done by the zonal pressure gradient force is regarded as flow-over component
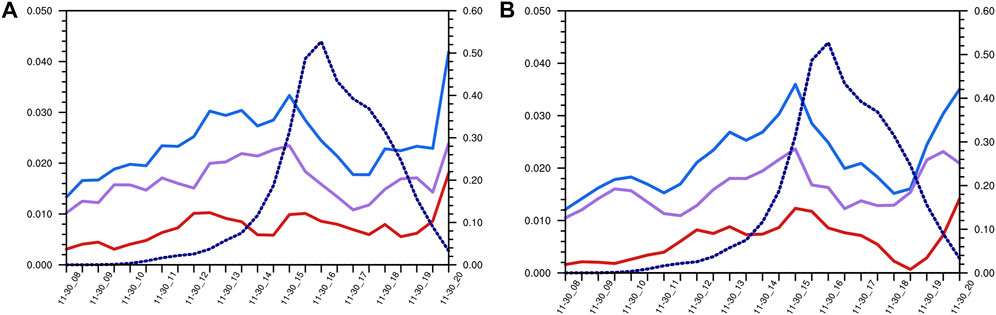
FIGURE 16. Time series of domain averaged zonal pressure work (blue solid line), pressure work of zonal flow-around wind (red solid line), pressure work of zonal flow-over wind (purple solid line, the left ordinate; units: m2 s−3) and snowfall (dashed line, the right ordinate; units: mm) on the first layer (A) and the fifth layer (B) of the model layer.
6 Conclusion
Based on the topographic height distribution, the near-surface wind field of the WRF model is decomposed into flow around and flow over terrain. In view of the triggering moment of snowstorms in Xinjiang on 30 November 2018, the effects of flow around and over terrain on dynamics, water vapor transport and stability were analyzed, and the following conclusions were drawn:
Primarily, the flow-around field is the main flow field in transporting water vapor and causes the convergence of water vapor. Moreover, there are symmetric instability and stratified instability in the snowfall area. The horizontal advection transport of generalized potential temperature by the flow-around vertical shear and the vertical advection transport of generalized potential temperature by the flow-around divergence cause the negative potential vorticity value of the potential vorticity, thus causing symmetric instability. The meridional gradient of near-surface potential temperature is closely related to the quasi-east–west trend of the terrain. On the model plane, the potential temperature on the low terrain is lower, and the potential temperature on the high terrain is higher, thus forming a large horizontal gradient of potential temperature at steep terrain. The flow-over potential divergence will cause changes in the stratified stability. The horizontal advection transport of equivalent potential temperature caused by the flow-over vertical shear leads to a higher negative value of flow-over potential divergence in the snowfall area, thus enhancing instability. Comparatively, the meridional advection transport of flow-over vertical shear to equivalent potential temperature is more significant. Due to the significant flow-over potential divergence anomalies in the snowfall area during the snow triggering stage, the correlation of flow-over potential divergence with topographic snowfall is tested through this snowfall case studies. We found flow-over potential divergence may provide a negative correlation with the topographic snowfall to a certain extent, when the snowfall is greater than or equal to 1 mm/h, the correlation coefficient between them reaches 0.71. This correlation is helpful for topographic snowfall forecasting and the foundations for further topographic snowfall studies in Central Asia in the future is laid. Certainly, further work is required to verify this relationship.
In terms of topographic dynamic effects, the cyclonic vorticity of flow around the near surface is significant in the snowfall area, therefore, the flow-around component generates favorable vortical circulation conditions for snowfall. Near-surface vertical motion is mainly forced by flow over mountains, providing triggering conditions for snowfall. Furthermore, the flow-over kinetic energy in the snow area is stronger, and the work done by the pressure gradient force caused by flow over terrain enhances the near-surface horizontal kinetic energy. Additionally, we summarize a conceptual model (Figure 17) to intuitively understand the dynamic mechanism of airflows over and around topography during this snowfall event and use it for forecasting practice of topographic snowfall in Central Asia in the future.
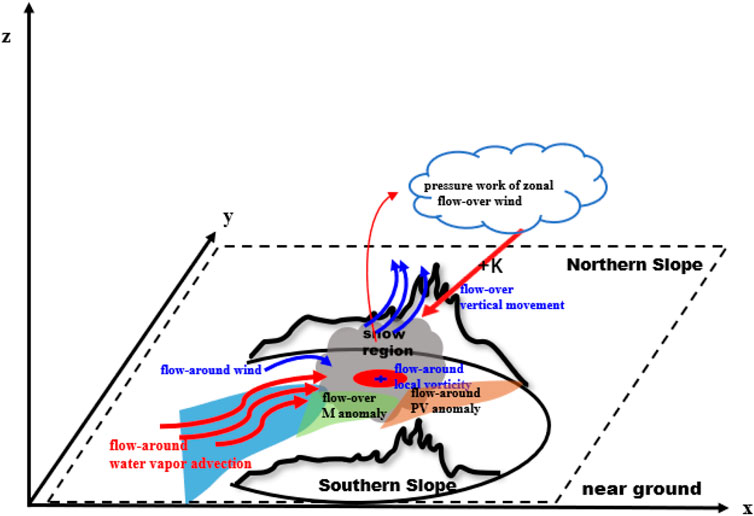
FIGURE 17. Conceptual model of the topographic dynamic effect of airflow in the snowy weather process The black curve denotes terrain, the gray shading represents the snow area The red curved arrows denote flow-around wind, the blue curved arrows denote flow-over wind, and the red ellipse indicates the local convergence. K represents the kinetic energy, the orange shading represents flow-around PV anomaly, the blue shading represents flow-around water vapor advection, and the green shading represents flow-over potential divergence.
Data availability statement
The raw data supporting the conclusion of this article will be made available by the authors, without undue reservation.
Author contributions
This manuscript was analyzed and wrote by SM. This paper was under the guidance of the LR, he contributed to conception and design of the study. RC, BJ, and KZ provided guidance in the calculation process. All authors contributed to the article and approved the submitted version.
Funding
Strategic Priority Research Program of the Chinese Academy of Sciences (Grant XDA17010105), National Key Research and Development Project (Grant 2018YFC1507104), Key Scientific and Technology Research and Development Program of Jilin Province (Grant 20180201035SF), National Natural Science Foundation of China (Grant 41775140, 42275010).
Acknowledgments
The authors are thankful to the editors and reviewers for their constructive and thoughtful comments that have significantly improved the quality of this paper. The computing for this project was performed at the National Key Scientific and Technological Infrastructure Project “EarthLab.”
Conflict of interest
The authors declare that the research was conducted in the absence of any commercial or financial relationships that could be construed as a potential conflict of interest.
Publisher’s note
All claims expressed in this article are solely those of the authors and do not necessarily represent those of their affiliated organizations, or those of the publisher, the editors and the reviewers. Any product that may be evaluated in this article, or claim that may be made by its manufacturer, is not guaranteed or endorsed by the publisher.
Supplementary material
The Supplementary Material for this article can be found online at: https://www.frontiersin.org/articles/10.3389/feart.2023.1136356/full#supplementary-material
References
Bothe, O., Fraedrich, K., and Zhu, X. (2012). Precipitation climate of Central Asia and the large-scale atmospheric circulation. Theor. Appl. Climatol. 108, 345–354. doi:10.1007/s00704-011-0537-2
Ding, Y. H., Ren, G. Y., and Shi, G. Y. (2006). National assessment report of climate change(I): Climate change in China and its future trend. Adv. Clim. Chang. Res. 2, 3–8. (in Chinese). doi:10.3969/j.issn.1673-1719.2006.01.001
Duan, W. L., He, B., and Takala, K. (2015). Changes of precipitation amounts and extremes over Japan between 1901 and 2012 and their connection to climate indices. Clim. Dyn. 45, 1–20. doi:10.1007/s00382-015-2778-8
Gao, S. T., Wang, X. R., and Zhou, Y. S. (2004). Generation of generalized moist potential vorticity in a frictionless and moist adiabatic flow. Geophy. Res. Lett. 31, L12113. doi:10.1029/2003GL019152
Guo, N., Zhou, Y., and Yang, L. (2021). Statistical analysis of Central Asian vortices and their influence on precipitation in Xinjiang. Atmos. Res. 249, 105327. doi:10.1016/j.atmosres.2020.105327
Hoskins, B. J. (1974). The role of potential vorticity in symmetric stability and instability. Quart. J. Roy. Meteor. Soc. 100, 480–482. doi:10.1002/qj.49710042520
Huang, G., and Zhou, L. T. (2004). The variability of the wind system circulating round the west side of the Tibetan plateau and its relation to the east asian summer monsoon and summer rainfall in north China. Clim. Environ. Res. 9, 316–330. (in Chinese). doi:10.3969/j.issn.1006-9585.2004.02.008
IPCC (2021). Climate change 2021 the physical science basis Available at: https://www.ipcc.ch/report/ar6/wg1/downloads/report/IPCC_AR6_WGI_Full_Report.pdf
Jagannathan, A., Winters, K. B., and Armi, L. (2017). Stability of stratified downslope flows with an overlying stagnant isolating layer. J. Fluid Mech. 810, 392–411. doi:10.1017/jfm.2016.683
Jagannathan, A., Winters, K. B., and Armi, L. (2019). Stratified flows over and around long dynamically tall mountain ridges. J. Atmos. Sci. 76, 1265–1287. doi:10.1175/JAS-D-18-0145.1
Jagannathan, A., Winters, K. B., and Armi, L. (2020). The effect of a strong density step on blocked stratified flow over topography. J. Fluid Mech. 889, A23. doi:10.1017/jfm.2020.87
Jiang, J., Zhou, T., and Chen, X. (2021). Central asian precipitation shaped by the tropical pacific decadal variability and the atlantic multidecadal variability. J. Clim. 34, 7441–7553. doi:10.1175/JCLI-D-20-0905.1
Jin, Y., and Li, G. P. (2021). Impact of flow around and flow over in sudden rainstorm on mountains. Plateau Meteoro 40, 314–323. (in Chinese). doi:10.7522/j.issn.1000-0534.2020.00041
Khouider, B., Han, Y., and Biello, J. A. (2012). Convective momentum transport in a simple multicloud model for organized convection. J. Atmos. Sci. 69, 281–302. doi:10.1175/JAS-D-11-042.1
Li, F., Li, J. P., and Li, Y. J. (2012). Climatological characteristics of flow around and flow over the Tibetan plateau. Chin. J. Atmos. Sci. 36, 1236–1252. (in Chinese). doi:10.3878/j.issn.1006-9895.2012.11214
Ma, S., Cao, J., and Zhao, H. (2022a). Decomposition of water vapor flux divergence and its application to a blizzard event over Ili valley in central Asia during 30 Nov to 1 dec 2018. Atmos. Res. 270, 106079.
Ma, S. P., Ran, L. K., and Cao, J. (2022b). Characteristics for the sources and sinks of gravity waves in an orographic heavy snowfall event front. Earth Sci. China 2022. doi:10.1007/s11707-021-0961-2
Ma, S. P., Ran, L. K., and Cao, J. (2021). Diagnosis and analysis of vertical motion during complex topographical heavy snowfall. Chin. J. Atmos. Sci. 45, 1127–1145. (in Chinese). doi:10.3878/j.issn.1006-9895.2105.20206
Manabe, S., and Terpstra, T. B. (1974). The effects of mountains on the general circulation of the atmosphere as identified by numerical experiments. J. Atmos. Sci. 31, 3–42. doi:10.1175/1520-0469(1974)031<0003:TEOMOT>2.0.CO;2
Ran, L. K., Liu, L., and Li, N. (2013). The analysis of the potential-divergence wave activity density and its application to typhoon precipitation. Chin. J. Geophys. 56, 3285–3301. (in Chinese). doi:10.6038/cjg20131006
Shi, Y. G., Sun, Z. B., and Yang, Q. (2008). Characteristics of area precipitation in Xinjiang region with its variations. J. Appl. Meteor. Sci. 19, 326–332. (in Chinese). doi:10.3969/j.issn.1001-7313.2008.03.008
Siedersleben, S. K., and Gohm, A. (2016). The missing link between terrain-induced potential vorticity banners and banded convection. Mon. Wea. Rev. 144, 4063–4080. doi:10.1175/MWR-D-16-0042.1
Skamarock, W. C., Klemp, J. B., Dudhia, J., Gill, D. O., Liu, Z., Berner, J., et al. (2019). A description of the advanced research WRF. Version 4. NCAR Tech. Note NCAR/TN-556+STR.
Smith, R. B. (2004). “Mountain meteorology and regional climates,” in Atmospheric turbulence and mesoscale meteorology Editors E. Fedorovich, R. Rotunno, and B. Stevens (Cambridge, United Kingdom: Cambridge University Press).
Trenberth, K. E., and Chen, S. C. (1988). Planetary waves kinematically forced by Himalayan orography. J. Atmos. Sci. 45, 2934–2948. doi:10.1175/1520-0469(1988)045<2934:PWKFBH>2.0.CO;2
Vaughan, G., Antonescu, B., Schultz, D. M., and Dearden, C. (2017). Invigoration and capping of a convective rainband ahead of a potential vorticity anomaly. Mon. Wea. Rev. 145, 2093–2117. doi:10.1175/MWR-D-16-0397.1
Wang, H., Wang, S. L., and Yu, X. J. (2020). Spatial-temporal variation of snow cover in Xinjiang based on surface observation from 1961 to 2017. J. Glaciol. Geocryol. 42, 72–80. (in Chinese). doi:10.7522/j.issn.1000-0240.2020.0010
Wells, H., Webster, S., and Brown, A. (2005). The effect of rotation on the pressure drag force produced by flow around long mountain ridges. Quart. J. Roy. Meteor. Soc. 131, 1321–1338. doi:10.1256/qj.04.37
Winters, K. B., and Armi, L. (2012). Hydraulic control of continuously stratified flow over an obstacle. J. Fluid Mech. 700, 502–513. doi:10.1017/jfm.2012.157
Winters, K. B., and Armi, L. (2014). Topographic control of stratified flows: Upstream jets, blocking and isolating layers. J. Fluid Mech. 753, 80–103. doi:10.1017/jfm.2014.363
Wu, G. (1984). The nonlinear response of the atmosphere to large –scale mechanical and thermal forcing. J. Atmos. Sci. 41, 2456–2476. doi:10.1175/1520-0469(1984)041<2456:TNROTA>2.0.CO;2
Yang, L. M., Zhang, Y. H., and Qin, H. (2015). Some advances and problems of middle- Asia vortex. Desert Oasis Meteorology 9, 1–8. doi:10.3969/j.issn.1002-0799.2015.05.001
Ye, D. Z., and Gao, Y. X. (1979). Qinghai-xizang plateau meteorology. Beijing: Science Press, 278pp. (in Chinese).
Zeng, Y., and Yang, L. (2020). Triggering mechanism of an extreme rainstorm process near the Tianshan Mountains in Xinjiang, an arid region in China, based on a numerical simulation. Adv. Meteor. 2020, 8828060. doi:10.1155/2020/8828060
Zhao, W., Abhishek, B. S. T., Zhang, J., Zhao, Y., and Kinouchi, T. (2023). Spatiotemporal variability of current and future sub-daily rainfall in Japan using state-of-the-art high-quality data sets. Water Resour. Res. 59, 4. doi:10.1029/2022WR034305
Zhao, W., and Abhishek, T. K. (2022). A framework for quantifying climate-informed heavy rainfall change: Implications for adaptation strategies. Sci. Total Environ. 835, 155553. doi:10.1016/j.scitotenv.2022.155553
Keywords: flow around, flow over, potential divergence, potential vorticity, northern slope of the Tianshan mountains, Xinjiang blizzard
Citation: Ma S, Cai R, Ran L, Jiao B, Zhou K and Guo A (2023) Decomposition of airflow over topography and its application to a topographic blizzard event in central Asia. Front. Earth Sci. 11:1136356. doi: 10.3389/feart.2023.1136356
Received: 03 January 2023; Accepted: 18 May 2023;
Published: 07 June 2023.
Edited by:
Yanping Li, University of Saskatchewan, CanadaReviewed by:
Mingxuan Chen, China Meteorological Administration, ChinaZhenhua Li, University of Saskatchewan, Canada
Copyright © 2023 Ma, Cai, Ran, Jiao, Zhou and Guo. This is an open-access article distributed under the terms of the Creative Commons Attribution License (CC BY). The use, distribution or reproduction in other forums is permitted, provided the original author(s) and the copyright owner(s) are credited and that the original publication in this journal is cited, in accordance with accepted academic practice. No use, distribution or reproduction is permitted which does not comply with these terms.
*Correspondence: Ren Cai, NzY0MjYwMjJAcXEuY29t; Lingkun Ran, cmxrQG1haWwuaWFwLmFjLmNu