 Guodong Mei1,2†
 Sha Wang
 Lijie Guo
- 1BGRIMM Technology Group, Beijing, China
- 2National Centre for International Research on Green Metal Mining, Beijing, China
Under forecasting rainfall condition, rainfall flows into the tailings pond instantaneously, causing water level rising rapidly, thus threatening the safety of the tailings pond. Therefore, it is of great importance to give auxiliary flood discharge measures in emergency situation. This study investigated the optimized calculation algorithm of two combined schemes of lowering the coverplate of tailing ponds and installing additional drainage pumps to determine the recommended scheme of auxiliary drainage measures for tailing ponds under forecast rainfall and proposed the corresponding prediction and calculation method based on the basic data of the water level-reservoir capacity curve of tailing ponds, forecast rainfall parameters, and flood discharge system parameters. The results showed that compared with the precise algorithm, the optimized algorithm does not need to call the main procedure of flood regulation calculation and is of high calculation efficiency and accuracy, calculation time can be controlled within 0.05s. Through the optimized algorithm, the recommended auxiliary drainage scheme for forecast rainfall can be obtained immediately, which can effectively guide tailing pond flood control and drainage activities during the flood season.
1 Introduction
The tailings pond, a special structure attached to the mine, is mainly used to stockpile tailings and waste slag from ore beneficiation. Upstream tailings ponds are designed with a flood drainage structure to discharge the clarified reservoir water that enters the pond with the tailings, as well as to discharge the incoming floods to ensure that the tailings pond can withstand floods under the design standard. Due to the dynamic changes in the accumulation height and reservoir water level of upstream tailings ponds, the design of the intake structure uses a sloping flume or a drainage shaft with coverplates (Forbes et al., 1991). As the tailings’ elevation rises, the number of coverplates is gradually increased, realizing dynamic regulation (Saliba et al., 2011). The design of the coverplates is similar to the role of gates in hydraulic buildings. From the load bearing point of view, the coverplate of the flood discharge facility of the tailings pond can withstand sediment or water pressure. Therefore, when the coverplate is covered by the tailings, it should not be opened again; however, the coverplate within the clarified water range can be opened again to increase the discharge capacity of the flood discharge system under a higher hydraulic head. As the flood discharge capacity of the tailings pond is generally very limited, a overtopping dam failure is very likely to occur when the tailings pond encounters flooding, especially when the prior emptying time is short or the flood discharging capacity is insufficient (Grimalt et al., 1999; Rico et al., 2008; Cambridge and Shaw, 2019). Meanwhile, the rise of water level increases the risk of liquefaction of the dam surface (Cambridge, 2014; Zanbak, 2019), which in turn reduces the anti-sliding stability of the dam. Therefore, it is important to develop a tailings pond coverplate lowering and auxiliary drainage scheme to increase the temporary drainage capacity to prevent dam failure and overtopping due to extreme rainfall during the flood season.
Owing to global warming, extreme weather is increasing every year. At present, the prediction of extreme weather mainly relies on meteorological rainfall forecasts. Because of the timing-constraint nature of weather forecasts and the generally limited discharge capacity of flood discharge systems, the incoming flood from the rainfall confluence will pose a greater threat to the safe operation of the tailings pond if the reservoir level cannot be lowered below the safe elevation within a short time after the extreme rainfall warning is issued (Cheng et al., 2021; Wu et al., 2022). The current government laws, regulations, technical specifications, and departmental guidelines (Ministry of Emergency Management of the People’s Republic of China, 2020; Order of the State Administration of Work Safety, 2011; Ministry of Housing and Urban-Rural Development, 2013) offer no specific guidance for the tailings pond discharge scheme in an emergency, and emergency rescue is often organized by experts after an accident (Coldewey, 2009). It is an ex-post control of risk that is aimed at reducing accident losses.
It has become a consensus that extreme rainfall can significantly increase the risk of tailings pond failure. A series of theoretical studies have been conducted by researchers focusing on tailings pond risk prediction under extreme rainfall conditions, and some changing processes and pre-assessment methods of dam failure risk (Bai et al., 2021a) under rainfall confluence have been obtained. Joyce et al. (2018) demonstrated that the method of coupling flood risk and infrastructure resilience is achievable through the careful formulation of flood risk associated with a resilience metric, which is a function of the predicted hazards, vulnerability, and adaptive capacity. Komljenovic et al. (2020) proposed a holistic resilience-based approach for analyzing the safety of the tailings dam’s closure stage, including the risk of overflow over the dam crest. As uncontrolled leakage from mine tailing pond can pose a serious environmental threat (Huang et al., 2016), Sammarco et al. (2003) studied the forecast of emergency situations owing to excessive water inflows into tailings ponds, pointing that in case of tunnel overflow and/or obstruction, water could flow from the tunnel into ponds thus causing over-topping risk, some measurements were suggested to reduce water inflow into the ponds, without preventing, but rather promoting, water outflow. Yang et al. (2020) proposed a hybrid network- Long- Short- Term Memory (LSTM) and Convolutional Neural Network (CNN), namely, CNN-LSTM network for predicting the tailings pond risk. Khalil et al. (2015) also carried out short-term water level forecasting research under conditions of mine-tailings recharge using wavelet ensemble neural network models, which ensures model robustness along with improved reliability by reducing variance. In recent years, with the development of monitoring technology, quantitative mathematical methods for predicting the extreme condition of tailings ponds, such as the risk of dam failure, together with the results of monitoring (internet of things monitoring or remote sensing monitoring) have become a research hotspot. Jing and Gao (2022) studied the deep learning bidirectional recurrent long and short memory network and proposed an infiltration line prediction model with univariate input and an infiltration line prediction model with multivariate input. Chang et al. (2013) and Liao et al. (2021) studied monitoring data of tailings dam and obtained the Lyapunov exponent as well as the calculation method for the correlation dimension D2 of the dynamical characteristics of tailings pond system. Che et al. (2018) proposed a remote sensing method based on support vector machine (SVM) to evaluate the safety risk of tailings pond under rainfall condition. Chen et al. (2019) used the method of data classification and regression analysis to establish a method of analyzing and predicting risk of tailings pond during operation. Jianfei et al. (2020) proposed a prediction model based on PAC and LSTM neural network. Besides, some experiment about tailings (Benzaazoua et al., 2004) or draining system designing method (Bánik et al., 2002) to grasp the influence factor of safety for tailings pond. The above research results have to some extent grasped the prediction method of tailings pond dam failure risk and were applied to early warning research. However, because of the transient and sudden nature of dam failure landslides (Cardinali et al., 2006), prior prevention of accidents and calculation of scenarios are still important measures to ensure the operation of tailings ponds.
In this study, based on the flood regulation algorithm calculation procedure, the auxiliary flood discharge calculation method of flood discharge system under predicted forecast rainfall is examined for the specific characteristics of tailing pond flood discharge facilities, which provides a scientific basis for the safe flood control of tailing ponds in short time.
2 Methods
2.1 Precise algorithm
The precise algorithm is a method to increase the number of cycles by continuously increasing the number of coverplates that should be lowered or the number of pumps that should be added, updating the discharge flow curve, calling the main program of the flood regulation algorithm for trial calculation, and calculating whether the highest water level determined by the algorithm exceeds the warning after each trial. Finally, the number of coverplates that should be lowered or the number of pumps that should be added is obtained.
The flowchart of the precise algorithm is shown in Figure 1.
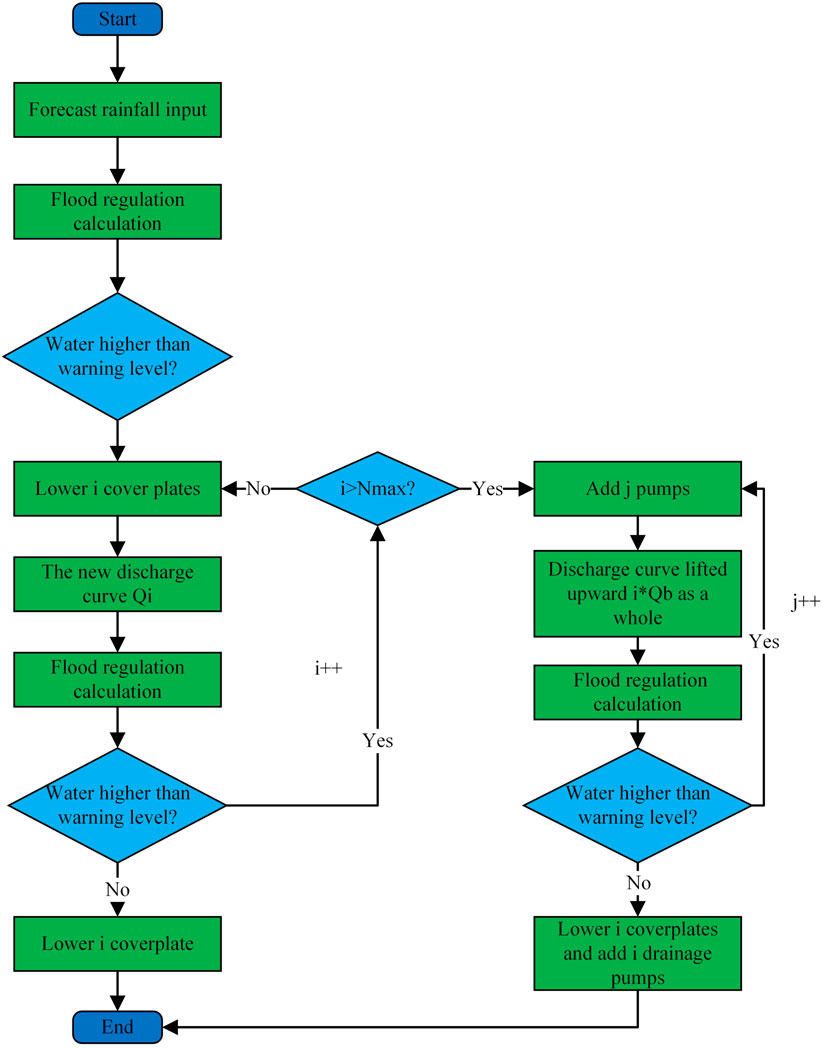
FIGURE 1. Flowchart of the precise algorithm.
From the flowchart shown in Figures 1, 2, it can be seen that the method requires constant calls to the main program of flood regulation algorithm. Although the calculation accuracy is high, the calculation efficiency is very low, which affects the stability of the program operation.
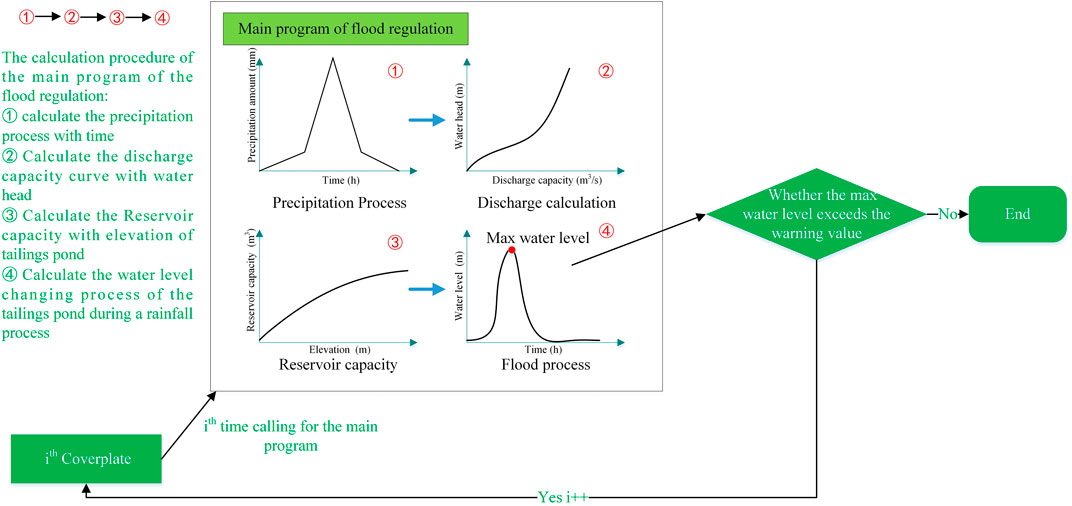
FIGURE 2. Simplified flowchart of the precise algorithm.
2.2 Optimized algorithms
In order to solve the problems of the above-mentioned precise algorithm, this study developed an optimized algorithm for increasing the discharge capacity of the flood discharge system in the tailings pond prediction and forecasting system, which realizes the automatic calculation of the emergency assistance scheme through the judgement of maximum water level
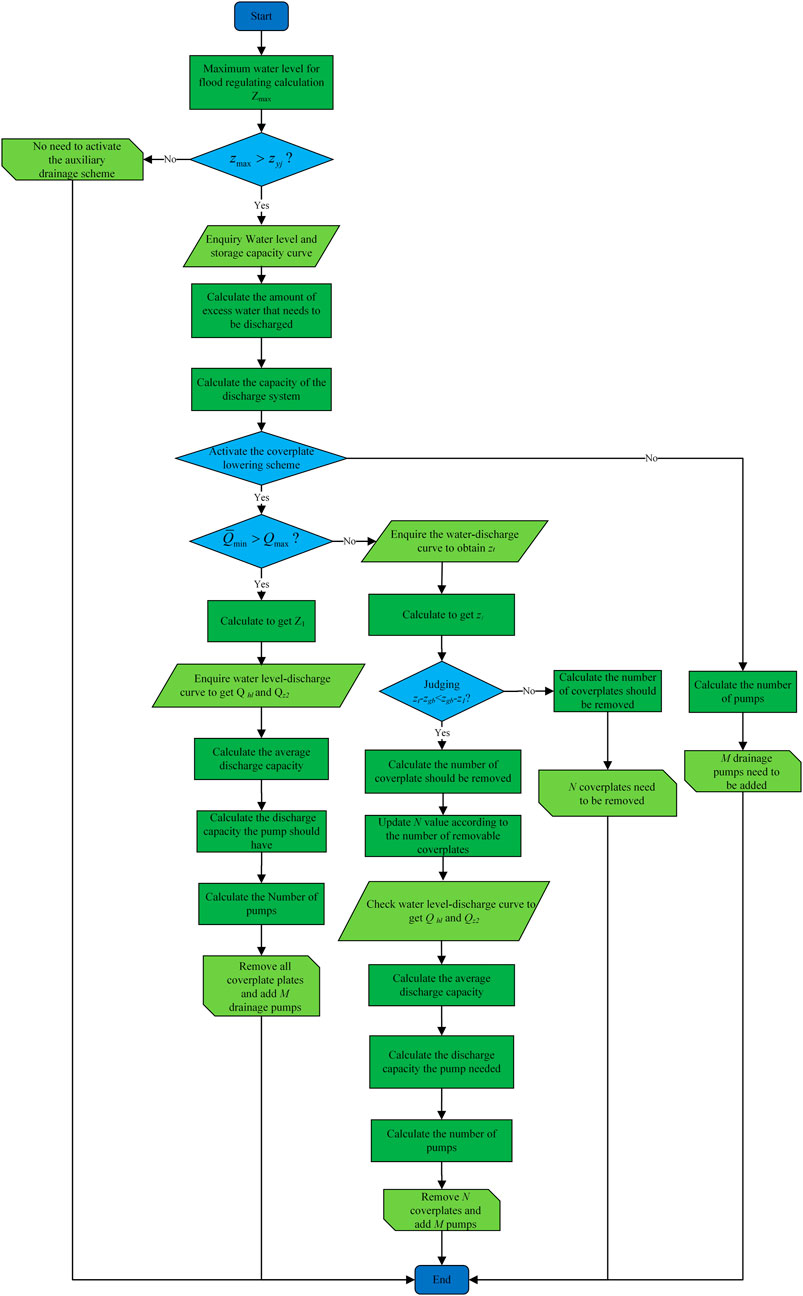
FIGURE 3. Flow chart of the optimized algorithm.
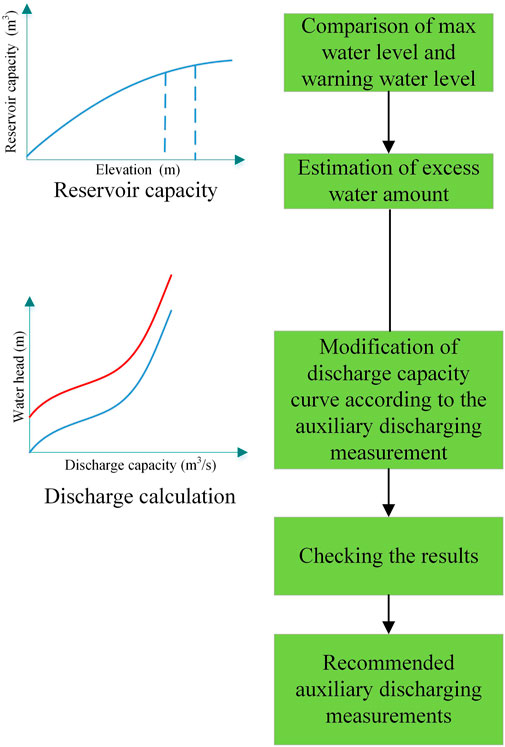
FIGURE 4. Simplified flowchart of the optimized algorithm.
According to the flowchart of the optimization algorithm for increasing the discharge capacity of the flood discharge system in the tailings pond prediction and forecasting system described above, the optimized algorithm includes the following steps and judgment processes.
2.2.1 Determination of whether to activate the auxiliary drainage scheme
Derive the maximum water level
The auxiliary discharge scheme includes two types of lowering coverplates and adding a drainage pump, which are divided into two cases according to the actual situation: ① only lowering the coverplate elevation; ② lowering the coverplate elevation+ add drainage pump. Therefore, this algorithm prioritizes lowering the coverplate elevation, and when the drainage capacity is still insufficient after lowering the coverplate elevation, the combination of lowering the coverplate elevation+ drainage pump is used for auxiliary drainage.
2.2.2 Calculating the amount of water need to be discharged
The precise amount of water to be discharged is defined as
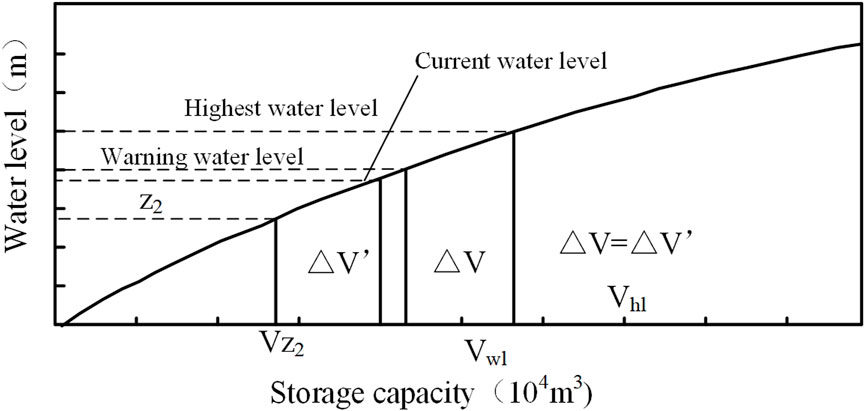
FIGURE 5. Water level-reservoir storage capacity curve and required discharge volume diagram.
Where
2.2.3 Calculating the required discharge capacity of the flood discharge system
According to the amount of water need to be discharged and the forecasting time, the minimum required discharge capacity of the flood discharge system can be calculated, the calculation method is detailed in Eq. 2.
Where
2.2.4 Calculating the auxiliary discharge scheme
Compare the magnitude of
If
1) Calculate the minimum elevation to which the coverplate can be lowered using the following equation:
where
The above equation uses the water level at the bottom of the flume and the dead water level, to determine the lowest position to which the coverplate can be lowered. If the dead water level is higher than the flume bottom level (Figure 6), the coverplate can only be lowered to the dead water level elevation. If the dead water level is lower than the flume bottom level (Figure 7), the coverplate can be lowered to the flume bottom position. Dead water levels below the bottom of the flume are less common and occur mainly when there is a tandem discharge system, or during the initial stages of tailings storage operation.
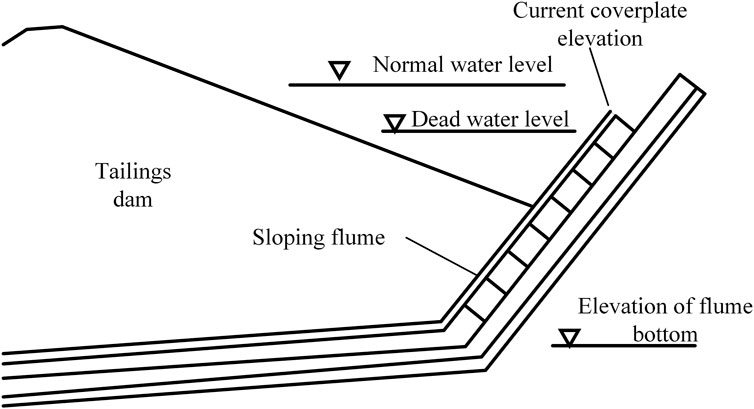
FIGURE 6. Schematic of flume bottom elevation and dead water level (dead water level above flume bottom elevation).
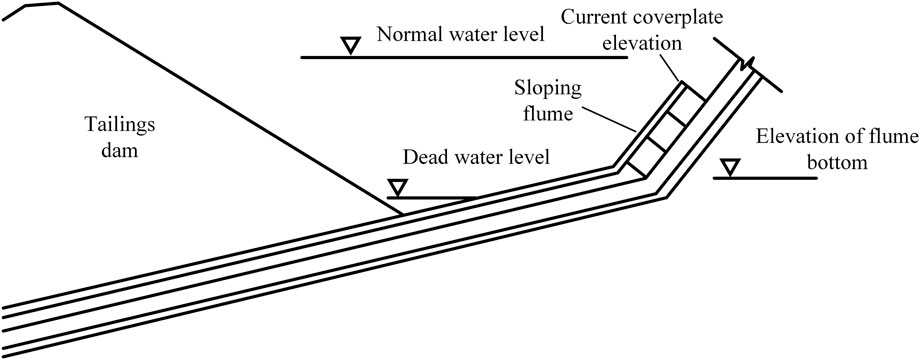
FIGURE 7. Schematic of flume bottom elevation and dead water level (dead water level is below the flume bottom elevation).
The amount of coverplate need to be removed is calculated using the following equation:
Where
2) Calculate the average discharge volume the coverplate lowering scheme by an optimization algorithm, which includes the steps ① and ②.
① Shift the water level-discharge flow curve downward along the
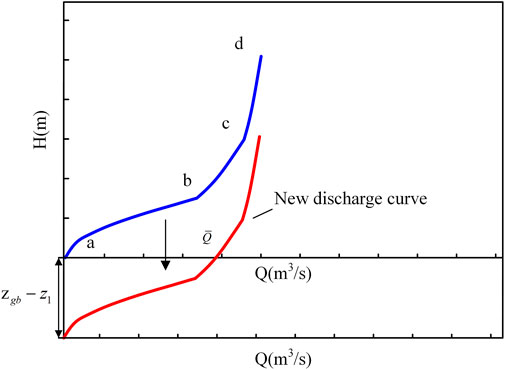
FIGURE 8. New water level-discharge capacity curve.
The method of acquiring the whole discharge curve is, calculating the results of free flow, semi-pressure flow and pressure flow at different water levels, and taking their minimum values as the final discharge curve after comparing the three at each water level, as shown in Figure 9.
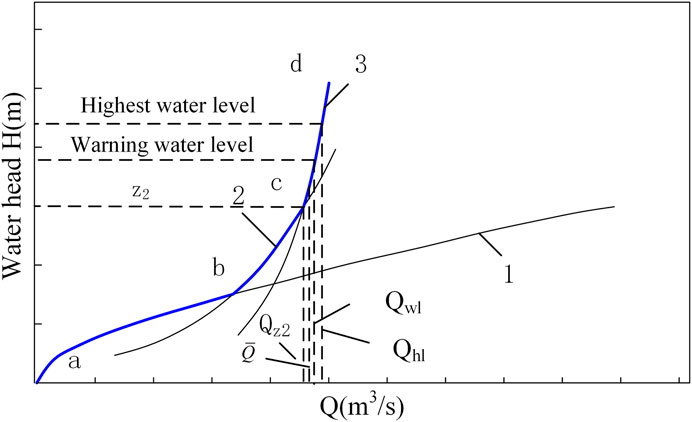
FIGURE 9. Water level-discharge capacity curve; 1 - Free flow; 2 - Semi-pressure flow; 3 - Pressure flow.
② The average flow capacity of the flood discharge system under this scheme is obtained using the following equation:
3) Calculate the minimum number of mechanical pump that should be added based on the difference between the discharge capacity
The calculate of the minimum amount of mechanical drainage that should be added including steps ① to ②.
① Calculate the required mechanical drainage flood capacity using the following equation:
② Calculate the number of pumps required, which is
where
If
When
If
If
where,
After the number of lowered coverplates is determined, the same procedure as in steps (2) to (3) is used to calculate the minimum number of mechanical drainage facilities that should be added.
When mechanical drainage measures are selected to increase the discharge capacity without lowering the coverplate, the amount of mechanical drainage is calculated using the following formula:
Brackets in Eq. 10 means rounding up to an integer.
The parameters required for the above calculation process are listed as follows.
3 Physical model
A tailings reservoir (Figure 10) is a second-class reservoir with a sloping flume-culvert pipe type flood discharge system, the single vertical height of the coverplate is 0.2009 m, and the dead water elevation is 253.5 m. The tailings reservoir water level-capacity curve is shown in Figure 11, and the water level-discharge capacity curve is shown in Figure 12. The blue warning water level is 257.0 m. A 200-min weather forecast indicates that a heavy rainfall will occur. The incoming flood and flood regulation calculations are performed according to the forecasted rainfall process. The calculation results show that this forecasted rainfall can raise the water level to 257.5 m, exceeding the blue warning water level.
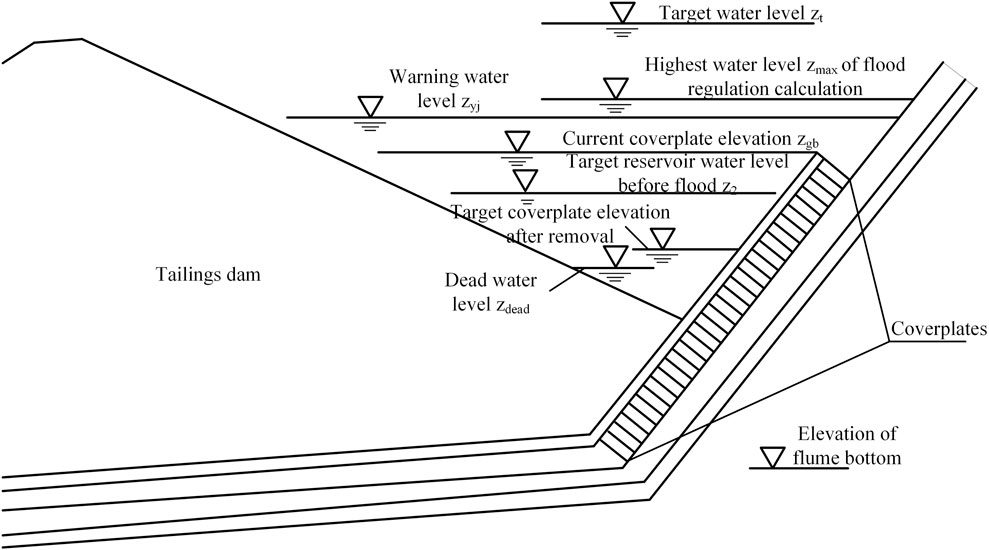
FIGURE 10. Schematic of a tailings pond.
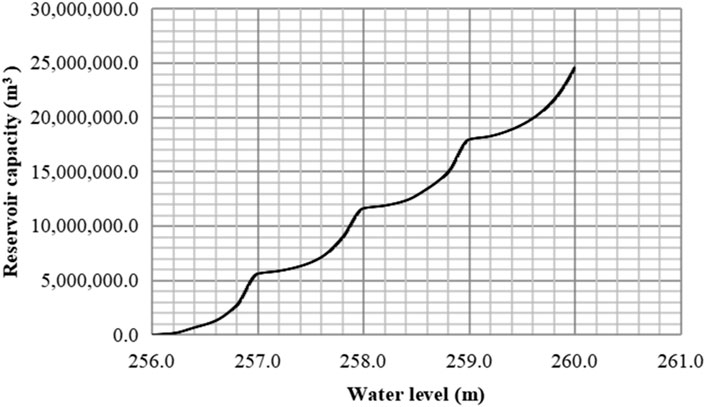
FIGURE 11. Water level-volume curve of a tailings pond.
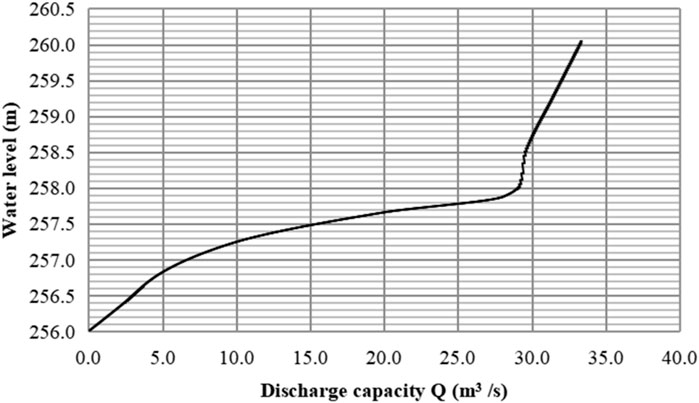
FIGURE 12. Water level-discharge capacity curve of a tailings pond.
4 Results and discussion
In order to cope with the forecasted rainfall, an emergency relief plan is needed to increase the discharge capacity so that the reservoir water level does not exceed the warning water level. The flood regulation calculation results show that the rainfall inflow causes the highest water level of tailings pond to rise to
Based on the above calculations, 10 coverplates (rounded up) need to be lowered before the flood to ensure the water level in the tailings pond does not exceed the warning when suffered forecast rainfall.
The calculated result using the precise algorithm shown in Figure 1 is also 10 coverplate plates. It can be seen that the calculation result of the optimized algorithm is the same as that of the precise algorithm.
Computation time of the precise algorithm and the optimized algorithm is listed in Table 1. For physical model in Figure 10, the computation time by precise algorithm is 5.3 s, 10 times of the main program is called during trial computing, whereas, the computation time by the optimized algorithm is only 0.05 s, without calling the main program of flood regulation.

TABLE 1. Computation time of the precise algorithm and the optimized algorithm.
The calculation time of the precise algorithm is related to the calculation time of one single flood regulation, whose efficiency is relied on factors such as iterative method, water level step size, the non-linearization degree of water-reservoir capacity curve and so on. The more complex the input parameter is, the lower the calculation efficiency is. However, the optimized algorithm does not need to call the main program of the flood regulation, so it has a competitive computation efficiency.
The upstream tailings pond adopts hydraulic discharging method, so in the tailings discharging process, reservoir bottom is gradually covered by tailings with the processing of hydraulic deposition (Bai et al., 2021b), and a triangle zone (from the cross section) formed by the original topography and the sedimentary beach at the reservoir tail is the water storage zone. Therefore, the variation amplitude of the water level in tailings pond is actually limited. As stipulated in Tailings Pond Safety Regulation (National regulation of People’s Republic of China), the minimum safety free height (height between water level and breach crest) of different class tailings pond are listed in Table 2, taking the first-class tailings pond as an example, the minimum safety free height is only 1.5 m, which indicates that the variation range of water level in tailings pond will not be too large, otherwise, overtopping accident will occur. Therefore, the method of estimating the water amount to be discharged, and the discharging capacity under the scheme of auxiliary discharging measurement by the linear simplified formula in a small water variation range has a relatively high calculation accuracy.

TABLE 2. The minimum free height of upstream tailings pond (m).
The simplified algorithm proposed in the study is not applicable to the initial discharge stage in the starter dam, because the starter dam is mostly one-time constructed, so the free height for safety is enough and the allowable variation of water is large, what’s more, the non-linearity of water level storage capacity curve in the initial stage is obvious, therefore, the linear simplified estimation method proposed in this study will cause a certain amount of calculation errors when applied to the initial construction stage of tailings pond.
5 Conclusion
This study designed and examined the algorithm for an emergency increase in flood discharge capacity under extreme rainfall condition. Based on the calculation algorithm of tailings pond flood diversion and prediction method, the coverplate lowering scheme and auxiliary discharge scheme under the forecast condition were established based on rainfall forecast time, water level-volume curve, water level-discharge curve, coverplate size of flood discharge system and other parameters.
A method for predicting whether to activate the auxiliary discharge measures was established, and the estimation of whether to activate the auxiliary discharge measures was performed by comparing the size of the maximum water level calculated by the flood regulation calculation and the warning water level. Then, a simplified calculation method for the amount of water to be released under forecast and prediction conditions was derived, and the amount of water to be released was obtained based on the maximum and warning levels and the water level-volume curve. In addition, an estimation method for the target discharge capacity was developed. The target discharge capacity of the drainage system was estimated based on the time interval of rainfall forecasts and
An optimization algorithm for estimating the average discharge capacity of the flood discharging system under the coverplate lowering scheme was proposed. The optimization algorithm comprised two processes: 1) obtaining a new water level-discharge flow curve by translating the discharge flow curve; and 2) using the average of the discharge flows corresponding to the warning level and the
The proposed simplified algorithm greatly reduces the calculation complexity of auxiliary discharging scheme under rainfall prediction, and improves the robustness and efficiency of calculation program. When the discharge capacity in insufficient, the contingency engineering measurements will be calculated and be recommended immediately, thus reducing the risk of overtopping accident to the largest extent, and ensuring the safety of downstream area.
Data availability statement
The original contributions presented in the study are included in the article/supplementary material, further inquiries can be directed to the corresponding authors.
Author contributions
Conceptualization, GM; methodology, SW; software, SW; validation, LG; formal analysis, SW; investigation, SW; resources, SW; data curation, SW; writing—original draft preparation, SW; writing—review and editing, LG; visualization, SW; supervision, LG; project administration, GM; funding acquisition, GM and LG. All authors have read and agreed to the published version of the manuscript.
Funding
This research was funded by National Natural Science Foundation project of China, grant number 52274122; The APC was funded by Youth Science and Innovation Fund of BGRIMM Technology Group, grant number 02-2271 and 04-2213. The funder was not involved in the study design, collection, analysis, interpretation of data, the writing of this article or the decision to submit it for publication.
Conflict of interest
Authors GM, SW, and LG were employed by BGRIMM Technology Group.
Publisher’s note
All claims expressed in this article are solely those of the authors and do not necessarily represent those of their affiliated organizations, or those of the publisher, the editors and the reviewers. Any product that may be evaluated in this article, or claim that may be made by its manufacturer, is not guaranteed or endorsed by the publisher.
References
Bai, B., Jiang, S., Liu, L., Li, X., and Wu, H. (2021). The transport of silica powders and lead ions under unsteady flow and variable injection concentrations. Powder Technol. 387, 22–30. doi:10.1016/j.powtec.2021.04.014
Bai, B., Zhou, R., Cai, G., Hu, W., and Yang, G. (2021). Coupled thermo-hydro-mechanical mechanism in view of the soil particle rearrangement of granular thermodynamics. Comput. Geotechnics 137 (8), 104272. doi:10.1016/j.compgeo.2021.104272
Bánik, J., Csicsák, J., and Berta, Z. (2002). “Experience on application of continuous drain trench during the remediation of tailings ponds in Hungary,” in Uranium in the aquatic environment (Berlin, Heidelberg: Springer), 899–906.
Benzaazoua, M., Bussière, B., Dagenais, A. M., and Archambault, M. (2004). Kinetic tests comparison and interpretation for prediction of the Joutel tailings acid generation potential. Environ. Geol. 46, 1086–1101. doi:10.1007/s00254-004-1113-1
Cambridge, M. (2014). “Liquefaction failure in a Derbyshire fluorspar tailings dam. Maintaining the Safety of our Dams and Reservoirs,” in Proceedings of the 18th biennial conference of the British dam society at queen’s university, belfast, from 3–6 september 2014 (ICE Publishing), 414–425.
Cambridge, M., and Shaw, D. (2019). Preliminary reflections on the failure of the Brumadinho tailings dam in January 2019. Dams Reservoirs 29, 113–123. doi:10.1680/jdare.19.00004
Cardinali, M., Galli, M., Guzzetti, F., Ardizzone, F., Reichenbach, P., and Bartoccini, P. (2006). Rainfall induced landslides in december 2004 in south-western umbria, central Italy: Types, extent, damage and risk assessment. Nat. Hazards Earth Syst. Sci. 6, 237–260. doi:10.5194/nhess-6-237-2006
Chang, L. S., Yang, T. Y., and Deng, H. J. (2013). Disaster prediction and preventive measures of constructing a waste dump on an abandoned tailing pond. Appl. Mech. Mater. 405, 2427–2430. Trans Tech Publications Ltd. doi:10.4028/www.scientific.net/AMM.405-408.2427
Che, D., Liang, A., Li, X., and Ma, B. (2018). Remote sensing assessment of safety risk of iron tailings pond based on runoff coefficient. Sensors 18, 4373. doi:10.3390/s18124373
Chen, Y., Li, Q., and Liang, Y. (2019). “Research and application of data classification in risk prediction for tailings reservoirs,” in Proceedings of the 3rd international conference on computer science and application engineering, 1–5. doi:10.1145/3331453.3362058
Cheng, D., Cui, Y., Li, Z., and Iqbal, J. (2021). Watch out for the tailings pond, a sharp edge hanging over our heads: Lessons learned and perceptions from the Brumadinho tailings dam failure disaster. Remote Sens. 13, 1775. doi:10.3390/rs13091775
Coldewey, W. G. (2009). “Emergency planning for tailing dams,” in Optimisation of disaster forecasting and prevention measures in the context of human and social dynamics, 52, 115.
Forbes, P. J., Cale, S. A., and Clelland, L. F. (1991). “Spillway systems for tailings dams,” in The embankment dam: Proceedings of the sixth conference of the British Dam Society held in Nottingham on 12–15 September 1990 (Thomas Telford Publishing), 85–91. doi:10.1680/ted.16477.0013
Grimalt, J. O., Ferrer, M., and Macpherson, E. (1999). The mine tailing accident in Aznalcollar. Sci. Total Environ. 242, 3–11. doi:10.1016/S0048-9697(99)00372-1
Huang, X., Deng, H., Zheng, C., and Cao, G. (2016). Hydrogeochemical signatures and evolution of groundwater impacted by the Bayan Obo tailing pond in northwest China. Sci. Total Environ. 543, 357–372. doi:10.1016/j.scitotenv.2015.10.150
Jianfei, D. A. I., Peng, Y., and Liyi, Z. H. U. (2020). A PCA-LSTM neural network-integrated method for phreatic line prediction. China Saf. Sci. J. 30, 94. doi:10.16265/j.cnki.issn1003-3033.2020.03.015
Jing, Z., and Gao, X. (2022). Monitoring and early warning of a metal mine tailings pond based on a deep learning bidirectional recurrent long and short memory network. PloS one 17 (10), e0273073. doi:10.1371/journal.pone.0273073
Joyce, J., Chang, N. B., Harji, R., and Ruppert, T. (2018). Coupling infrastructure resilience and flood risk assessment via copulas analyses for a coastal green-grey-blue drainage system under extreme weather events. Environ. Model. Softw. 100, 82–103. doi:10.1016/j.envsoft.2017.11.008
Khalil, B., Broda, S., Adamowski, J., Ozga-Zielinski, B., and Donohoe, A. (2015). Short-term forecasting of groundwater levels under conditions of mine-tailings recharge using wavelet ensemble neural network models. Hydrogeology J. 23, 121–141. doi:10.1007/s10040-014-1204-3
Komljenovic, D., Stojanovic, L., Malbasic, V., and Lukic, A. (2020). A resilience-based approach in managing the closure and abandonment of large mine tailing ponds. Int. J. Min. Sci. Technol. 30, 737–746. doi:10.1016/j.ijmst.2020.05.007
Liao, G., Li, Q., and Sun, X. (2021). “The chaos of the prediction for tailings pond dam break disasters,” in 2021 7th international conference on hydraulic and civil engineering & smart water conservancy and intelligent disaster reduction forum (ICHCE & SWIDR). (IEEE), 929–937. doi:10.1109/ICHCESWIDR54323.2021.9656433
Ministry of Emergency Management of the People's Republic of China (2020). State administration for market regulation, People's Republic of China. Beijing: Safety regulation for tailings pond.
Ministry of Housing and Urban-Rural Development (2013). “PRC; general administration of quality supervision, inspection and quarantine, PRC,” in Code for design of tailings facilities(GB-50863 2013) (Beijing.
Order of the State Administration of Work Safety (2011). Regulations on safety supervision and administration of tailings pond. Beijing.
Rico, M., Benito, G., Salgueiro, A. R., Díez-Herrero, A., and Pereira, H. (2008). Reported tailings dam failures: A review of the European incidents in the worldwide context. J. Hazard. Mater. 152, 846–852. doi:10.1016/j.jhazmat.2007.07.050
Saliba, A. P. M., Mafra, J. M. Q., and Luís, F. (2011). “On the effect of climate change on water balances of tailings reservoirs,” in Pan-Am CGsGeotechnical Conference.October 2-6, 2011 (Toronto, Ontario, Canada: ASCE). Available at: http://geoserver.ing.puc.cl/info/conferences/PanAm2011/panam2011/pdfs/GEO11Paper273.pdf.
Sammarco, O., Ovi, M., and Costabile, M. (2003). “Forecast of emergency situations owing to excessive water inflows into tailings ponds,” in Proc. 8th IMWA congress (Johannesburg: Mine Water and the Environment), 109–127. Available at: http://mwen.info/docs/imwa_2003/imwa_2003_109-127.pdf.
Wu, P., Liang, B., Jin, J., Zhou, K., Guo, B., and Yang, Z. (2022). Solution and stability analysis of sliding surface of tailings pond under rainstorm. Sustainability 14, 3081. doi:10.3390/su14053081
Yang, J., Qu, J., Mi, Q., and Li, Q. (2020). A CNN-LSTM model for tailings dam risk prediction. IEEE Access 8, 206491–206502. doi:10.1109/ACCESS.2020.3037935
Zanbak, C. (2019). Compiled information and opinions on Córrego do Feijão Mine “Dam I” failure in Brazil. Available at: https://www.researchgate.net/publication/331089028. 2(18732.92806). doi:10.13140/RG
Keywords: predicted forecast rainfall, tailings ponds, auxiliary drainage, precise algorithm, optimized algorithm
Citation: Mei G, Wang S and Guo L (2023) Optimized algorithm of auxiliary drainage scheme in tailings reservoir rainfall prediction: illustrated with a case study. Front. Earth Sci. 11:1141345. doi: 10.3389/feart.2023.1141345
Received: 10 January 2023; Accepted: 10 April 2023;
Published: 03 May 2023.
Edited by:
Marcelo Cohen, Federal University of Pará, BrazilCopyright © 2023 Mei, Wang and Guo. This is an open-access article distributed under the terms of the Creative Commons Attribution License (CC BY). The use, distribution or reproduction in other forums is permitted, provided the original author(s) and the copyright owner(s) are credited and that the original publication in this journal is cited, in accordance with accepted academic practice. No use, distribution or reproduction is permitted which does not comply with these terms.
*Correspondence: Sha Wang, d2FuZ3NoYUBiZ3JpbW0uY29t; Lijie Guo, Z3VvbGlqaWVAYmdyaW1tLmNvbQ==
†These authors have contributed equally to this work and share first authorship