 Shuo Cao
 Jing Ma
 Laiming Zhang
- 1State Key Laboratory of Biogeology and Environmental Geology, and School of Earth Sciences and Resources, China University of Geosciences (Beijing), Beijing, China
- 2Institute of Mineral Resources Research, China Metallurgical Geology Bureau, Beijing, China
Deserts are among the most important terrestrial sedimentary environments and have existed in all periods throughout Earth’s history. In contrast to modern deserts, the ability to quantitatively evaluate the area and desertification degrees of ancient deserts is limited due to the lack of unambiguous proxies. Dune morphology and their spatial arrangements directly reflect the degree of desertification of deserts. Recently, a methodology for obtaining the morphological parameters of dunes was established, although it has not been applied to ancient dunes and deserts in deep time. In the Ordos Basin, both the Early Cretaceous desert and modern deserts (Hobq Desert and Mu Us Desert) were well developed and exposed, which makes the Ordos Basin an ideal place to quantitatively evaluate the paleo-desert based on the proposed methodology. In this study, a total of 698 and 1,490 morphological parameters reflecting the Early Cretaceous desert and modern deserts in the Ordos Basin were obtained, respectively. For the Ordos paleo-desert, our results show that its area was larger and its degree of desertification was more severe than those of modern mid-latitude deserts, including the modern desert in the Ordos Basin, but were similar to those of the modern low-latitude deserts. Our results, therefore, suggest that the Ordos paleo-desert was a non-negligible and large desert during an interval of Earth’s history. Since the other controlling factors, such as regional geography and sources of both the ancient and modern deserts in the Ordos Basin, have remained nearly unchanged, we speculate that it may have been the relatively high temperature, high levels of atmospheric carbon dioxide and relatively low precipitation during the greenhouse period (i.e., Early Cretaceous) that led to the large area and severe degree of desertification of the Ordos paleo-desert.
1 Introduction
Deserts are among the most important terrestrial sedimentary environments, and their sedimentary records extend throughout Earth’s history (Mountney, 2006; Rodríguez-López et al., 2014). Modern deserts are compared and evaluated mainly by their area and degree of desertification (degree of sand cover) (Laity, 2009; Pye, 2009). However, due to the lack of unambiguous proxies, the ability to quantitatively evaluate ancient deserts in geological history and explore their formation mechanisms is limited (Cosgrove et al., 2021a; Cosgrove et al., 2021b; Cosgrove et al., 2021c; Rodríguez-López et al., 2014).
Dunes are the primary landforms in deserts (Mountney, 2006; Laity, 2009). Their morphology and spatial arrangement directly reflect the degree of desertification and serve as an ideal proxy to quantitatively evaluate deserts (Dong et al., 2009; Al-Masrahy and Mountney, 2013). Recently, a methodology was established by Ma et al. (2021) to measure and calculate the morphological parameters of ancient dunes, which further enables the quantitative descriptions of dune morphology in deep time. However, its applicability has not been verified.
Previous sedimentological studies proved that an Early Cretaceous desert (paleo-desert for short) was well developed and exposed across the entire Ordos Basin, northern China (Qi and Li, 1996; Jiang et al., 2004; Qiao et al., 2021). In this study, we measure and calculate 698 morphological parameters of 241 ancient dunes in the Ordos paleo-desert. After comparing the dune morphological parameters of modern deserts (Hobq Desert and Mu Us Desert) in the Ordos Basin and other typical modern deserts all over the world, our results suggest that the area was larger and the degree of desertification was more severe in the Ordos paleo-desert than in the modern mid-latitude deserts, including the modern desert in the Ordos Basin, but similar to those of the modern low-latitude deserts. We speculate that the typical greenhouse climate led to the large area and severe desertification that occurred within the Ordos paleo-desert during the Early Cretaceous.
2 Geological setting
The Ordos Basin, also known as the Ordos Plateau, is a highland sedimentary basin in Northwest China with an elevation of 1,000–1,600 m. It is the second largest sedimentary basin in China and has a total area of 370,000 km2 (Liu and Yang, 2018; Zhang et al., 2020). The basin is bounded to the east by the Lvliang and Taihang Mountains, to the north by the Yin Mountains, to the west by the Helan Mountains, and to the south by the Qinling Orogen (Shi et al., 2020; Figure 1). Since the Early Cretaceous, the location of the Ordos Basin has basically remained unchanged (at 34°N–41°N, 104°E–112°E) (Jiang et al., 2001). Two modern deserts (Yang et al., 2012) and a paleo-desert (Qiao et al., 2021) developed in the Ordos Basin.

FIGURE 1. (A) Geological map of the Ordos Basin. (B) Digital Elevation Model (DEM) of the modern deserts (Hobq Desert and Mu Us Desert) in the Ordos Basin. Dashed box: study area; circle: data measurement outcrop locations.
The modern deserts are confined to the northern part of the Ordos Basin. It comprises two deserts: the Hobq Desert in the north and the Mu Us Desert in the south (Liu and Yang, 2018). The Hobq Desert (107°08′–111°30′ E, 39°40′–40°48′ N), formed in the Early Holocene, extends ∼300 km from west to east, and its width decreases from ∼100 km in the west to 20–30 km in the east, covering an area of 16,000 km2 (Sun et al., 2006; Yang et al., 2016). Most of the area is covered by desert landscapes, characterized by crescentic dunes (Fan et al., 2013; Xu et al., 2018). The Mu Us Desert (106°11′–110°54′ E, 36°49′–40°12′ N), which formed in the Late Pleistocene, has an area of ∼39,000 km2 and a dune field area of 34,033 km2 (He et al., 2010). The inner Mu Us Desert is mainly composed of semistabilized barchanoid-ridge dunes (Wang et al., 2017). However, in the southern marginal Mu Us Desert, the sand-loess transitional zone, i.e., the main geomorphic units, are discontinuous sand sheets (Sun, 2000; Huang et al., 2009).
In contrast to modern deserts, the paleo-desert covered almost the entire Ordos Basin during the Early Cretaceous (∼142–136 Ma, Berriasian-Valanginian) (Deng et al., 2008; Huang, 2010; Qiao et al., 2021). The aeolian strata in the Ordos Basin are mainly developed in the Luohe and Luohandong Formations (Jiang et al., 2001; Xing et al., 2018). Here, our study is focused on the typical paleo-desert deposits in the Luohe Formation, which has an area of 370,000 km2 (Jiang et al., 2004). The aeolian sequences in this formation have an average thickness of 110–430 m and are mainly exposed in the middle and western parts of the basin (Deng et al., 2008; Zhu et al., 2018). The dune deposits are well developed and preserved (Qiao et al., 2021).
3 Methods
3.1 Morphological parameter of dunes
As mentioned above, the dune morphology could be quantitatively described by morphological parameters, including height (H), spacing (SP), wavelength (DW), wave width (WA), average thickness of grainflow strata (t), preserved set thickness (λ), climbing angle (Փ), horizontal length of slipface (L), and angle of repose (α) (Table 1; Al-Masrahy and Mountney, 2013; Mountney and Howell, 2000; Romain and Mountney, 2014; Yang H et al., 2019). Among these parameters, DW, WA, and H (similar to the length, width, and height) together can directly reflect the size of a dune and are used for comparison. For modern dunes, SP, DW, WA, and L can be directly obtained by field measurement or remote sensing images (Al-Masrahy and Mountney, 2013). For ancient dunes, SP, DW, WA, t, λ, and Փ can be directly obtained by field measurement if the outcrops are well exposed and well preserved (Mountney, 2012; Romain and Mountney, 2014). The other parameters can be indirectly calculated based on the above parameters (Yang J et al., 2019; Ma et al., 2021; Junhuai).
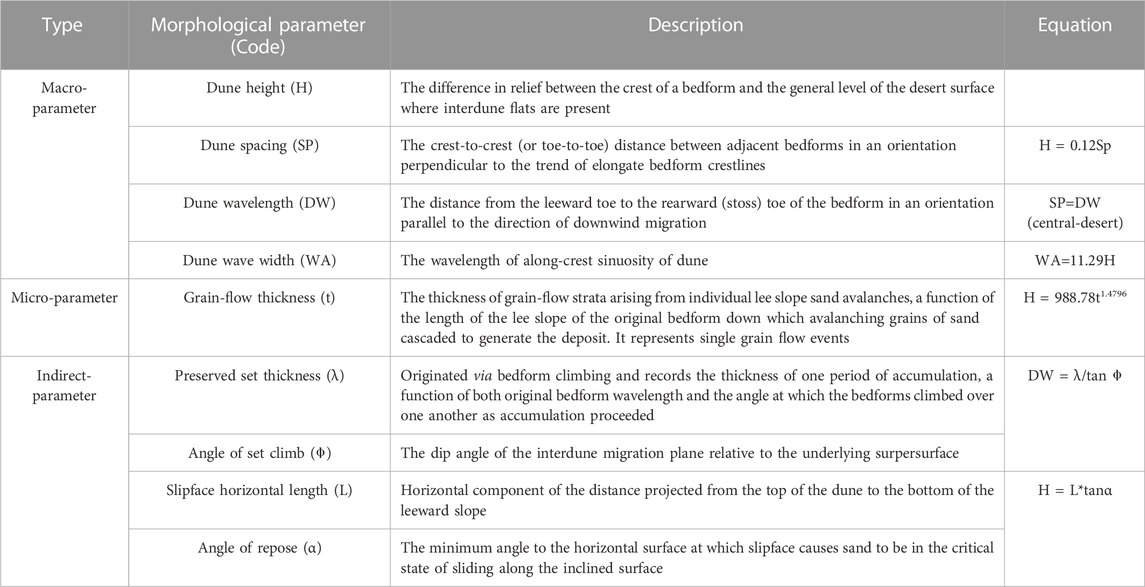
TABLE 1. Summary of morphological parameters of aeolian dunes (Al-Masrahy and Mountney, 2013; Romain and Mountney, 2014).
3.2 Measurement of morphological parameters
A total of 434 data points were measured from 241 dunes from the paleo-desert, and a total of 653 and 484 data points were measured from 215 to 160 dunes from the Hobq and Mu us Deserts, respectively. Dunes can be divided into many types, for example, crescentic, transverse, linear, and star (Mountney, 2006). Among them, crescentic dunes are simple in structure and widely distributed. During the process of long-distance migration, the size and shape of sediment in crescentic dunes do not significantly change (Ma et al., 2021). Therefore, to ensure the accuracy of our measurements, only simple and compound crescentic dunes were measured in this study (Xiao, 2017).
3.2.1 Ancient dunes in the Luohe Formation
The outcrops of the Luohe Formation are well preserved and fully exposed, which facilitates measurement. The outcrops at Dongsheng, Zhidan, and Xunyi (Figure 1) are accessible, well exposed, and laterally extensive, and their planar cliff faces are oriented either parallel or perpendicular to the paleowinds (Jiang et al., 2001; Qiao et al., 2021). According to the accumulation mechanism of climbing aeolian systems, all the morphological parameters should be measured in the section as close to parallel or perpendicular to the paleowinds as possible since oblique sections make the measurements larger or smaller (Mountney, 2012; Romain and Mountney, 2014; Figure 2).
(1)DW. DW is the distance between two successive interdune deposits in the sections that were (nearly) parallel to the paleowinds (Mountney and Howell, 2000; Figure 2B, Figure 3A). If the interdune deposits are absent, then the superimposed surfaces instead of the interdune surfaces can be used, but this will lead to a smaller value than the actual value (Figure 2B, Figure 3B). In the desert center, SP is approximately equal to DW, as interdunes are not developed (Ma et al., 2021).
(2)WA. WA is the distance between the wings of trough cross-bedding in the sections that were (nearly) perpendicular to the paleowinds (Ma et al., 2021; Figure 2C, Figures 3C, E).
(3)ϕ, λ. ϕ and λ need to be measured together from compound crescentic dune deposits (Mountney and Howell, 2000). ϕ is the angle between the climbing surface of dunes and the supersurface (Mountney, 2012; Figure 2D). The generally horizontal strata of the Luohe Formation indicate that the supersurface is also horizontal (Xue et al., 2010). In this case, ϕ is the dip of the superimposed surfaces in the section (nearly) parallel to the paleowinds (Figure 3F). λ is the vertical distance of two adjacent superimposed surfaces in sections parallel or perpendicular to the paleowinds (Figure 2D, Figure 3F).
(4)t. For sections either perpendicular or parallel to the paleowinds, a t series consists of the measurements of the grain flow unit lamina by lamina in one cross-bedded dune set (Howell and Mountney, 2001; Romain and Mountney, 2014; Figure 3D).
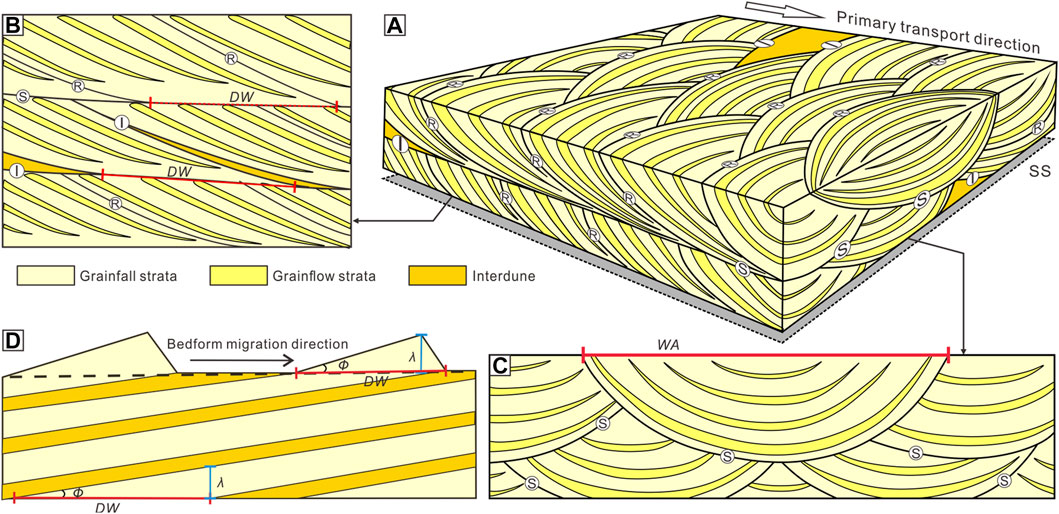
FIGURE 2. Geometric models of aeolian architecture of ancient dunes. (A) Depositional model for aeolian dune and interdune deposits (modified from Romain and Mountney, 2014). (B) Cross section parallel to the primary transport direction. (C) Cross section perpendicular to the primary transport direction. (D) Simplified model for the accumulation of aeolian succession (modified from Mountney, 2012). SS-Supersurface; I-interdune surface; S-superimposed surface; R-reactivation surface; DW-dune wavelength; WA-dune wave width; λ-preserved set thickness; ϕ-angle of set climb.
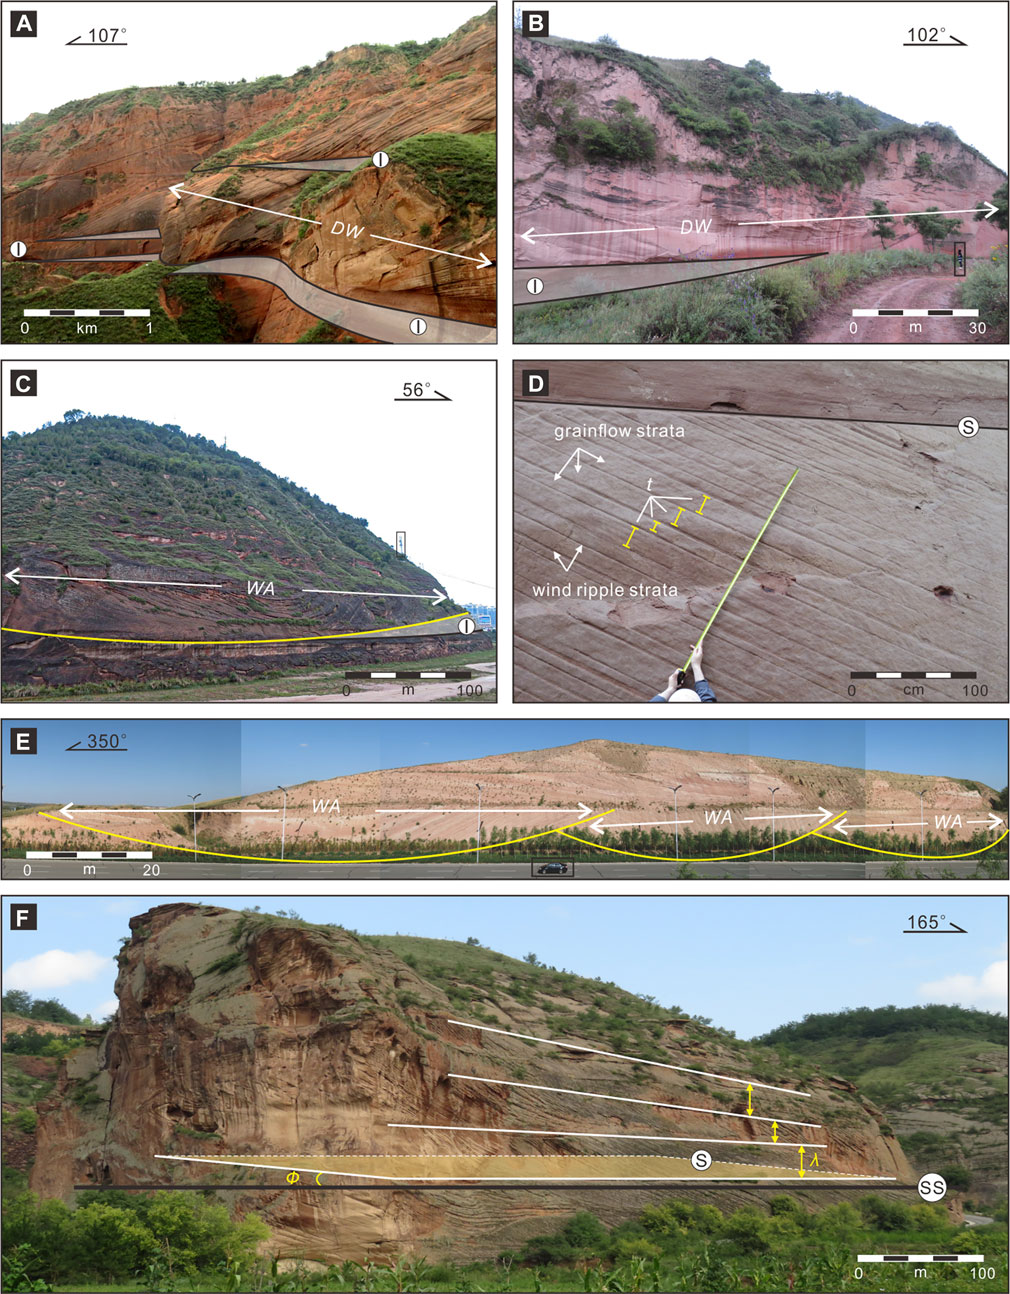
FIGURE 3. Outcrops of morphological parameters of ancient dunes. (A) Dune deposit bounded on both sides by interdune deposits in the section nearly parallel to the paleowind. (B) Dune deposit bounded on one side by interdune deposit in the section nearly parallel to the paleowind. (C) Large-scale aeolian though cross-bedding with interdune deposits in the section nearly perpendicular to the paleowind. (D) Detail of aeolian cross-bedding showing grainflow and grainfall lamination. (E) A series of cross-beddings in the section perpendicular to the paleowind. (F) Large-scale compound aeolian dunes in the paleo-desert center. SS-Supersurface; I-interdune surface; S-superimposed surface; DW-dune wavelength; WA-dune wave width; t-grain flow thickness; λ-preserved set thickness; ϕ-angle of set climb.
In total, for ancient dunes in the Luohe Formation, 144 DW, 74 WA, 23 sets of ϕ and λ, and 170 t (7 sets) are measured (Supplementary Table S1).
3.2.2 Modern dunes in the Hobq and Mu Us Deserts
The measurement of modern dune morphological parameters is much easier (Al-Masrahy and Mountney, 2013). Based on the satellite imagery provided by Google Earth Pro software and datasets of the Hobq and Mu Us Deserts, DW, WA, and L can be measured directly for dunes without vegetation cover (Figure 4). For a dune, DW is measured from its leeward toe to its rearward toe in an orientation parallel to the migration direction, WA is measured from one wing to the other, and L is measured as the horizontal length of its lee slope. In addition, the dune morphological parameters of the Hobq and Mu Us Deserts reported by previous studies are also compiled (Du et al., 2011; Du et al., 2013; Wang et al., 2013; Zhang, 2019; Xu et al., 2020).
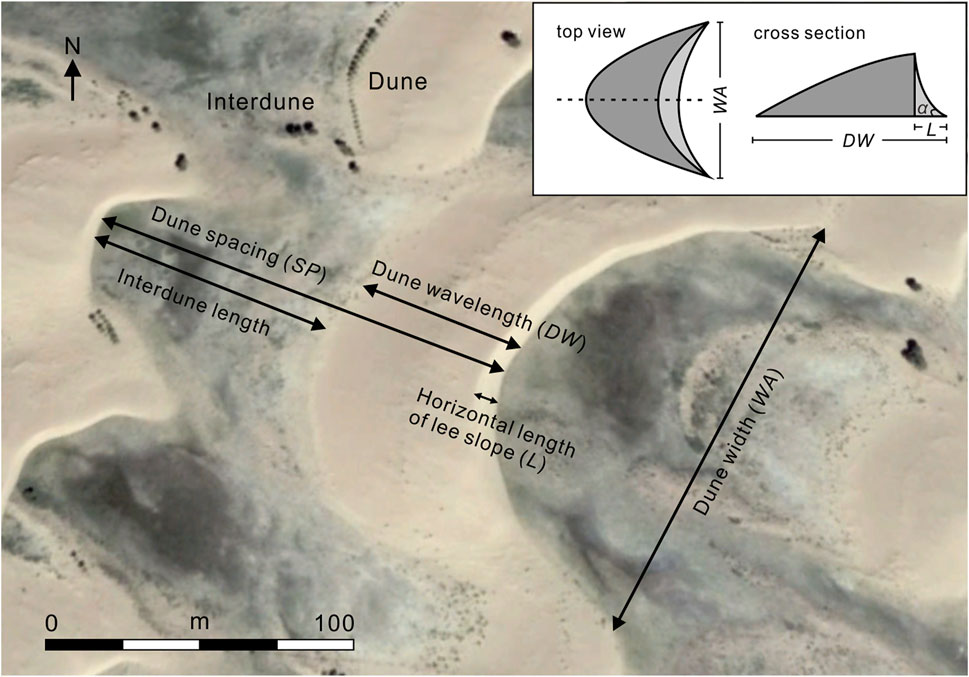
FIGURE 4. Remote-sensing image of dune and interdune of the Hobq Desert, including definitions of the terminology used in this study to quantitatively describe their morphology and geometry. Sketch map in top view and cross section of a dune is at the top right. H-original dune height; L-horizontal length of dune slipface; α-angle of repose.
In total, for modern dunes in the Hobq Desert, 215 DW, 206 WA, and 214 L were obtained. For modern dunes in the Mu Us Desert, 160 DW, 160 WA, and 160 L were obtained (Supplementary Table S2).
3.3 Calculation of the unmeasurable morphological parameters
As we have mentioned above, we use DW, WA, and H to make comparisons. In contrast to WA, H for both ancient and modern dunes and DW for part of ancient dunes cannot be directly measured due to the relatively bad outcrop conditions (Mountney, 2006). Fortunately, according to previous studies, there are mathematical relationships between H and SP, H and t, and H and WA for simple and compound crescentic dunes (Hesp and Hastings, 1998; Howell and Mountney, 2001; Dong et al., 2009; Romain and Mountney, 2014). Ma et al. (2021) summarized these empirical equations as follows.
In these equations, a1, a2, and a3 are coefficients, b1 and b2 are the numbers of occurrences, and c1 is a constant. The values of a1, a2, b1, b2, and c1 mainly depend on the internal and external features of deserts, such as sand properties, surface morphology, wind field, and terrestrial vegetation (Ma et al., 2021). In addition, based on the geometry of dune deposits (Figure 2D, Figure 4), the conversion equations for H, L and α, and DW, λ and ϕ are as follows (Mountney and Howell, 2000; Yang H et al., 2019).
By analyzing the properties of mid-latitude modern and ancient desert deposits, previous studies have suggested that the paleo-desert shares similar characteristics with the Badain Jaran Desert, the Kumtag Desert and the Permian Cedar Mesa Sandstone deposits (Dong et al., 2009; Rodríguez-López et al., 2014; Romain and Mountney, 2014; Liu and Yang, 2018). Therefore, based on Eqs 1–3, the following empirical equations derived from the Badain Jaran Desert and the Kumtag Desert and Eq. 5 are used to calculate the unmeasurable DW and H for the ancient dunes of the paleo-desert (Dong et al., 2009; Ren et al., 2010; Romain and Mountney, 2014).
As SP approximately equals DW in the desert center, Eq. 7 can only be applied in the desert center. By using Eqs 5–9, 23 DW and 241 H are calculated for the paleo-desert. To validate our calculations, we measure DW and t and WA and t of the same dune and then calculate H by both Eqs 7, 8 and Eqs 7, 9. The results for H of the different equations are consistent.
In Eq. 4, α is a dynamic equilibrium state shaped by the interaction of regional terrain, wind, and sand sources (Yang J et al., 2019). Wang et al. (2017) measured an α of 32° in the Hobq Desert and the Mu Us Desert. Based on L obtained from the remote sensing images, 197 and 156 H are calculated in the Hobq Desert and the Mu Us Desert, respectively (Supplementary Table S2).
4 Results
Table 2 summarizes the results of the statistical analysis of DW, WA, and H of both ancient dunes in the paleo-desert and modern dunes in the Hobq Desert and the Mu Us Desert in the Ordos Basin. The evolution of DW, WA, and H from the desert center to the desert margin is shown in Figure 5.
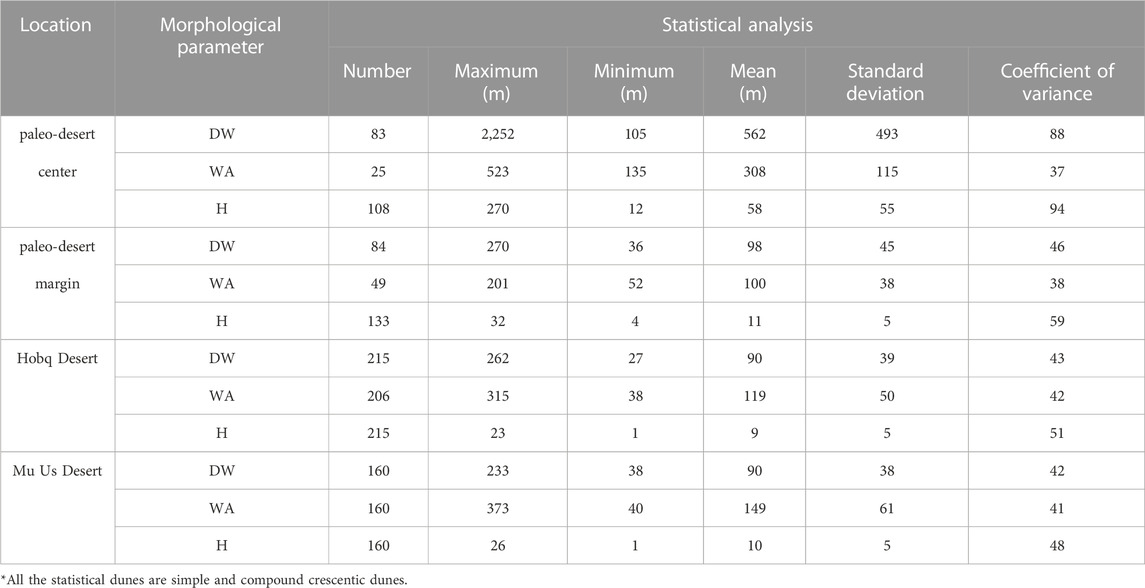
TABLE 2. Results of statistical analysis of wavelength (DW), wave width (WA) and height (H) of both the ancient and modern dunes in the Ordos Basin.
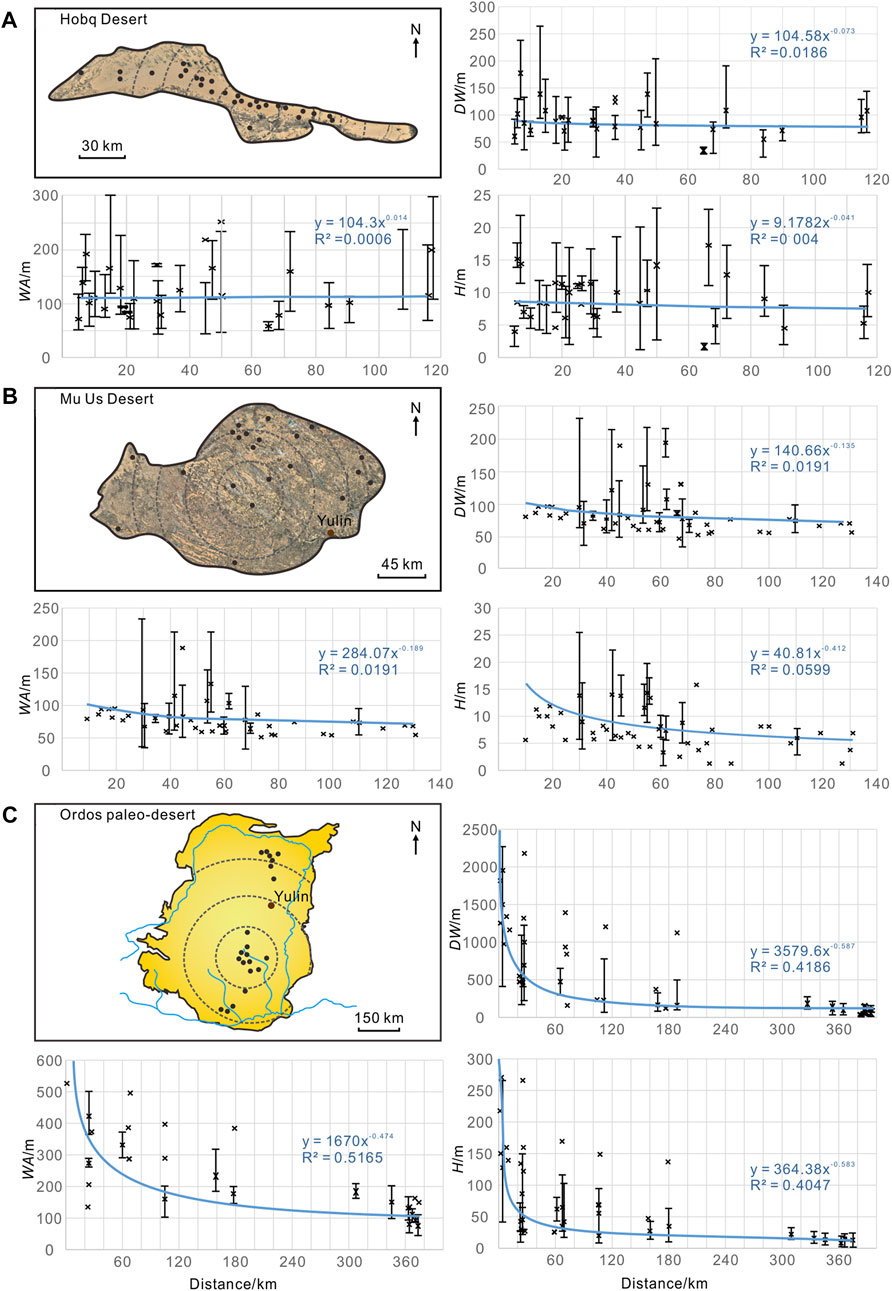
FIGURE 5. Outline map and graph of dune wavelength (DW), dune wave width (WA) and dune height (H) against distance from the desert center in the Hobq Desert (A), Mu Us Desert (B), and paleo-desert (C) in the Ordos Basin. The dotted circle (from the center to the boundary) corresponds to the center of the desert to the margin; black circles show locations where data was collected and measurements were taken; blue lines are the fitting curves with the equation of the line and R2 value also shown. The line segments in the graphs represent the range of values. All the statistical dunes consist of simple and compound crescentic dunes.
4.1 The Hobq Desert
The Hobq Desert covers an area of 16,000 km2 (Sun et al., 2006; Yang et al., 2016). A total of 215 dunes have been analyzed in the Hobq Desert. Most of the Hobq Desert is covered by active crescentic dunes and sandsheets (Figure 5A). In the Hobq Desert, DW ranges from 27 m to 262 m with an average value of 90 m. WA ranges from 38 m to 315 m with an average value of 119 m. H ranges from 1 m to 23 m with an average value of 9 m (Table 2).
According to the fitting curves in Figure 5B, DW, WA and H are distributed discretely with high standard deviation in the Hobq Desert. From the desert center to the desert margin, there is no obvious variation in dune size across the desert (Figure 5A).
4.2 The Mu Us Desert
The Mu Us Desert covers an area of ∼39,000 km2 (He et al., 2010). A total of 160 dunes have been analyzed in the Mu Us Desert. Active and stabilized dune fields within the Mu Us Desert developed on the Mesozoic bedrock in the eastern and southern regions of the desert (Figure 5B). The Mu Us Desert is a steppe desert characterized by mobile, semimobile, and semifixed dunes with a mosaic structure similar to loess grasslands. In the Mu Us Desert, DW ranges from 38 m to 233 m with an average value of 90 m. WA ranges from 40 m to 373 m with an average value of 149 m. H ranges from 1 m to 26 m with an average value of 10 m (Table 2).
Figure 5B shows that DW, WA, and H decrease gradually moving away from the desert center to the desert margin, but the decreasing trend is not significant. The ranges in the variability of DW, WA, and H are relatively limited, and most of the dunes in the Mu Us Desert are relatively small.
4.3 Paleo-desert in the Ordos Basin
The paleo-desert covers the entire basin with an area of 370,000 km2 (Qiao et al., 2021) (Figure 5C). It consists of typical desert center and margin subenvironments. For the paleo-desert margin, DW ranges from 36 m to 270 m with an average value of 98 m. WA ranges from 52 m to 201 m with an average value of 100 m. H ranges from 4 m to 32 m with an average value of 11 m (Table 2). For the paleo-desert center, DW ranges from 105 m to 2,252 m with an average value of 562 m. WA ranges from 135 m to 523 m with an average of 308 m. H ranges from 12 m to 270 m with an average of 58 m (Table 2). In the desert center (0–60 km), DW, WA, and H increase dramatically and gradually decrease to the paleo-desert margin. Notably, a series of mega-dunes that are 2,252 m long, 523 m wide, and 270 m high were formed in the paleo-desert center (Figure 5C).
The maximum DW and H of the paleo-desert are up to 9–12 times those of the Hobq Desert and Mu Us Desert (Table 2; Figure 6A). Even the mean DW and H of the paleo-desert are approximately 4 times those of the Hobq Desert and Mu Us Desert (Table 2; Figure 6A). However, the maximum and mean WA values of the paleo-desert are no more than twice those of the Hobq and Mu Us Deserts, respectively (Table 2; Figure 6A). We speculate that the WA of the paleo-desert may have been underestimated due to the limited preservation conditions.
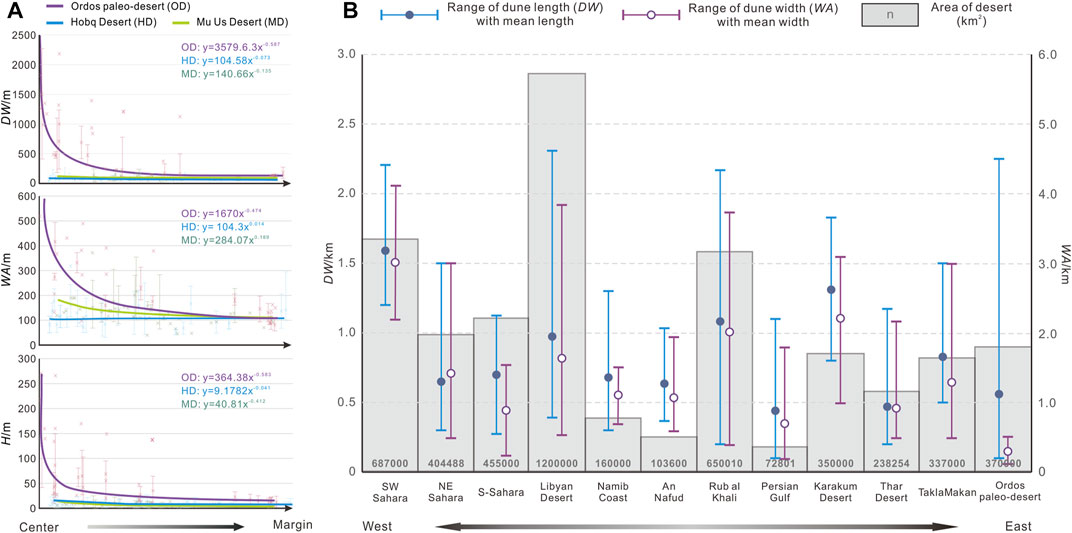
FIGURE 6. (A) Comparison graph of dune wavelength (DW), dune wave width (WA) and dune height (H) among the paleo-desert, Hobq and Mu Us Deserts in the Ordos Basin. (B) Comparison graph of area, DW and WA between the paleo-desert in the Ordos Basin and the global modern typical dune fields. All the statistical dunes are simple and compound crescentic dunes.
5 Discussion and implications
5.1 Quantitative evaluation of the large paleo-desert in the Ordos Basin
During the Early Cretaceous, aeolian deposits covered the entire Ordos Basin and are considered to represent a typical desert environment (Qi and Li, 1996; Li et al., 1999; Qiao et al., 2021). Many sedimentological studies have already been conducted to investigate the paleo-desert, including analyses of desert-related sedimentary facies (Qi and Li, 1996) and reconstruction of aeolian architecture and evolution models (Qiao et al., 2021). These studies indicated that the paleo-desert in the Ordos Basin was a large sandy desert, but no quantitative constraints have been made.
In general, deserts can be quantified and evaluated in different aspects, and the two representative and comparable aspects are the area and degree of desertification (Laity, 2009). As deserts are usually covered by sand and vegetation, the term “desertification” can be defined as a land degradation process and can be reflected by the ratio between the sand cover area and desert area (Pye, 2009; Mirzabaev et al., 2019; Yu et al., 2020). Unlike desert areas, which can be obtained directly, desertification is difficult to quantify, especially in ancient deserts (Laity, 2009). In most cases, desertification is positively correlated with the range of the sizes of the dunes as well as the maximum dune size (Al-Masrahy and Mountney, 2013; Cosgrove et al., 2021a, b). For example, for each desert, the sizes of its dunes commonly lie within a specific range, although the dune size tends to be smaller in the desert margin and larger in the desert center (Lancaster, 1994; Rubin and Carter, 2006; Ewing and Kocurek, 2010). Therefore, evaluating the dune morphology and dune size may help to quantify the degree of desertification of each desert. In this study, based on DW, WA, and H (Al-Masrahy and Mountney, 2013), we quantitatively evaluate the degree of desertification of the Ordos paleo-desert.
Here, the area and degree of desertification of the Ordos paleo-desert are compared with those of the modern deserts (Hobq and Mu Us Deserts) in the Ordos Basin and other typical modern deserts all over the world. First, the area of the Ordos paleo-desert is nearly ten times the total area of the Hobq and Mu Us Deserts (He et al., 2010; Yang et al., 2016; Qiao et al., 2021). The range and maximum size of the dunes of the Hobq and Mu Us Deserts are similar to those of the Ordos paleo-desert margin but are much smaller than those of the Ordos paleo-desert center (Figure 6A). Therefore, our results suggest that both the area and degree of desertification of the Ordos paleo-desert exceed those of the modern deserts in the Ordos Basin. Second, the area of the Ordos paleo-desert is slightly larger than that of the mid-latitude Taklimakan Desert (largest desert in China) and Karakum Desert (largest desert in Central Asia) (Qiao et al., 2021; Rittner et al., 2016; Zonn and Esenov, 2012; Figure 6B). The dune size (i.e., the range and maximum value of DW) of the Ordos paleo-desert is larger (Breed and Grow, 1979; Figure 6B), which indicates a more severe degree of desertification in the Ordos paleo-desert than in the Taklimakan Desert and Karakum Desert. Third, although the areas of the low-latitude Sahara Desert in Africa and the Rub ’al Khali Desert in the Arabian Peninsula, by far the largest hot deserts on Earth (Pastore et al., 2021; Xiao et al., 2021), are larger than that of the Ordos paleo-desert, the Ordos paleo-desert has a larger dune size (Al-Masrahy and Mountney, 2013; Breed and Grow, 1979; Figure 6B). This indicates that the degree of desertification in the Ordos paleo-desert was similar to or even more severe than that in the Sahara and Rub’ al Khali Deserts.
In summary, the comparisons demonstrate that the Ordos paleo-desert was a large and non-negligible desert at one point in Earth’s history. The area and degree of desertification of the Ordos paleo-desert exceeded those of the modern deserts in the Ordos Basin and the modern Karakum and Taklimakan Deserts at middle latitudes and was similar to those of the great Sahara and Rub’ al Khali Deserts at low latitudes. We suggest that quantitative assessments of dune morphological parameters are useful for evaluating ancient deserts in deep time.
5.2 The controlling factors on the formation, development, and evolution of deserts
Deserts developed both in the modern era and the Early Cretaceous in the Ordos Basin (Liu and Yang, 2018; Qiao et al., 2021). According to the quantitative data of the desert area and the dune morphology, the paleo-desert is much larger than the modern deserts in the Ordos Basin (Figure 5, Figure 6A). The formation of deserts is generally controlled by internal factors (e.g., basin properties) and external factors (e.g., geomorphic and geographic conditions, potential source area and sediment features, the evolution of terrestrial plants, and climate conditions) (Mountney, 2006; Lu et al., 2019; Cosgrove et al., 2021b; Zhu et al., 2021). These controlling factors are discussed below.
The Ordos Basin is a large intracratonic depression in the western part of the North China Block, and it underwent multistage modification during the Mesozoic (Zhao et al., 2020). By identifying the deposits of the marginal alluvial fan facies, since the Late Jurassic, the eastern, western, southern, and northern boundaries of the Ordos Basin have been roughly confined by the Taihang (Li et al., 2015) and Helan Mountains (Yang and Dong, 2018) and Qinling Orogen (Dong et al., 2011) and Yin Mountains (Xiao et al., 2018), respectively. Therefore, the paleogeographic configuration of the mountains surrounding the Ordos Basin has been consistent since the Late Jurassic, forming a rain shadow area in the basin and promoting the development of ancient and modern deserts (Laity, 2009; Zhao et al., 2020). However, the subsidence rates of the Ordos Basin were relatively higher during the Cretaceous, which allowed aeolian bedforms to climb at steeper angles and led to thicker aeolian sequences, but had no effect on the desert area and degree of desertification (Cosgrove et al., 2021b, 2022; Figure 7C).
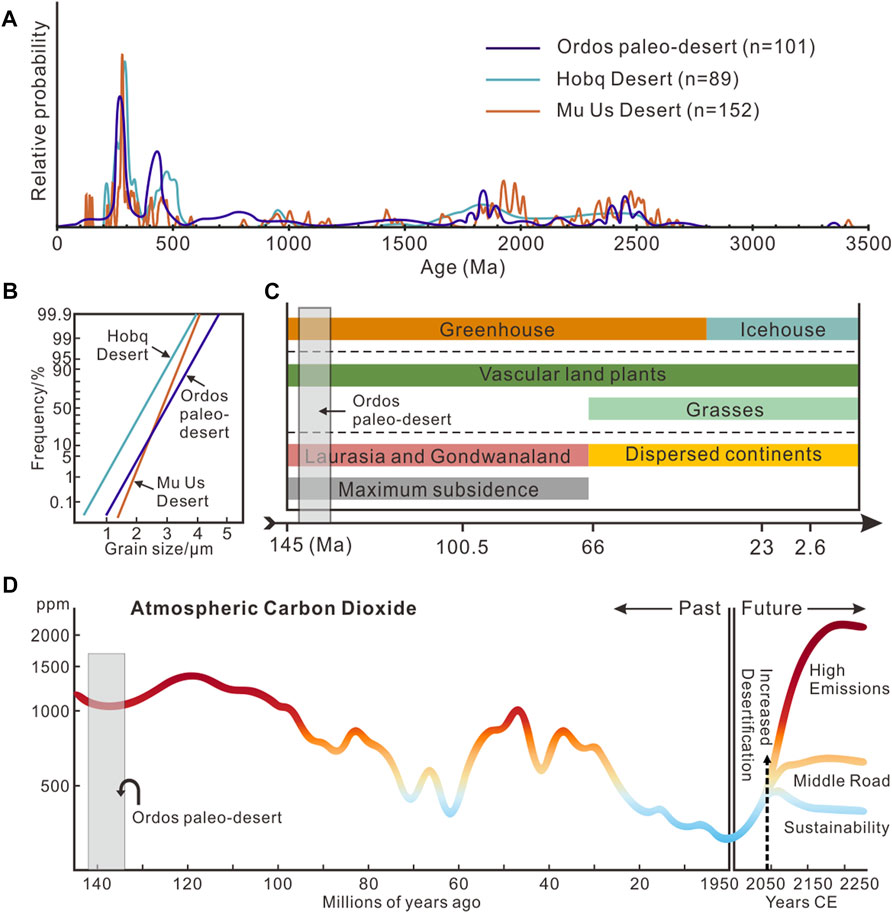
FIGURE 7. (A) U‒Pb age spectra of detrital zircons from the Early Cretaceous paleo-desert, Hobq Desert and Mu Us Desert in the Ordos Basin. Data sources: Ordos paleo-desert (Cheng et al., 2020); Hobq Desert (Yang et al., 2017); Mu Us Desert (Stevens et al., 2010). (B) Log-probability cumulative curves of grain-size distribution for aeolian sediments in the Ordos paleo-desert, Hobq and Mu Us Deserts. Data sources: Ordos paleo-desert and Mu Us Desert (Li et al., 1999); Hobq Desert (Zhang et al., 2018). (C) Climate, vegetation, basin subsidence and supercontinental setting governing aeolian construction, accumulation, and preservation from the Cretaceous to the present. Adapted from Cosgrove et al. (2021c). (D) Past carbon dioxide concentrations (left) compared to possible future emissions scenarios (right). Adapted from Tierney et al. (2020) and Meinhausen et al. (2020).
With respect to the provenance of the Ordos paleo-desert and modern deserts, previous studies have suggested that detrital zircon U‒Pb ages show the same peaks at ∼280 Ma, ∼450 Ma, ∼960 Ma, ∼1,900 Ma, and ∼2,500 Ma (Cheng et al., 2020; Stevens et al., 2010; Yang et al., 2017; Figure 7A). The detrital zircon age spectra indicate that the ancient and modern deserts in the Ordos Basin have abundant sand supplies and that their source areas are similar, consisting of the surrounding mountains and some distant sediments (Stevens et al., 2010; Yang et al., 2017; Cheng et al., 2020). In addition, the aeolian sands in the Ordos paleo-desert and the modern deserts also share similar sediment features, such as similar composition, particle size, and roundness (Li et al., 1999; Zhang et al., 2018; Figure 7B). However, the vegetation of the ancient and modern deserts in the Ordos Basin is slightly different. During the Early Cretaceous, most of the vegetation in the Ordos Basin consisted of vascular land plants, as grasses did not evolve until ca. 66 Ma (Boyce and Lee, 2017; Figure 7C). At present, grasses have become the major vegetation type in the region, play a crucial role in dune construction and stabilization (Cosgrove et al., 2021b), and decrease desertification to some extent.
Climate commonly refers to the long-term regional or global average of temperature, precipitation, wind, and atmospheric carbon dioxide (Pörtner et al., 2022). The modern deserts in the Ordos Basin are in the subtropical high-pressure belt and affected by both the East Asian winter monsoon and westerly circulation patterns (Lü et al., 2020; Yang et al., 2021). At present, in the Ordos Basin, the mean annual temperature is 6°C–8.5°C, the mean annual precipitation is 250–500 mm/year (Liu et al., 2018; Yang J et al., 2019), and the atmospheric carbon dioxide is ∼400 ppm (Meinshausen et al., 2020; Figure 7D). However, the Ordos paleo-desert was in the subtropical high-pressure belt and mainly affected by westerlies (Jiang et al., 2001; Qiao et al., 2021). During the Early Cretaceous, the sea-surface temperature was 20°C–25°C (O'Brien et al., 2017), the mean annual precipitation was 190–320 mm/year (Pan and Huang, 2014), and the atmospheric carbon dioxide was ∼1,000 ppm (Tierney et al., 2020; Figure 7D). According to the climate parameters, the ancient and modern deserts in the Ordos Basin both had sufficient and similar wind supplies. Based on the location of the Ordos Basin in the subtropical arid belt, the temperature, precipitation and atmospheric carbon dioxide in the Early Cretaceous and modern era are all suitable for the formation of deserts as well (Laity, 2009; Mirzabaev et al., 2019). However, the paleotemperature and the paleo-CO2 were much higher and the paleo-precipitation was relatively lower when the paleo-desert was formed. The greenhouse climate in the Early Cretaceous may have enlarged the desert area and intensified desertification (Mirzabaev et al., 2019).
In summary, the region was surrounded by mountains, had sufficient sediment source and wind supply, and the suitable climatic conditions promoted the formation of the ancient and modern deserts in the Ordos Basin. Since all the factors controlling the development of the paleo-desert and modern deserts have basically remained unchanged, with the exception of the climatic conditions, we speculate that the greenhouse paleoclimate during the Early Cretaceous may be the main reason for the relatively large area and relatively severe degree of desertification identified in the Ordos paleo-desert. Though further works are needed to obtain more quantitative dune morphological parameters in deserts with different ages and paleoclimate conditions.
6 Conclusion
Dune morphological parameters provide a new way to quantitatively describe dunes and deserts and provide a basis to evaluate the desertification degrees of deserts. Here, we present the first quantitative assessment of dune morphology and dune size in ancient deserts.
For the Ordos paleo-desert during the Early Cretaceous, the dune size increases dramatically toward the desert center and decreases gradually toward the desert margin. By comparing the desert area and dune morphological data, we statistically demonstrate that the area and degree of desertification of the Ordos paleo-desert exceeded those of the mid-latitude Karakum and Taklimakan Deserts and are similar to those of the low-latitude great Sahara and Rub’ al Khali Deserts. The comparison demonstrates that the Ordos paleo-desert was a large and non-negligible desert during an interval of Earth’s history. In addition, for the development of the paleo-desert and modern deserts in the Ordos Basin, since all the controlling factors have remained unchanged, with the exception of the climatic conditions, we speculate that the greenhouse paleoclimate during the Early Cretaceous, characterized by high temperatures, high levels of atmospheric carbon dioxide and low precipitation may be the main reason that the Ordos paleo-desert occupied such a relatively large area and had a relatively severe degree of desertification.
Data availability statement
The original contributions presented in the study are included in the article/Supplementary Material, further inquiries can be directed to the corresponding authors.
Author contributions
The author’s contributions are shown below: SC: Conceptualization, Data curation, Writing-Original draft preparation; JM: Data curation, Investigation, Visualization; LZ: Writing-Reviewing and Editing.
Funding
This study was financially supported by the National Key R&D Plan of China (grant 2018YFE0204204), the National Natural Science Foundation of China (grant 42102122), and the Fundamental Research Funds for the Central Universities (grants 265202103 and 2652021093).
Conflict of interest
The authors declare that the research was conducted in the absence of any commercial or financial relationships that could be construed as a potential conflict of interest.
Publisher’s note
All claims expressed in this article are solely those of the authors and do not necessarily represent those of their affiliated organizations, or those of the publisher, the editors and the reviewers. Any product that may be evaluated in this article, or claim that may be made by its manufacturer, is not guaranteed or endorsed by the publisher.
Supplementary material
The Supplementary Material for this article can be found online at: https://www.frontiersin.org/articles/10.3389/feart.2023.1142034/full#supplementary-material
References
Al-Masrahy, M. A., and Mountney, N. P. (2013). Remote sensing of spatial variability in aeolian dune and interdune morphology in the Rub’ Al-Khali, Saudi Arabia. Aeolian Res. 11, 155–170. doi:10.1016/j.aeolia.2013.06.004
Boyce, C. K., and Lee, J.-E. (2017). Plant evolution and climate over geological timescales. Annu. Rev. Earth Planet. Sci. 45, 61–87. doi:10.1146/annurev-earth-063016-015629
Breed, C. S., and Grow, T. (1979). Morphology and distribution of dunes in sand seas observed by remote sensing. A study Glob. sand seas 1052, 253–302.
Cheng, X., Zhang, T., Miao, P., Cheng, Y., Li, J., Ao, C., et al. (2020). Detrital zircon U-Pb dating from the uranium-bearing sandstone of lower cretaceou of lower segment of Luohe Formation in southwestern Ordos Basin and its peripheral lithospheric extension. Geol. China, 1–27.
Cosgrove, G. I. E., Colombera, L., and Mountney, N. P. (2021a). A database of Aeolian Sedimentary Architecture for the characterization of modern and ancient sedimentary systems. Mar. Petroleum Geol. 127, 104983. doi:10.1016/j.marpetgeo.2021.104983
Cosgrove, G. I. E., Colombera, L., and Mountney, N. P. (2021b). Eolian stratigraphic record of environmental change through geological time. Geology 50, 289–294. doi:10.1130/g49474.1
Cosgrove, G. I. E., Colombera, L., and Mountney, N. P. (2021c). Quantitative analysis of the sedimentary architecture of eolian successions developed under icehouse and greenhouse climatic conditions. America: Geological Society of America Bulletin.
Cosgrove, G. I. E., Colombera, L., and Mountney, N. P. (2022). The role of subsidence and accommodation generation in controlling the nature of the aeolian stratigraphic record. J. Geol. Soc. 179, jgs2021–2042. doi:10.1144/jgs2021-042
Deng, G., Xie, Y., Yang, G., Wang, J., Jiang, X., Li, M., et al. (2008). Characteristics of cretaceous aquifer sandstone in the Ordos Basin. Acta Geol. Sichuan 28, 124–130. doi:10.3969/j.issn.1006-0995.2008.02.012
Dong, Y., Zhang, G., Neubauer, F., Liu, X., Genser, J., and Hauzenberger, C. (2011). Tectonic evolution of the Qinling orogen, China: Review and synthesis. J. Asian Earth Sci. 41, 213–237. doi:10.1016/j.jseaes.2011.03.002
Dong, Z., Qian, G., Luo, W., Zhang, Z., Xiao, S., and Zhao, A. (2009). Geomorphological hierarchies for complex mega-dunes and their implications for mega-dune evolution in the Badain Jaran Desert. Geomorphology 106, 180–185. doi:10.1016/j.geomorph.2008.10.015
Du, H., Hasi, E., Lei, J., and Yang, Y. (2013). A study of morphological change of parabolic dune in Hobq Desert based on 3S technology. Bull. Soil Water Conservation 33, 165–169.
Du, H., Hasi, E., Wu, X., Yang, Y., and Eriduntonglaga, Y. (2011). Application of 3S technology in morphological character research of paraboic dune. Geogr. Geo - Inf. Sci. 27, 33–36.
Ewing, R. C., and Kocurek, G. (2010). Aeolian dune-field pattern boundary conditions. Geomorphology 114, 175–187. doi:10.1016/j.geomorph.2009.06.015
Fan, Y., Chen, X., Fan, T., Jin, M., Liu, J., and Chen, F. (2013). Sedimentary and OSL dating evidence for the development of the present Hobq desert landscape, northern China. Sci. China Earth Sci. 56, 2037–2044. doi:10.1007/s11430-013-4673-7
He, Z., Zhou, J., Lai, Z., Yang, L., Liang, J., Long, H., et al. (2010). Quartz OSL dating of sand dunes of late Pleistocene in the Mu us Desert in northern China. Quat. Geochronol. 5, 102–106. doi:10.1016/j.quageo.2009.02.011
Hesp, P. A., and Hastings, K. (1998). Width, height and slope relationships and aerodynamic maintenance of barchans. Geomorphology 22, 193–204. doi:10.1016/s0169-555x(97)00070-6
Howell, J., and Mountney, N. (2001). Aeolian grain flow architecture: Hard data for reservoir models and implications for red bed sequence stratigraphy. Pet. Geosci. 7, 51–56. doi:10.1144/petgeo.7.1.51
Huang, Y. (2010). The origin and evolution of the desert in southern Ordos in early Cretaceous: Constraint from magnetostratigraphy of Zhidan Group and magnetic susceptibility of its sediment. Lanzhou, China: Lanzhou University.
Huang, Y., Wang, N.-a., He, T., Chen, H., and Zhao, L. (2009). Historical desertification of the Mu Us Desert, northern China: A multidisciplinary study. Geomorphology 110, 108–117. doi:10.1016/j.geomorph.2009.03.020
Jiang, X., Pan, Z., and Fu, Q. (2001). Regularity of paleowind directions of the early cretaceous Desert in Ordos Basin and climatic significance. Sci. China Ser. D Earth Sci. 44, 24–33. doi:10.1007/bf02906882
Jiang, X., Pan, Z., Xie, Y., and Li, M. (2004). Cretaceous desert cycles, wind direction and hydrologic cycle variations in Ordos Basin: Evidence for Cretaceous climatic unequability. Sci. China Ser. D Earth Sci. 47, 727–738. doi:10.1360/02yd0031
Lancaster, N. (1994). Controls on aeolian activity: Some new perspectives from the kelso dunes, mojave desert, California. J. Arid Environ. 27, 113–125. doi:10.1006/jare.1994.1052
Li, S., Guo, L., Xu, L., Somerville, I. D., Cao, X., Yu, S., et al. (2015). Coupling and transition of meso–cenozoic intracontinental deformation between the Taihang and qinling mountains. J. Asian Earth Sci. 114, 188–202. doi:10.1016/j.jseaes.2015.04.011
Li, X., Dong, G., Jin, H., Su, Z., and Wang, Y. (1999). Discovery of Ordos Cretaceous dune rock and its significance. Chin. Sci. Bull. 44, 2102–2106. doi:10.1007/bf02884931
Liu, Q., and Yang, X. (2018). Geochemical composition and provenance of aeolian sands in the Ordos Deserts, northern China. Geomorphology 318, 354–374. doi:10.1016/j.geomorph.2018.06.017
Liu, X., Lu, R., Du, J., Lyu, Z., Wang, L., Gao, S., et al. (2018). Evolution of peatlands in the Mu Us Desert, northern China, since the last deglaciation. J. Geophys. Res. Earth Surf. 123, 252–261. doi:10.1002/2017jf004413
Lu, H., Wang, X., Wang, X., Chang, X., Zhang, H., Xu, Z., et al. (2019). Formation and evolution of gobi Desert in central and eastern Asia. Earth-Science Rev. 194, 251–263. doi:10.1016/j.earscirev.2019.04.014
Lü, T., Sun, J., Feathers, J. K., and Sun, D. (2020). Spatiotemporal variations and implications of luminescence sensitivity of quartz grains on the Chinese Loess Plateau since the last interglaciation. Quat. Res. 99, 190–203. doi:10.1017/qua.2020.53
Ma, J., Cao, S., Zhang, Z., and Wang, C. (2021). Quantitative reconstruction of ancient dunes morphology in palaeo-deserts. J. Shandong Univ. Sci. Technol. Nat. Sci. 40, 10–22.
Meinshausen, M., Nicholls, Z. R., Lewis, J., Gidden, M. J., Vogel, E., Freund, M., et al. (2020). The shared socio-economic pathway (SSP) greenhouse gas concentrations and their extensions to 2500. Geosci. Model Dev. 13, 3571–3605. doi:10.5194/gmd-13-3571-2020
Mirzabaev, A., Wu, J., Evans, J., Garcia-Oliva, F., Hussein, I. A. G., Iqbal, M. H., et al. (2019). “Desertification,” in Climate change and land: An IPCC special report on climate change, desertification, land degradation, sustainable land management, food security, and greenhouse gas fluxes in terrestrial ecosystems. Editors P. R. Shukla, J. Skeg, E. Calvo Buendia, V. Masson-Delmotte, H. O. Pörtner, D. C. Robertset al. (Geneva, Switzerland: Intergovernmental Panel on Climate Change).
Mountney, N., and Howell, J. (2000). Aeolian architecture, bedform climbing and preservation space in the Cretaceous Etjo Formation, NW Namibia. Sedimentology 47, 825–849. doi:10.1046/j.1365-3091.2000.00318.x
Mountney, N. P. (2012). A stratigraphic model to account for complexity in aeolian dune and interdune successions. Sedimentology 59, 964–989. doi:10.1111/j.1365-3091.2011.01287.x
Mountney, N. P. (2006). “Eolian facies models,” in Facies models revisited. Editors H. W. Posamentier (Tulsa, Oklahoma: Society for Economic Paleontologists and Mineralogists), 19–83.
O'Brien, C. L., Robinson, S. A., Pancost, R. D., Sinninghe Damsté, J. S., Schouten, S., Lunt, D. J., et al. (2017). Cretaceous sea-surface temperature evolution: Constraints from TEX86 and planktonic foraminiferal oxygen isotopes. Earth-Science Rev. 172, 224–247. doi:10.1016/j.earscirev.2017.07.012
Pan, Y., and Huang, C. (2014). Quantitative reconstruction of early cretaceous paleoclimate using paleosol carbonates in China. Carbonates Evaporites 29, 327–335. doi:10.1007/s13146-013-0184-z
Pastore, G., Baird, T., Vermeesch, P., Bristow, C., Resentini, A., and Garzanti, E. (2021). Provenance and recycling of Sahara Desert sand. Earth-Science Rev. 216, 103606. doi:10.1016/j.earscirev.2021.103606
Pörtner, H.-O., Roberts, D. C., Adams, H., Adler, C., Aldunce, P., Ali, E., et al. (2022). Climate change 2022: Impacts, adaptation and vulnerability. Geneva, Switzerland: IPCC Sixth Assessment Report.
Qi, H., and Li, G. (1996). The systems of palaeodesert basins in sedimentary period of Zhidan Group, Ordos Basin. Northwest Geosci. 17, 63–90.
Qiao, D., Peng, N., Kuang, H., Liu, Y., Liu, Y., Cui, L., et al. (2021). Changes in prevailing surface-paleowinds reveal the atmospheric circulation transition during Early Cretaceous in North China: Palaeogeogr. Palaeoclimatol. Palaeoecol., 586, 110784. doi:10.1016/j.palaeo.2021.110784
Ren, X., Liu, T., and Zhenting, W. (2010). Characters of geomorphologic parameter about banchan dunes. Res. Soil Water Conservation 17, 163–166.
Rittner, M., Vermeesch, P., Carter, A., Bird, A., Stevens, T., Garzanti, E., et al. (2016). The provenance of Taklamakan desert sand. Earth Planet. Sci. Lett. 437, 127–137. doi:10.1016/j.epsl.2015.12.036
Rodríguez-López, J. P., Clemmensen, L. B., Lancaster, N., Mountney, N. P., and Veiga, G. D. (2014). Archean to Recent aeolian sand systems and their sedimentary record: Current understanding and future prospects. Sedimentology 61, 1487–1534. doi:10.1111/sed.12123
Romain, H. G., and Mountney, N. P. (2014). Reconstruction of three-dimensional eolian dune architecture from one-dimensional core data through adoption of analog data from outcrop. AAPG Bull. 98, 1–22. doi:10.1306/05201312109
Rubin, D. M., and Carter, C. L. (2006). Cross-bedding, bedforms, and paleocurrents. Tulsa, Oklahoma: Society for Sedimentary Geology.
Shi, W., Dong, S., and Hu, J. (2020). Neotectonics around the Ordos Block, north China: A review and new insights. Earth-Science Rev. 200, 102969. doi:10.1016/j.earscirev.2019.102969
Stevens, T., Palk, C., Carter, A., Lu, H., and Clift, P. D. (2010). Assessing the provenance of loess and desert sediments in northern China using U-Pb dating and morphology of detrital zircons. GSA Bull. 122, 1331–1344. doi:10.1130/b30102.1
Sun, J., Li, S.-H., Han, P., and Chen, Y. (2006). Holocene environmental changes in the central Inner Mongolia, based on single-aliquot-quartz optical dating and multi-proxy study of dune sands. Palaeogeogr. Palaeoclimatol. Palaeoecol. 233, 51–62. doi:10.1016/j.palaeo.2005.09.016
Sun, J. (2000). Origin of eolian sand mobilization during the Past 2300 Years in the Mu Us Desert, China. Quat. Res. 53, 78–88. doi:10.1006/qres.1999.2105
Tierney, J. E., Poulsen, C. J., Montañez, I. P., Bhattacharya, T., Feng, R., Ford, H. L., et al. (2020). Past climates inform our future. Science 370, eaay3701. doi:10.1126/science.aay3701
Wang, J., Liu, L., and Shen, L. (2013). Research of the barchan dunes movement in the Mu Us sandy land on Google Earth software. Remote Sens. Technol. Appl. 28, 1094–1100.
Wang, X., Cheng, H., Li, H., Lou, J., Hua, T., Liu, W., et al. (2017). Key driving forces of desertification in the Mu Us Desert, China. Sci. Rep. 7, 3933. doi:10.1038/s41598-017-04363-8
Xiao, J., Xie, X., Zhao, H., Chen, C., Ma, X., Qu, J., et al. (2021). Seasonal changes and migration of longitudinal dunes in the northeastern Rub'al Khali Desert. Aeolian Res. 51, 100710. doi:10.1016/j.aeolia.2021.100710
Xiao, T. (2017). A study of dune morphology and its evolution based on high resolution remote sensing data. Hunan, China: Hunan Normal University, 65.
Xiao, W., Windley, B. F., Han, C., Liu, W., Wan, B., Zhang, J. e., et al. (2018). Late Paleozoic to early Triassic multiple roll-back and oroclinal bending of the Mongolia collage in Central Asia. Earth-Science Rev. 186, 94–128. doi:10.1016/j.earscirev.2017.09.020
Xing, L., Lockley, M. G., Tang, Y., Romilio, A., Xu, T., Li, X., et al. (2018). Tetrapod track assemblages from lower Cretaceous desert facies in the Ordos Basin, shaanxi province, China, and their implications for mesozoic paleoecology. Palaeogeogr. Palaeoclimatol. Palaeoecol. 507, 1–14. doi:10.1016/j.palaeo.2018.05.016
Xu, M., Lü, P., Xiao, N., Yang, J., Liu, Z., Feng, M., et al. (2020). Effect of vegetation cover on dune migration in northwest Mu Us sandy land. J. Desert Rearch 40, 71–80. doi:10.7522/j.issn.1000-694X.2020.00020
Xu, Y., Lai, Z., Chen, T., and Gong, S. (2018). Late Quaternary optically stimulated luminescence (OSL) chronology and environmental changes in the Hobq Desert, northern China. Quat. Int. 470, 18–25. doi:10.1016/j.quaint.2017.06.010
Xue, C., Chi, G., and Xue, W. (2010). Interaction of two fluid systems in the formation of sandstone-hosted uranium deposits in the Ordos Basin: Geochemical evidence and hydrodynamic modeling. J. Geochem. Explor. 106, 226–235. doi:10.1016/j.gexplo.2009.11.006
Yang, H., Cao, J., and Hou, X. (2019). Characteristics of aeolian dune, wind regime and sand transport in Hobq Desert, China. Appl. Sci. 9, 5543. doi:10.3390/app9245543
Yang, J., Dong, Z., Liu, Z., Shi, W., Chen, G., Shao, T., et al. (2019). Migration of barchan dunes in the Western Quruq Desert, northwestern China. Earth Surf. Process. Landforms 44, 2016–2029. doi:10.1002/esp.4629
Yang, L., Shi, Z., Sun, H., Xie, X., Liu, X., and An, Z. (2021). Distinct effects of winter monsoon and westerly circulation on dust aerosol transport over East Asia. Theor. Appl. Climatol. 144, 1031–1042. doi:10.1007/s00704-021-03579-z
Yang, L., Zou, N., Yue, L., and Guo, H. (2017). Distribution of U-Pb ages of detrital zircon from the Hobq Desert and its implications for provenance. Quat. Sci. 37, 560–569. doi:10.11928/j.issn.1001-7410.2017.03.12
Yang, X., and Dong, Y. (2018). Mesozoic and cenozoic multiple deformations in the helanshan tectonic belt, northern China. Gondwana Res. 60, 34–53. doi:10.1016/j.gr.2018.03.020
Yang, X., Forman, S., Hu, F., Zhang, D., Liu, Z., and Li, H. (2016). Initial insights into the age and origin of the Kubuqi sand sea of northern China. Geomorphology 259, 30–39. doi:10.1016/j.geomorph.2016.02.004
Yang, X., Li, H., and Conacher, A. (2012). Large-scale controls on the development of sand seas in northern China. Quat. Int. 250, 74–83. doi:10.1016/j.quaint.2011.03.052
Yu, X., Zhuo, Y., Liu, H., Wang, Q., Wen, L., Li, Z., et al. (2020). Degree of desertification based on normalized landscape index of sandy lands in inner Mongolia, China. Glob. Ecol. Conservation 23, e01132. doi:10.1016/j.gecco.2020.e01132
Zhang, C., Shen, Y., Li, Q., Jia, W., Li, J., and Wang, X. (2018). Sediment grain–size characteristics and relevant correlations to the aeolian environment in China's eastern desert region. Sci. Total Environ. 627, 586–599. doi:10.1016/j.scitotenv.2018.01.270
Zhang, C. (2019). Study on dune morphological characteristics of different measures based on unmanned aerial vehicle technology. Inner Mongolia, China: Inner Mongolia Agricultural University, 61.
Zhang, Z., Wang, T., Ramezani, J., Lv, D., and Wang, C. (2020). Climate forcing of terrestrial carbon sink during the middle jurassic greenhouse climate: Chronostratigraphic analysis of the yan’an formation, Ordos Basin, north China. GSA Bull. 133, 1723–1733. doi:10.1130/b35765.1
Zhao, J., Liu, C., Huang, L., Zhang, D., Wang, D., and Wang, D. (2020). Paleogeography reconstruction of a multi-stage modified intra-cratonic basin—A case study from the jurassic Ordos Basin, Western north China craton. J. Asian Earth Sci. 190, 104191. doi:10.1016/j.jseaes.2019.104191
Zhu, B., Zhang, J., and Sun, C., (2021). Physiochemical characteristics, provenance, and dynamics of sand dunes in the arid hexi corridor. Frontiers in Earth Science, 9, 726. doi:10.3389/feart.2021.728202
Zhu, X., Liu, L., Jia, S., Rui-qi, L., and Gong, Y.-d. (2018). Geochemical and provenance characteristics of eolian sandstone of cretaceous Luohe Formation in Ordos basins: An example from outcrop in longzhou, jingbian. Glob. Geol. 37, 702–711.
Keywords: Ordos paleo-desert, quantitative dune morphology, Hobq Desert and Mu Us Desert, Early Cretaceous, greenhouse climate
Citation: Cao S, Ma J and Zhang L (2023) Quantitative reconstruction of Early Cretaceous dune morphology in the Ordos paleo-desert and its paleoclimatic implications. Front. Earth Sci. 11:1142034. doi: 10.3389/feart.2023.1142034
Received: 11 January 2023; Accepted: 23 January 2023;
Published: 03 February 2023.
Edited by:
Tianchen He, Hohai University, ChinaReviewed by:
Licheng Wang, Institute of Tibetan Plateau Research (CAS), ChinaDawei Lv, Shandong University of Science and Technology, China
Copyright © 2023 Cao, Ma and Zhang. This is an open-access article distributed under the terms of the Creative Commons Attribution License (CC BY). The use, distribution or reproduction in other forums is permitted, provided the original author(s) and the copyright owner(s) are credited and that the original publication in this journal is cited, in accordance with accepted academic practice. No use, distribution or reproduction is permitted which does not comply with these terms.
*Correspondence: Shuo Cao, Y2Fvc2h1b0BjdWdiLmVkdS5jbg==; Jing Ma, bWoxNTUwMTI3MzI1NkAxNjMuY29t