 Xiaofan Deng
 Hongqiang Li
 Rui Gao1,2,3
- 1School of Earth Sciences and Engineering, Sun Yat-Sen University, Guangzhou, China
- 2Key Laboratory of Deep Earth Sciences and Technology of Ministry of Natural Resource, Chinese Academy of Geological Sciences, Beijing, China
- 3Institute of Geology, Chinese Academy of Geological Sciences, Beijing, China
The application of the pre-stack depth migration (PSDM) method using deep seismic reflection data is still a challenge. In this paper, a deep seismic reflection dataset collected from the Bohai Bay Basin is used to test the applicability of the pre-stack depth migration method. After improving the signal-to-noise ratio of the prestack gathers and building an accurate velocity model capturing lateral and vertical variations, a high-quality pre-stack depth migration profile is obtained. This profile shows detailed crustal structures and an undulating Moho. The depth difference between the east and west sides of the Moho imaged in the profile is about 6 km. The Moho is disrupted by several discontinuities. Compared with conventionally stacked time-migration profiles, the pre-stack depth migration profile provides a higher-resolution subsurface image with accurate depth information. Combining geological and geophysical data, the pre-stack depth migration profile reveals geologic structures responsible for crust thinning during the destruction of the North China Craton. The profile also provides more accurate depth domain information for further study of crust-mantle interaction in this area.
1 Introduction
Crustal-scale seismic reflection imaging is effective in providing high-resolution information about the continental lithosphere, which has been proven successful all over the world (Clowes et al., 1968; Wang et al., 2010). The evolution of the lithosphere can be established by determining subsurface structures obtained by deep seismic reflection profiles. Since the 1970s, seismic reflection projects for continental studies have been carried out across the globe. These projects help to understand crustal deformation and continental crustal evolution. However, the depth information in the current interpretation of deep seismic reflection profiles is usually obtained by converting two-way traveltime using the average crustal velocity (Potter et al., 1986; Brown, 1991; Cook, 1995; Cook et al., 1999), or by time migration results (Calvert and Doublier, 2018) to the depth. This inevitably leads to geometrical distortion of the actual geological structures. Meanwhile, the application of depth migration for producing deep seismic reflection profiles is still a challenge. Specially, the depth migration profiles often suffer from severe arc reflection when using a reasonable crustal velocity to implement depth migration. This has a serious negative impact on the extraction of effective information from the depth migration profile. Warner (1987) even asserts that depth migration is not applicable to deep seismic reflection profiles. Apparently, obtaining a deep seismic reflection profile with reliable depth information is not an easy task.
Post-stack depth migration has been applied to the study of oceanic lithosphere structures, which have simple subsurface structures and smaller lateral velocity variation compared to that for the continental crust (e.g., Kopp et al., 2009). However, the continental lithosphere is difficult to image because of the complex subsurface structures such as undulating topographic surface, more complex fault-system geometries, and heterogeneous seismic wave velocities. Post-depth migration has also been attempted to produce continental-lithosphere seismic reflection profiles. The COCORP project used a relatively reasonable crustal velocity structure: 3–5 km/s in the sedimentary layer, 6 km/s in the basement, and 7 km/s in the lower crust, and conducted a post-stack depth migration test with distorted results (Lynn et al., 1983). In order to overcome the distortion problem and obtain a suitable profile, Warner (Warner, 1987) points out that the optimal velocity for migration is about 50% of the reflection or refraction velocity, which is obviously not in line with the actual underground conditions. In the early part of this century, post-stack depth migration of deep seismic reflection profiles was successfully applied to works done in Alberta of Canada, where a gradient velocity model (surface velocity value from 5.5 km/s to 7.1 km/s in the lower crust) was used to establish the varying crustal thickness (Christensen and Mooney, 1995; Bouzidi et al., 2002).
In this century, pre-stack depth migration (PSDM) has become the main technology to image the high-resolution subsurface structure. Obviously, it is an important step to test and promote the application of the PSDM method in the continental deep seismic reflection profile to adapt to the development of technology. It can reveal the depth domain structure of the continental crust. In this paper, high-quality deep seismic reflection data (Li et al., 2022) from the Bohai Bay Basin in eastern China is selected for research experiments. The Kirchhoff pre-stack depth migration method is used to produce the depth migration profile. By comparing the results of PSDM and pre-stack time migration (PSTM), we discuss the feasibility of applying PSDM in deep seismic reflection and its significance for deep crustal structure interpretation.
2 Geological setting
The seismic reflection profile is located in the central part of the Jizhong Depression in the Bohai Bay Basin. The basin contains Mesozoic-Cenozoic strata on top of the North China basement rocks (Li et al., 2010). The depressions can be further divided into the Baoding Sag, the Rongcheng Uplift, the Niutuozhen Uplift, and the Southern Niubei Slope (Figure 1B). The depression is located on the eastern continental block of the North China Craton (NCC) (Zhao et al., 2005). The crystalline basement of theNCC was formed in the Archean-Paleoproterozoic (Kusky and Li, 2003; Zhai, 2010). In the Late Mesozoic, the closure of the Mongol-Okhotsk Ocean and the subduction of the Paleo-Pacific plate caused a significant change in the structure of the NCC, from a nearly north-south contraction to a NWW-SEE extension (Zhu et al., 2011; Zhu et al., 2012). From late Mesozoic to Cenozoic, due to extensive magmatic activity and large-scale tectonic extension, the ancient, cold and thick cratonic lithosphere changed into the thin and hot lithosphere (Chen et al., 2010). At the same time, the Bohai Bay Basin began to develop (Li et al., 2010). Under the control of the Taihang Mountain Piedmont Faults and a series of secondary faults, intense extensional activity occurred and lasted until the end of the Paleogene. During the Neogene-Quaternary, the back-arc extension in North China weakened, the Jizhong Depression entered the depression evolution stage, dominated by overall subsidence, and the entire Bohai Bay Basin entered the post-rift thermal subsidence stage (Ma et al., 1983; Qi et al., 2003).
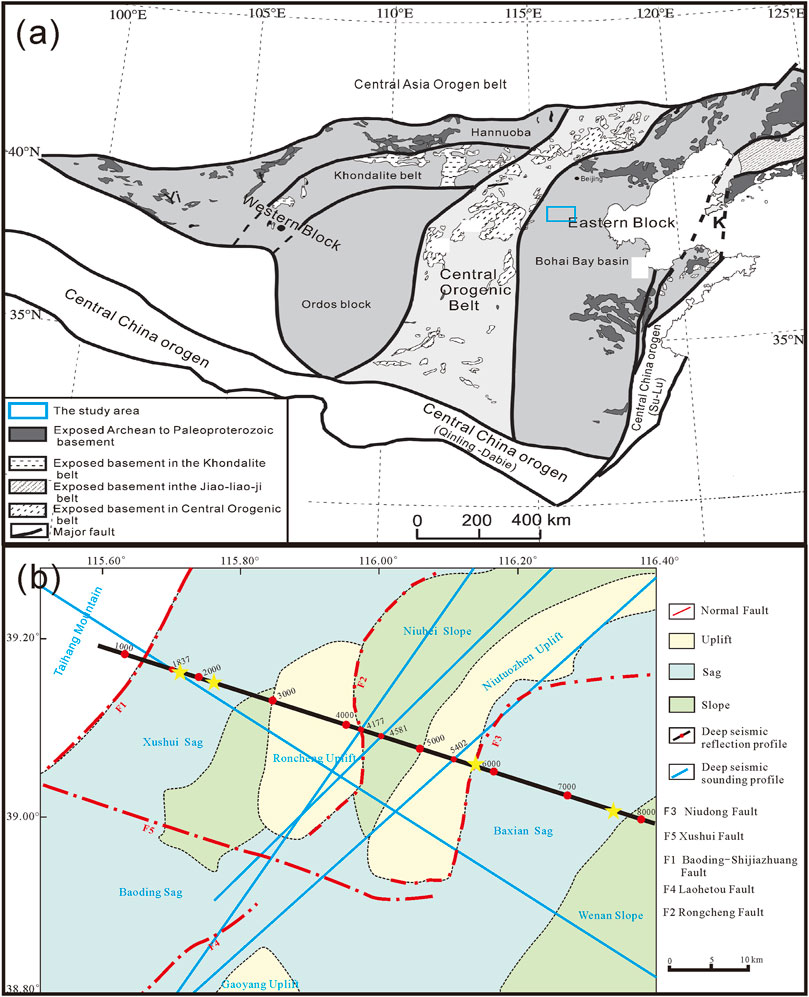
FIGURE 1. Topographic map of the study area showing simplified tectonic divisions, and location of the seismic surveying line. (A) Division of main tectonic units in the North China Craton and its adjacent areas (Modified from Zhao et al., 2005) (B) Detailed geologic map of the study area that shows the most relevant geologic and tectonic features, geologic terranes, and faults. The straight black solid line with red dots indicates the location and geometry of the seismic profile. The straight blue solid line indicates the location of seismic sounding profiles. The yellow star indicates the location of shot records in Figure 6.
The seismic reflection line passes through the Xushui Depression, Rongcheng Uplift, Niubei Slope and Niutuozhen Uplift, and ends in the Baxian Depression from west to east. The surface of the study area is covered by a Quaternary mudstone layer with a variable thickness. In order to obtain lithospheric structures at a high resolution with a high signal-to-noise ratio, our seismic surveying was conducted using a shot spacing of 40 m, a receiver spacing of 20 m, and 1000 receiving channels. A total of 1850 high-quality single records were obtained by means of large, small, and medium charges combined with explosive source excitation, with a full coverage length of 60 km (Figure 1). More details on the data acquisition can be found at Table 1 or Li et al. (2022).
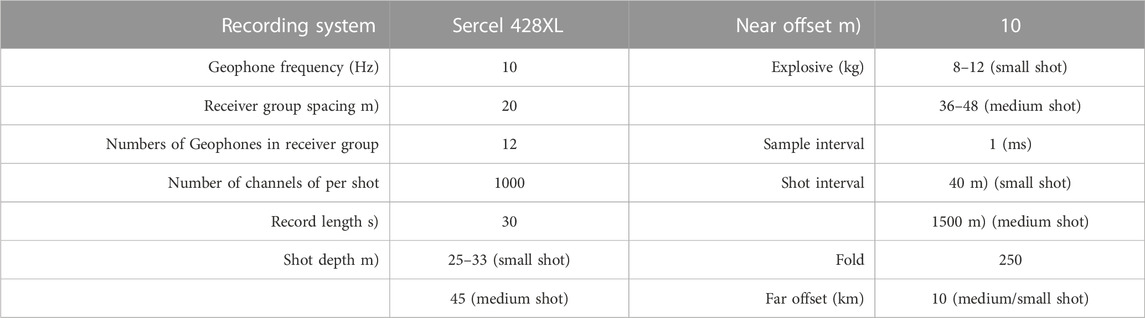
TABLE 1. Seismic data acquisition parameters along the profile.
3 Data and methods
The testing process of the PSDM method includes data pre-processing, velocity-model building, and the application of the PSDM method. Figure 2 illustrates the processing workflow: the left part is the processing flow of pre-processing to generate effective CMP gathers, whereas the right part is the processing employing the PSDM method.
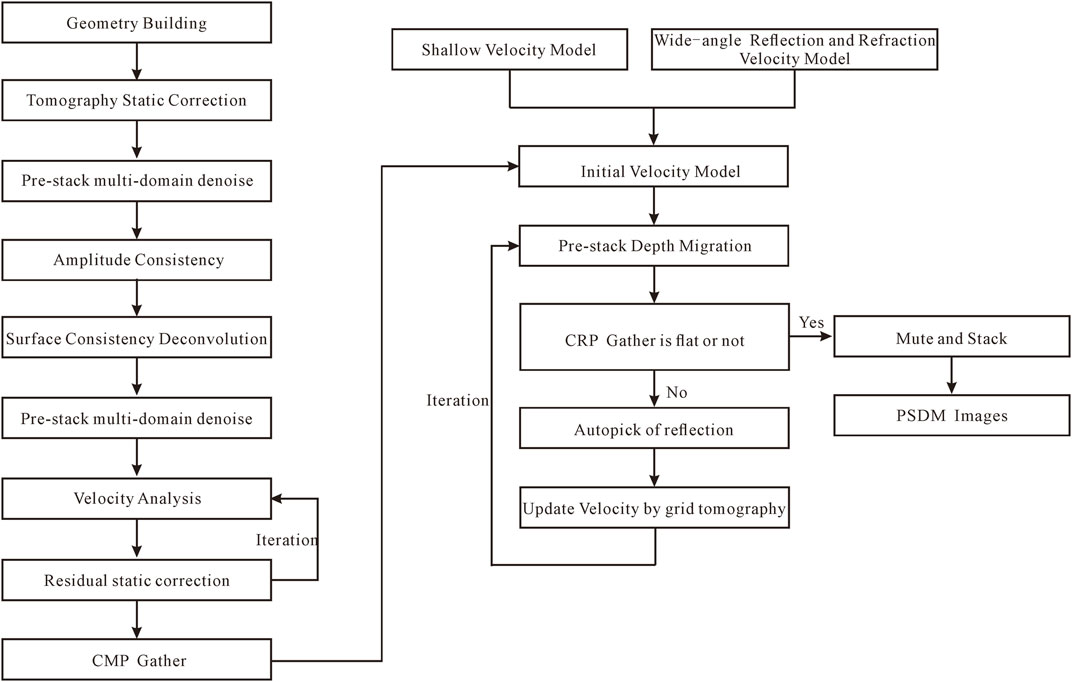
FIGURE 2. The deep seismic reflection data processing flow. The left part represents the pre-processing scheme for PSDM. The right part indicates the PSDM processing.
3.1 Pre-processing for pre-stack depth migration
Pre-processing for PSDM includes tomographic static correction, pre-stack multi-domain denoise, amplitude compensation and surface consistency deconvolution. Tomographic static correction can resolve the distortion problem caused by the low-velocity zone and the undulating surface topography. Abnormal noises and surface waves are attenuated by multi-channel identification, single-channel suppression, and adaptive attenuation methods. The records before and after noise attenuation are shown in Figure 3. Surface-consistent amplitude compensation and trace-to-trace amplitude normalization were used to reduce lateral amplitude variation. Surface-consistent deconvolution is used to improve the wavelet consistency of the wavelet and broaden the frequency band. The detailed parameters of data pre-processing is listed in Table 2.
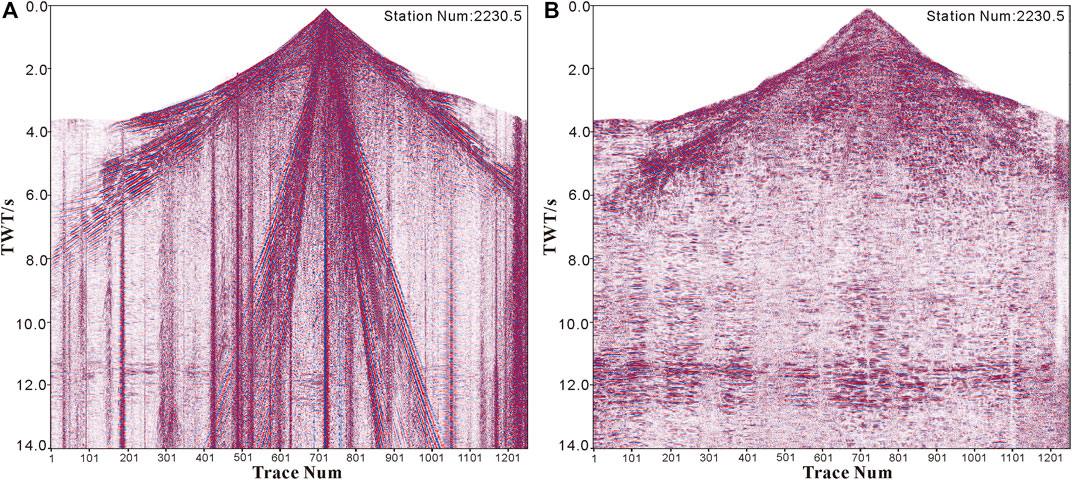
FIGURE 3. The comparison before and after noise attenuation. (A) The record before noise attenuation with time function gain. (B) The record after noise attenuation with the same time function gain.
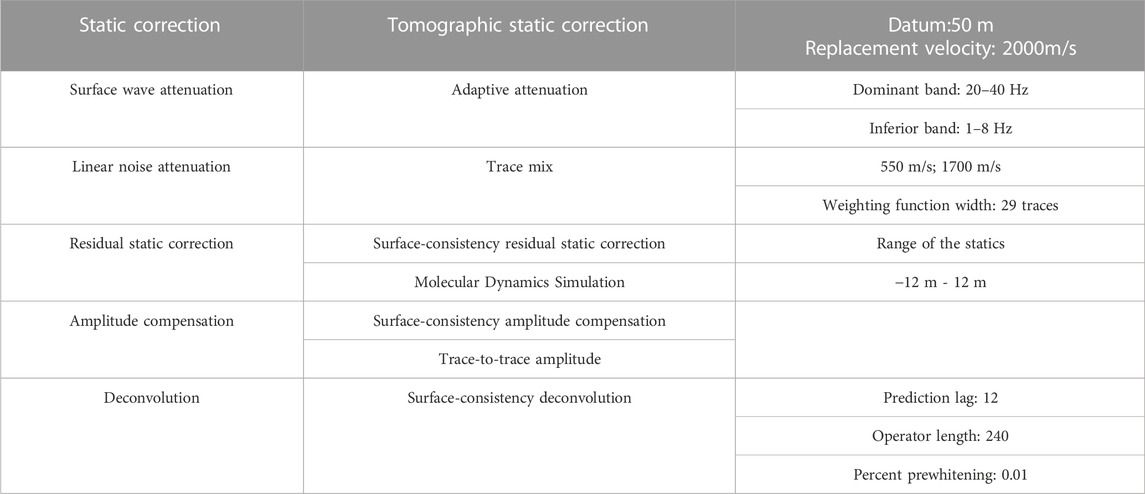
TABLE 2. Seismic data processing parameters along the profile.
3.2 Velocity building
The velocity model directly affects the quality of the PSDM method. The migration process requires a rational velocity model corresponding to the underground location. The standard industrial migration process employs the interval velocity converted from the stacking velocity with normal move-out correction. It is effective for the shallow-crust data within reasonable parameters. In this paper, the initial depth domain layer velocity model is mainly divided into shallow part (0–7 km) and deep part (7–50 km). The shallow velocity model is a fusion of velocity model obtained by first-arrival wave tomography and interval velocity model obtained using constrained velocity inversion. The velocity of the first arrival wave tomography inversion is only about 2 km, for reference only. In the depth where the first arrival wave cannot be retrieved, the velocity in the depth domain is transformed by the velocity inversion method of the constrained layer. And the deep velocity model is from wide-angle reflection and refraction, which can break through the limitations on reflected deep velocity analysis and thus optimize the imaging effect (Li, 2013). Several deep seismic sounding profiles in the study area intersect the deep seismic reflection profiles (Figure 1B) so the deep part of initial velocity model is the velocity from the wide-angle reflection and refraction (Duan et al., 2016). The interval velocity model is shown in Figure 4A.
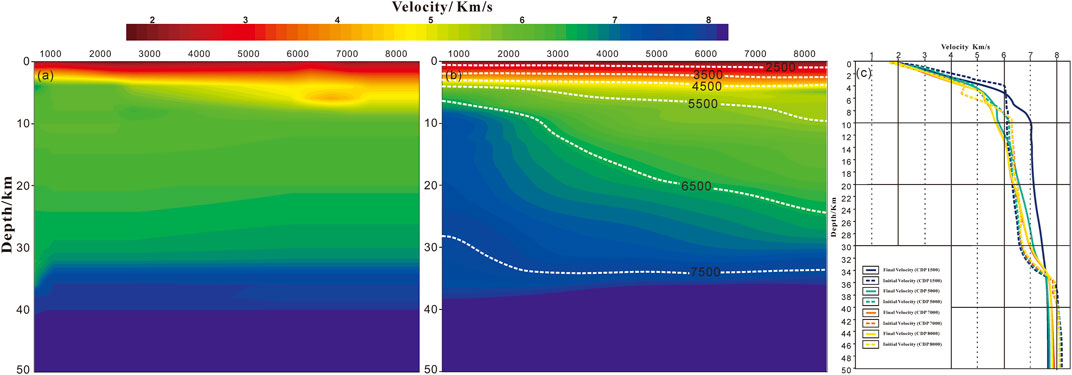
FIGURE 4. The velocity model in the depth domain. (A) The initial interval velocity model, in which the deep part velocity is from wide-angle reflection/refraction velocity. (B) The final internal velocity model of PSDM. (C) 1-D velocity for the initial velocity (A) and final velocity (B) at CDP 1500, CDP 5000, CDP 7000, CDP 8000.
After the first application of the PSDM method using the initial velocity, the velocity error was estimated according to the depth deviation of the CRP gather. The Residual Moveout (RMO) and grid tomographic inversion were used to update the velocity model iteratively until convergence. The grid size of the velocity inversion is 200 m x 200 m. The lower crust velocity of the initial velocity model obtained by wide-angle reflection and refraction is smooth. The final velocity after applying the grid tomography is shown in Figure 4B; Figure 4C shows that in addition to the vertical velocity variation, the final velocity model can show a sharp lateral velocity difference (more obvious around 8 km). The blue solid line with a sharp increase at a depth of 8 km represents the velocity of CDP 1500 which is modified by tomographic inversion. The velocity deeper than 8 km in the western profile (west of CDP 2700) is significantly higher than the eastern profile. The velocity value decreases from the location at CDP 2000.
3.3 Pre-stack depth migration
The Kirchhoff pre-stack depth migration is an efficient and practical PSDM method with a high computational efficiency, high accuracy and good computational stability. It has been widely used in the petroleum industry (Yang et al., 1996). The equation for producing imaging results can be expressed as follows:
where
This method first calculates the travel time of seismic waves and then realizes the migration. The calculation of travel time is based on the dynamic ray tracing algorithm on wavefront construction. And the algorithm selects and saves the propagation time of the event with the largest amplitude and offset to that point depth. Theoretically, the Kirchhoff pre-stack depth migration can achieve true amplitude imaging.
3.4 Data reliability analysis
In order to analyze the authenticity of the migration results and verify the reliability of the lateral variation of velocity, this study conducted reliability analysis using the first-arrival tomographic inversion and analysis of shot records. The first arrival wave of the original unprocessed shot records carries the direct wave, refracted wave, or wave combination that reaches the surface first. The velocity structure can be inverted by using the first arrival wave ray travel time and path. Figure 5 is the velocity model obtained from the inversion of the first arrival, which shows a sharp lateral velocity change at a shallow depth of 1.8 km. We can see that at a depth of 2 km or less, the layer velocity value reaches 7 km/s.
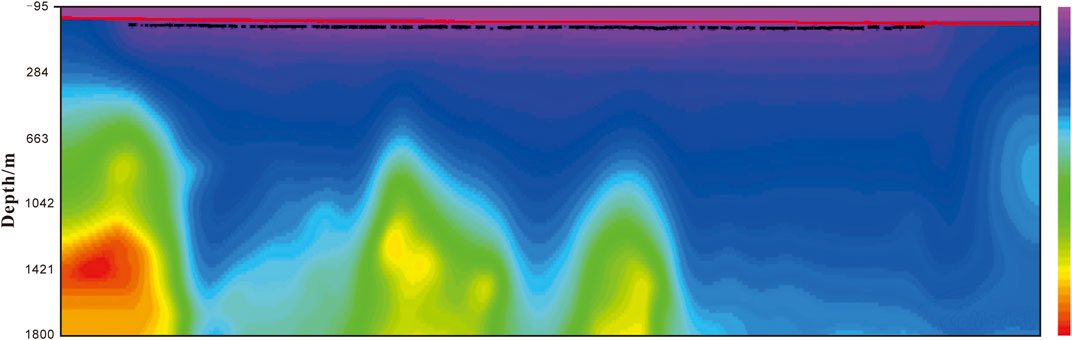
FIGURE 5. Shallow velocity model retrieved from first arrivals.
From the first arrival waves (direct arrival waves, refraction waves) recorded by shots (Figure 6), it can be found that the crustal velocity structure from west to east has huge heterogeneity and systematic changes. The velocity of the first arrival wave of a single shot varies drastically, and there are even as high as 7 km/s or more. The shot records and first-arrival inversion velocity both show that the velocity increases sharply from the middle crust on the west side, and the vertical velocity increases slowly in the east. This results in a more stable moho reflection time in the time profile between the thicker western part and the thinner eastern part. These comparisons demonstrate the reliability and stability of prestack depth migration imaging structures. Although the absolute values of layer velocities corresponding to different analysis methods are slightly different, both analyses show that lateral velocity variation is always visible.
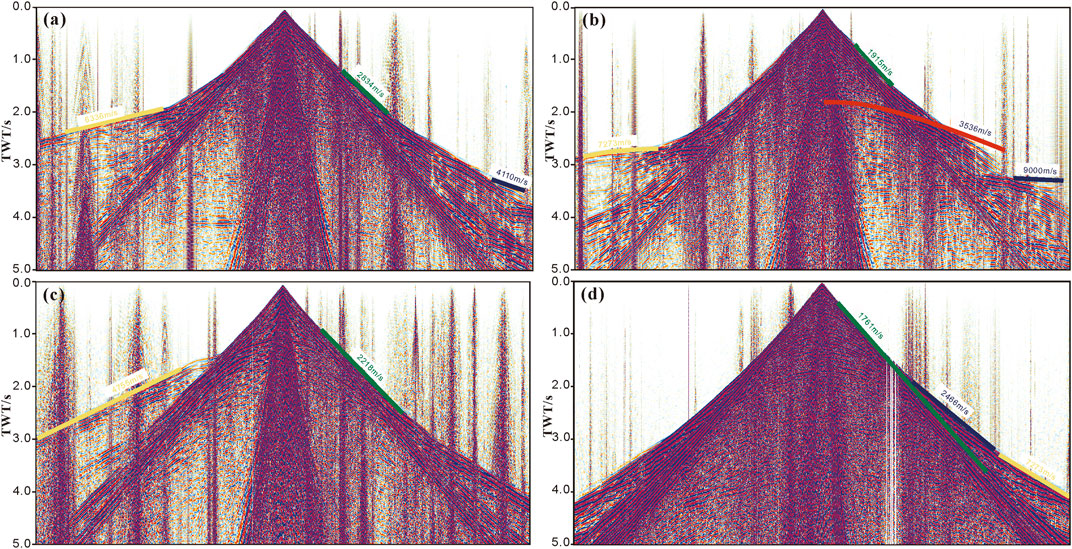
FIGURE 6. Four shot records with the mark of velocity of the first-arrival wave. (A) Shot number:1885.5 (B) Shot number:2077.5 (C) Shot number:3857.5 (D) Shot number:4879.5. The locations of shot records are marked by yellow stars in Figure 1.
4 Subsurface structure revealed by the PSDM profile
The final PSDM profile is shown in Figure 7A. In the profile, the sedimentary layers are present in the top 10 km, and the basement morphology is continuous. The middle and lower crust is dominated by strong reflections and weak refections. There are longitudinal alternating strong and weak reflected domains. The reflection of the crust-mantle transition zone has a high signal-to-noise ratio. The profile shows that the thickness and reflection amplitude of the crust-mantle transition are different at different positions.
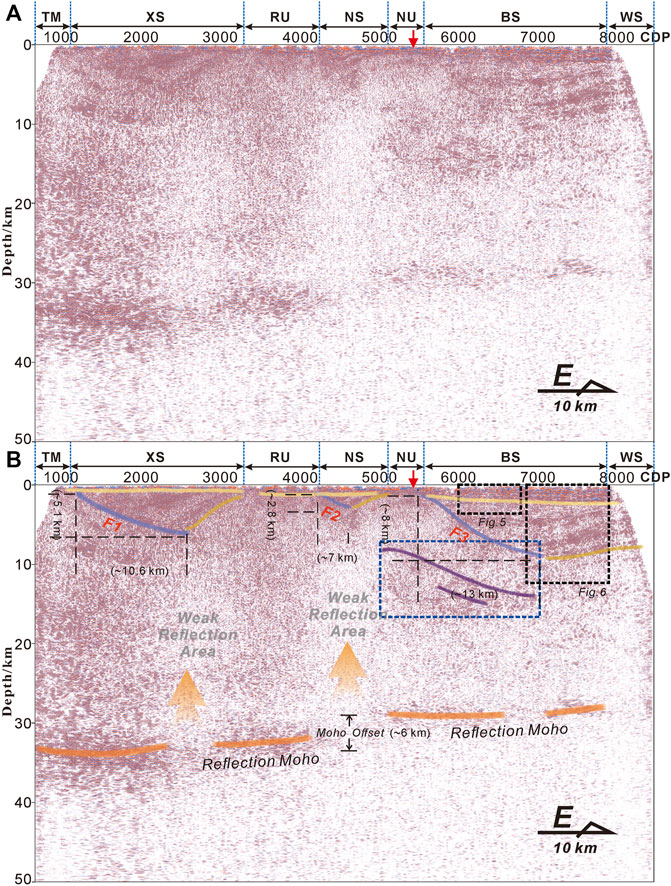
FIGURE 7. (A) PSDM profile (B) Key elements of the interpretation show the main features of the PSDM profile. The horizontal direction is CRP, and the reference datum is 50 m above sea level.
4.1 Structure of the upper crust
The tectonic pattern of two depressions and two uplifts in the upper crust is consistent with the regional geological data. Based on the drilling data (He et al., 2018; Li et al., 2022), it is inferred that the Quaternary and Neogene sedimentary strata are within 2 km deep, displaying multiple groups of near-horizontal reflection strata with a thickness of 200–2500 m. In the depression, there are three groups of half-graben structures in the basement controlled by the hidden faults F1, F2, and F3 as the western boundary. Where F1 is the Baoding-Shijiazhuang fault, F2 is the Rongcheng fault and F3 is the Niudong fault. There are also several secondary faults of these three basement-involved faults that can be clearly observed in the locally enlarged profile shown in Figure 8. Figure 9 shows the comparison between the PSDM profile and PSTM profile in the Baxian fault-bounded depression. Both profiles reveal a buried hill internal which is located at the depth of 4 km in the PSDM profile and at the two-way time of 3 s in the PSTM profile. The PSDM profile reveals the buried hill internals structure more clearly with better reflection continuity and a higher signal-to-noise ratio.
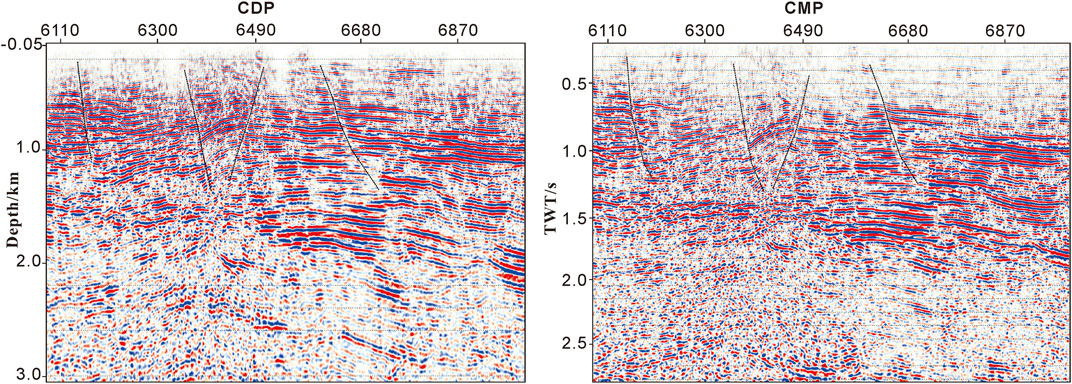
FIGURE 8. Local enlarged profile comparison of the secondary faults in the upper crust of the PSDM profile (left) and PSTM profile (right). (The enlarged range is marked in Figure 7).
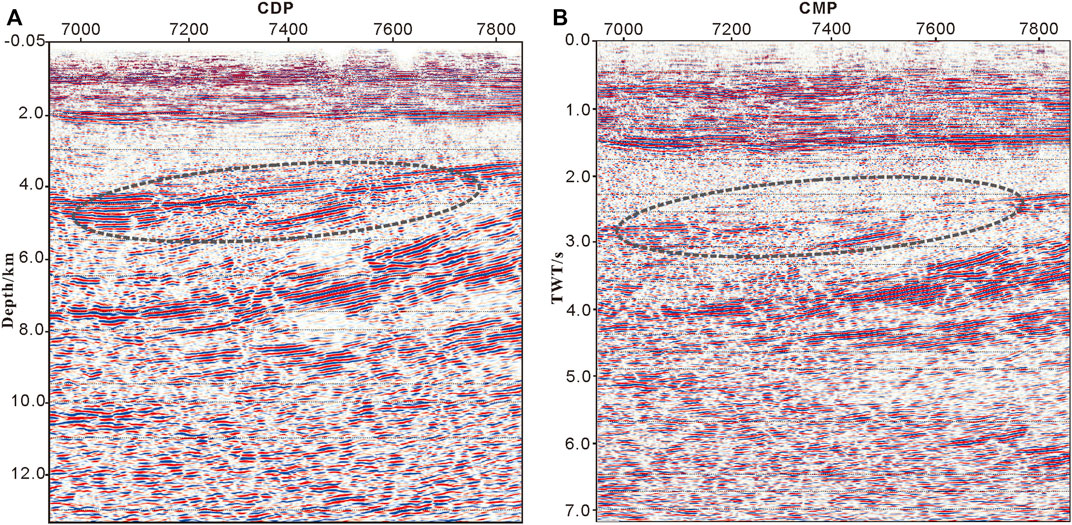
FIGURE 9. Local enlarged profile comparison of the Baxian Sag of the PSDM profile (A) and the PSTM profile (B). (The enlarged range is marked in Figure 7).
4.2 Structure of crust-mantle transition zone
The crust-mantle transition zone is defined by the lower-crust bottom reflectors and a strong reflective Moho interface. The characteristics in PSDM profile are as follows.
1) Generally continuous seismic reflections of crust-mantle transition are well developed in the whole profile except the section from CDP 4200 to CDP 5000. To the west of CDP 4200, the crust-mantle transition zone is composed of dense, strong reflections with a downward convex shape. These reflection events are of a certain thickness and has a longitudinal sustained depth of about 3–4 km in the profile. The Moho depth of CDP 2500 and CDP 4200–5000 has changed. To the east of CDP 5000, the crust-mantle reflection zone is spread horizontally, and the thickness is about 1.5–2.5 km. Compared with the western area, the reflection amplitude of the eastern crust-mantle transition zone is weaker and the thickness is thinner.
2) As a whole, the crust is thicker in the west and thinner in the east, with the section between CDP 4200 and CDP 5000 as the transition zone. From the westernmost point to about CDP 4200, the depth of Moho is 35–39 km. Near CDP 2400, the Moho depth is the deepest at ∼39 km. The corresponding upper crust is the basin bottom of the Xushui Sag controlled by the Baoding-Shijiazhuang fault (F1). In CDP 4200–5000, Moho is discontinuous and the corresponding surface is the Niubei Slope. From CDP 5000 to the easternmost part of the survey line, the Moho is nearly flat with a depth of about 30 km. The Moho has two minor discontinuities located under the Baxian Sag.
3) There are two different reflection characteristics in the lower crust area. Part of the lower crust presents obvious strong amplitude, such as the westernmost part of the profile to CDP 2000, CDP 3000–4200, and CDP 5000–7000, which has discontinuous horizontal characteristics. Part of the lower crust displays transparent reflection, such as CDP 2000–3000 and CDP 4200–5000, which are low reflectivity areas. These transparent reflections of the lower crust correspond to deep Moho discontinuities. It is worth noting that east of CDP 4900, the lower crust has an anticlinal reflection (marked in the blue dashed box).
5 Discussion
5.1 Factors of PSDM
The predominant challenge to applying the PSDM method is to get a reasonable depth-velocity structure. Compared to shallow-crustal seismic reflection profiles used in oil exploration, which can be validated using drill-hole data, lithospheric scale reflection profiles focusing on structures in the lower crust and the upper mantle and having lower signal-to-noise ratios do not have this advantage. The non-single-valued error of velocity-depth increases linearly with depth in shallow layers and squarely with depth in deep layers (Ross, 1994; Bloor et al., 1997). This means that the error between velocity and depth is significant when depth exceeds the maximum offset. To improve the accuracy of seismic reflection velocity is to increase the offset, and the offset of wide-angle reflection and refraction can reach tens to hundreds of kilometers. Therefore, it is of great significance to use wide-angle reflection and refraction to constrain deep seismic reflection profiles for depth migration processing. The necessary condition for accurate reflection wave inversion is that there is adequate effective reflection in the lower crust so that the reliability and rationality of the velocity and depth values can be judged according to the RMO semblance of the CRP gathers. Figure 10 shows the final velocity model and the shear wave velocity structure of the crust and upper mantle through receiving function waveform inversion. The comparison shows that the velocity model in this paper not only has the same variation trend, but also is more refined.
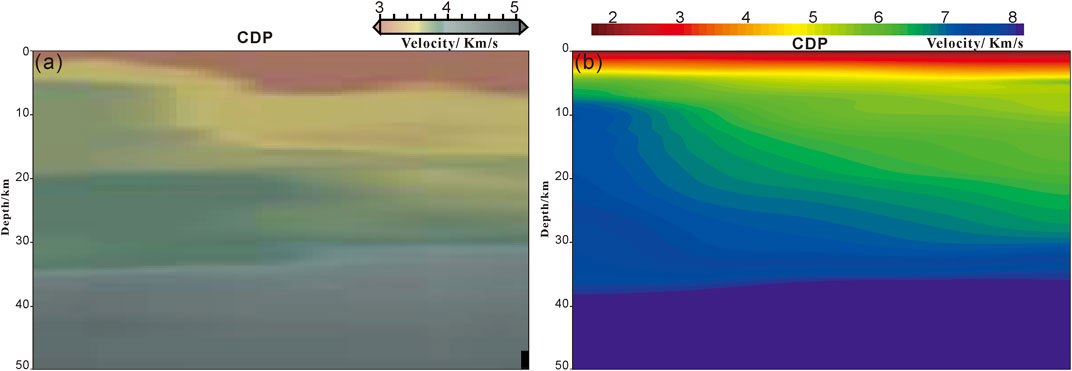
FIGURE 10. The velocity profile in the study area. (A) Shear wave velocity obtained by receiver function waveform inversion of the corresponding area (Zheng et al., 2009) (B) Final velocity model used by the PSDM method.
Another factor for the reasonable deep velocity model obtained by this test inversion is that there is an obvious wave impedance difference in the middle and lower crust, which is consistent with the requirements of the tomographic inversion theory. It also shows that velocity modeling of the lithosphere is a process of combining the understanding of local geology with adequate seismological methods.
Migration aperture is one of the important parameters affecting the PSDM of deep seismic reflection. In this study area, if the aperture is less than 15 km, it will limit the summation of the diffraction hyperbolas, making it impossible to image the lower crustal steep interface. If the aperture is greater than 19 km, a “smiley-face” section which is antiformal migration artifacts appears in the boundary of the transparent area and high reflectivity area below the lower crust. PSDM is a process of stacking all signals. The aperture can be appropriately reduced to avoid wasting calculation time and reducing the signal-to-noise ratio of imaging when the structural fluctuation is not large. However, the aperture should be larger than the length of the receiving length containing effective reflection at least. Or the best is the maximum horizontal displacement of the phase axis in the migration with the steepest angle of the profile (Yilmaz, 2001). In practical application, the selection of aperture size needs to be combined with the depth of the target layer and the degree of inclination. The aperture should be increased to cover the extensive range of high and steep inclines when the structure fluctuates greatly. At the same time, a too-large aperture will reduce the resolution of imaging results (Ma, 2002), so different apertures should be selected according to the complexity of the structure to obtain the best imaging.
5.2 Artifacts of moho horizontal features
The Moho in the stack profile and PSTM profile is nearly horizontal. It is placed at approximately 11s in two-way time. However, we can see that the Moho in the west is about 6 km deeper than in the east. The boundary is positioned from CDP 4200 to CDP 4500, corresponding to an obvious weak reflection of the lower crust. The updated velocity model shows that the velocity of the lower crust is higher in the west and lower in the east. As can be seen from the original records, the apparent velocity of the refracted wave at the west is about 7 km/s at about 3s in two-way time. Although the apparent velocity cannot be directly regarded as the propagation velocity, it can qualitatively reflect the true velocity. The shallow velocity structure obtained from the first-arrival wave inversion verifies the existence of a high-velocity layer in this area. This is the main factor leading to the difference in Moho morphology between the time-domain section and depth-domain section.
5.3 Structural implications of the PSDM profile
The comparison of the PSDM profile and the stack profile of the same survey line is shown in Figures 11A,B. The sedimentary layer in the time domain profile accounts for a large proportion due to the slow propagation speed of the sedimentary layer. And the velocity of the middle and lower crust is higher, so the middle and lower crust occupy a higher proportion in the PSDM profile. From the perspective of the overall lithosphere structure, the Moho offset of the PSDM profile is more obvious than that of the stack profile, and the crust on the west side of the survey line is thicker than that on the east side. Crustal thickness is an important basis for judging the evolution history of the crust, and thinning and thickening generally indicate crustal extension or compression respectively (Meissner and Mooney, 1998). Similar features are also obtained from the dense array receiver function study (Zheng et al., 2009), further confirming the reliability of the pre-stack depth migration profile. The Moho discontinuities and offset are more clearly revealed by the high-resolution PSDM profile which corresponds to weak reflection areas in the lower crust and may represent channels for new mantle material to flow into the crust after the destruction of the thick North China lithosphere. It also shows that the formation time of the Moho predates the mantle upwelling event that did not create a new Moho. On the west side of the survey line, the reflection is short and horizontal in the middle and lower crust. On the east side, it is an anticlinal deformation pattern. The obvious differences in the structure on both sides may prove that the western lower crust once belonged to hard and ancient block, which was closer to the characteristics of the central orogen of the North China Craton (Zhao et al., 2005). It is probably the deep boundary of the central orogeny and eastern block of NCC in the lithosphere scale.
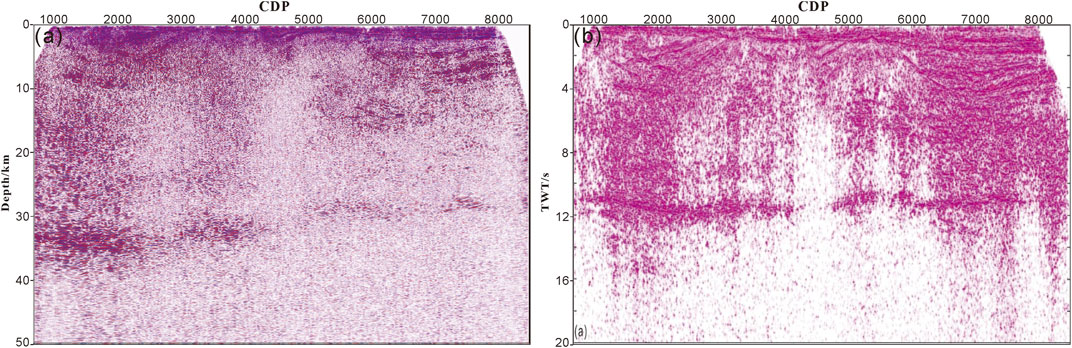
FIGURE 11. The comparison of the PSDM profile and stack profile. (A) PSDM profile (B) Stack profile of the same survey line (Li et al., 2022).
6 Conclusion
The deep seismic reflection profile produced by the PSDM method accurately depicts the crustal structures in the Bohai Bay Basin; sediments thicken from west to east controlled by three major faults. Multiple groups of secondary faults and fault breakpoints are shown on the PSDM profile. The velocity varies laterally, higher in the west and lower in the east. The crustal thickness defines the basic structural feature of being thick in the west and thin in the east. The Moho displays several discontinuities along the profile. On both sides of the CDP 4200- CDP 5000 section in the profile, the Moho offset is up to 6 km. These discontinuities correspond to weakly reflective domains in the lower crust and may represent channels for new mantle material to flow into the crust during or after the destruction of the earlier, thicker North China lithosphere.
There are differences between the PSDM results and time-domain imaging results. The PSDM method can provide more reliable imaging results than time-domain sections. The PSDM method can not only resolve the problem of fault imaging but also make the contact relationship of shallow faults more reliable. At the same time, it can better locate lower crustal complex structures and provide the depth position information of reflection interfaces. The Moho discontinuities are clear, depicting the thinning of the crust due to the interaction between the crust and the mantle. For the imaging results of the lower crust and lithospheric mantle, other geological and geophysical data in this area confirm the rationality of the pre-stack depth migration results in this area.
Data availability statement
The raw data supporting the conclusions of this article will be made available by the authors, without undue reservation.
Author contributions
XD processed seismic data and wrote the manuscript. HL and RG conducted the seismic survey and guided the ideology of the geological interpretations. All authors contributed to the final manuscript preparation.
Funding
Innovation Group Project of Southern Marine Science and Engineering Guangdong Laboratory (Zhuhai) [grant number 311021003]; The Pearl River Talent Recruitment Program of Guangdong Province, China [grant number 2017ZT07Z066].
Conflict of interest
The authors declare that the research was conducted in the absence of any commercial or financial relationships that could be construed as a potential conflict of interest.
Publisher’s note
All claims expressed in this article are solely those of the authors and do not necessarily represent those of their affiliated organizations, or those of the publisher, the editors and the reviewers. Any product that may be evaluated in this article, or claim that may be made by its manufacturer, is not guaranteed or endorsed by the publisher.
References
Bloor, R., Deregowski, S., Nessim, M., and El-Kady, N. (1997). Practical depth imaging strategy in the Middle East. Lead. Edge 16, 1832–1836. doi:10.1190/1.1437594
Bouzidi, Y., Schmitt, D. R., Burwash, R. A., and Kanasewich, E. R. (2002). Depth migration of deep seismic reflection profiles: Crustal thickness variations in Alberta. Can. J. Earth Sci. 39, 331–350. doi:10.1139/e01-080
Brown, L. D. (1991). A new map of crustal ‘terranes’ in the United States from COCORP deep seismic reflection profiling. Geophys. J. Int. 105, 3–13. doi:10.1111/j.1365-246x.1991.tb03439.x
Calvert, A. J., and Doublier, M. P. (2018). Archaean continental spreading inferred from seismic images of the Yilgarn Craton. Nat. Geosci. 11, 526–530. doi:10.1038/s41561-018-0138-0
Chen, L., Wei, Z. G., and Chi, C. (2010). Significant structural variartions in the Central and Western North China Craton and its implications for the craton destruction. (in Chinese with English abstract). Earth Sci. Front. 17 (1), 212–228.
Christensen, N. I., and Mooney, W. D. (1995). Seismic velocity structure and composition of the continental crust: A global view. J. Geophys. Res. Solid Earth 100, 9761–9788. doi:10.1029/95jb00259
Clowes, R., Kanasewich, E., and Cumming, G. (1968). Deep crustal seismic reflections at near-vertical incidence. Geophysics 33, 441–451. doi:10.1190/1.1439942
Cook, F. A. (1995). The reflection Moho beneath the southern Canadian Cordillera. Can. J. Earth Sci. 32, 1520–1530. doi:10.1139/e95-124
Cook, F. A., Van Der Velden, A. J., Hall, K. W., and Roberts, B. J. (1999). Frozen subduction in Canada's Northwest Territories: Lithoprobe deep lithospheric reflection profiling of the Western Canadian Shield. Tectonics 18, 1–24. doi:10.1029/1998tc900016
Duan, Y. H., Wang, F. Y., Zhang, X. K., Lin, J. Y., Liu, Z., Liu, B. F., et al. (2016). Three dimensional crustal velocity structure model of the middle-eastern North China Craton (HBCrust1.0). Sci. China Earth Sci. 59, 1477–1488. doi:10.1007/s11430-016-5301-0
He, D., Shan, S., Zhang, Y., Lu, R., Zhang, R., and Cui, Y. (2018). 3-D geologic architecture of Xiong’an New Area: Constraints from seismic reflection data. Sci. China Earth Sci. 61, 1007–1022. doi:10.1007/s11430-017-9188-4
Kopp, H., Hindle, D., Klaeschen, D., Oncken, O., Reichert, C., and Scholl, D. (2009). Anatomy of the Western Java plate interface from depth-migrated seismic images. Earth Planet. Sci. Lett. 288, 399–407. doi:10.1016/j.epsl.2009.09.043
Kusky, T. M., and Li, J. (2003). Paleoproterozoic tectonic evolution of the North China craton. J. Asian Earth Sci. 22, 383–397. doi:10.1016/s1367-9120(03)00071-3
Li, H., Huang, X., Gao, R., Carbonell, R., and Gao, L. (2022). Imaging a decratonized lithosphere: A case of the eastern north China craton. Geophys. Res. Lett. 49, e2022GL099484. doi:10.1029/2022gl099484
Li, S. Z., Suo, H. Y., Dai, L. M., Liu, L. P., Jin, C., Liu, X., et al. (2010). Development of the Bohai Bay Basin and destruction of the North China craton (in Chinese with English abstract). Earth Sci. Front. 17 (4), 064–089.
Li, W. H. (2013). Ph.D doctoral thesis. Beijing, China: Chinese Academy of Geological Sciences.Joint exploration of deep seismic reflection and deep seismic sounding with its application in crust structure research
Lynn, H. B., Quam, S., and Thompson, G. A. (1983). Depth migration and interpretation of the COCORP Wind River, Wyoming, seismic reflection data. Geology 11, 462–469. doi:10.1130/0091-7613(1983)11<462:dmaiot>2.0.co;2
Ma, X. Y., Liu, H. F., Wang, W. X., and Wang, Y. P. (1983). Meso-Cenozoic taphrogeny and extensional tectonics in eastern China (in Chinese with English abstract). Acta Geol. Sin. 57, 22–32.
Ma, Z. T. (2002). On reflection seismic migration imaging. Prog. Explor. Geophys. 25, 1–5. (in Chinese).
Meissner, R., and Mooney, W. (1998). Weakness of the lower continental crust: A condition for delamination, uplift, and escape. Tectonophysics 296, 47–60. doi:10.1016/s0040-1951(98)00136-x
Potter, C. J., Sanford, W. E., Yoos, T. R., Prussen, E. I., Keach, R. W., Oliver, J. E., et al. (1986). COCORP deep seismic reflection traverse of the interior of the North American Cordillera, Washington and Idaho: Implications for orogenic evolution. Tectonics 5, 1007–1025. doi:10.1029/tc005i007p01007
Qi, J. F., Yu, F. S., Lu, K. Z., Zhou, J. X., Wang, Z. Y., and Yang, Q. (2003). Conspectus on mesozoic basins in Bohai Bay province (in Chinese with English abstract). Earth Sci. Front. 10 (1), 199–206. doi:10.3969/j.issn.1000-3657.2004.01.002
Ross, W. S. (1994). The velocity-depth ambiguity in seismic traveltime data. Geophysics 59, 830–843. doi:10.1190/1.1443641
Wang, H. Y., Gao, R., Lu, Z. W., Li, Q. S., Kuang, Z. Y., Liu, J. K., et al. (2010). Fine structure of the continental lithospheric circle revealed by deep seismic reflection profile. (in Chinese with English abstract). Acta Geol. Sin. 84, 818–839.
Warner, M. (1987). Migration - why doesn't it work for deep continental data? Geophys. J. Int. 89, 21–26. doi:10.1111/j.1365-246x.1987.tb04382.x
Yang, C. C., Liu, X. C., Li, Y. M., Liu, F. G., Leng, C. B., and Liu, H. (1996). A methodology for seismic prestack depth migration. Geophys 39, 409–415. (in Chinese).
Yilmaz, Ö. (2001). Seismic data analysis: Processing, inversion, and interpretation of seismic data. Houston, TX, USA: Society of exploration geophysicists.
Zhai, M. G. (2010). Tectonic evolution and metallogenesis of North China Craton (in Chinese with English abstract). Min. Dep. 29, 24–36. doi:10.3969/j.issn.0258-7106.2010.01.004
Zhao, G., Sun, M., Wilde, S. A., and Sanzhong, L. (2005). Late archean to paleoproterozoic evolution of the North China craton: Key issues revisited. Precambrian Res. 136, 177–202. doi:10.1016/j.precamres.2004.10.002
Zheng, T., Zhao, L., and Zhu, R. (2009). New evidence from seismic imaging for subduction during assembly of the North China craton. Geology 37, 395–398. doi:10.1130/g25600a.1
Zhu, R., Chen, L., Wu, F., and Liu, J. (2011). Timing, scale and mechanism of the destruction of the North China Craton. Sci. China Earth Sci. 54, 789–797. doi:10.1007/s11430-011-4203-4
Keywords: deep seismic reflection profile, PSDM, crustal structure in depth domain, lateral and vertical velocity changes, craton structure
Citation: Deng X, Li H and Gao R (2023) Depth migration of crustal-scale seismic reflection profiles: A case study in the Bohai Bay basin. Front. Earth Sci. 11:1145095. doi: 10.3389/feart.2023.1145095
Received: 15 January 2023; Accepted: 07 February 2023;
Published: 20 February 2023.
Edited by:
Zhao Junmeng, Institute of Tibetan Plateau Research (CAS), ChinaCopyright © 2023 Deng, Li and Gao. This is an open-access article distributed under the terms of the Creative Commons Attribution License (CC BY). The use, distribution or reproduction in other forums is permitted, provided the original author(s) and the copyright owner(s) are credited and that the original publication in this journal is cited, in accordance with accepted academic practice. No use, distribution or reproduction is permitted which does not comply with these terms.
*Correspondence: Hongqiang Li, aG9uZ3FpYW5nbGlAMTI2LmNvbQ==