 Kensuke Yamaguchi
 Ryo Tanaka
 Masaaki Morita
 Toshiya Mori
 Ryunosuke Kazahaya
- 1Department of Natural History Sciences, Graduate School of Science, Hokkaido University, Sapporo, Japan
- 2Faculty of Science, Institute of Seismology and Volcanology, Hokkaido University, Sapporo, Japan
- 3Earthquake Research Institute, The University of Tokyo, Tokyo, Japan
- 4Graduate School of Science, The University of Tokyo, Tokyo, Japan
- 5Geological Survey of Japan, National Institute of Advanced Industrial Science and Technology (AIST), Tsukuba, Japan
Introduction: Monitoring the volcanic activity of a potentially hazardous volcano is essential for eruption warning and hazard mitigation. The SO2 flux from the volcano is one of the most important measures to understand its activity. Mount Tokachi, in Japan, is an active volcano that experienced three magmatic explosive eruptions in the 20th century (in 1926, 1962, and 1988–1989). Since 2006, geodetic observations have captured ground deformation, suggesting an inflation beneath the main crater. Moreover, since 2020 daily visual observations have detected the increase in plume heights and the occurrence of volcanic glow at the main crater. The high-time-resolution estimation of SO2 flux will help monitor the activity of Mount Tokachi and clarify the associating mechanisms. Furthermore, satellite remote sensing can estimate the vertical column density (VCD) of sulfur dioxide (SO2), enabling the daily determination of SO2 flux without the need to visit the site. Due to the improved spatial resolution, the TROPOspheric Monitoring Instrument (TROPOMI) has advanced satellite-based volcanic gas flux measurements.
Methods: We have analyzed the available TROPOMI data and conducted ground-based observations to estimate the SO2 flux from Mount Tokachi at 100–2,000 tons/day.
Result and Discussion: The average annual SO2 flux has been increasing since 2021, on par with the increase in plume height and volcanic glow. TROPOMI data enabled quantification of the annual SO2 flux, with a sufficient temporal resolution to monitor the volcanic activity at Mount Tokachi. However, a high flux, such as in excess of 2,000 tons/day, was observed in the winter season. The flux from the satellite data was similar to that from ground-based observations during the summer. However, a seasonal change in flux from the satellite data was observed in winter, with the flux being larger than that in summer, possibly because the flux increases during winter. Another possible reason is the influence of snow cover on satellite observations due to its high surface reflectance. We reanalyzed some TROPOMI data during the winter, in which the ground snow cover was misidentified as clouds at low altitudes. This procedure suppresses the error caused by the high surface reflectance due to winter snow coverage and improves the quality of the annual SO2 flux from satellite observations. This methodology is applicable to other high-latitude or high-altitude volcanoes during specific seasons characterized by frequent fluctuations in snow cover conditions.
1 Introduction
Volcanic gas degassed from magma provides crucial clues about magmatic processes within the shallow part of volcanoes. Sulfur dioxide (SO2) in a volcanic plume is used as a proxy for volcanic gas flux because it is easily measured using ultraviolet (UV) remote sensing techniques, and the atmosphere is mostly SO2-free. Moreover, the volcanic SO2 flux is thought to reflect the supply rate of degassing magma (Wallace, 2001; Shinohara, 2008) and movements of magma and magmatic fluids inducing seismicity or ground deformation (Nadeau et al., 2011; Kazahaya et al., 2011; Kazahaya et al., 2015a; Kazahaya et al., 2015b; McGonigle et al., 2017). Notably, volcanic SO2 flux has been measured since the 1970s (Stoiber et al., 1983; Edmonds et al., 2003; Salerno et al., 2009; Galle et al., 2010). Fluctuations in SO2 flux in association with volcanic unrest have been reported for many active volcanoes (e.g., Daag et al., 1996; Poland et al., 2009; Kazahaya et al., 2015a; Mori et al., 2017), demonstrating the importance of monitoring SO2 flux to implement eruption warnings and mitigate hazards.
The TROPOspheric Monitoring Instrument (TROPOMI) has advanced satellite-based volcanic gas flux measurements (Theys et al., 2017). This instrument provides a snapshot of the volcanic SO2 plume with high temporal (mostly daily) and spatial (3.5 × 5.5 km2) resolutions. The SO2 is retrieved from band 3 (310–405 nm), with a typical spectral resolution of 0.54 nm and a signal-to-noise ratio of about 1,000. Theys et al. (2019) estimated SO2 flux during eruptions at Mayon in the Philippines and Popocatepetl in Mexico using TROPOMI. Moreover, Queißer et al. (2019) applied back-trajectory modeling for the non-eruptive SO2 plume from Mt. Etna, Italy, detected using TROPOMI to derive hourly SO2 flux time series. These results were compared with ground-based observations to validate the quantitative performance of TROPOMI. Notably, besides eruptive dense SO2 plumes, non-eruptive diluted plumes (lower SO2 flux) can be detected and quantified using this novel technique.
Mount (Mt.) Tokachi is an active volcano located in central Hokkaido, Japan (Figure 1A), and has experienced three magmatic explosive eruptions in 1926, 1962, and 1988–1989 (Katsui et al., 1990). The 1926 eruption triggered lahars (Uesawa, 2014), which reached the town at the foot of the volcano, killing 144 people (Tada and Tsuya, 1927; Committee for Prevention of the Natural Disaster of Hokkaido, 1971). Uesawa (2014) proposed that hydrothermal fluids released due to a sector collapse caused by the eruption played a role in the long runout of the lahar. Based on the resistivity structure, Tanaka et al. (2021) pointed out that the volume of hydrothermal fluids existing just below the crater area of Mt. Tokachi is comparable to the volume affecting the 1926 lahar. Notably, lahars are common at Mt. Tokachi, taking place once every 250 years over the last 2,000 years (Nanri et al., 2008). Due to the increasing population of towns at the foot of the mountain, and more frequent tourist visitations, a lahar of the same magnitude as that of 1926 are a threat to population centers, tourists and infrastructure. Therefore, volcanic eruptions at Mt. Tokachi have the potential to cause large-scale volcanic disasters. Consequently, the volcano should be monitored at least monthly or better still weekly.
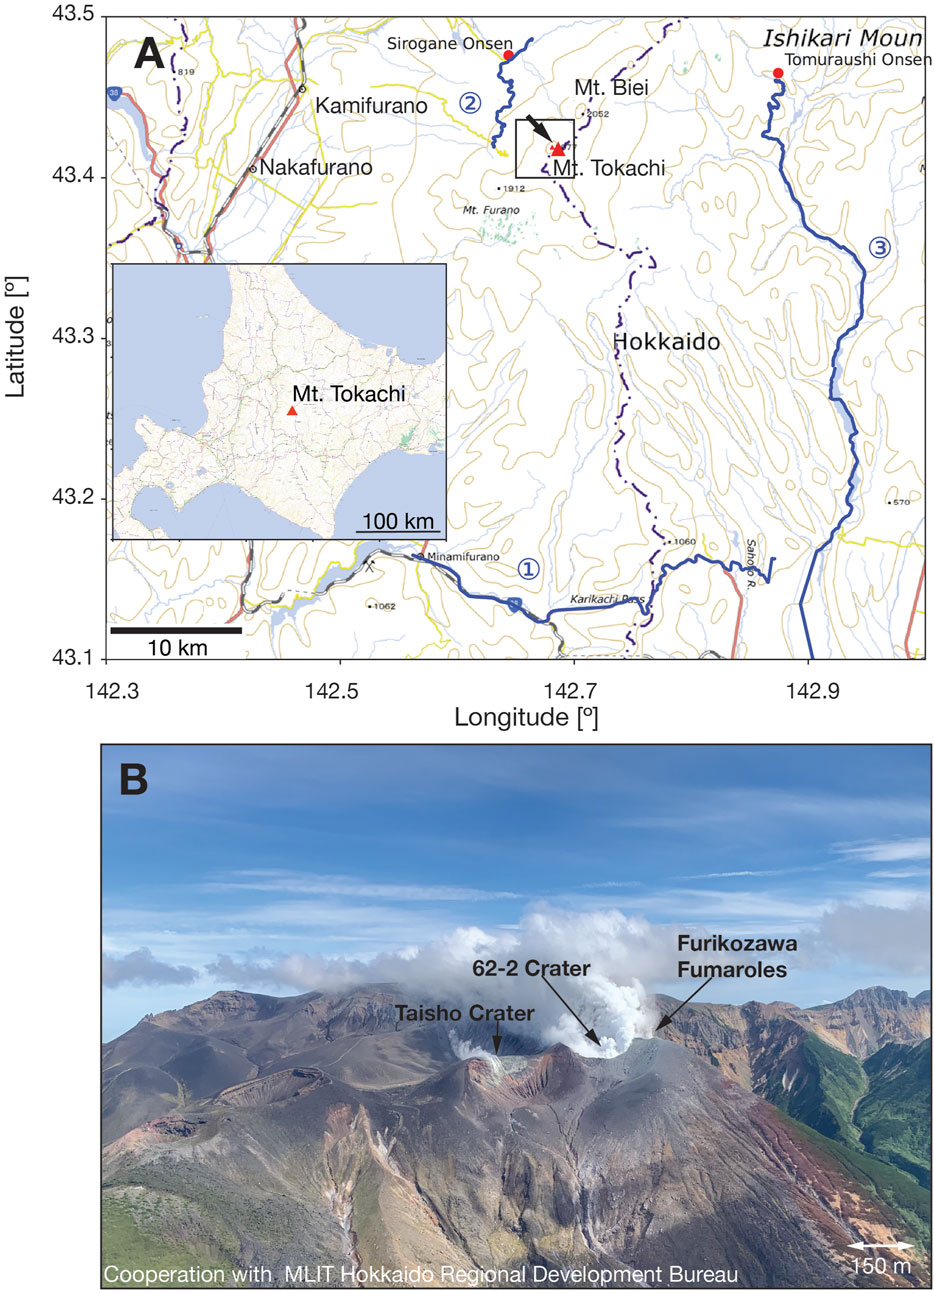
FIGURE 1. Location map of Mt. Tokachi and photograph of Mt. Tokachi. (A) Map of central Hokkaido (inset = Hokkaido) showing the location of Mt. Tokachi. The SO2 flux measurement traverses route by car is indicated by the blue line. The lahars in 1926 reached Kamifurano and Nakafurano towns located west of Mt. Tokachi. The black arrow near the volcano indicates the direction of the Photograph (B). (B) Photograph of the crater of Mt. Tokachi taken by Ryo Tanaka on 2 September 2022.
Notably, unrest has been observed at Mt. Tokachi; volcanic gas plumes are currently emitting from three craters (Figure 1B): Crater 62–2, of the 1962 eruption; Taisho Crater, formed in the 1926 eruption; and the Furikosawa Fumaroles, which appeared in 1972 and expanded its fumarolic zone during the 1988–1989 eruption. Recently, the main fumarolic activity has been at Crater 62–2 (Japan Meteorological Agency, 2021). Furthermore, Japan Meteorological Agency (JMA) has reported on pre-2005 fumarolic activity at Crater 62–2 was active before 2005, with a monthly maximum plume height in excess of 500 m (JMA, 2021). However, since 2005, this fumarolic activity has been sluggish. In addition, intermittent localized ground deformation observed since 2006 indicates inflation at the shallow part beneath the 62–2 crater (Regional Volcanic Observation and Warning Center, Sapporo Regional Headquarters, JMA, 2018). Also, annual magnetic total-field measurements have revealed demagnetization, indicating heating at a shallow depth beneath the crater (Hashimoto et al., 2010). Tanaka et al. (2017) suggested that these unrest episodes are triggered by the obstruction of the plume conduit. Additionally, they have pointed out that outgassing from the crater should be monitored to track and better understand this unrest at Mt. Tokachi. According to the JMA monthly volcanic activity report of Mt. Tokachi (https://www.data.jma.go.jp/svd/vois/data/tokyo/STOCK/monthly_v-act_doc/sapporo/22m10/108_22m10.pdf), an increase in plume height has been observed since 2018. Volcanic glow has occasionally been observed at crater 62–2 since June 2020. Therefore, geochemical and geophysical monitoring of this activity at Mt. Tokachi is paramount.
SO2 flux is part of the monitoring of Mt. Tokachi activity. SO2 flux measurements at Mt. Tokachi are conducted using ground- and satellite-based observations. Mori et al. (2013), using car and walking traverses, estimated the SO2 flux at Mt. Tokachi in 2003 and 2006 to be approximately 200 tons/day. However, it is difficult to maintain such flux measurements using the ground-based traverses at sufficient frequency due to the limited number of routes suitable for ground traverse measurements around Mt. Tokachi (Figure 1A). Firstly, there are no suitable routes to the north, and secondly, the southern route (① of Figure 1A) is too far away (30 km) for the typical plume magnitudes at Mt. Tokachi. Thirdly, the route on the west side (② of Figure 1A) is at an adequate distance for this type of measurement, but the weather is often poor at times of easterly winds, and it is closed in winter because of snow. Fourthly, the eastern route (③ of Figure 1A) features many tunnels and trees that severely limit the sections where SO2 can be measured. Furthermore, measurements of the SO2 flux by walking traverses around the craters have been undertaken every year since 2014. In 2015 and 2016, the traverse quantified the SO2 flux as 200–500 tons/day (Supplementary Material). However, such traverses did not provide an estimate of the SO2 flux in other years because the mountain can only be climbed in summer when the weather is good. Additionally, the extent of the walking paths is limited; hence, wind direction determines whether SO2 flux can be measured.
Using satellite observations, Carn et al. (2017) estimated an average SO2 flux at Mt. Tokachi of 135 tons/day between 2005 and 2015. However, they only reported on the annual average flux and used averaging or oversampling procedures to resolve the potential locations of SO2 emissions. Furthermore, the Ozon Monitoring Instrument (OMI) used by Carn et al. (2017) had a low spatial resolution (13 × 24 km2 at the nadir). High temporal resolution observations of small plumes are difficult with OMI because their estimation requires processing like done by Carn et al. (2017).
This study aims to demonstrate the applicability of TROPOMI in assessing SO2 flux during 2019–2022 (non-eruptive period) at Mt. Tokachi and as such can be used to monitor ongoing but periodic volcanic unrest. We analyze data obtained via satellite- and ground-based observations at Mt. Tokachi, Japan. The ground-based data are used to validate the satellite observations.
2 Materials and methods
We analyzed satellite-based data obtained with TROPOMI between August 2019 and October 2022 and conducted ground-based measurements of car traverses as often as possible between June 2021 and March 2022.
For the satellite-based data, we used the TROPOMI SO2 Level 2 data products processed by the European Space Agency (ESA) (Copernicus Sentinel data processed by ESA, German Aerospace Center DLR, 2019; Copernicus Sentinel data processed by ESA, German Aerospace Center DLR, 2020). We estimated the SO2 flux based on the method proposed by Theys et al. (2019) with some modifications to apply to a relatively small-scale plume. The Level 2 products contain Vertical Column Density (VCD), assuming the presence of SO2 plumes centered at 1, 7, and 15 km. Based on these data, the VCD for each pixel was estimated by linear interpolation, assuming that the SO2 plume was located at an altitude of 2000 m (Figure 2A). This height was based on visual observations of the plume height routinely operated by JMA (Japan Meteorological Agency, 2021) that showed the data of 200–400 m above the crater rim (the rim of Crater 62–2 is approximately 1800 m). First, pixels with solar zenith angles
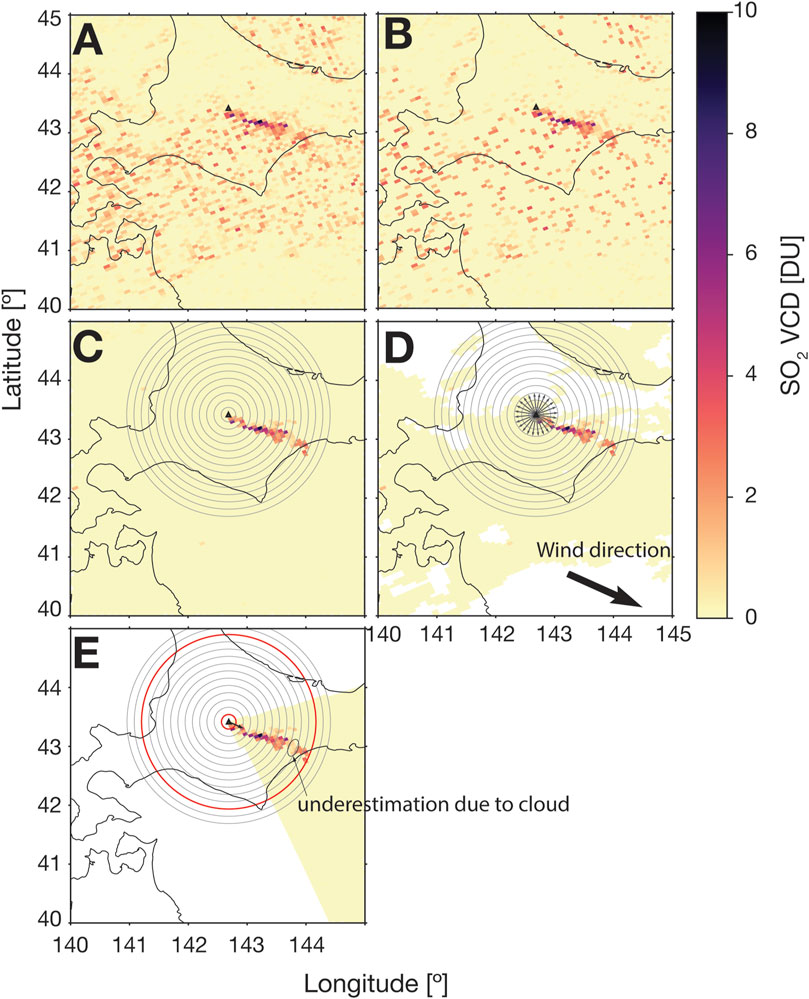
FIGURE 2. SO2 vertical column density (VCD) distribution during the procedure to calculate the flux by satellite data. (A) VCD distribution linearly interpolated by plume altitude. The plume altitude is assumed to be 2000 m and linearly interpolated from 1 km to 7 km data in the TROPOMI L2 data set. (B) VCD distribution after filtering pixels with 1) solar zenith angle
Next, the days for flux estimation were selected based on plume continuity which was determined using concentric circles (distance windows), indicating the distance of the plume advection from the volcano. We set a distance window as 10 km width based on TROPOMI’s pixel size. At TROPOMI’s pixel size, a 10 km width contains at least two pixels. Although a time window with a fixed time (30 min) regardless of wind speed was used by Theys et al. (2019), the width (distance) of the time window became wider, and fewer plumes filled a single time window as the wind speed increased. Therefore, we adopted distance windows with a constant width independent of the wind speed. Next, we drew distance windows corresponding to the advection distance within 6 h, assuming a constant wind speed around the volcano (Figure 2C). Regarding the constant wind speed, we used the average wind speed of the grid point value (GPV) data obtained from the mesoscale numerical weather prediction model (MSM) designed by JMA at 800 MPa isobars (corresponding to 2,000 m altitude) above Mt. Tokachi. Additionally, regarding the days for flux estimation, we visually picked days when the plume extended over two or more distance windows. Notably, days with wind speeds of ≥ 2 m s−1 were included in the analysis because the plume may be retained around the crater if the wind speed is low.
The distance windows for flux estimation were determined using the following procedures. First, pixels with cloud fractions (including the L2 products)
Lastly, SO2 flux was determined as follows. First, the cloud mask was removed because if it partially masks pixels within the range for integration, it may cause underestimation (Figure 2E). Next, the VCDs within the selected distance windows were integrated. Subsequently, the daily flux was estimated using the integrated VCDs and advection times corresponding to the distance windows used. Some pixels with a cloud fraction
Ground-based observations were conducted using the car traverse method. A miniature UV spectrometer (USB 2000+, Ocean Optics, Inc.) was mounted on the vehicle and passed under the plume to measure the VCD of SO2. The VCD was obtained using Mobile DOAS software (Arellano et al., 2019) through the three routes shown in Figure 1. The software collects UV spectra of the zenith sky during the traverse, automatically analyze the spectra for SO2 VCD by DOAS (Differential Optical Absorption Spectroscopy) method (Platt and Stutz, 2008) in real-time, and records the calculated VCD together with GPS positions. Next, the SO2 flux was estimated by multiplying the plume advection velocity by the integral of the VCDs in the cross-section perpendicular to the direction of the plume advection using the Mobile DOAS. Regarding plume advection velocity, we used an average wind speed of GPV data obtained from the mesoscale numerical weather prediction model (MSM) designed by JMA at 800 MPa isobars (corresponding to 2000 m altitude) above Mt. Tokachi.
3 Results
We estimated the SO2 flux from Mt. Tokachi, regardless of the wind direction and speed. Figure 3 shows “good” examples of the VCD distribution on a day suitable for flux estimation. Figure 3A shows an example from 7 August 2019, of a day with a low wind velocity. Near the volcano a continuous plume is observed, and the flux is estimated using pixels crossing two distance windows. Figure 3B shows an example from 20 July 2021, a day with high wind velocity. The distance windows enabled us to integrate the plume at an appropriate length, even if plume continuity was lost at ∼ 50 km distance from the source vent. We included in our analysis cases when continuity was confirmed in the absence of the cloud mask, even if the plume is fragmented by the application of a cloud mask, as shown for 28 July 2022 (Figure 3C). In such a case, we only used the pixels with lower cloud fractions for the flux estimation. Lastly, 3 October 2019, is an example of one of the lowest observed fluxes (Figure 3D). The high spatial resolution of TROPOMI enabled us to quantify SO2 plumes of
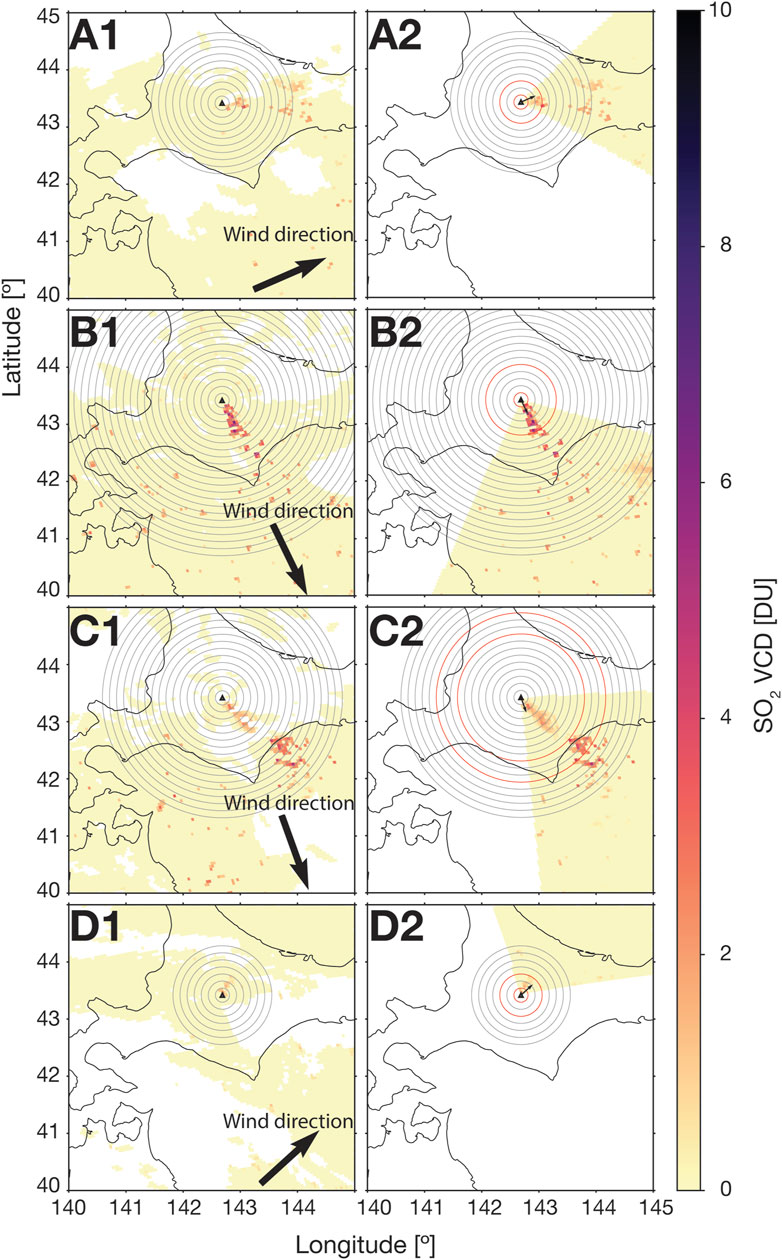
FIGURE 3. Examples of “good” VCD distribution for SO2 flux estimation (1: masked by cloud fraction, 2: for VCD integration). Black circles are distance windows. The black arrow represents the wind direction. We integrated VCDs between two red circles. (A) 7 August 2019, example of the day with low wind velocity; wind velocity v = 4.6 m s−1, SO2 flux M = 185.9 ± 34.1 tons/day. (B) 20 July 2021, example of the day with high wind velocity; wind velocity v = 10.2 m s−1, SO2 flux M = 931.9 ± 202.7 tons/day. (C) 28 July 2022, example of the plume fragmented by cloud mask. We estimated SO2 flux using the detached area. Wind velocity v = 7.7 m s−1, SO2 flux M = 389.0 ± 119.0 tons/day. (D) 3 October 2019, example of the day with low flux; wind velocity v = 3.2 m s−1, SO2 flux M = 66.1 ± 15.8 tons/day.
We analyzed the data with a few unsatisfactory or problematic conditions labeled as “poor” and examples are shown on Figure 4. An example that marginally fails to satisfy the condition of crossing two distance windows is shown in Figure 4A. In such cases, we integrated the VCDs within a single distance window. An example of a significant difference between wind and plume directions is illustrated in Figure 4B. Here, we defined a significant difference as ≥ 60° and treated the data as problematic because it is not given that the wind velocity matches may not match the advection velocity of the plume. As shown in Figure 4C, the plume was advected in two directions and most likely caused by variations in the wind direction with altitude. If integration is not carried out in both directions the SO2 flux may be underestimated. Also, as wind speeds may differ in relation to direction, only the plume matching roughly to the wind direction was integrated into this case. This situation was observed for only 1 day during the analyzed period. All “poor” data are shown in the Supplemental Material.
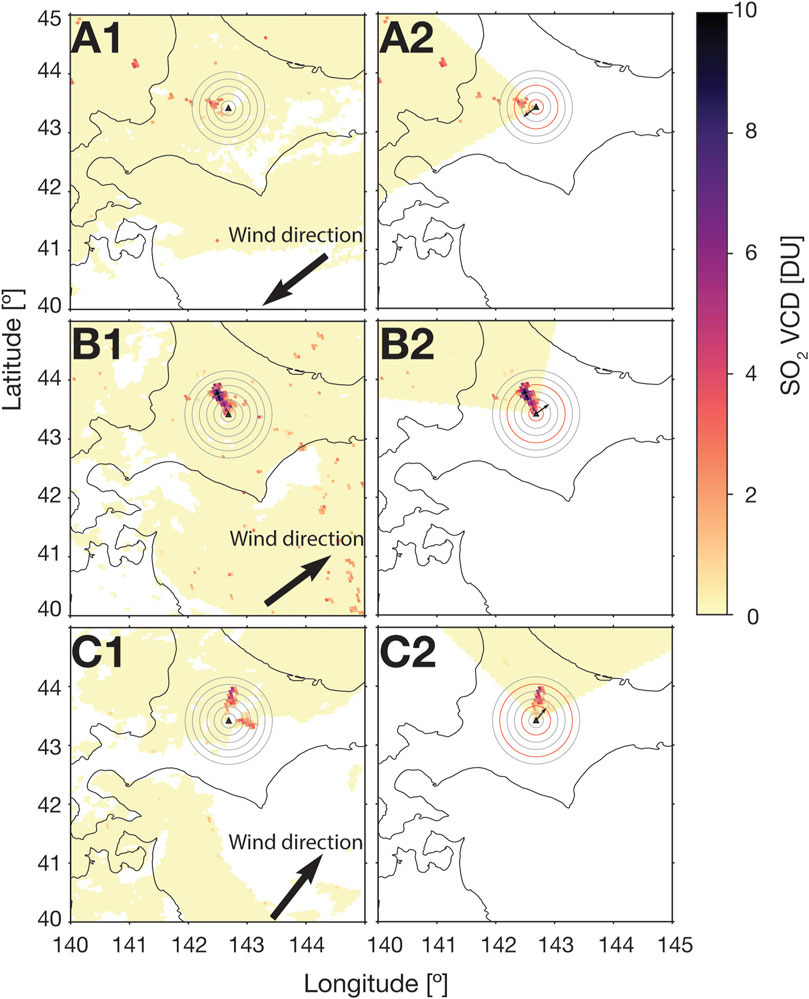
FIGURE 4. Example of SO2 flux measurements with a few unsatisfactory or problematic conditions (1: masked by cloud fraction, 2: for the integration of VCD). Black circles are distance windows. The black arrow represents the wind direction. We integrated VCDs between two red circles. These days are labeled as “poor” and plotted with black symbols in Figure 5. (A) 13 April 2020, example of the day that slightly fails to satisfy the requirement of being across two distance windows; wind velocity v = 2.2 m s−1, SO2 flux M = 150.1 ± 44.7 tons/day. (B) 21 August 2021, example of significant difference ( ≤ 60°) between wind and plume directions; wind velocity v = 2.5 m s−1, SO2 flux M = 469.0 ± 89.6 tons/day. (C) 11 September 2021, example of plume advecting in two directions; wind velocity v = 2.5 m s−1, SO2 flux M = 229.3 ± 39.2 tons/day. We integrated only the plume with higher VCDs than others.
Ground-based observations obtained a flux of 80–600 tons/day in 2021 (Table 1). Only the measurements on 2 March 2022, indicated high SO2 flux of 1,287 ± 643 tons/day. As we reside in Sapporo, Hokkaido, 150–225 km from Mt. Tokachi, only days with a promising weather forecast and favorable wind direction were selected for traverse measurements. For this study only 5 days produced reliable measurements.
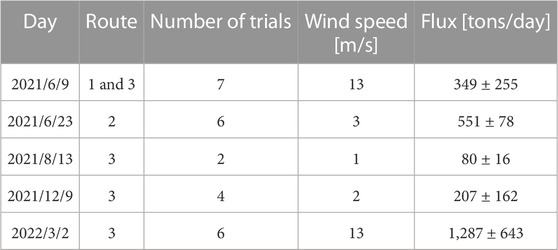
TABLE 1. Results of ground observation.
On the other hand, we obtained measurements of the daily SO2 flux at Mt Tokachi from 108 days using satellite-based observations. Figure 5 shows the temporal variation in SO2 flux. The minimum time interval at which the flux could be estimated by analyzing the satellite data was 1 day, the maximum was approximately 2 months, and the average was approximately 10 days. Analyzing satellite data made it possible to quantify SO2 flux throughout the year and the temporal resolution is high enough to monitor volcanic activity. The SO2 flux from Mt. Tokachi in 2019–2022 ranged from ∼ 100–2,000 tons/day. However, fluxes exceeding 2,000 tons/day, were only obtained in winter, while the flux estimated from the ground and satellite observations was consistent and stable during the summer.
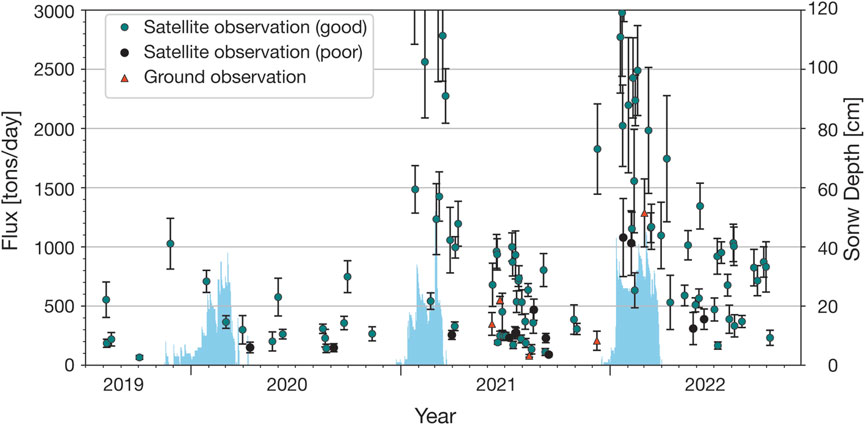
FIGURE 5. Temporal variation in the SO2 flux at Mt. Tokachi according to satellite data and ground-based observations. The green and black circles represent the flux measured by satellite observations. The red triangles represent ground-based observations. The blue bar indicates the snow thickness at AMeDAS, located approximately 53 km east-southeast of Mt. Tokachi. SO2 flux of approximately 100–2,000
4 Discussion
Two factors influence the seasonal variation: 1) the winter effect (i.e., the snow cover) on satellite data and 2) enhancement of the volcanic activity in winter. First, we address the influence of snow cover on satellite data. The blue bars in Figure 5 show the snow depth at an AMeDAS station (Kamishihoro) located 53 km east-southeast of Mt. Tokachi. The strong positive correlation between snow depth and enhanced SO2 flux suggests that the seasonal flux-increase might be induced by greater surface reflectance because of the snow cover. TROPOMI measures SCD, which is converted to VCD using a conversion factor—Air Mass Factor (AMF). AMF considers observations’ geometrical information, total ozone absorption, clouds, and surface albedo (Theys et al., 2019). According to Romahn et al. (2020), the AMF of TROPOMI was calculated using the climatological monthly minimum Lambertian equivalent reflector (minLER) measured by OMI as the surface reflectance (Figures 6A, C, data are included in TROPOMI L2 products). No significant difference was observed between January (Figure 6A) and July (Figure 6C), even though surface reflectance may be more significant in winter due to snow cover. Figures 6B, D show the minLER of 328 nm UV light in the TROPOMI data products, which is close to the actual reflectance (Tilstra, 2022). The reflectance in January (Figure 6B) was higher than that in July (Figure 6D). Furthermore, by comparing the OMI data with the TROPOMI data for winter (January), TROPOMI data have a considerably higher reflectance. According to Theys et al. (2017), AMF values near the ground surface vary significantly with surface albedo by a factor of 2–3 compared with albedo values of 0.06 and 0.8. Therefore, an overestimation of SO2 VCD due to AMF calculated using an albedo smaller than the actual situation may influence the tendency of SO2 flux to increase during winter.
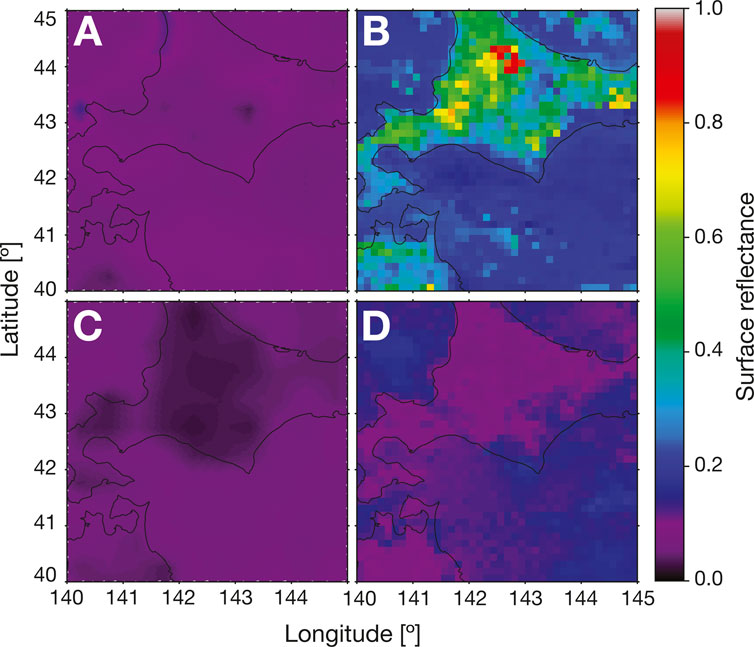
FIGURE 6. Examples of surface reflectance. (A) Surface reflectance (minLER for 328 nm) in January observed by OMI used in TROPOMI’s AMF calculations included in TROPOMI L2 products. Despite the fact that the observations are from the winter season, the reflectivity is on par with the summer values. (B) Surface reflectance (minLER in snow and ice condition for 328 nm) in January observed by TROPOMI (Tilstra, 2022). The reflectance is relatively high. (C) July surface reflectance (minLER for 328 nm) observed by OMI used in TROPOMI’s AMF calculations included in TROPOMI L2 products. (D) July surface reflectance (minLER in snow and ice-free condition for 328 nm) observed by TROPOMI (Tilstra, 2022).
To monitor volcanic activity from satellites throughout the year, SO2 VCD must be estimated correctly during the snow season (winter). Notably, calculating the AMF using the appropriate albedo input is the most appropriate correction method. However, this is labor-intensive and must be calculated using a radiative transfer program, such as VLIDORT (Spurr, 2006). Herein, we propose a correction method based on the fact that there were days when snow cover was recognized as clouds in the TROPOMI products. For example, in the visible satellite image on 9 March 2021, no clouds appeared over Hokkaido (Figure 7A). On the other hand, the cloud height data in the TROPOMI dataset shows clouds (cloud fraction of approximately 1.0) near the ground surface (Figures 7B,C), indicating that snow cover may be misidentified as a cloud. This area was masked by cloud fraction in the previous SO2 flux estimation procedure (Figure 7D). Next, the VCD map was recreated without a cloud mask because the actual cloud cover was not present (Figure 7E). The VCD in the black circle of Figure 7E was calculated with high cloud reflectivity, comparable to snow reflectivity, and represented a more realistic VCD. Additionally, the VCD was lower than the surrounding area, and the SO2 flux was calculated using this area where snow cover is erroneously identified as a cloud (Figure 7F). The flux decreased from 1,425.3 ± 208.0 to 502.7 ± 83.2 tons/day. Supposing the lower value was correct, incorrect ground reflectances would have resulted in an approximately 2.8 times overestimation. Figure 7G shows the temporal variation of the flux with the reanalyzed data, in which the snow cover was misidentified as winter clouds. Although the number of days analyzed was small, the fluxes reanalyzed were not significantly higher than the initial values. Also, they are in the same range as those in the summer. Using this method, we can obtain the flux with a probability of accuracy in other high latitude or high altitude volcanoes, although under set of specific conditions. This evaluation contributes to the understanding and monitoring of volcanic activity.
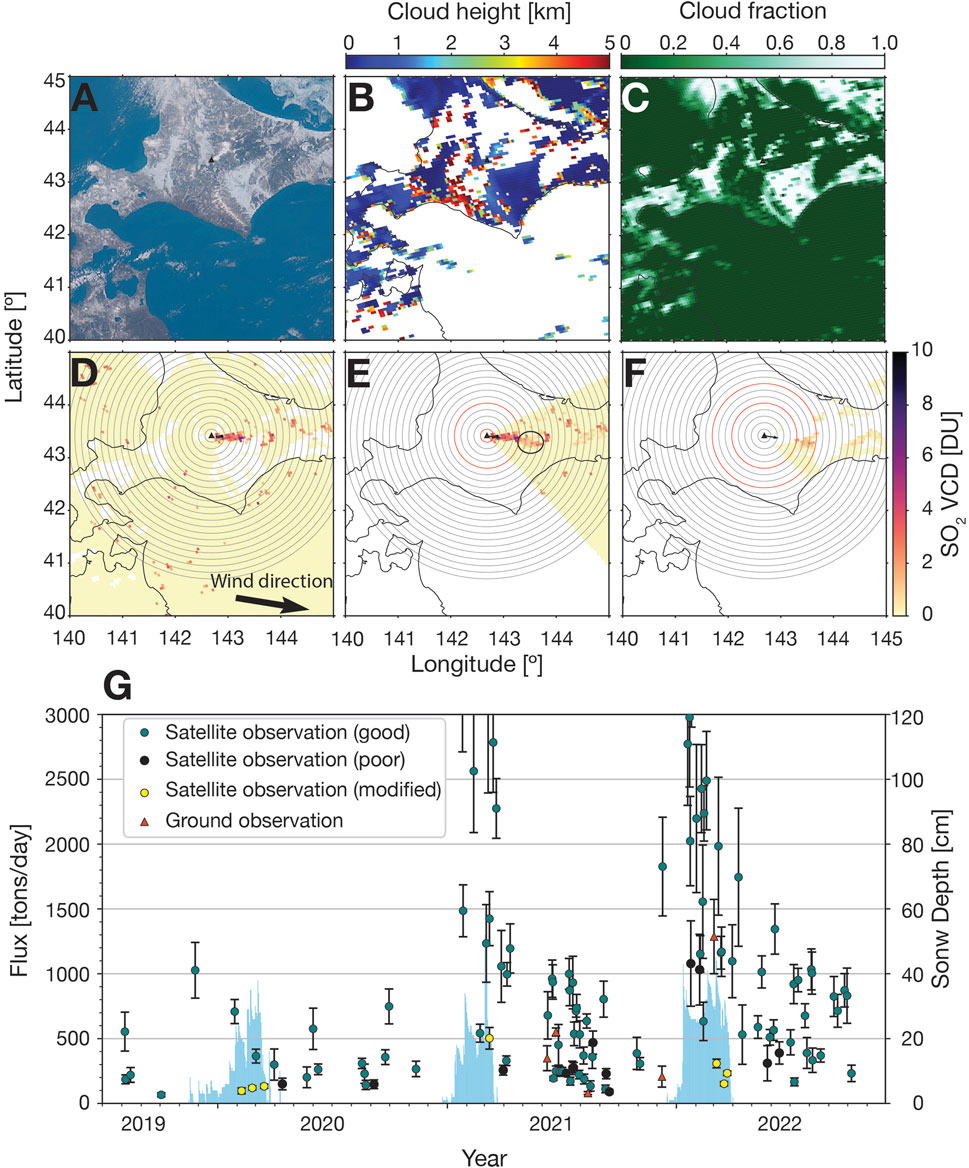
FIGURE 7. Processes and results of the newly proposed method. (A) Satellite visible image on 9 March 2021. There are no clouds over Hokkaido. (B) Cloud height as indicated in TROPOMI data products. Clouds are seen near the ground surface. (C) Cloud fraction as indicated in TROPOMI data products. Although there are no clouds over Hokkaido, some areas are covered high cloud fraction. (D) VCD distribution with cloud mask used for determination of the distance windows for the flux estimation. Black circles are distance windows. The black arrow represents the wind direction. The gray arrows are displayed for the correction of the plume direction. (E) VCD distribution is used for flux estimation by the conventional method. The area (in the black circle) masked by clouds in (D) has a lower VCD value than other areas. The black arrow indicates the wind direction. We integrated VCDs between two red circles. (F) VCD distribution for flux estimation by the new method. The pixels with low cloud fractions (
Next, we address the possibility of increased winter SO2 emissions at Mt. Tokachi as indicated by satellite-based measurements and hinted at by ground-based measurements on 2 March 2022. Here, we consider scrubbing (Kusakabe et al., 2000; Symonds et al., 2001) and S formation reactions (Shinohara et al., 2011) as the possible cause for seasonal changes in the SO2 emissions. Scrubbing is a process that reduces emissions during reactions between magmatic gas, water, and, occasionally, rock (Symonds et al., 2001). Symonds et al. (2001) reported that scrubbing with water can remove significant amounts of SO2. Furthermore, Tanaka et al. (2021) has suggested a significant amount of water contained within the hydrothermal system beneath 62–2 craters according to Audio-Magnetotelluric measurements during summer. Moreover, precipitation occurs throughout the year around Mt. Tokachi, and there is always a recharge of meteoritic water to the hydrothermal system; however, the recharge may decrease in winter due to snow accumulation. Therefore, a decline in groundwater volume could decrease the effectiveness of scrubbing, thereby increasing the actual SO2 emissions during winter.
Breakdown of sulfur species produces water and sulfur from SO2 and H2S. This reaction occurs below 200°C–250°C. The temperature at crater 62–2, measured in summer using an infrared thermometer, was approximately 200°C–400°C in 2020 and approximately 300°C after 2021 (Japan Meteorological Agency, 2021). However, the crater temperature in winter is unknown because it has not been observed. Nevertheless, assuming lower temperatures in winter, this reaction will be accelerated, producing S and consuming SO2; however, if it increases, the opposite reaction consumes S and produces SO2. If the recharge rate decreases in winter, the amount of rainwater mixed with hydrothermal fluids may decrease, and the fumarolic temperature will increase and so will the SO2 emissions. To differentiate between these possible causes for the apparent seasonal changes in detected SO2 flux, more frequent ground-based observations and observations of the compositional ratios of volcanic gases during winter are needed.
Satellite-based SO2 flux measurements at Mt. Tokachi have enabled us to monitor the SO2 flux throughout the year, although flux assessment during winter is challenging. SO2 flux averaged between May and September of each year was 203 ± 44 tons/day in 2019 (August only), 330 ± 85 tons/day in 2020, 462 ± 93 tons/day in 2021, and 680 ± 124 tons/day in 2022. Previous studies estimated the SO2 flux at Mt. Tokachi to be 200 tons/day in 2003 and 2006 (Mori et al., 2013) and 135 tons/day between 2005 and 2015 (Carn et al., 2017). Notably, the SO2 flux between 2019 and 2020 is comparable to that between 2003 and 2015 but lower than that between 2021 and 2022. In 2003, the monthly maximum plume height at crater 62–2 (∼ 800 m) was higher than in 2022, and the monthly average of the daily maximum (∼ 300 m) was similar to that in 2022 (JMA: Monthly volcanic activity report of Mt. Tokachi, https://www.data.jma.go.jp/svd/vois/data/tokyo/STOCK/monthly_v-act_doc/sapporo/22m10/108_22m10.pdf). This suggests changes in the volcanic gases currently released at Mt. Tokachi are more SO2-rich. The recent trend of increasing plume height and volcanic glow at crater 62–2 is consistent with these results. If there is an escalation of the activity at Mt. Tokachi and a rapid increase in SO2 flux, as demonstrated here, the TROPOMI data are sufficient for such detection and long term monitoring, although it may be difficult to detect it in winter. For clarification, the high frequency of SO2 flux measurements using satellites is essential to consider the mass balance and to determine the mechanisms of ground deformation and total magnetic field changes which reflect the magma and magmatic fluids movements below crater 62–2 and monitor the activity of Mt. Tokachi.
5 Conclusion
We attempted to quantify the SO2 flux from Mt. Tokachi, Japan, using TROPOMI. We analyzed the satellite data and ground-based observations at Mt. Tokachi during the non-eruptive period and compared them to validate satellite-based estimates. Although the ground-based observations succeeded only on 5 days from June 2021 to March 2022, the satellite-based observations enabled us to collect a daily SO2 flux for 108 days between August 2019 and October 2022. The satellite-based observations using TROPOMI have the potential to monitor the SO2 flux from volcanoes where ground-based measurements are generally difficult to be performed. Satellite-based SO2 flux estimation at Mt. Tokachi enabled us to estimate SO2 flux at high frequencies throughout the year, although seasonal changes were recognized. Moreover, the SO2 flux from Mt. Tokachi in 2019–2022 was approximately 100–2,000 tons/day. Comparing our results with previous studies, the flux from Mt. Tokachi has increased recently. This trend is consistent with that of plume height and the occurrence of volcanic glow. Additionally, the results of the ground and satellite observations were consistent in the summer. The seasonal change may be attributed to snow cover’s effect on satellite observations and the actual flux increase in winter. Nevertheless, continuous ground-based observations are needed to determine whether the actual SO2 emissions during winter are increasing. Furthermore, it is necessary to correctly estimate SO2 VCD during the snow season to monitor volcanic activity from satellites throughout the year. We proposed a method for estimating flux using only those regions of satellite data that misidentified snow cover as clouds. This method may be applied to other high latitude and altitude volcanoes in certain seasons when snow cover condition is frequently changing (e.g., ending or beginning of the summer season at Antarctic and Icelandic volcanoes). The high frequency of SO2 flux measurements using satellites is essential to determine the mechanisms of unrest that reflect the magma and magmatic fluids movements.
Data availability statement
The original contributions presented in the study are included in the article/Supplementary Material, further inquiries can be directed to the corresponding author.
Author contributions
KY collected, analyzed, and discussed the data. RT drafted the manuscript, collected data, and discussed the data. MM, TM, and RK contributed to the data collection, analysis, and discussion. All authors contributed to the manuscript revision and read and approved the submitted version. All authors contributed to the article and approved the submitted version.
Acknowledgments
We acknowledge the free use of the TROPOMI surface DLER database provided by the Sentinel- 5p+ Innovation project of the European Space Agency (ESA). The TROPOMI Surface DLER database was created by the Royal Netherlands Meteorological Institute (KNMI). We would like to thank Editage (www.editage.com) for English language editing.
Conflict of interest
The authors declare that the research was conducted in the absence of any commercial or financial relationships that could be construed as a potential conflict of interest.
Publisher’s note
All claims expressed in this article are solely those of the authors and do not necessarily represent those of their affiliated organizations, or those of the publisher, the editors and the reviewers. Any product that may be evaluated in this article, or claim that may be made by its manufacturer, is not guaranteed or endorsed by the publisher.
Supplementary material
The Supplementary Material for this article can be found online at: https://www.frontiersin.org/articles/10.3389/feart.2023.1145343/full#supplementary-material
References
Carn, S., Fioletov, V., McLinden, C., Li, C., and Krotkov, N. (2017). A decade of global volcanic SO2 emissions measured from space. Sci. Rep. 7, 44095–44112. doi:10.1038/srep44095
Committee for Prevention of the Natural Disaster of Hokkaido (1971). Tokachidake: The report on the volcanoes of hokkaido, part 1. (in japanese).
Copernicus Sentinel data processed by ESA, German Aerospace Center (DLR) (2020). Greenbelt, MD, USA, goddard Earth sciences data and information services center (GES DISC).
Copernicus Sentinel data processed by ESA, German Aerospace Center (DLR) (2019). Sentinel-5P TROPOMI sulphur dioxide SO2 1-orbit L2 5.5km x 3.5km. Greenbelt, MD, USA: Goddard Earth Sciences Data and Information Services Center (GES DISC.
Daag, A. S., Tubianosa, B. S., Newhall, C., Tungol, N., Javier, D., Dolan, M., et al. (1996). Monitoring sulfur dioxide emission at mount pinatubo. Philippines: Fire and mud: Eruptions and lahars of Mount Pinatubo, 409–414.
Edmonds, M., Herd, R., Galle, B., and Oppenheimer, C. (2003). Automated, high time-resolution measurements of SO2 flux at Soufrire Hills Volcano, Montserrat. Bull. Volcanol. 65, 578–586. doi:10.1007/s00445-003-0286-x
Galle, B., Johansson, M., Rivera, C., Zhang, Y., Kihlman, M., Kern, C., et al. (2010). Network for observation of volcanic and atmospheric change (novac)—A global network for volcanic gas monitoring: Network layout and instrument description. J. Geophys. Res. Atmos. 115, D05304. doi:10.1029/2009jd011823
Hashimoto, T., Nishimura, M., Arita, S., Yamamoto, T., Ogiso, M., Shigeno, N., et al. (2010). Heat accumulation beneath Tokachidake volcanoes inferred from magnetic changes. Goephys Bull. Hokkaido Univ. 73, 269–280.
Japan Meteorological Agency (2021). Annual report for 2021 volcanic activity of Tokachidake volcano.
Katsui, Y., Kawachi, S., Kondo, Y., Ikeda, Y., Nakagawa, M., Gotoh, Y., et al. (1990). The 1988-1989 explosive eruption of Tokachi-dake, Central Hokkaido, its sequence and mode: Special section: The 1988-1989 eruption of Mt. Tokachi, Central Hokkaido. SECOND Ser. Bull. Volcanol. Soc. Jpn. 35, 111–129.
Kazahaya, R., Aoki, Y., and Shinohara, H. (2015a). Budget of shallow magma plumbing system at asama volcano, Japan, revealed by ground deformation and volcanic gas studies. J. Geophys. Res. Solid Earth 120, 2961–2973. doi:10.1002/2014jb011715
Kazahaya, R., Maeda, Y., Mori, T., Shinohara, H., and Takeo, M. (2015b). Changes to the volcanic outgassing mechanism and very-long-period seismicity from 2007 to 2011 at mt. asama, Japan. Earth Planet. Sci. Lett. 418, 1–10. doi:10.1016/j.epsl.2015.02.034
Kazahaya, R., Mori, T., Takeo, M., Ohminato, T., Urabe, T., and Maeda, Y. (2011). Relation between single very-long-period pulses and volcanic gas emissions at mt. asama, Japan. Geophys. Res. Lett. 38. doi:10.1029/2011gl047555
Kusakabe, M., Komoda, Y., Takano, B., and Abiko, T. (2000). Sulfur isotopic effects in the disproportionation reaction of sulfur dioxide in hydrothermal fluids: Implications for the δ34s variations of dissolved bisulfate and elemental sulfur from active crater lakes. J. Volcanol. Geotherm. Res. 97, 287–307. doi:10.1016/s0377-0273(99)00161-4
McGonigle, A. J., Pering, T. D., Wilkes, T. C., Tamburello, G., D’Aleo, R., Bitetto, M., et al. (2017). Ultraviolet imaging of volcanic plumes: A new paradigm in volcanology. Geosciences 7, 68. doi:10.3390/geosciences7030068
Mori, T., Morita, M., Iguchi, M., and Headquarters, F. R. (2017). Sulfur dioxide flux monitoring using a regular service ferry after the 2014 eruption of kuchinoerabujima volcano, Japan. J. Nat. Disaster Sci. 38, 105–118. doi:10.2328/jnds.38.105
Mori, T., Shinohara, H., Kazahaya, K., Hirabayashi, J., Matsushima, T., Mori, T., et al. (2013). Time-averaged SO2 fluxes of subduction-zone volcanoes: Example of a 32-year exhaustive survey for Japanese volcanoes. J. Geophys. Res. Atmos. 118, 8662–8674. doi:10.1002/jgrd.50591
Nadeau, P. A., Palma, J. L., and Waite, G. P. (2011). Linking volcanic tremor, degassing, and eruption dynamics via so2 imaging. Geophys. Res. Lett. 38. doi:10.1029/2010gl045820
Nanri, T., Makinou, T., Yonekawa, K., Harada, N., Ando, H., and Yamada, T. (2008). Volcanic mudflow chronology in Furano river of Mt. Tokachi, Hokkaido. Sabo Gakkaishi 60, 23–30. doi:10.11475/sabo1973.60.5_23
Platt, U., and Stutz, J. (2008). Differential absorption spectroscopy. Berlin, Heidelberg: Springer Berlin Heidelberg, 135–174. doi:10.1007/978-3-540-75776-4_6
Poland, M. P., Sutton, A. J., and Gerlach, T. M. (2009). Magma degassing triggered by static decompression at kılauea volcano, hawai ‘i. Geophys. Res. Lett. 36, L16306. doi:10.1029/2009gl039214
Queißer, M., Burton, M., Theys, N., Pardini, F., Salerno, G., Caltabiano, T., et al. (2019). Tropomi enables high resolution so2 flux observations from mt. etna, Italy, and beyond. Sci. Rep. 9, 957–1012. doi:10.1038/s41598-018-37807-w
Regional Volcanic Observation and Warning Center, Sapporo Regional Headquarters, JMA (2018). Volcanic activity of Tokachidake volcano during the last 10 years (2006–2016). Report of the coordinating committee for prediction of volcanic eruptions 127.
Romahn, F., Pedergnana, M., Loyola, D., Apituley, A., Sneep, M., and Veefkind, J. P. (2020). Sentinel-5 precursor/TROPOMI Level 2 product user manual sulphur dioxide SO2.
Salerno, G., Burton, M., Oppenheimer, C., Caltabiano, T., Randazzo, D., Bruno, N., et al. (2009). Three-years of so2 flux measurements of mt. etna using an automated uv scanner array: Comparison with conventional traverses and uncertainties in flux retrieval. J. Volcanol. Geotherm. Res. 183, 76–83. doi:10.1016/j.jvolgeores.2009.02.013
Shinohara, H. (2008). Excess degassing from volcanoes and its role on eruptive and intrusive activity. Rev. Geophys. 46. doi:10.1029/2007rg000244
Shinohara, H., Hirabayashi, J., Nogami, K., and Iguchi, M. (2011). Evolution of volcanic gas composition during repeated culmination of volcanic activity at kuchinoerabujima volcano, Japan. J. Volcanol. Geotherm. Res. 202, 107–116. doi:10.1016/j.jvolgeores.2011.01.011
Spurr, R. J. (2006). Vlidort: A linearized pseudo-spherical vector discrete ordinate radiative transfer code for forward model and retrieval studies in multilayer multiple scattering media. J. Quantitative Spectrosc. Radiat. Transf. 102, 316–342. doi:10.1016/j.jqsrt.2006.05.005
Stoiber, R., Maliconico, L., and Williams, S. (1983). “Use of the correlation spectrometer at volcanoes,” in Forecasting volcanic events. Editor S. J. Tazieff H (Amsterdam: Elsevier), 425–444.
Symonds, R., Gerlach, T., and Reed, M. (2001). Magmatic gas scrubbing: Implications for volcano monitoring. J. Volcanol. Geotherm. Res. 108, 303–341. doi:10.1016/s0377-0273(00)00292-4
Tada, F., and Tsuya, H. (1927). The eruption of the tokachidake volcano, Hokkaido, on may 24th, 1926. Bull. Earthq. Res. Inst. Univ. Tokyo 2, 49–84.
Tanaka, R., Hashimoto, T., Matsushima, N., and Ishido, T. (2017). Permeability-control on volcanic hydrothermal system: Case study for Mt. Tokachidake, Japan, based on numerical simulation and field observation. Earth, Planets Space 69, 39–24. doi:10.1186/s40623-017-0623-5
Tanaka, R., Yamaya, Y., Tamura, M., Hashimoto, T., Okazaki, N., Takahashi, R., et al. (2021). Three-dimensional inversion of audio-magnetotelluric data acquired from the crater area of Mt. Tokachidake, Japan. Earth, Planets Space 73, 172–211. doi:10.1186/s40623-021-01502-4
Theys, N., De Smedt, I., Yu, H., Danckaert, T., van Gent, J., Hörmann, C., et al. (2017). Sulfur dioxide retrievals from TROPOMI onboard sentinel-5 precursor: Algorithm theoretical basis. Atmos. Meas. Tech. 10, 119–153. doi:10.5194/amt-10-119-2017
Theys, N., Hedelt, P., De Smedt, I., Lerot, C., Yu, H., Vlietinck, J., et al. (2019). Global monitoring of volcanic SO2 degassing with unprecedented resolution from TROPOMI onboard Sentinel-5 Precursor. Sci. Rep. 9, 2643–2710. doi:10.1038/s41598-019-39279-y
Tilstra, L. (2022). TROPOMI ATBD of the directionally dependent surface lambertian-equivalent reflectivity. KNMI Report S5P-KNMI-L3-0301-RP.
Uesawa, S. (2014). A study of the Taisho lahar generated by the 1926 eruption of Tokachidake volcano, central Hokkaido, Japan, and implications for the generation of cohesive lahars. J. Volcanol. Geotherm. Res. 270, 23–34. doi:10.1016/j.jvolgeores.2013.11.002
Keywords: SO2 flux, remote sensing, Mount Tokachi, TROPOspheric Monitoring Instrument, volcano monitoring
Citation: Yamaguchi K, Tanaka R, Morita M, Mori T and Kazahaya R (2023) Sulfur dioxide flux measurement at Mount Tokachi, Japan, with TROPOspheric Monitoring Instrument. Front. Earth Sci. 11:1145343. doi: 10.3389/feart.2023.1145343
Received: 16 January 2023; Accepted: 05 May 2023;
Published: 18 May 2023.
Edited by:
Thorvaldur Thordarson, University of Iceland, IcelandReviewed by:
Muhammad Aufaristama, University of Twente, NetherlandsFrancesco Marchese, National Research Council (CNR), Italy
Copyright © 2023 Yamaguchi, Tanaka, Morita, Mori and Kazahaya. This is an open-access article distributed under the terms of the Creative Commons Attribution License (CC BY). The use, distribution or reproduction in other forums is permitted, provided the original author(s) and the copyright owner(s) are credited and that the original publication in this journal is cited, in accordance with accepted academic practice. No use, distribution or reproduction is permitted which does not comply with these terms.
*Correspondence: Ryo Tanaka, cl90YW5ha2FAc2NpLmhva3VkYWkuYWMuanA=