 Benyun Li1
 Yunlei Tian
- 1Guizhou Transportation Planning Survey and Design Academic Co.,Ltd., Guiyang, China
- 2The College of Resources and Environmental Engineering, Guizhou University, Guiyang, China
- 3Key Laboratory of Karst Georesources and Environment, Ministry of Education, Guizhou University, Guiyang, China
To study the characteristics of tensile cracking by rock-bending damage, the bending stress–strain curves and the cumulative ringing counts were obtained by a three-point bending test and acoustic emission (AE) monitoring of limestone beams. Based on the Lemaitre strain equivalent principle and the continuous damage theory, the bending damage variable D was defined by the AE cumulative ringing counts, and the bending crack damage evolution equation was established according to the Weibull distribution of the rock element strength. To realize the numerical test of the bending deformation, the damage variable D was used as the intermediate variable, and the specific process of damage bending stress transformation and the realization of the tensile crack criterion were secondary developed by FISH language in FLAC3D. According to the results, the central part of rock beam deforms downward under the action of bending stress, and both ends tilt up. Therefore, the bending failure begins with the tensile crack at the bottom of the rock beam and gradually extends to the compression zone. The maximum damage value is about 0.402 before the peak stress. The compressive stress in the x direction increases from the neutral layer to the top of the rock beam, and the tensile stress in the x direction increases from the neutral layer to the bottom of the rock beam. The maximum tensile stress is distributed in the center of the bottom of the specimen, where the bending effect is obvious. The stress–time curve was divided into the (Ⅰ) compaction stage, (Ⅱ) expansion stage, and (Ⅲ) penetration stage, accordingly, and the evolution of damage equation was divided into three stages: initial damage stage, slow damage stage, and accelerated damage stage. The curves of the experimental result, theoretical model prediction result, and numerical simulation result were in good agreement with each other, which indicates that the numerical simulation based on the criterion of rock damaged fracture can better reflect the bending process of rock beams under three-point bending stress.
Highlights
• The bending damage variable D was defined by the AE cumulative ringing counts, which can be divided into three stages during the whole loading and increases rapidly after 80% peak stress.
• The element stress of the section of the rock beam was converted into the bending stress, used to establish the damaged fracture criterion.
• The damage zone and bending stress distribution were obtained by FISH language in FLAC3D for secondary development of the numerical test.
1 Introduction
Rock is usually placed in a compressive state as a kind of geotechnical engineering material, which attracts research attention of many scholars to the rock compressive strength (Liao et al., 2019). However, in some cases, the bending tensile failure of rock is the dominating mode of engineering instability and failure (Andreev, 1991; Zhang, 1994; Cai et al., 2001; Pine et al., 2007), such as the bending failure in the horizontal roof plate of underground cavities and tunnels (Guan et al., 2012), the slide-bending failure in the bedding rock slope (Yang et al., 2022), the crooked-toppling failure in the anti-dip layered rock slope, and a buckling failure in the vertical rock slope (Zhang, 1994). Because of the important engineering application value of bending tensile failure of rock, much research has been conducted. ASTM International (2008) proposed some methods, including compact tension and three-point bending, to test the bending strength of materials. ISRM (1978) proposed the test standards of direct tension and Brazilian splitting. Pandey and Singh (1986) studied deformation of rock in different tensile tests. Meanwhile, the acoustic emission (AE) technique, a kind of useful means to monitor the development and evolution of microcracks during rock deformation, is widely used in rock damage analysis (Liu B. X. et al., 2009; Tian et al., 2022). Extensive information can be reflected by AE signals, including the evolution process (Pei et al., 2013), the mechanism of failure (Aggelis et al., 2013; Zhou et al., 2019; Gan et al., 2020), and the quantification and location of damage (Liu Y. M. et al., 2009; Tian et al., 2020). Therefore, many scholars have studied the evolution of microcracks in rock during bending failure through AE monitoring. Zeng (2015) studied the AE characteristics of sandstone under three-point bending and analyzed the influencing factors of damage. Deng et al. (2016) studied the influence of grain size and AE characteristics through a three-point bending test. Lacidogna et al. (2018) conducted a three-point bending test on pre-slotted concrete beam specimens and used the AE technique to monitor the crack growth process. Prem and Murthy (2016) applied the AE technique to study the damage mechanism of the reinforced concrete beams under a bending test.
Some theories have also been proposed regarding bending tensile failure, along with deeper research. One of them is the fracture mechanics theory, which focuses on the change laws of crack propagation, damage characteristics, stress intensity factor, and the fracture toughness of rock beams with prefabricated cracks under vertical load. Atkinson (1992) published the first monograph on rock fracture mechanics in 1987, which expanded a new direction for rock mechanics. Lu et al. (2021) conducted a three-point bending test on granite and marble with different prefabricated crack methods and lengths. Li et al. (2018) conducted a three-point bending test on a sandstone specimen with a perpendicular crack surface. Zuo et al. (2017) studied the influence of temperature, buried depth, and offset notch on the tensile fracture characteristics of rock mass through a three-point bending test. The other theory is about material mechanics or structural mechanics, and it focuses on the influencing factors of the bending strength and tensile modulus of rock materials and the bending failure mechanism. Yao et al. (2018) proposed a two-parameter tensile strength model for rocks based on the successful application of the non-local theory and the three-point bending test. Francesco et al. (2019) combined the AE monitoring and the non-local integral plastic damage constitutive theory to simulate and analyze the bending fracture process of Adelaide black granite. Zuo et al. (2013), Zuo et al. (2015) established an anisotropic model of layered rock mass reflecting transverse isotropy and a criterion for bending failure mode.
However, the previous research was mainly based on the plat and beam model or basic theories of fracture mechanics and material mechanics, focusing on the research of crack propagation, energy accumulation, and dissipation, etc., and explaining the phenomenon mechanism in the process of testing. It gave little consideration to the damage and parameter deterioration in the deformation process of rock beam, and the mechanical theory is not strong in guiding the numerical simulation. Therefore, in this work, based on the Weibull distribution function of micro-element strength, the bending damage evolution equation of limestone beam is established, and the damage and parameter deterioration in the deformation process of rock beam are considered. Then, the bending stress yield criterion is used as the damage and bending crack criterion of the rock beam, and the damage variable D is used as the intermediate variable to conduct the bending numerical test of the rock beam. The specific process of the calculation of damage bending stress and the realization of the tension crack criterion is compiled with the inbuilt FISH language of FLAC3D. The research results are helpful to understand the bending deformation characteristics and failure mechanism of limestone beam.
2 Experimental work
2.1 Specimens and instruments
As shown in Figure 1A, the limestone beam specimens were taken from the same site and were made into six rectangular solid beams of 60 cm in length, 10 cm in width, and 10 cm in height. The testing system, as shown in Figure 1, included an electro-hydraulic servo universal mechanics testing system (Figure 1B), AE monitoring system (Figure 1C), and strain monitoring system (Figure 1D).
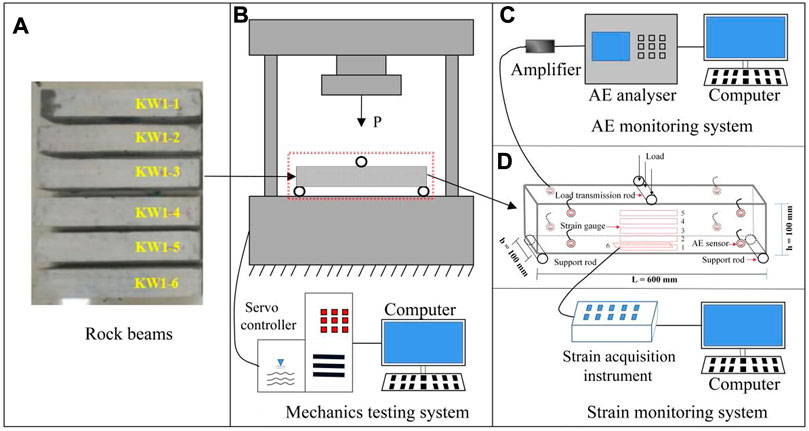
FIGURE 1. Testing system: (A) rock beams specimens, (B) universal mechanics testing system, (C) AE monitoring system, (D) strain monitoring system.
2.2 Test methods
1) The rock beams were wiped with fine sandpaper to polish their surfaces, and the strain gauges were pasted on the side and bottom of the rock beams smoothly. As shown in Figure 1D, strain gauge 3 was located at the side central axis of the rock beams, and the intervals among strain gauges 1 to 5 were 15 mm. Strain gauge 6 was located at the middle bottom of the beams. The beams with strain gauges were left in a ventilated environment for 4–5 h.
2) The six strain gauges were connected to the corresponding channels of the static strain data acquisition instrument, and at the same time, another strain gauge located on the spare rock was connected to the temperature compensation channel of the strain acquisition instrument to make a temperature compensation for the test.
3) Fixing the eight AE sensors at the selected point on the rock beams with rubber bands, the vacuum silicone grease was used to couple the rock beams and the AE sensor. The location of the strain gauges and AE sensors are shown in Figure 2A. The peak definition time (PDT), hit definition time (HDT), and hit locking time (HLT) were set as 50, 200, and 300 μs, respectively. The threshold for AE detection was set to 40 dB.
4) After the preparatory work was completed, the limestone beams were loaded to failure with a rate of 0.002 mm/s under AE and strain monitoring. The fractured limestone beam is shown in Figure 2B.
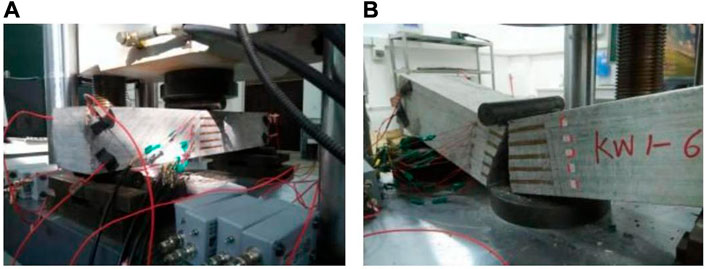
FIGURE 2. (A) The prepared limestone beam, (B) the fractured limestone beam.
3 Results and analysis
3.1 Test result
3.1.1 Load–displacement curve
Figure 3 shows the relationship between the load and mid-span vertical displacement of the rock beam. As can be directly seen in Figure 3, the load–displacement curves are convex.
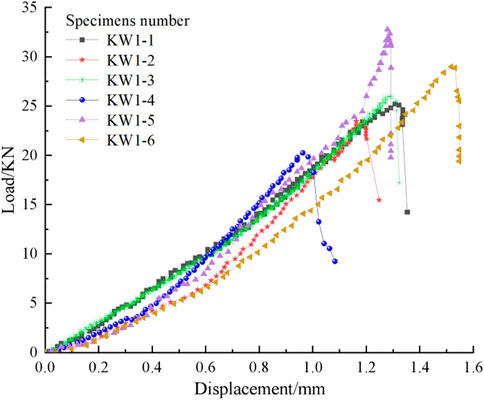
FIGURE 3. Load–displacement curves in three-point bending test.
Because the failure of rock is closely related to the evolution of internal microcracks, the load–displacement curves can be divided into three stages from the analysis of the evolution of internal microcracks: (I) microcracks compaction stage, (II) microcracks expansion stage, and (III) microcracks penetration stage. Taking the curve of KW1-5 as an example from Figure 3, the microcracks compaction stage (I) occurs at the initial loading period of the rock beam. At this stage, the original microcracks in the rock beam are compacted; however, the load on the rock beam is too small to produce new microcracks, causing the displacement changes slowly with the increase of the load. With the load continues to increase, the microcracks in the upper part of the rock beam are dramatically compacted, and at the same time, the microcracks in the lower part of the rock beam are in a tension state. New microcracks begin to appear and expand in the lower part of the rock beam, but they are not connected yet. At this period, the curve is approximate to a straight line, called the microcracks expansion stage (II). When the load further increases, the load–displacement curve turns down sharply after the peak value, and the rock beam breaks suddenly. At this time, the vertical displacement of the rock beam is almost unchanged, and the bearing capacity of the rock beam drops sharply due to the complete penetration of the microcracks. This period is identified as the microcracks penetration stage (III), which reflects the characteristics of the bending brittle fracture of limestone beam.
3.1.2 Stress-cumulative ringing–time curve
The maximum bending stress located at the lower edge of the mid-span section was calculated from Eq. 1:
Where P is the load (N), L, b, and h are, respectively the length, width, and height of the rock beam (m). The results calculated according to Eq. 1 are shown in the Figure 4.
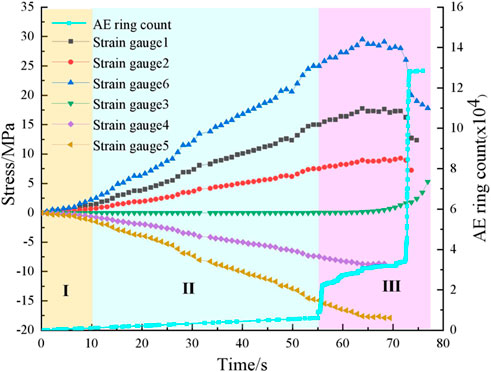
FIGURE 4. Stress-cumulative ringing counts–time curve of specimen KW1-5.
According to the stress-cumulative ringing number–time curves of Figure 4, we can find that the bending stress of limestone beam changes with time in three stages: the slow growth stage, linear growth stage, and sharp decline stage after the peak. This is in accordance with the analysis results in subsection 3.1.1. Accordingly, the AE signals show different evolution characteristics with different loading stages.
At the microcracks compaction stage (I), the source of AE signals is inactive, corresponding to the compression of the original microcracks in the rock beam, which causes the cumulative ringing number at a low level.
At the microcracks expansion stage (II), the source of the AE signals changes from compression of the original microcracks to production of new microcracks with the increase of the load, which causes the cumulative number of AE rings to increase with the stress; the specimen is still at a stable stage.
At the microcracks penetration stage (III), the cumulative number of AE rings increases dramatically because of the unstable expansion of the microcracks. The increase rate is faster than that of stages I and II, and there are two sudden growth points. The first point is located at the point of 80% peak stress, because of the large number of microcracks that are generated, expanded, and connected. The second point occurs at the moment when the stress drops rapidly, and it is mainly caused by the complete destruction of the rock beam, which can be taken as a sign of rock beam failure.
3.2 Analysis
3.2.1 Bending damage analysis
3.2.1.1 Definition and monitoring method of bending damage variables
Based on the continuous damage theory and Lemaitre strain equivalent principle, the stress–strain constitutive relationship of the tensile zone in the bending damage
process can be expressed as Eq. 2:
Where
Where
The relationship between strain and time collected by different strain gauges in Figure 4 was fitted, and it was found that the relationship between strain and time in the different parts is linear, and the expression is:
According to the study by Wu et al. (2015), when the rock specimen is brittle or undergoes brittle–ductile failure, exponential function can be considered to express the functional relationship between the AE cumulative rings count N and time t:
The value of A1, B1, and C can be determined by experimental data. Substituting Eq. 4 into Eqs 5, 6 can be derived:
Tang et al. (2003) and Jiang and Wen (2011) established the constitutive model of the rock stress–strain curve based on the Weibull distribution model as follows:
Yang et al. (2005) established a new method to determine the parameters of a rock damage model:
Where
The relationship among the AE cumulative ring numbers N, stress σ, and damage variable D can be obtained by combining Eqs 6–8 as follows:
In the process of large-scale rock beam bending, the neutral layer between the compression zone and the tension zone will gradually shift from the middle of the rock beam to the upper part with the gradual bending failure. However, because the scale of this test was small and the tensile fracture process was very short, the upward displacement distance of the intermediate layer was small, so it was not considered in the calculation. Taking the deformation at the bottom of each rock beams as the calculation point, the calculation parameters are shown in Table 1.
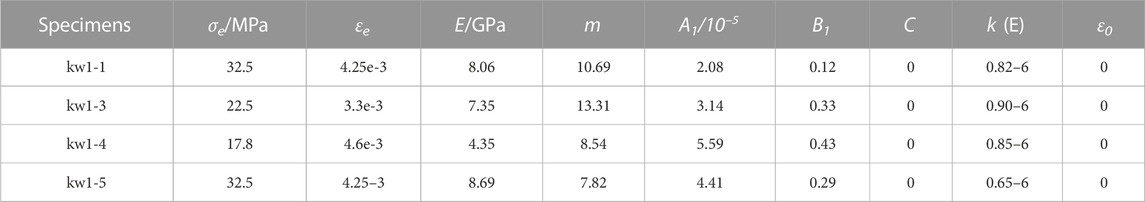
TABLE 1. Parameter fitting of damage evolution equation of six samples.
According to the AE accumulated ringing number collected during the test, as shown in Figure 5, the damage variable D of the rock beam was calculated by Eqs 3, 11.
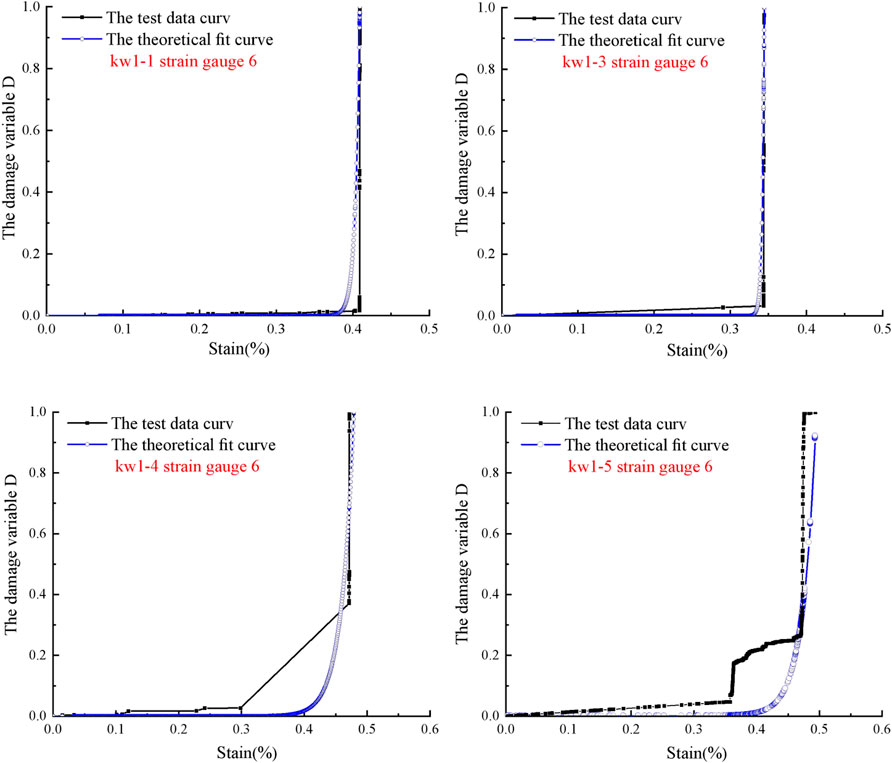
FIGURE 5. Evolution law of damage variables with time.
According to the analysis in Figures 4, 5, and subsection 3.1.1, 3.1.2, the bending damage of limestone beam can be divided into the initial damage stage, slow damage stage, and accelerated damage stage. The initial damage stage corresponds to the microcracks compaction stage (I), and the value of damage variable D tends to 0. The slow damage stage corresponds to the microcracks expansion stage (II), and the growth rate of the damage variable D is slow. The accelerated damage stage corresponds to the microcracks penetration stage (III). At this stage, the damage variable D starts to increase rapidly when the stress increases to 80% of the peak stress. When the stress reaches the peak, the damage variable D increases rapidly until the sample is fully damaged, which shows that during the process of bending deformation, the ductility of the rock is not obvious, and the rock shows transient brittle tensile fracture. The analysis results show that the damage variable correction theory conforms to the actual test situation.
3.2.1.2 Damage stress correction
The evolution of stress growth with strain after the damage correction of each strain gauge can be calculated according to Eq. 2. Taking strain gauge 6 of rock beam specimen kw1-5 as an example, the stress–strain relationship curve after damage correction is shown in Figure 6.
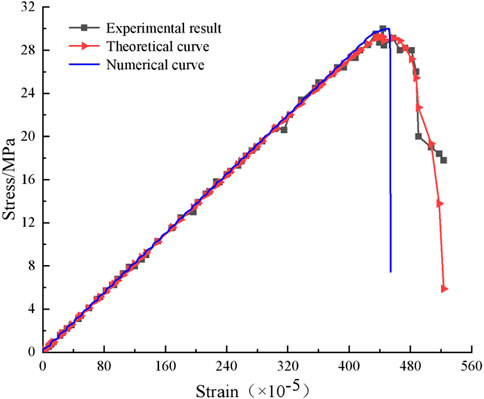
FIGURE 6. Comparison of σ-ε curves at strain gauge 6 of specimen KW1-5.
The black scattered points in Figure 6 are the test data, and the red line is the damage correction curve. The two curves fit well, which shows that the damage evolution model can well reflect the bending stress deformation process of limestone beam.
3.2.2 Fracture criterion of bending damage of rock mass
When the rock beam is bent under the action of torque, the upper part is compressed, and the lower part is tensioned. With the increase of bending torque, the tensile stress on the tensile side gradually increases. When the tensile stress exceeds the ultimate tensile strength, the rock beam begins to crack. The bending failure can be judged by the tensile stress yield criterion:
Where
where M is the maximum bending moment, P is the vertical compressive load, l is the length of the limestone sample, b is the width of the section, h is the height of the section, Iz is the moment of inertia of the cross-section to the bending neutral layer, and y is the distance from the stress location to the bending neutral layer.
The stress essentially represents the central stress of the block element during numerical calculation, but the maximum principal stress under the bending failure progress is located at the tensile side edge of the rock beam. Therefore, it is necessary to convert the stress (block element stress contained in any section perpendicular to the neutral axis) to the bottom edge bending stress
1) Assuming the normal stress along the x direction at any block element center in the rock beam is σx(ij), by using the Lagrangian interpolation method for the center stress of each block element of a section that is perpendicular to the horizontal beam, the value of the normal stress distribution along the x direction of the section can be obtained. The calculative method is showed as Eq. 17:
Where li(r) is the Lagrange interpolation basis function, the calculation equation is shown as follows:
Where ri is the distance from the center of each block element in column j to the neutral axis, and r is the distance from each point of column j unit to the neutral axis.
2) The bending torque (M) of the block element can be obtained by taking the torque from
Where h' is the height of the block element.
After the bending torque M is obtained, the bending stress
4 Three-point bending numerical test of rock beam
To verify the accuracy of the bending damage evolution model and the rationality of the damage tensile fracture criterion of the limestone beam under the action of a three-point bending load, the numerical test was carried out by using FLAC3D software according to the indoor test data.
4.1 Compilation of damage constitutive model
Based on the self-contained Mohr-Coulomb model of FLAC3D, the numerical simulation of the damage constitutive model of limestone beam under three-point bending test was realized by the built-in FISH language. For each element, the strain increment in x direction was accumulated at each calculation time step and used to calculate the damage variable (Eq. 11). The damage deterioration of the elastic modulus and damaged stress were corrected (Eq. 12). The bending stress was calculated according to Eqs 14–17, and it was judged whether bending failure occurred according to Eq. 13.
4.2 Model and parameters
The numerical test parameters are based on the indoor data of the three-point bending test (L=0.6 m, b=0.1 m, h=0.1 m). The numerical calculation model is shown in Figure 7, and the numerical calculation physical and mechanical parameters are shown in Table. 2.
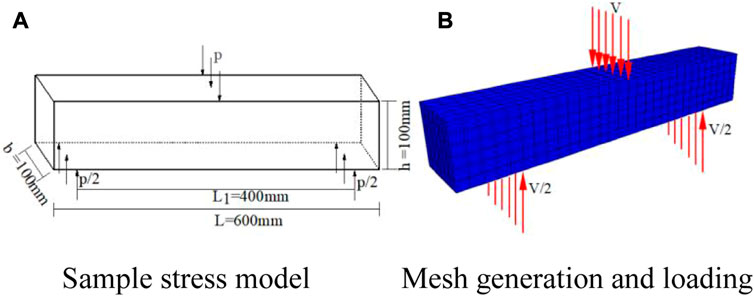
FIGURE 7. Calculation model diagram. (A) Sample stress model, (B) Mesh generation and loading.
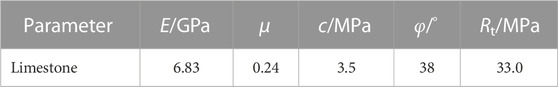
TABLE 2. Parameters in numerical tests.
4.3 Result analysis
As for the horizontal bottom of the rock beam, the stress–strain relationship at the section (x=0) during the numerical test is shown in the blue curve in Figure 6.
We can find that the bending stress of numerical calculation increases with the strain and drops sharply after the peak stress is about 30 MPa, which closely coincides with the test curve and theoretical curve. The displacement distribution along the x direction of the rock beam is shown in Figure 8. The displacement increases from the central section to both edges along x direction gradually. The maximum displacement. which is mainly distributed at the top and bottom of the specimen, is about 1.36 mm, and the minimum displacement is 0 mm, distributed near the neutral layer. The deformation process of the rock beam during three-point bending has been exhibited straightly by the numerical simulation test results. The rock beam deforms under the action of bending stress, the central part deforms downward, and both ends tilt up. At the same time, the bottom of rock beam is deformed towards both ends by tension, and the upper part is deformed towards the neutral layer by compression. Therefore, the bending failure begins with the tensile crack at the bottom of the specimen, and gradually extends to the compression zone. In the process, the neutral layer shifts upward. Since the tensile crack failure process is very short, the neutral layer shift is not considered in this work.
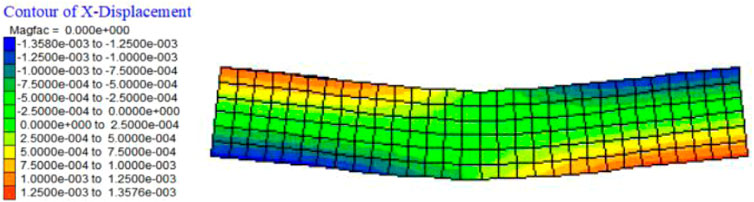
FIGURE 8. x-displacement distribution.
As shown in Figures 9A, B, the compressive stress in the x direction increases from the neutral layer to the top of the rock beam, and the maximum compressive stress is about 35.7 MPa, which is distributed in the area above the neutral layer. The tensile stress in the x direction increases from the neutral layer to the bottom of the rock beam, and the maximum tensile stress is about 25.0 MPa, which is distributed in the area below the neutral layer. The maximum compressive stress is greater than the maximum tensile stress. The maximum tensile stress is distributed in the central of the bottom of the specimen where the bending effect is most obvious, which is consistent with the deformation of the indoor test. At the same time, the bending stress distribution is close to the x-direction normal stress of the section element x=0, but the value is different. The bending stress at the bottom of the middle of the rock beam is 33.6 MPa, obviously greater than the stress in the x direction, which is also the reason why the unit center stress cannot replace the edge tensile stress.
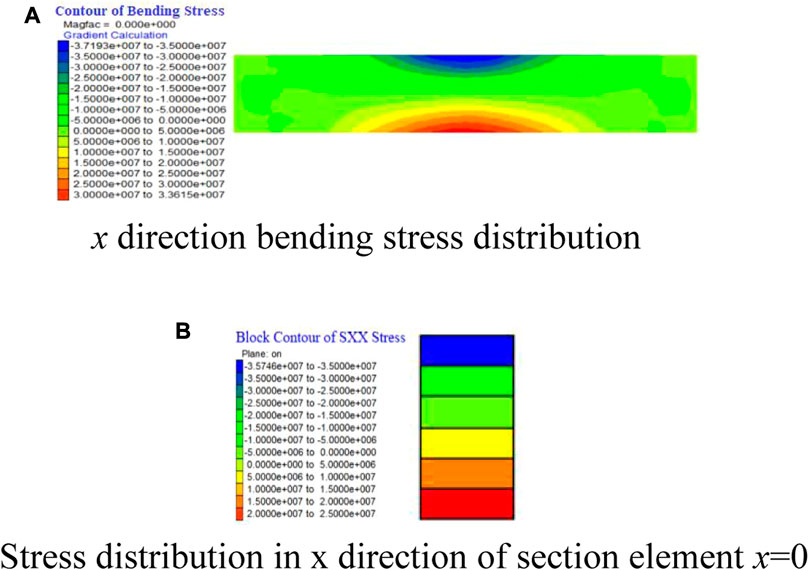
FIGURE 9. Distribution of bending stress and x-direction stress. (A) x direction bending stress distribution, (B) Stress distribution in x direction of section element x=0.
The tensile fracture zone is shown in Figure 10, mainly distributed at the bottom of the beam. The damage starts from the tensile zone at the bottom of the beam, and the maximum damage value is about 0.402 before the stress reaches the peak value (Figure 11), which is close to the damage variable value caused by the same stress in Figure 5. The stress distribution of each section is consistent with the actual situation.
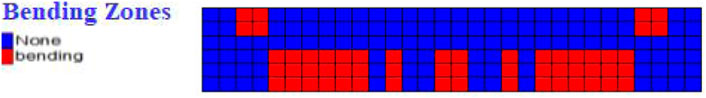
FIGURE 10. Distribution of bending zones.
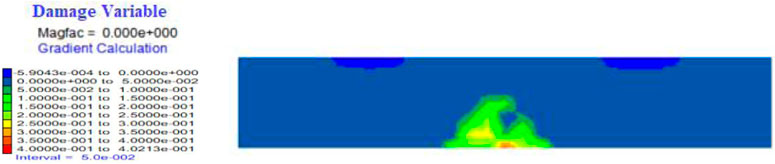
FIGURE 11. Distribution of damage variable.
5 Conclusion
1) The bending failure progress of limestone beam can be divided into three stages from the analysis of stress-cumulative ringing–time curves: (I) the microcracks compaction stage, (II) microcracks expansion stage, and (III) microcracks penetration stage. Correspondingly, the evolution of the bending damage variable D is also divided into initial damage stage, slow damage stage, and accelerated damage stage. The damage variable D increases rapidly when the stress increases to 80% of the peak stress.
2) The damage variable D is corrected by the data of the three-point bending test, and the result conforms to the actual test situation. Under the conditions of damage variable D, the stress–strain constitutive model of three-point bending tensile zone of limestone rock beam is established based on the Lemaitre strain equivalent principle and continuous damage theory, and the obtained curve is in good agreement with the fitting curve of the test data.
3) The yield criterion of bending stress is selected as the bending failure criterion. The specific implementation process of stress damage deterioration, the calculation of bending stress at the lower edge of the limestone beam, and the bending failure criterion are programmed by FISH language to realize the secondary development of software FLAC3D, thus programmatically realizing the calculation of the damage deterioration formula and bending criterion. The numerical simulation results show that: ① The stress–strain curve of the whole bending deformation progress is in good agreement with the fitting curve of the test results and the prediction curve of the theoretical model. ② According to the cloud diagram of displacement distribution in the x direction, the rock beam deforms under the action of bending stress, the central part deforms downward, and both ends tilt up. Therefore, the bending failure begins with the tensile crack at the bottom of the specimen and gradually extends to the compression zone. The maximum damage value is about 0.402 before the peak stress. ③ The compressive stress in the x direction increases from the neutral layer to the top of the rock beam, and the tensile stress in the x direction increases from the neutral layer to the bottom of the rock beam. The maximum tensile stress is distributed in the center of the bottom of the specimen where the bending effect is most obvious, which is consistent with the deformation of the indoor test.
Data availability statement
The original contributions presented in the study are included in the article/supplementary material, further inquiries can be directed to the corresponding author.
Author contributions
All authors listed have made a substantial, direct, and intellectual contribution to the work and approved it for publication.
Funding
This work was supported by Major Science and Technology Special Project of Guizhou Province, China [No. (2018)3011], Guizhou Provincial Science and Technology Foundation [(2020)1Z052].
Conflict of interest
Authors BL and JT were employed by company Guizhou Transportation Planning Survey and Design Academic Co., Ltd.
The remaining authors declare that the research was conducted in the absence of any commercial or financial relationships that could be construed as a potential conflict of interest.
Publisher’s note
All claims expressed in this article are solely those of the authors and do not necessarily represent those of their affiliated organizations, or those of the publisher, the editors and the reviewers. Any product that may be evaluated in this article, or claim that may be made by its manufacturer, is not guaranteed or endorsed by the publisher.
References
Aggelis, D. G., Mpalaskas, A. C., and Matikas, T. E. (2013). Investigation of different fracture modes in cement-based materials by acoustic emission. Cem. Concr. Res. 48, 1–8. doi:10.1016/j.cemconres.2013.02.002
Andreev, G. E. (1991). A review of the Brazilian test for rock tensile strength determination. Part I: Calculation formula. Min. Sci. Technol. 13 (3), 445–456. doi:10.1016/0167-9031(91)91006-4
ASTM International (2008). Standard test method for splitting tensile strength of intact rock core specimens[S]. West Conshohocken: ASTM.
Cai, M., Kaiser, P. K., and Martin, C. D. (2001). Quantification of rock mass damage in underground excavations from microseismic event monitoring. Int. J. Rock Mech. Min. Sci. 38 (8), 1135–1145. doi:10.1016/s1365-1609(01)00068-5
Deng, C. F., Liu, J. F., and Chen, L. (2016). Study on fracture mechanical behavior and acoustic emission characteristics of granites with different particle sizes. Rock Soil Mech. 37 (08), 2313–2320.
Gan, Y. X., Wu, S. C., Ren, Y., and Zhang, G. (2020). Evaluation indexes of granite splitting failure based on RA and AF of AE parameters. Rock Soil Mech. 41 (7), 2324–2332.
Guan, H., Huang, B. X., and Feng, H. (2012). Experimental study on three-point bending fracture characteristics of limestone sample. Coal Sci. Technol. 40 (07), 5–9.
International Society for Rock Mechanics (1978). Suggested methods for determining tensile strength of rock materials. Int. J. Rock Mech. Min. Sciences&, Geomechanics Abstr. 15 (3), 99–103.
Jiang, L. C., and Wen, Y. (2011). Damage constitutive model of sandstone during corrosion by AMD. J. Central South Univ. Sci. Technol. 42 (11), 3502–3506.
Lacidogna, G., Piana, G., and Carpinteri, A. (2018). Damage monitoring of three-point bending concrete specimens by acoustic emission and resonant frequency analysis. Eng. Fract. Mech. 210, 203–211. doi:10.1016/j.engfracmech.2018.06.034
Li, Y. F., Dong, S. M., and Pan, X. (2018). Experimental study of mixed-mode I/III fracture of sandstone. Rock Soil Mech. 39 (11), 4063–4070.
Liao, Z. Y., Zhu, J. B., and Tang, C. A. (2019). Numerical investigation of rock tensile strength determined by directtension, Brazilian and three-point bending tests. Int. J. Rock Mech. Min. Sci. 115, 21–32. doi:10.1016/j.ijrmms.2019.01.007
Liu, B. X., Huang, J. L., and Wang, Z. Y. (2009a). Study on damage evolution and acoustic emission character of coal-rock under unixial compression. Rock Mech. Eng. 28 (S1), 3234–3238.
Liu, Y. M., Wang, J., Cai, M. F., Wang, S. R., and Ke, D. (2009b). Study on disposal pit space for high-level radioactive waste in thermal mechanical coupling conditions. Uranium Geol. 25 (6), 373–379.
Lu, H., Feng, X. T., and Yang, C. X. (2021). Effect of different notch prefabricated methods and different notch length on three-point bending test of rock. Rock Soil Mech. 42 (4), 1115–1125.
Pandey, P., and Singh, D. P. (1986). Deformation of a rock in different tensile tests. Eng. Geol. 22 (3), 281–292. doi:10.1016/0013-7952(86)90029-3
Pei, J. L., Liu, J. F., Zuo, J. P., and Zhang, R. (2013). Investigation on dynamic evolution process of natural fractures based on acoustic emission position. Chin. J. Rock Mech. Eng. 32 (4), 696–704.
Pine, R. J., Owen, D. R. J., Coggan, J. S., and Rance, J. M. (2007). A new discrete fracture modelling approach for rock masses. Geotechnique 57 (9), 757–766. doi:10.1680/geot.2007.57.9.757
Prem, P. R., and Murthy, A. R. (2016). Acoustic emission monitoringof reinforced concrete beams subjected to four-pointbend-ing. Appl. Acoust. 117, 28–38. doi:10.1016/j.apacoust.2016.08.006
Tang, C. A., Wang, S. H., and Fu, Y. F. (2003). Numerical test of rock failure process. Beijing: Science Press.
Tian, Y. L., Chen, S. W., Zuo, S. Y., Yang, F. B., He, Q., and Zheng, K. X. (2022). Experimental study on thermo-mechanical properties of Beishan granite under mild temperature. Case Stud. Therm. Eng. 37, 102271. doi:10.1016/j.csite.2022.102271
Tian, Y., Yu, R. G., Zhang, Y., and Zhao, X. B. (2020). Application of acoustic emission characteristics in damage identification and quantitative evaluation of limestone. Adv. Eng. Sci. 52 (3), 115–122.
Wu, X. Z., Liu, J. W., and Liu, X. X. (2015). Study on the coupled relationship between AE accumulative ring-down count and damage constitutive model of rock. J. Min. Saf. Eng. 32 (1), 28–34.
Yang, M. H., Zhao, M. H., and Cao, W. G. (2005). Determination of parameters of statistical constitutive model for rock damage softening. J. Hydraulic Eng. 36 (03), 345–349.
Yang, X. F., Lu, Z. D., and Xing, C. (2022). Study on mechanical model of slip bending failure mechanism of bedding rock slope with plate crack structure. Rock Soil Mech. 43 (S1), 258–266.
Yao, W., Xia, K. W., and Li, X. (2018). Non-local failure theory andtwo-parameter tensile strength model for semi-circularbending tests of granitic rocks. Int. J. Rock Mech. Min. Sci. 110, 9–18. doi:10.1016/j.ijrmms.2018.07.002
Zeng, J. (2015). Experimental study on influencing factors of acoustic emission characteristics of Chongqing sandstone under three-point bending test conditions[D]. Chongqing: Chongqing University.
Zhang, M., Li, Z. K., and Yang, Q. (2006). Adamage model and statistical analysis of acoustic emission for quasi-brittle materials. Rock Mech. Eng. 25 (12), 2493–2501.
Zhou, Y. F., Zhu, X., and Liu, W. D. (2019). Identification of cracking characteristics of limestone under uniaxial compression conditions using acoustic emission and GMM, Water Resour. Hydropower Eng. 50 (11), 131–140.
Zuo, J. P., Wang, J. T., Sun, Y. J., Chen, Y., Jiang, G. H., and Li, Y. H. (2017). Effects of thermal treatment on fracture characteristics of granite from Beishan, a possible high-level radioactive waste disposal site in China. Eng. Fract. Mech. 182, 425–437. doi:10.1016/j.engfracmech.2017.04.043
Zuo, S. Y., Shi, W. B., and Liang, F. (2015). Numerical simulation and engineering application for failure modes and criterion of layered anisotropic rock mass. Chin. J. Geotechnical Eng. 37 (1), 191–196.
Keywords: limestone, three point bending test, damaged fracture criterion, numerical simulation, AE
Citation: Li B, Tian Y, Tian J, Zuo S and Chen S (2023) Bending-damaged fracture criterion and numerical implementation of limestone beam under three-point bending test. Front. Earth Sci. 11:1147129. doi: 10.3389/feart.2023.1147129
Received: 18 January 2023; Accepted: 05 April 2023;
Published: 18 April 2023.
Edited by:
Wenzhuo Cao, Imperial College London, United KingdomReviewed by:
Kang Bian, Chinese Academy of Sciences (CAS), ChinaYi-Xiang Song, Hebei University of Technology, China
Copyright © 2023 Li, Tian, Tian, Zuo and Chen. This is an open-access article distributed under the terms of the Creative Commons Attribution License (CC BY). The use, distribution or reproduction in other forums is permitted, provided the original author(s) and the copyright owner(s) are credited and that the original publication in this journal is cited, in accordance with accepted academic practice. No use, distribution or reproduction is permitted which does not comply with these terms.
*Correspondence: Yunlei Tian, dGlhbnl1bmxlaTEyMzRAMTYzLmNvbQ==