 Di Wu
Di Wu Li Ma2†
- 1Department of Aviation Meteorology, College of Air Traffic Management, Civil Aviation University of China, Tianjin, China
- 2Department of Atmospheric and Oceanic Sciences, Fudan University, Shanghai, China
- 3Tianjin Central Observatory for Oceanic Meteorology, Tianjin, China
The representation of cloud microphysical processes in models has always been a challenge leading to uncertainty in convective simulations. This paper evaluates the effect of cloud microphysical parameterizations on the simulation of mesoscale convective systems (MCSs) through a realistic banded convection process. A series of numerical simulation experiments are performed using the Weather Research and Forecasting (WRF) model at a convection-permitting scale with a 3 km horizontal grid spacing. Specifically, four experiments considering different hydrometeor species within the WRF single-moment-microphysics schemes (WSMMPs) are conducted, and three additional sensitivity tests change the graupel particle properties. The results indicate that the significant differences in the times of convection initiation across the experiments reach 120 min, and more hydrometeor species may lead to later convection initiation. Moreover, the frozen graupel hydrometeor characteristics can appreciably alter the simulated convective morphology, even more than other hydrometeor species. When the graupel becomes smaller (such as Graupel-like), the fall speed of the graupel particles decreases. Therefore, more numerous graupel particles reside in clouds for a longer time, and experience more atmospheric diabatic heating and cooling effects. As a result, the simulated convective systems exhibit strong banded convective echo characteristics, the surface 10-m wind gust increases, and the cold pools associated with additional melting and evaporation become stronger, accelerating the propagation of the system. In contrast, larger and less abundant graupels (e.g., Hail-like) have a faster fall speed, and the atmospheric diabatic heating and cooling decrease by shortening the duration of their residence time within the clouds, resulting in a weak quasi-linear convective system, weak surface 10-m wind gust, unobvious cold pool, and slower propagation. Comparisons of the experiments further demonstrate that the fall speeds of frozen graupel particles largely impact the vertical distribution of the hydrometeors and the related microphysical processes.
1 Introduction
With the rapid advancement of high-performance computing technology, kilometer-scale numerical models such as convection-permitting and cloud-resolving scale models (CRMs) have been gradually applied to operational forecasting around the world such as in some developed countries (Wang et al., 2019; Wedi et al., 2020; Ma et al., 2022). In these atmospheric models, cloud microphysics parameterization schemes are required to explicitly address the behaviors of clouds and precipitation (Tapiador et al., 2019), particularly for localized severe convective events (Morrison et al., 2020). Thus, it is necessary to improve our understanding and accurately perform cloud microphysics parameterization for both short- and medium-range weather forecasting.
Compared to an explicit bin microphysics scheme, considerable efforts have been made toward evaluating and improving bulk microphysics schemes. Bulk microphysics have higher computational efficiency, represent the size distributions of hydrometeors through an exponential function or gamma-type distribution function (Kessler, 1969; Cotton et al., 1986), and can better reproduce the characteristics of hydrometeors and meteorological elements in complex convective systems such as squall lines and supercell storms.
Typically, bulk schemes include cloud particles (e.g., cloud droplets and ice crystals) and precipitation particles (e.g., raindrops, snowflakes and graupel particles), which are primitively based on earlier work (Kessler, 1969; Lin et al., 1983; Rutledge and Hobbs, 1983). A simplified ice-phase microphysics process was proposed by Dudhia (1989) for use in the cloud-resolving models applicable to the Weather Research and Forecasting Model; however, the coexistence of mixed phases of ice and water had not yet been sufficiently considered. Subsequently, Hong et al. (2004) considered the cloud ice deposition process in the schemes to optimize the simulation of high clouds and precipitation amounts, and thus, the cloud ice process was reasonably reproduced. In addition, the introduction of various solid particles and microphysics processes such as riming, ice multiplication, and collision–coalescence has further improved the simulations of the microphysics parameterization (Hong and Lim, 2006; Thompson et al., 2008).
The microphysics process related to ice-phase particles is an important factor to consider when simulating organized convective systems. The solid hydrometeor, owning to the additional release of freezing latent heat, enhances the vertical motion and reasonably reproduces the convective updraft compared with liquid particles (Fovell and Ogura, 1988). In addition, the simulated stratification precipitation characteristics agree well with observations (Tao and Simpson, 1989). Moreover, the melting and cooling effect of solid particles generates colder cold pools beneath convective downdrafts, allowing the convection to be more vigorous and fast-propagating (Szeto and Cho, 1994). In a high-resolution squall line simulation over northern Jiangsu Province in China, Xu et al. (2017) demonstrated that the graupel or hail aloft contribute the most to surface precipitation compared to other liquid-phase hydrometeors. Ding and Liu (2015) noted that the different diameters of the graupel and hail in microphysics schemes are the main reason for the differences in the simulated amounts of precipitation. Recently, Jouan and Milbrandt (2019) also demonstrated that the effect of the concentrations of activated cloud condensation nuclei (CCN) on deep convective systems was largely influenced by the ice-phase parameterization process, especially the graupel growth rate. In addition, a rainstorm simulation in the warm region of southern China conducted by Zhou and Lu (2020) showed that graupel particles have a certain influence on the strength of cold pools.
In particular, the effect of solid particles on simulated convective systems can be rather different when considering different solid particle species. Bryan and Morrison (2012) used hail particles instead of graupel particles to simulate a squall line. Their results suggest that stratified precipitation region was slightly smaller, and the low-level cold pools occurred earlier and became stronger, which might have resulted from the larger size of the particles and their faster fall speed. A recent study conducted by Bae et al. (2019) demonstrated that introducing the hail hydrometeor can enhance the convective activity along the leading edge of a squall line and reduce the precipitation in the trailing stratiform regions. The results of the idealized bow-echo convective simulation conducted by Adams-Selin et al. (2013a) suggest that graupel particles with a faster fall speed led to colder and wider cold pools. However, some studies have suggested that smaller solid particles have a larger surface area to volume ratio, and their melting process can enhance low-level cooling, leading to stronger cold pools (Xue et al., 2017). Idealized supercell simulations conducted by Gilmore et al. (2004) further generated strong convective updraft when graupel particles were considered, which can be explained by the release of latent heat from a large number of small graupel particles through deposition and accretion processes. In contrast, larger hail particles may lead to weaker collection and evaporation, thus contributing to a warmer cold pool (Cohen and McCaul, 2006). In addition, Falk et al. (2019) reported that differences in the fall speeds of ice-phase particles have a direct effect on the simulations of convective systems, while the size characteristics of solid particles may be indirectly responsible for their fall speeds.
The results of the aforementioned studies indicate that even a few modifications to the microphysics parameterization may lead to changes in the size, spatial distribution characteristics, and physical properties of each hydrometeor (James et al., 2006), thus resulting in significant differences in the simulation of the characteristics of convective systems (Weisman, 1993; Adams-Selin et al., 2013b). However, most previous studies have been based on ideal numerical models, and only a few studies have focused on real case studies. To capture the characteristics of mesoscale convective systems and understand how convective systems initiate and mature, it is necessary to conduct studies with convection-permitting scale numerical models. Moreover, a previous analysis of an individual case has been more focused on the mesoscale dynamical processes (Wu et al., 2018), and few studies have investigated the effects of different hydrometeors species and particle parameters of microphysics schemes on convective systems, especially from the perspective of microphysical processes. The insights provided by our study could be helpful in improving operational forecasting skills and the developing microphysics parameterization schemes.
The goals of this study were 1) to evaluate the effects of the diversity of hydrometeors species on the simulated convective mode and morphology in terms of a real case; and 2) to explore the sensitivities of a convective system structure and associated thermodynamic process to graupel particle parameters. The reason for specifically changing the graupel parameters was their large impact on the microphysical heating and cooling rates based on previous studies (Falk et al., 2019). To this end, we chose a local banded convective system process that occurred in northern China to carry out a series of numerical simulations and sensitivity tests at a convection-permitting scale.
The rest of this paper is organized as follows: the experimental designs, data, and methods are presented in Section 2. Section 3 provides the background and observed mesoscale features of a local banded convective event. Section 4 analyzes and compares the effects of the different schemes and graupel particle characteristics on the initiation and development of the convective system. The graupel characteristics and the mechanism by which they influence the convective system are discussed in Section 5, and the summary and conclusions are presented in Section 6.
2 Model and methodology
2.1 Model configuration
The non-hydrostatic mesoscale Weather Research and Forecasting (WRF) Model version 4.3.1 (Skamarock et al., 2008) was used in this study to simulate a convective event at a convection-permitting scale. The model had a mixed vertical coordinate with 51 layers (top of model extends to 50 hPa). In the horizontal direction, the model was configured in three one-way nested domains, with horizontal grid spacings of 27 km, 9 km, and 3 km, and the center of the domain was located at 35.7°N, 115°E. The simulation area is shown in Figure 1. The simulation was initialized at 1800 UTC on 8 August 2020, with a time step of 90 s and was integrated for 36 h, of which the first 6 h were considered to be the model spin-up period and were not used in the analysis. The initial and lateral boundary conditions were obtained from the National Centers for Environmental Prediction (NCEP) Global Data Assimilation System/final (GDAS/FNL) global reanalysis data (Kalnay et al., 1996), which are updated every 6 h and have a horizontal resolution of 0.25° × 0.25°. The outputs of the innermost 3 km domain were saved every 15 min, and the subsequent analysis of the simulation results mainly focused on the innermost domain. Based on previous studies on convective simulations (e.g., Hu et al., 2022), the configurations of the physical parameterization schemes used in the model included the rapid radiative transfer model for general circulation models applications (RRTMG) scheme (Iacono et al., 2008) for both the long- and short-wave radiation, the Mellor-Yamada-Janjic (MYJ) planetary boundary-layer scheme (Janjic, 1994), and the Noah land surface scheme (Tewari et al., 2004). The Kain–Fritsch eta (KF; Kain, 2004) cumulus convective parameterization scheme was used in the outermost and intermediate domains.
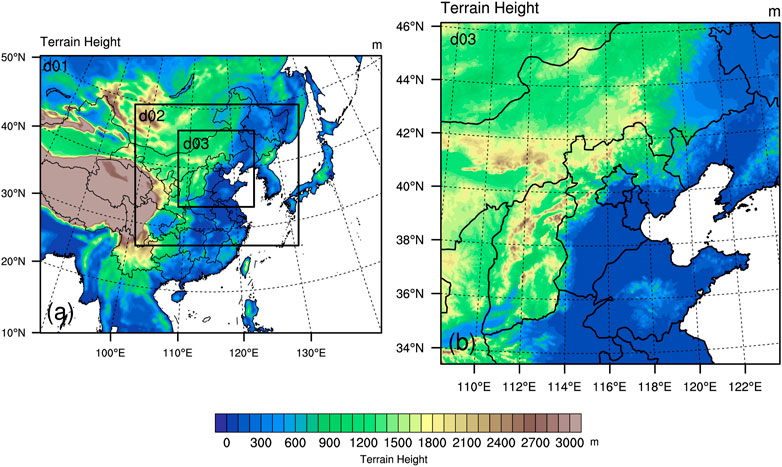
FIGURE 1. The topography (shaded; m) of (A) the triply nested weather research forecasting (WRF) simulated domains and (B) the finest domain D03.
2.2 Experimental design
Four bulk microphysics parameterization schemes were selected in this study to analyze and compare the effects of the different hydrometeor categories on the evolution of the convective system and the related thermodynamic processes. The four schemes selected were the WRF single-moment 3-class (WSM3; Hong et al., 2004) scheme with water vapor, cloud water/ice, and rain/snow; the WRF single-moment 5-class (WSM5) scheme with water vapor, cloud water, cloud ice, rain, and snow; the WRF single-moment 6-class (WSM6; Hong and Lim, 2006) scheme with additional graupel particles; and the WRF single-moment 7-class (WSM7; Bae et al., 2019) scheme with hail added to the WSM6 (Table 1). The differences in the hydrometeor species and particle phases could lead to the redistribution of the hydrometeors mass (Van Weverberg et al., 2013), and thus could affect the microphysical processes.
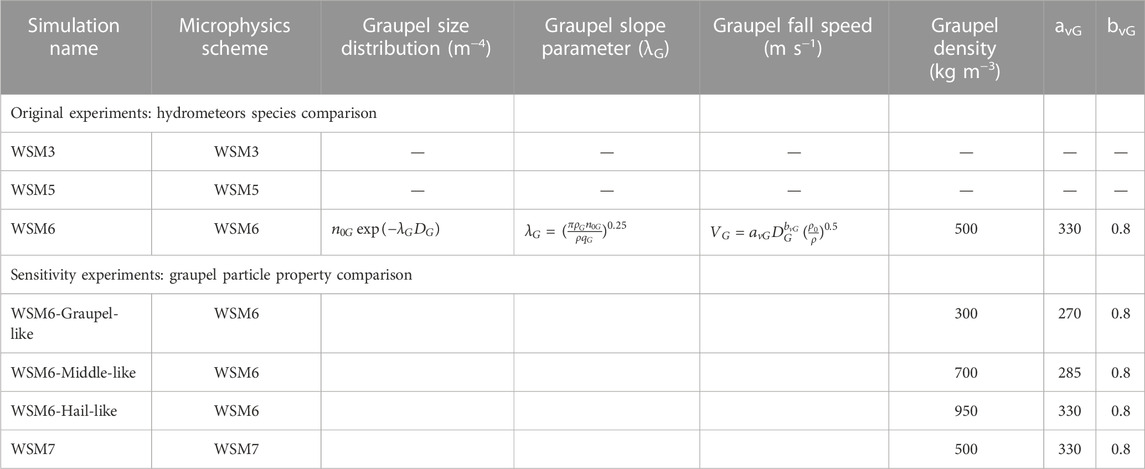
TABLE 1. Model experimental design and characteristics of graupel particle conducted in this study.
To further evaluate the sensitivity of the graupel hydrometeor properties to the simulation of the convective system, three additional sensitivity experiments were conducted with varying intercept parameter, density, and fall speed relationships for the graupel hydrometeor based on the WSM6 scheme, according to the sensitivity experiments on graupel particles conducted in previous studies (Adams-Selin et al., 2013a), namely, the WSM6-Graupel-Like, WSM6-Middle-Like, and WSM6-Hail-Like experiments. For the WSM6-Graupel-Like experiment, the graupel particles are smaller in size, lighter in mass, and have slower sedimentation velocities, that is, small graupel particles. The WSM6-Hail-Like experiment contains graupel particles with a larger diameter, heavier mass, and faster fall speed, which are similar to large graupel particles or hail particles, and the parameters for the graupel particles in the WSM6-Middle experiment have intermediate values. The microphysics schemes and the graupel parameter settings for all of the experiments are listed in Table 1. The increase in the mixing ratio of the graupel particles directly results in an increase in their diameter, whereas the surface-to-volume ratio of large particles is usually smaller, which could further lead to a decrease in their melting and evaporation rates. In addition, changes in the density and fall speed of graupel particles would also affect their residence time within the cloud and to a certain extent the duration of the phase change process.
Figure 2 shows the relationships between the graupel particle diameter and the number concentration and fall speeds for the experiments containing graupel hydrometeor. Generally, the number concentration of the graupel particles decreases with increasing diameter for a graupel mixing ratio of 1 g kg−1 and air density of 1 kg m−3 (Figure 2A), and an increase in the graupel particle diameter directly increases the fall speeds (Figure 2B). Moreover, the difference in fall speeds increases as the diameter increases. Because the WSM6 and WSM7 schemes have the same function relationship for graupel particles, their curves overlap. The relationship between the graupel particle diameter and the fall speed also indicates that for the same graupel particle diameter, the WSM6-Hail-Like experiment, WSM6, and WSM7 have the highest fall speed compared to the others, followed by the WSM6-Middle-Like experiment, and the graupel particles in the WSM6-Graupel-Like experiment have the slowest fall speed. Thus, the graupel particles with different properties are given in the respective experiments to investigate their effects on the morphology and thermodynamic processes of the convective system.
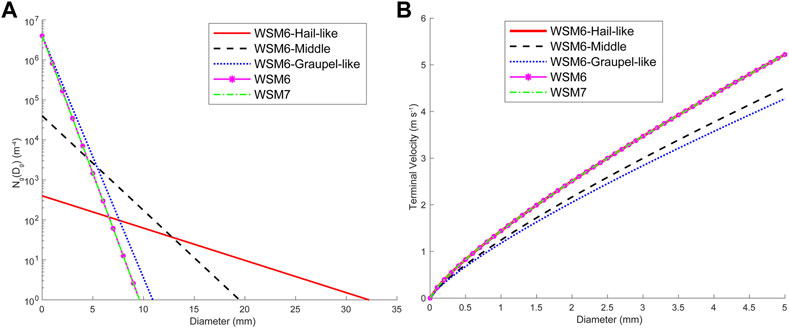
FIGURE 2. (A) The relationship of graupel hydrometeor diameters and number concentration with graupel mixing ratio of 1 g kg−1 and air density of 1 kg m−3. (B) Mass-weighted mean graupel hydrometeor fall velocity (m s−1) for a range of diameters for different experiments. Temperature is fixed at 268.15 K, and pressure is assumed to be at 900 hPa. It is noted that the curves of graupel number concentration of WSM7 test overlaps with that of WSM6 in (A), and the mean fall velocity of WSM6, WSM6-Hail-like and WSM7 are same in (B) because of their same graupel particle distribution function.
2.3 Methodology
To characterize the convective morphology and evaluate the simulation performances of the different experiments, the radar reflectivity factor dataset from an S-band Doppler weather radar in Tianjin (Z9220), China, for this event was used. The hourly wind fields at 10-m from the automated surface observation stations were also collected to examine the simulation results. The precipitation product was obtained from the National Aeronautics and Space Administration’s (NASA) integrated multi-satellite retrievals for global precipitation measurement (GPM) (IMERG; Huffman et al., 2020) dataset, which is available at 30-min intervals with a 0.1° gird spacing. Based on previous widely used definition of convective systems (Trier et al., 2017; Zhang et al., 2019), this study uses a radar reflectivity of 30 dBZ echo as the threshold for convective precipitation, classified as stratocumulus precipitation (15–30 dBZ) and convective precipitation (≥30 dBZ). Based on widely used convective initiation and development definitions based on radar reflectivity (e.g., Mulholland et al., 2018; Mulholland et al., 2019; Zhang et al., 2019), the convection initiation is defined as the time when the radar reflectivity exceeding 30 dBZ echo that cover at least 40 grid points, which then developed into a quasi-linear convective system. Although the threshold of 30 dBZ may not be rigorous, this approach is largely reasonable in allowing comparison between observations and model simulation results with acceptable initiation timing biases. And the convection development is subjectively determined by evaluation when the strength and range of simulated reflectivity began decreasing with time.
To analyze the influence of the microphysics process on the propagation of the banded convective system, the cold pool properties were characterized by introducing the near-surface buoyancy. As in the work of Correia et al. (2008) and Mulholland et al. (2019), the cold pools were defined using the surface buoyancy:
where g is gravitational acceleration,
3 Overview of the 9 August 2020 convective event
3.1 Synoptic-scale background and observed precipitation
A heavy precipitation event caused by local convection occurred in northern China on 9 August 2020. The horizontal distributions of the geopotential heights and wind fields at 500 hPa and 850 hPa are shown in Figure 3A. At 1200 UTC on 9 August 2020, a well-organized low-pressure system was located at high latitudes in the mid-level (500 hPa). Accompanied by the low-pressure system, a short-wave trough centered to the northwest of northern China moved eastward, and the westerly winds were dominant over northern China. At lower levels, an 850 hPa southwesterly low-level jet (LLJ) with horizontal wind speeds of greater than 5 m s−1 was enhanced across the southern part of northern China, which was conducive to moisture transport. Simultaneously, in the northwestern part of northern China, northeasterly winds were present. These wind field features induced both horizontal and vertical wind shear over this region. Figure 3B shows the distribution of the IMERG 6 h accumulated precipitation during 1,000–1600 UTC on 9 August 2020. As the convective system propagated southeastward, it resulted in a northeast-southwest oriented rain band over the Beijing-Tianjin-Hebei region in northern China. The rainfall center was located in the Beijing region with a maximum rainfall accumulation of about 120 mm.
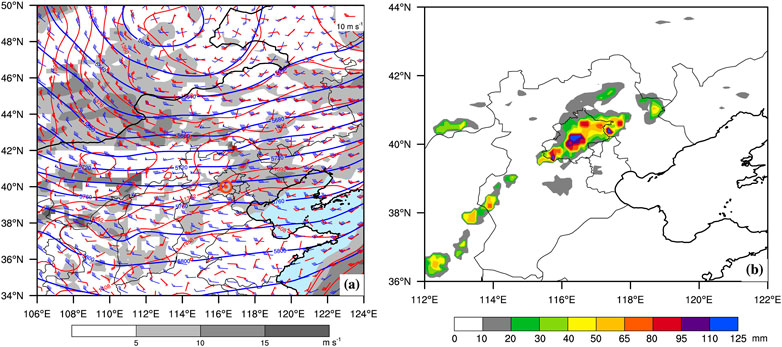
FIGURE 3. (A) Horizontal distributions of the 500 hPa (blue solid lines; gpm), 850 hPa (red solid lines; gpm) geopotential heights and 500 hPa (blue vectors; m s−1), 850 hPa (red vectors; m s−1) wind fields with low-level jet at 850 hPa (shaded; m s−1) valid at 1200 UTC 9 August 2020, the red circle marker in (A) denotes the location where banded convective occurred; (B) the observed 6-h total precipitation (shaded; mm) of the National Aeronautics Multi-satellite Retrievals for GPM (IMERG) starting from 1000 UTC 9 August 2020.
3.2 Banded convective system features
The evolution of the convective system during this period was depicted by the observed composite radar reflectivity at Tianjin station during this period (Figure 4). At 1000 UTC on 9 August, a weak stratiform precipitation system was first observed near the border area between northern Hebei Province and Beijing (Figure 4A). The hourly precipitation product from the GPM exhibited a scattered distribution (not shown), and the automated surface observation stations revealed that surface southerly winds dominated. Then, the system moved southeastward and developed. By 1200 UTC, a blocky convective echo appeared in the northern part of Beijing, accompanied by strong northerly winds at the surface (Figure 4B). Subsequently, the northwesterly winds at the surface dominated the northwestern sector, causing local convergence with the original southerly winds in the south. As a result, this mesoscale convective system was intensified, extending to cover most of the Beijing area and exhibiting a banded echo characteristic (Figure 4C). In addition, the precipitation increased. By 1400 UTC, the convective system developed to maturation when the echo reached 55 dBZ in the border area between Tianjin and Beijing, exhibiting an obvious bowed convective line (Figure 4D). The 1-h precipitation reached more than 30 mm between 1,300 and 1400 UTC. Then, the convective echo weakened, indicating that the convective system tended to die out during its eastward movement. Finally, the banded convective system moved out of the Tianjin area at 0000 UTC on 10 August, which was the end of the entire precipitation process.
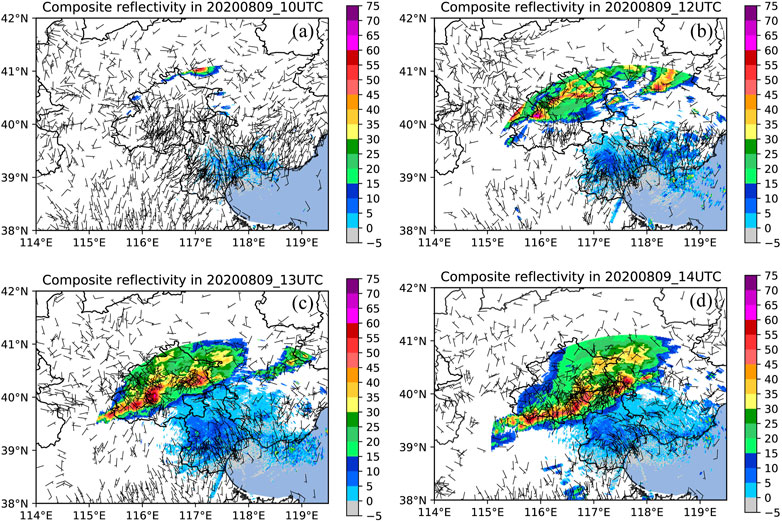
FIGURE 4. The surface observed composite radar reflectivity (shaded; dBZ) superimposed 10-m wind fields (vectors; m s−1) from automated surface observation stations at (A) 1000 UTC, (B) 1200 UTC, (C) 1300 UTC and (D) 1400 UTC on 9 August 2020, respectively.
4 Results of simulations for different experiments
4.1 Impacts on convection initiation
Figure 5 shows the simulated composite radar reflectivity and surface 10 m wind fields at the moment of convection initiation for the different experiments. It can be seen that for all seven experiments, the convection was initiated by the convergence of the low-level local southwesterly and northwesterly winds in the border area between eastern Beijing and Tianjin, which is in good agreement with the observed wind field characteristics (Figure 4). However, the simulated location of the convection initiation is shifted to the northeast compared with the observations, which may be related to the strong south winds in the model, causing the simulated convergence zone to be located farther north. It should be noted that all of the simulations have more or less the same positional bias, indicating an inherent systematic bias in the model-driven fields. Thus, we conclude that the seven experiments basically reproduced the convective process reasonably.
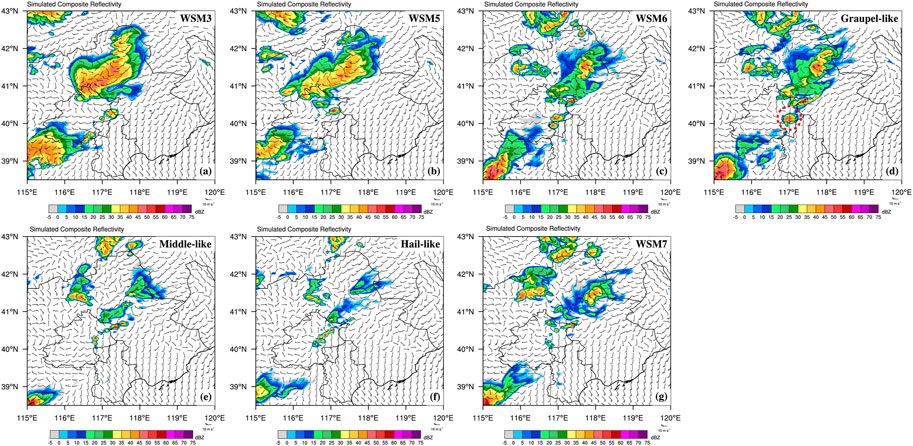
FIGURE 5. Simulated composite radar reflectivity (shaded; dBZ) superimposed horizontal wind fields at 10 m (vector; m s−1) at time of convective initiation for all seven experiments: (A) WSM3, (B) WSM5, (C) WSM6, (D) WSM6-Graupel-Like, (E) WSM6-Middle-Like, (F) WSM6-Hail-Like and (G) WSM7 experiments. The red circle marker in (D) denotes the location where convective initiated at first; and the statistical times of convection initiation for each experiment are shown in Table 2.
Further comparative analysis revealed that in terms of the convection initiation location, the WSM3, WSM5, WSM6, and WSM6-Graupel-Like experiments produced convection initiation roughly southeast of Beijing, whereas the WSM6-Middle, WSM6-Hail-Like, and WSM7 experiments produced convection initiation more to the east of Beijing. Compared with the simulated locations of the convection initiation, more differences come in the simulated convection initiation time. Table 2 displays the time of the convection initiation in each experiment according to the definition of convection initiation. The difference significantly varied by as much as 120 min. A prominent feature is that the convective system tended to initiate later when more hydrometeor species were included. Specifically, the WSM3 and WSM5 experiments without graupel particles produced the earliest time of convection initiation, about 1015 UTC and 1030 UTC, respectively, followed by the WSM6 experiment. In contrast, the WSM7 experiment with hail particles produced the latest initiation. Additionally, the set of three sensitivity experiments revealed that the larger the graupel particle diameter was, the later the simulated convection initiation time was. In general, the convection initiation times of all of the simulations were slightly earlier than the observed time.
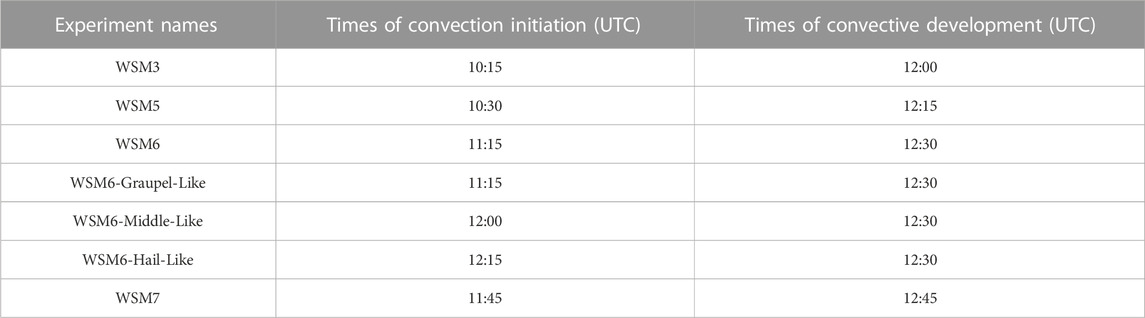
TABLE 2. Times of convective initiation and development for all seven experiments.
4.2 Impacts on the development of the convective system
During the convective development stage, for the seven experiments (Figure 6), significant differences occurred in the simulated convective morphology. The WSM3 and WSM5 experiments produced the broadest area of convective reflectivity, exceeding 30 dBZ, compared to the others (Figures 6A, B), which was caused by a large amount of small liquid hydrometeors (e.g., cloud drops and rain drops) instead of solid hydrometeors within the cloud. Moreover, the convective systems in the WSM6 and WSM6-Graupel-Like experiments produced a strong banded convective echo structure, with the strongest reflectivity of 50–55 dBZ occurring near the eastern boundary of the Beijing area (Figures 6C, D). This suggests that differences in the graupel properties seem to play an important role in convective morphology. One possible explanation for this may be that smaller graupel particles with slower descent speeds modulate the latent heating and evaporative cooling source by adjusting the hydrometeor distributions. These changes further led to wider updrafts and downdrafts. In contrast, the convective systems with large graupel and hail particles (e.g., in the WSM6-Middle-Like, WSM6-Hail-Like and WSM7 experiments) exhibited a weak quasi-linear echo structure, which was mainly located in eastern Beijing (Figures 6E–G). All of the experiments had similar convective development stage times (Table 2), whereas as with their earlier convection initiation times, the WSM3 and WSM5 experiments had slightly earlier convective development times.
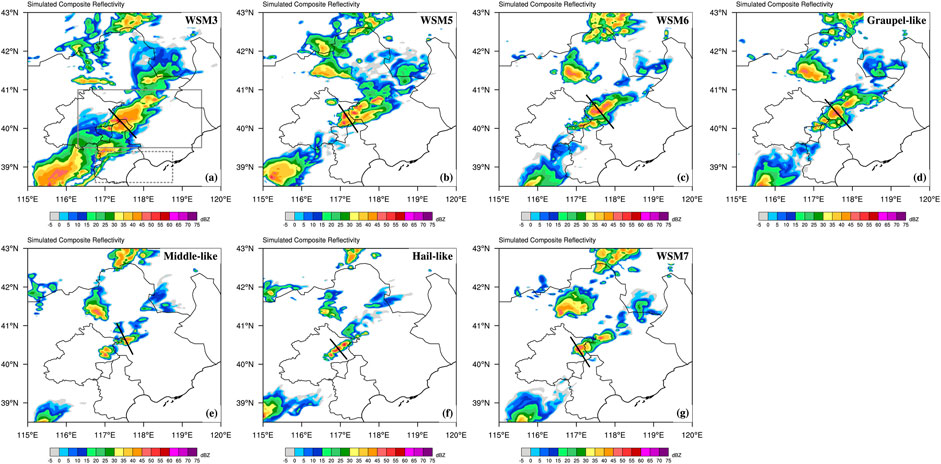
FIGURE 6. Simulated composite radar reflectivity (shaded; dBZ) at time of convective development for all seven experiments: (A) WSM3, (B) WSM5, (C) WSM6, (D) WSM6-Graupel-Like, (E) WSM6-Middle-Like, (F) WSM6-Hail-Like and (G) WSM7 experiments. The black lines correspond to the positions of the cross section for each experiment shown in Figures 14, 15. In Figure 6A, the grey solid box contains the area used to calculate the graupel particles characteristics in Figures 11, 12, and the grey dashed box indicates the region used to calculate environmental conditions for surface buoyancy. The specific times of convective development for each experiment are shown in Table 2.
4.3 Impacts on maximum 10-m wind speeds
The microphysical processes also resulted in changes in the surface wind fields through the cooling effect of low-level downdrafts. A relatively strong surface 10 m wind gust around the leading edge of the convective system (enclosed by blue contour in Figure 7) occurred in all of the experiments during the development stage. Compared with the WSM3 experiments, the WSM6 and WSM6-Graupel-Like experiments with graupel particles were characterized by a larger coverage area of wind speeds of greater than 12 m s−1 (Figures 7A–D), suggesting that considering the solid particles could benefit the intensification of the surface wind gusts. However, as the size of the graupel particles increased, a relatively weaker surface 10 m wind gust occurred in WSM6-Middle and WSM6-Hail-Like experiments (Figures 7E, F). Although the WSM7 experiment also contained graupel particles, like the WSM6 experiment, the introduction of large hail particles appeared to hamper the intensification of the surface wind fields, and the wind speed was approximately 10 m s−1 (Figure 7G).
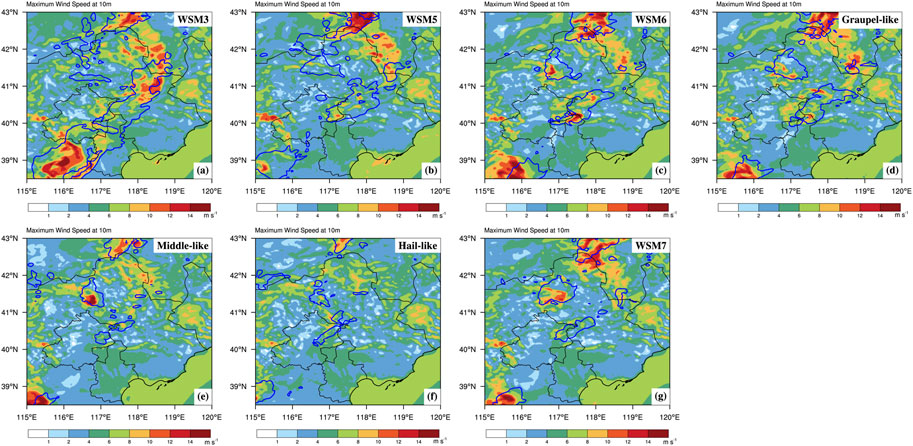
FIGURE 7. Simulated 10-m wind maximum speed (shaded; m s−1) at time of convective development for all seven experiments: (A) WSM3, (B) WSM5, (C) WSM6, (D) WSM6-Graupel-Like, (E) WSM6-Middle-Like, (F) WSM6-Hail-Like and (G) WSM7 experiments. The blue contours indicate simulated 15 dBZ composite radar reflectivity.
4.4 Impacts on the propagation of convective system
To further compare the effects of the microphysical processes on the propagation of the convective system, similar to the 10-m wind maximum speeds, the simulated surface potential temperature is displayed to evaluate the surface cold pools (Figure 8) in the different experiments during the development stage. Figure 9 shows the time series of the area-averaged surface buoyancy during this period computed using Eq. 1. The simulated surface potential temperature embedded in the convective echo region was colder in the WSM6 and WSM6-Graupel-Like experiments (Figures 8C, D), which is associated with the stronger cold pools driven by the convective downdraft. Thus, in these experiments the minimum buoyancy was attained earliest (at 1230 UTC) and was maintained for about 3 hours (Figure 9). As a result, a faster propagating convective system induced by the strengthened cold pools with a longer life cycle was generated. These features can be explained by the fact that smaller graupel-like particles with slower fall speed (see Figure 13) experienced more cooling through melting and evaporation processes above and below the melting level in downdrafts. In the WSM3 and WSM5 experiments, the cold surface potential temperature was mainly solely formed due to the solid snow particles (Figures 8A, B). Although similarly strongest cold pools in WSM3 experiment was generated at the latest by (1430 UTC) among all of the simulations, the less negative buoyance continued throughout most of the time before (Figure 9), which may have resulted from the additional time needed for the snow to fall below the melting level (Adams-Selin et al., 2013b). Therefore, the propagation speeds of the simulated convective systems in the WSM3 and WSM5 experiments were not as fast as those in the WSM6 and WSM6-Graupel-Like experiments. In contrast, the WSM6-Middle, WSM6-Hail-Like and WSM7 experiments lead to the non-obvious cold surface potential temperature covering a smaller area (Figures 8E–G) and less negatively buoyancy cold pools most of the time (Figure 9), supporting the conclusions of Cohen and McCaul, (2006). It is noted that a deepen cold pool occurred in WSM7 experiment after 1330 UTC. These features imply that due to their rapid fall velocity, the large graupel or hail particles seem to reduce the cooling effects by shortening their duration in the downdrafts (Figure 13). In these cases, the simulated convection moved less and was shorter-lived, particularly in the WSM6-Hail-Like experiment.
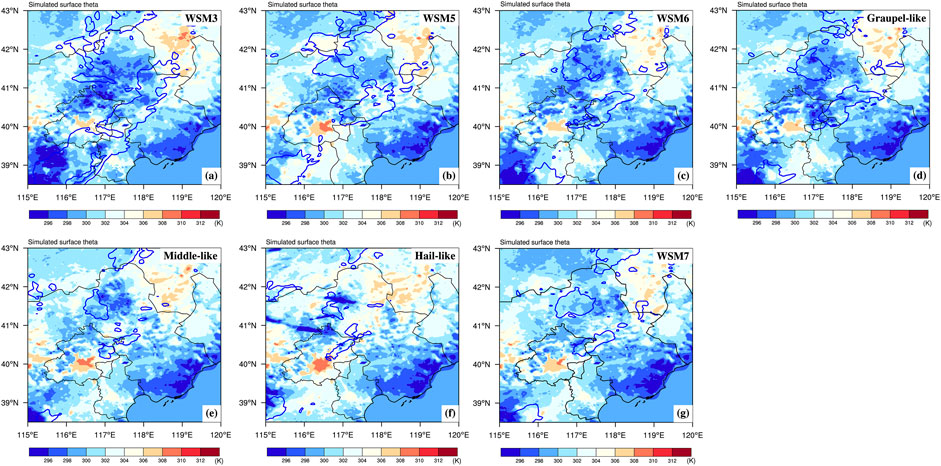
FIGURE 8. Simulated surface potential temperature (shaded; K) at convective development stage for all seven experiments: (A) WSM3, (B) WSM5, (C) WSM6, (D) WSM6-Graupel-Like, (E) WSM6-Middle-Like, (F) WSM6-Hail-Like and (G) WSM7 experiments. The blue contours show the simulated 15 dBZ composite radar reflectivity.
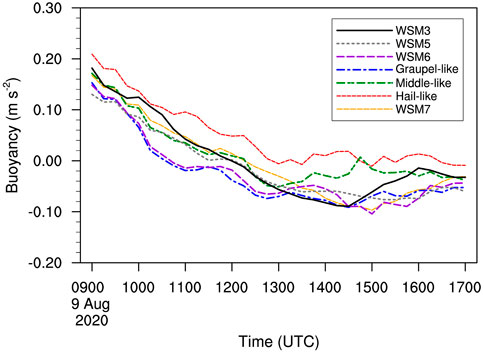
FIGURE 9. Time series of simulated area-averaged surface buoyancy (units: m s−2) of cold pools within the whole convection bands for all seven experiments beginning at 0900 UTC 9 August 2020.
5 Effect of sensitivity of graupel characteristics on convective system
5.1 Cloud microphysical characteristics
To understand the influences of the hydrometeor species and graupel particle properties on the microphysical characteristics of the convective system, Figure 10 shows the vertical distribution of each hydrometeor mixing ratio along a cross section through the convective system in the development stage for all of the experiments. The seven experiments produced significantly different vertical distribution hydrometeor characteristics. Without complex graupel and hail particles, the convective clouds in the WSM3 and WSM5 experiments were dominated by liquid particles, including cloud water and raindrop, as well as snow in the upper troposphere (Figures 10A, B), which reasonably supported the broadest area of stronger convective reflectivity (Figures 6A, B). Both the WSM6 and WSM6-Graupel-Like experiments are dominated by graupel and snow species above the melting level (approximately 4 km), and the graupel mixing ratio in the WSM6-Graupel-Like experiment was the largest among the experiments (Figures 10C, D). Below the melting layers, cloud water and rainwater were the main hydrometeors. Compared with the WSM6-Graupel-Like experiment, the hydrometeor mixing ratio was slightly lower in WSM6. Whereas in the WSM6-Middle-Like experiment (Figure 10E), a rather small graupel mixing ratio was produced at middle levels (6–10 km). The WSM6-Hail-Like experiment produced the smallest total mixing ratio associated with the convective system (Figure 10F), in which the least graupel mainly occurred at low levels (2–6 km). In the WSM7 experiment, the graupel mass was not less abundant in the upper troposphere, and the hail was primarily located at low levels (Figure 10G).
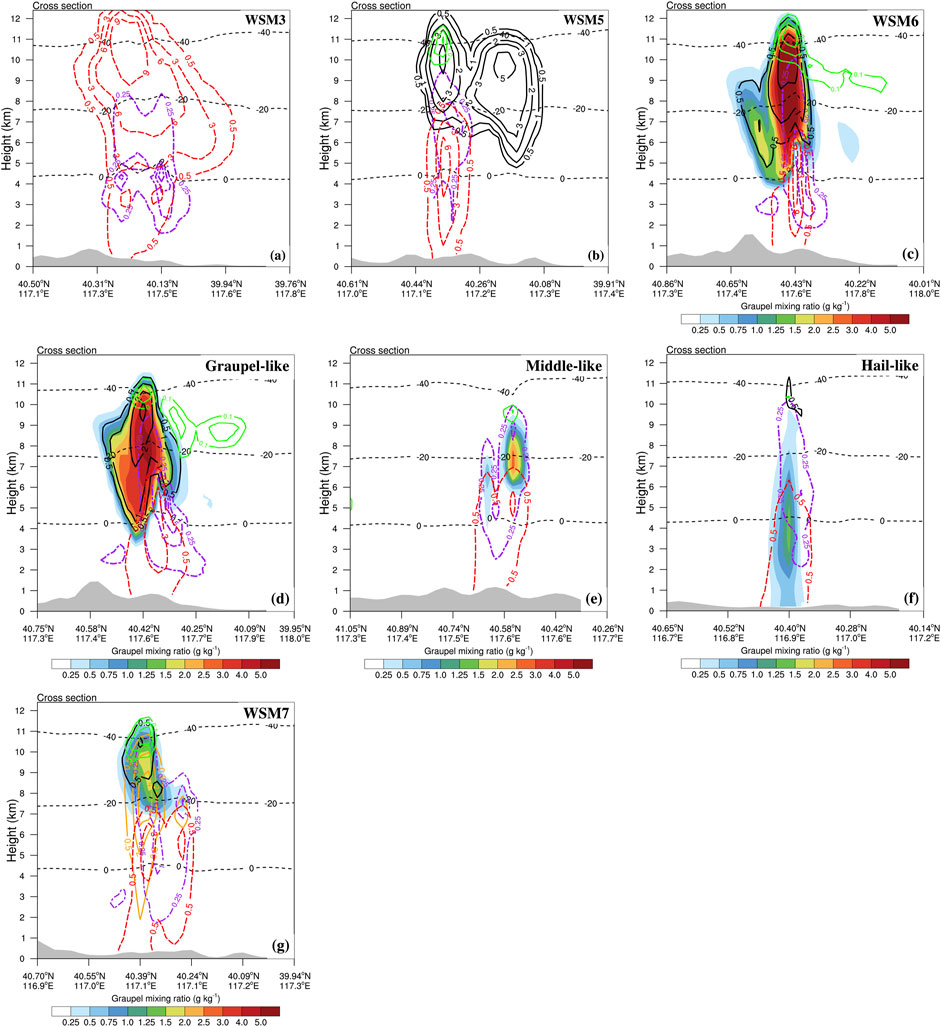
FIGURE 10. Vertical cross sections (along the black line in Figure 6) of the graupel (shaded; g kg−1), cloud water (purple dot dashed lines; g kg−1), rain water (red dashed lines; g kg−1), cloud ice (green solid lines; g kg−1), snow (black solid lines; g kg−1) and hail (orange solid lines; g kg−1) mixing ratios with the isotherm lines (black dashed lines; Isopleth interval is 20°C) at convective development stage for all experiments: (A) WSM3, (B) WSM5, (C) WSM6, (D) WSM6-Graupel-Like, (E) WSM6-Middle-Like, (F) WSM6-Hail-Like and (G) WSM7 experiments. The grey areas indicate the terrain height.
The vertical distribution characteristics of the hydrometeors seem to be closely related to the graupel hydrometeor properties. The temporally and spatially averaged contoured frequency by altitude diagrams (CFADs; Yuter and Houze, 1995) of the graupel particle diameters and fall speeds for the WSM6-related experiment are provided in Figures 11, 12, respectively. And the Time series of median graupel sizes and fall speeds are exhibited in Figure 13. It can be seen that smaller graupel particle diameters (less than 0.5 mm; Figure 11A) with slower fall velocities (less than 0.8 m s−1; Figure 12A) occurred in the middle and upper levels in the WSM6-Graupel-Like experiment. Similar characteristics occurred in the WSM6 experiment, but the diameters (less than 0.6 mm) were somewhat larger and descent speeds (less than 1.2 m s−1) were somewhat faster than those in the WSM6-Graupel-Like experiment (Figures 11B, 12B). Because of smaller fall velocities (Figure 13B), the graupel hydrometeor was retained 3 km above the ground level (AGL), which is consistent with the results of Van Weverberg et al. (2013). Only when the diameter and descent speed of the graupel particles increased did the graupel particles begin to occur at low altitudes of <3 km in the WSM6-Middle-Like experiment (Figures 10E, 11C, 12C, 13A). Similarly, the WSM6-Hail-Like experiment produced graupel particles throughout the troposphere due to their largest fall speed (Figures 11D, 12D, 13B). In addition, recall that a general relationship between the graupel hydrometeor diameter and number concentration is applied in the WSM6-related schemes (see Section 2.2). This means smaller graupel particles with larger number concentration were generated in the WSM6-Graupel-Like experiment. As a result, abundant graupel particles occurred above the melting layers. Apparently, these characteristics are consistent with the vertical distributions of the hydrometeors in the WSM6-Graupel-Like experiment (Figure 13). Therefore, the WSM6-Hail-Like experiment produced the least graupel particles at lower levels and the particles had the largest sizes, which was related to their smallest number concentration and fastest fall velocities.
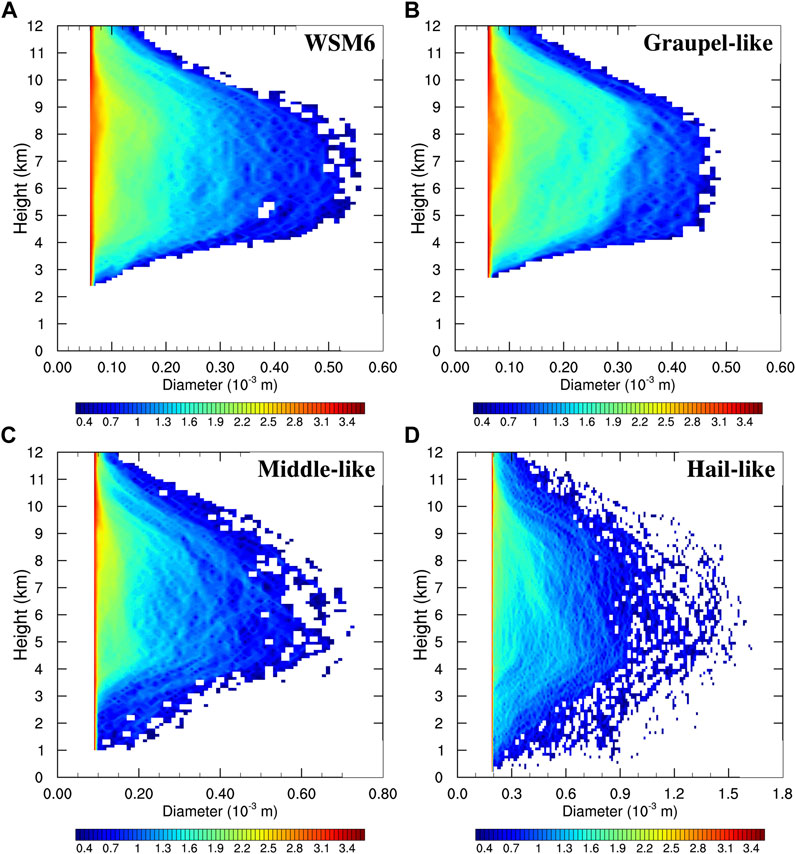
FIGURE 11. Contoured frequency by altitude diagrams (CFADs) of horizontally and temporally averaged volume-weighted mean diameter of graupel particles (10−3 m) for (A) WSM6, (B) WSM6-Graupel-Like, (C) WSM6-Middle-Like and (D) WSM6-Hail-Like experiments. The area averaging was over grey solid box in Figure 6A, and temporal averaging was from 0900 UTC to 1700 UTC on 9 August 2020. Note that the ranges of abscissa differ between experiments and the colour bar for the increasing logarithmic values [from blue (1) to red (104)] is used to describe the occurrence frequency.
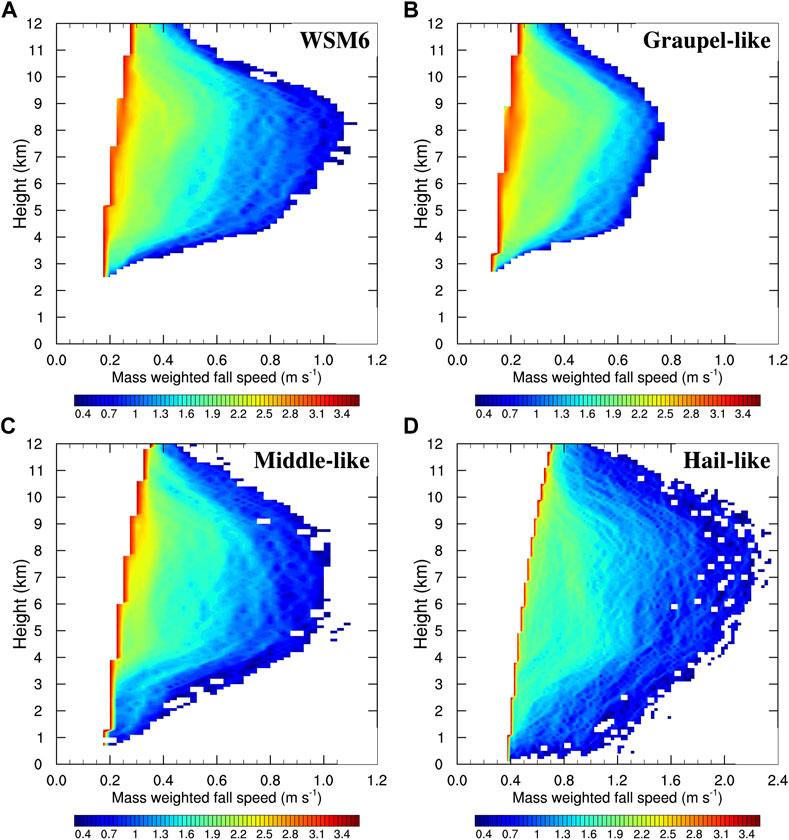
FIGURE 12. Same as in Figure 11, but for the mass weighted fall speed (m s−1) of graupel particles in (A) WSM6, (B) WSM6-Graupel-Like, (C) WSM6-Middle-Like and (D) WSM6-Hail-Like experiments.
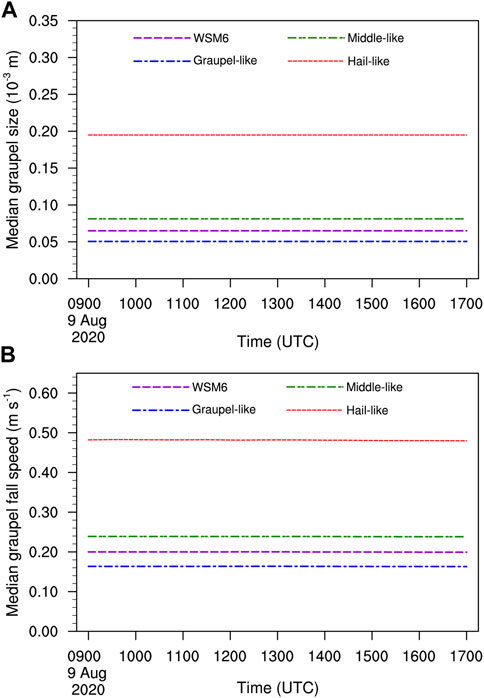
FIGURE 13. Time series of median (A) graupel sizes (10−3 m) and (B) graupel fall speeds (m s−1) over the whole domain shown in Figure 6 for WSM6, WSM6-Graupel-Like, WSM6-Middle-Like and WSM6-Hail-Like experiments.
5.2 Contributions of microphysical diabatic heating process
The above analyses indicate that the differences in the vertical distributions of the hydrometeor in the different experiments were largely due to the differences in the graupel particle properties. More importantly, these differences potentially impacted the microphysical diabatic heating process associated with convective clouds. To further elucidate the dynamic and thermodynamic effects related to the graupel particles on the convective system, Figures 14, 15 show vertical cross sections of the heating and cooling sources with instantaneous flow through the convective system at the development stage for all of the experiments. In the WSM3 experiments, a large mount of cloud water condensation and rain below 9 km AGL and deposition above the melting level dominated (Figure 14A), which resulted in an enhanced convective updraft within the clouds and a wider convective core. In addition, the cooling effects were mainly from the sublimation cooling of the cloud ice and snow (Figure 15A). The evaporation cooling process was relatively weak, although the melting cooling process in the upper layer was obvious compared to the others. The WSM5 experiment seems to generate less heating related to condensation and deposition (Figure 14B), and the evaporation and sublimation cooling effects were dominant but small (Figure 15B). The graupel and snow species contributed considerably to the heating associated with the deposition in the WSM6 and WSM6-Graupel-like experiments (Figures 14C, D), which was mainly attributed to smaller graupels with a larger number concentration. These hydrometeors spread horizontally more rapidly than they fell out, allowing them to remain in the atmosphere longer before reaching the melting layer. It should also be noted that the cloud water and rainwater were also responsible for the large amount of heating related to condensation (Figures 15C, D). In this case, a stronger convective updraft must be generated, thus explaining the formation of the banded and even bowed convective echo structures. Furthermore, during the period when the smaller, more numerous graupels fell slowly below the melting levels, the effects of the surface area-to-volume and fall speed of the graupels must have enlarged the cooling rates through evaporation and sublimations aloft (Figure 15D), which eventually resulted in a stronger surface 10-m gust wind and a deeper, more negatively buoyant cold pool, as well as a faster convection propagation. This is consistent with the results of Xue et al. (2017), that is, the highest condensate production and evaporation were produced when low terminal velocities associated with graupel were considered in their semi-idealized squall-line simulation.
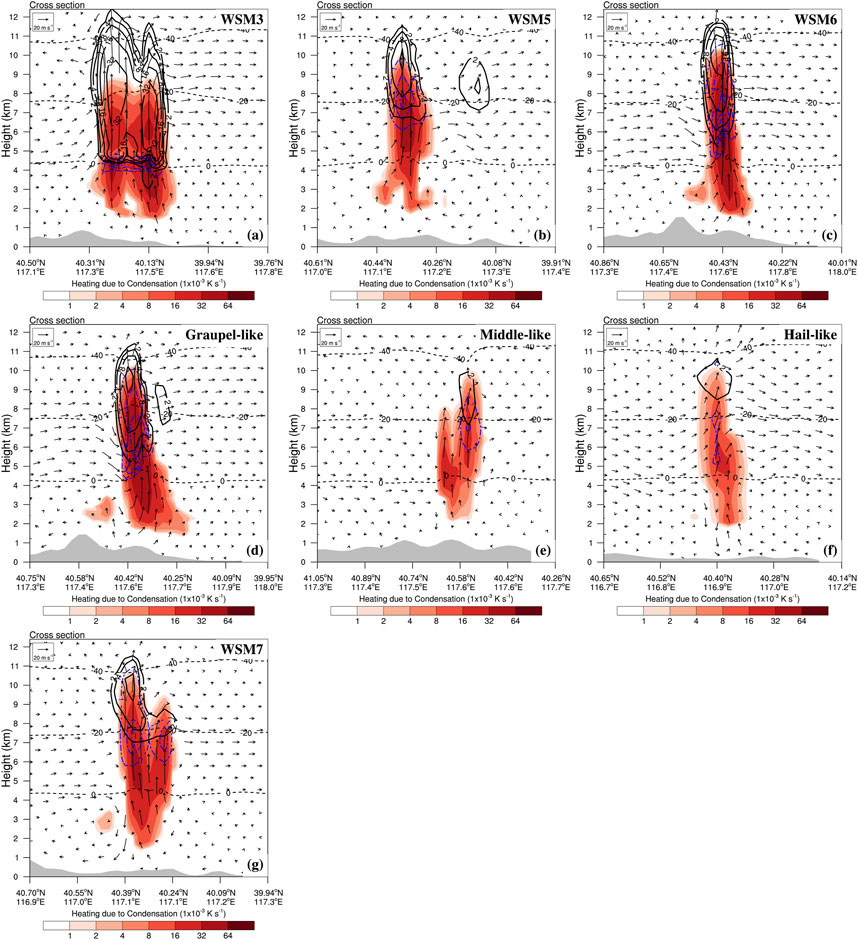
FIGURE 14. Vertical cross sections (along the black line in Figure 6) of heating source from condensation (shaded; 10−3 K s−1), deposition (black solid lines; 10−3 K s−1) and freezing (dark blue dashed lines; 10−3 K s−1) superimposed instantaneous flow with the isotherm lines (black dashed lines; Isopleth interval is 20°C) at convective development stage for all seven experiments: (A) WSM3, (B) WSM5, (C) WSM6, (D) WSM6-Graupel-Like, (E) WSM6-Middle-Like, (F) WSM6-Hail-Like and (G) WSM7 experiments. The grey areas indicate the terrain height.
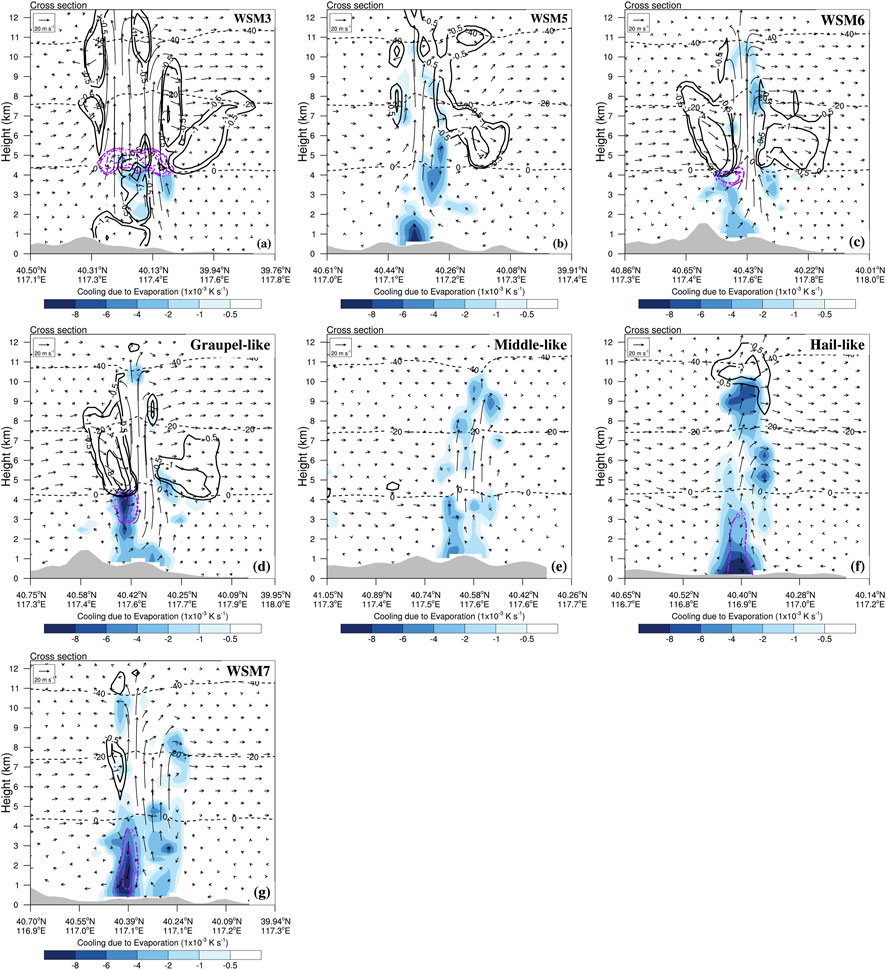
FIGURE 15. Vertical cross sections (along the black line in Figure 6) of cooling source from evaporation (shaded; 10−3 K s−1), sublimation (black solid lines; 10−3 K s−1) and melting (purple dashed lines; 10−3 K s−1) superimposed instantaneous flow with the isotherm lines (black dashed lines; Isopleth interval is 20°C) at convective development stage for all seven experiments: (A) WSM3, (B) WSM5, (C) WSM6, (D) WSM6-Graupel-Like, (E) WSM6-Middle-Like, (F) WSM6-Hail-Like and (G) WSM7 experiments. The grey areas indicate the terrain height.
The condensation heating in the WSM6-Middle-Like and WSM6-Hail-Like experiments was not extensive as in the WSM6-Graupel-like experiment (Figures 14E, F) and consisted of some deposition at high altitudes. The rare, large, and fast-falling hail-like particles may have inhibited the intensification of the system by weakening the updrafts, which were responsible for the weak quasi-linear echo structure in the WSM6-Hail-Like experiment. In view of the cooling effects, it is clear that they produced similar vertical distributions of microphysical evaporation cooling. Compared with the WSM6-Middle-Like experiments, the WSM6-Hail-Like experiment produced stronger cooling and the peaks tended to be closer to the surface, which could be associated with their weak vertical velocities (Figures 15E, F). It should also be noted that the cooling effects of both experiments were dominated by evaporation instead of sublimation in the WSM6-Graupel-like experiment, suggesting that the largest diameter and fastest sedimentation of the hail-like particles shortened their residence time within the clouds. These combined effects lead to weaker surface winds, a warmer cold pool, and slower propagation. A compromise between features occurred in the WSM7 experiment, in which the heating and cooling effects were intermediate between those in the WSM6-Graupel-like and WSM6-Hail-Like experiments (Figures 14G, 15G). Overall, the effects of the graupel particle parameters had more significant influences on the convective morphology and cloud microphysical structure than the hydrometeor categories. The sizes of the graupel particles led to the differences in their falling velocity. The vertical distribution characteristics of each hydrometeor were changed, and thus, the structures of the cloud dynamics and microphysical diabatic heating were modulated. However, the graupel fell very slowly, which extended its residence time in the atmosphere, thereby affecting the duration of the atmospheric diabatic heating.
6 Summary and conclusion
In this study, the role of microphysics parameterization in the evolution of the 9 August 2020 banded mesoscale convective system over northern China was investigated. A series of convection-permitting scale WRF simulations were conducted in which the hydrometeor categories within the bulk microphysics schemes were increased and decreased and the graupel hydrometeor properties were changed to be more like graupel or hail particles. The results of the microphysics-related experiments highlighted the effects of the graupel particle properties on the convection initiation and development of this local banded convective system. The influences on the convection initiation included changes in the location and time. The convection initiation occurred relatively earlier when fewer hydrometeor categories were considered in the WSM3 and WSM5 experiments, and vice versa in the WSM6 and WSM7 experiments, which may be attributed to the additional time required for the release of the freezing latent heat. Even when a lot of changes in the hydrometeor species and properties were made, the convective system was formed in all of the experiments, but its strength and location differed. This suggests that the trigger mechanism was more dependent on the local low-level wind convergence for this event, regardless of the microphysics parameterization. The factors influencing the convective development included the convective system characteristics such as the convective echo structure, surface wind fields, and potential temperature, which then affected the lifetime and propagation of the convective system. The variations in the graupel hydrometeor properties potentially influenced the simulated convective morphology. Specifically, the WSM6-Graupel-Like experiment was characterized by a banded or bowed echo characteristic, stronger surface wind gusts, cold pools, and fast convective propagation; while the WSM6-Hail-Like experiment displayed a weak quasi-linear echo, weak surface wind gusts, unobvious cold pools, and slow movement.
The vertical structure of the hydrometeor mixing ratio of the simulated convective clouds further revealed that in the WSM6 and WSM6-Graupel-Like experiments, larger mixing ratios of graupel and snow occurred in the middle and upper troposphere. According to the statistical CFADs of the graupel particle properties and the relationship between the graupel hydrometeor diameter and number concentration, the graupels generated in the WSM6-Graupel-Like experiment were characterized by a smaller diameter, slower fall velocity, and larger number concentration. Their slower fall speed lead to their occurrence at higher altitudes compared with the existence of graupel particles at lower levels in the WSM6-Hail-Like experiment, and hence, the diabatic heating process was adjusted. Moreover, the enhanced diabatic microphysical heating rates of the deposition of abundant graupel particles and the condensation of cloud water and rainwater with strong updrafts potentially supported the formation of the banded or bowed echo characteristics in the WSM6-Graupel-Like experiments. However, the reduced sedimentation resulted in the occurrence of long-lived graupel particles within the cloud, further affecting the duration of the atmospheric diabatic cooling and thus strengthening the downdrafts via sublimation. These features all helped explain why the experiments produced abundant small and slow-falling graupel-like practices, the surface wind gust intensified, the cold pools deepened, and the convective propagation accelerated relative to the production of a few large and fast-falling hail-like solid practices. Future work should include microphysics budget analysis for each hydrometeor, and the relative contribution of each microphysics process should be considered to quantitatively determine the specific diabatic contributions of the convection initiation, maturity, and propagation. Also, our work focused on the influences of graupel particle properties, and other ice-phase particles such as rimed ice and snow still need to be examined.
While this study revealed some important effects of microphysical parameterizations on the evolution of a convective system in a single convection event, more universal conclusions are desirable for more cases or operational applications. Moreover, only the WSMMPs were employed, but it is reasonable to expect similar conclusions would be achieved for multi-moment microphysics schemes and spectral bin microphysics schemes. An interesting extension of this study would be to explore the relative importance of the solid particle properties parameterization and the types of bin or bulk microphysics schemes to the simulated convective system. This means that more field programs and detailed observations of particle parameters are warranted to verify the simulated distribution characteristics of the hydrometeors.
In general, this study focused on how the evolution of a convective system responded to adjustments in the hydrometeors species and graupel parameters within microphysics schemes. The conclusions could be useful in improving the representation of graupels in microphysics schemes and are instructive for developing more accurate simulations of convective system morphology and characteristics. We remind forecasters to be aware of the importance of microphysics parameterization in operational forecasting. Finally, the knowledge of the sensitivity of the microphysical parameterizations in the simulated convective system has implications for the design of future convective-scale ensemble forecasting systems.
Data availability statement
The raw data supporting the conclusion of this article will be made available by the authors, without undue reservation.
Author contributions
All authors contributed to the study conception and design. DW made substantial contributions to the conception or design of the work, supervisor. Material preparation, data collection and analysis were performed by LM, TH, and RZ. The first draft of the manuscript was written by LM followed by DW, and all authors commented on previous versions of the manuscript. All authors read and approved the final manuscript.
Funding
This study is supported by the National Key R&D Program of China (No. 2020YFB1600103), the National Natural Science Foundation of China (No. 42005004), and the Fundamental Research Funds for the Central Universities (No. 3122019137). In addition, high-performance computing resources were provided by the national supercomputer center in Tianjin, China.
Acknowledgments
We would like to acknowledge the National Centers for Environmental Prediction for Operational Global Analysis data and the National Aeronautics and Space Administration (NASA)’s Integrated Multi-satellite Retrievals for GPM (IMERG) for the multi-satellite precipitation product. We thank the Meteorology Information Center of the Chinese Meteorology Administration for providing observation data. We thank LetPub (www.letpub.com) for its linguistic assistance for this manuscript. We would like to thank the main editor and reviewers for insightful comments and suggestions on this work.
Conflict of interest
The authors declare that the research was conducted in the absence of any commercial or financial relationships that could be construed as a potential conflict of interest.
Publisher’s note
All claims expressed in this article are solely those of the authors and do not necessarily represent those of their affiliated organizations, or those of the publisher, the editors and the reviewers. Any product that may be evaluated in this article, or claim that may be made by its manufacturer, is not guaranteed or endorsed by the publisher.
References
Adams-Selin, R. D., van den Heever, S. C., and Johnson, R. H. (2013a). Impact of graupel parameterization schemes on idealized bow echo simulations. Mon. Wea. Rev. 141, 1241–1262. doi:10.1175/mwr-d-12-00064.1
Adams-Selin, R. D., van den Heever, S. C., and Johnson, R. H. (2013b). Sensitivity of bow-echo simulation to microphysical parameterizations. Weather Forecast. 28, 1188–1209. doi:10.1175/waf-d-12-00108.1
Bae, S. Y., Hong, S. Y., and Tao, W. K. (2019). Development of a single-moment cloud microphysics scheme with prognostic hail for the Weather Research and Forecasting (WRF) model. Asia-Pacific. J. Atmos. Sci. 55, 233–245. doi:10.1007/s13143-018-0066-3
Bryan, G. H., and Morrison, H. (2012). Sensitivity of a simulated squall line to horizontal resolution and parameterization of microphysics. Mon. Wea. Rev. 140, 202–225. doi:10.1175/mwr-d-11-00046.1
Cohen, C., and McCaul, E. W. (2006). The sensitivity of simulated convective storms to variations in prescribed single-moment microphysics parameters that describe particle distributions, sizes, and numbers. Mon. Wea. Rev. 134, 2547–2565. doi:10.1175/mwr3195.1
Correia, J., Arritt, R. W., and Anderson, C. J. (2008). Idealized mesoscale convective system structure and propagation using convective parameterization. Mon. Wea. Rev. 136 (7), 2422–2442. doi:10.1175/2007mwr2229.1
Cotton, W. R., Tripoli, G. J., Rauber, R. M., and Mulvihill, E. A. (1986). Numerical simulation of the effects of varying ice crystal nucleation rates and aggregation processes on orographic snowfall. J. Clim. Appl. Meteor. 25, 1658–1680. doi:10.1175/1520-0450(1986)025<1658:nsoteo>2.0.co;2
Ding, W., and Liu, X. (2015). A numerical study with six bulk microphysical schemes of a deep convective system in Hubei Province (in Chinese). Sci. Technol. Eng. 15 (15), 1671–1815.
Dudhia, J. (1989). Numerical study of convection observed during the winter monsoon experiment using a mesoscale two-dimensional model. J. Atmos. Sci. 46, 3077–3107. doi:10.1175/1520-0469(1989)046<3077:nsocod>2.0.co;2
Falk, N. M., Igel, A. L., and Igel, M. R. (2019). The relative impact of ice fall speeds and microphysics parameterization complexity on supercell evolution. Mon. Wea. Rev. 147 (7), 2403–2415. doi:10.1175/mwr-d-18-0417.1
Fovell, R. G., and Ogura, Y. (1988). Numerical simulation of a midlatitude squall line in two dimensions. J. Atmos. Sci. 45, 3846–3879. doi:10.1175/1520-0469(1988)045<3846:nsoams>2.0.co;2
Gilmore, M. S., Straka, J. M., and Rasmussen, E. N. (2004). Precipitation uncertainty due to variations in precipitation particle parameters within a simple microphysics scheme. Mon. Wea. Rev. 132, 2610–2627. doi:10.1175/mwr2810.1
Hong, S. Y., and Lim, J. O. J. (2006). The WRF single-moment 6-class microphysics scheme (WSM6). Asia-pacific. J. Atmos. Sci. 42 (2), 129–151.
Hong, S. Y., Dudhia, J., and Chen, S. H. (2004). A revised approach to ice microphysical processes for the bulk parameterization of clouds and precipitation. Mon. Wea. Rev. 132, 103–120. doi:10.1175/1520-0493(2004)132<0103:aratim>2.0.co;2
Hu, T., Wang, Y., and Wu, D. (2022). The interaction of an urban heat island with a sea breeze front during moist convection over Tianjin, China. Weather 77 (7), 238–247. doi:10.1002/wea.3995
Huffman, G. J., Bolvin, D. T., and Braithwaite, D. (2020). “Integrated multi-satellite retrievals for the global precipitation measurement (GPM) mission (IMERG),” in Satellite precipitation measurement (Cham: Springer), 343–353.
Iacono, M. J., Delamere, J. S., Mlawer, E. J., Shephard, M. W., Clough, S. A., and Collins, W. D. (2008). Radiative forcing by long–lived greenhouse gases: Calculations with the AER radiative transfer models. J. Geophys. Res. 113, D13103. doi:10.1029/2008JD009944
James, R. P., Fritsch, J. M., and Markowski, P. M. (2006). Bow echo sensitivity to ambient moisture and cold pool strength. Mon. Wea. Rev. 134, 950–964. doi:10.1175/mwr3109.1
Janjic, Z. I. (1994). The Step–Mountain Eta Coordinate Model: Further developments of the convection, viscous sublayer, and turbulence closure schemes. Mon. Wea. Rev. 122, 927–945. doi:10.1175/1520-0493(1994)122<0927:tsmecm>2.0.co;2
Jouan, C., and Milbrandt, J. A. (2019). The importance of the ice-phase microphysics parameterization for simulating the effects of changes to CCN concentrations in deep convection. J. Atmos. Sci. 76 (6), 1727–1752. doi:10.1175/jas-d-18-0168.1
Kain, J. S. (2004). The Kain-Fritsch convective parameterization: An update. J. Appl. Meteor. 43, 170–181. doi:10.1175/1520-0450(2004)043<0170:tkcpau>2.0.co;2
Kalnay, E., Kanamitsu, M., Kistler, R., Collins, W., Deaven, D., Gandin, L., et al. (1996). The NCEP/NCAR 40-year reanalysis project. Bull. Am. meteorological Soc. 77 (3), 437–471. doi:10.1175/1520-0477(1996)077<0437:tnyrp>2.0.co;2
Kessler, E. (1969). “On the distribution and continuity of water substance in atmospheric circulations,” in Meteorological. Monographs. No.32, American Meteorological Society, 84.
Lin, Y. L., Farley, R. D., and Orville, H. D. (1983). Bulk parameterization of the snow field in a cloud model. J. Appl. Meteorology Climatol. 22 (6), 1065–1092. doi:10.1175/1520-0450(1983)022<1065:bpotsf>2.0.co;2
Ma, Y., Hu, Z., Xie, Q., Meng, X., Zhao, L., and Dong, W. (2022). Convection-permitting modeling over the Tibetan plateau improves the simulation of meiyu rainfall during the 2011 yangtze plain flood. Atmos. Res. 265, 105907. doi:10.1016/j.atmosres.2021.105907
Morrison, H., van Lier-Walqui, M., Fridlind, A. M., Grabowski, W. W., Harrington, J. Y., Hoose, C., et al. (2020). Confronting the challenge of modeling cloud and precipitation microphysics. J. Adv. Model. Earth Syst. 12, e2019MS001689. doi:10.1029/2019MS001689
Mulholland, J. P., Nesbitt, S. W., Trapp, R. J., Rasmussen, K. L., and Salio, P. V. (2018). Convective storm life cycle and environments near the Sierras de Cordoba, Argentina. Mon. Wea. Rev. 146, 2541–2557. doi:10.1175/MWR-D-18-0081.1
Mulholland, J. P., Nesbitt, S. W., and Trapp, R. J. (2019). A case study of terrain influences on upscale convective growth of a supercell. Mon. Wea. Rev. 147 (12), 4305–4324. doi:10.1175/mwr-d-19-0099.1
Rutledge, S. A., and Hobbs, P. V. (1983). The mesoscale and microscale structure and organization of clouds and precipitation in midlatitude cyclones. VIII: A model for the “seeder-feeder” process in warm-frontal rainbands. J. Atmos. Sci. 40, 1185–1206. doi:10.1175/1520-0469(1983)040<1185:tmamsa>2.0.co;2
Skamarock, W. C., Klemp, J. B., and Dudhia, J. (2008). A description of the Advanced Research WRF version 3. NCAR Tech. Note TN-475+STR, 113.
Szeto, K. K., and Cho, H. (1994). A numerical investigation of squall lines. Part III: Sensitivity to precipitation processes and the Coriolis force. J. Atmos. Sci. 51, 1341–1351. doi:10.1175/1520-0469(1994)051<1341:aniosl>2.0.co;2
Tao, W. K., and Simpson, J. (1989). Modeling study of a tropical squall-type convective line. J. Atmos. Sci. 46, 177–202. doi:10.1175/1520-0469(1989)046<0177:msoats>2.0.co;2
Tapiador, F. J., Sanchez, J. L., and García-Ortega, E. (2019). Empirical values and assumptions in the microphysics of numerical models. Atmos. Res. 215, 214–238. doi:10.1016/j.atmosres.2018.09.010
Tewari, M., Chen, F., Wang, W., Dudhia, J., Lemone, M. A., Mitchell, K. E., et al. (2004). “Implementation and verification of the unified NOAH land surface model in the WRF model,” in 20th conference on weather analysis and forecasting/16th conference on numerical weather prediction, 11–15.
Thompson, G., Field, P. R., Rasmussen, R. M., and Hall, W. D. (2008). Explicit forecasts of winter precipitation using an improved bulk microphysics scheme. Part II: Implementation of a new snow parameterization. Mon. Wea. Rev. 136, 5095–5115. doi:10.1175/2008mwr2387.1
Trier, S. B., Wilson, J. W., Ahijevych, D. A., and Sobash, R. A. (2017). Mesoscale vertical motions near nocturnal convection initiation in PECAN. Mon. Wea. Rev. 145 (8), 2919–2941. doi:10.1175/MWR-D-17-0005.1
Van Weverberg, K., Vogelmann, A. M., Lin, W., Luke, E. P., Cialella, A., Minnis, P., et al. (2013). The role of cloud microphysics parameterization in the simulation of mesoscale convective system clouds and precipitation in the tropical Western Pacific. J. Atmos. Sci. 70 (4), 1104–1128. doi:10.1175/jas-d-12-0104.1
Verrelle, A., Ricard, D., and Lac, C. (2015). Sensitivity of high-resolution idealized simulations of thunderstorms to horizontal resolution and turbulence parametrization. Quart. J. Roy. Meteor. Soc. 141 (687), 433–448. doi:10.1002/qj.2363
Wang, C., Wu, D., and Zhang, F. (2019). Modification of the convective adjustment time scale in the kain-fritsch eta scheme for the case of weakly forced deep convection over the Tibetan plateau region. Q. J. R. Meteorol. Soc. 145 (722), 1915–1932. doi:10.1002/qj.3535
Wedi, N. P., Polichtchouk, I., Dueben, P., Anantharaj, V. G., Bauer, P., Boussetta, S., et al. (2020). A baseline for global weather and climate simulations at 1 km resolution. J. Adv. Model. Earth Syst. 12 (11), e2020MS002192. doi:10.1029/2020MS002192
Weisman, M. L. (1993). The Genesis of severe long-lived bow echoes. J. Atmos. Sci. 50, 645–670. doi:10.1175/1520-0469(1993)050<0645:tgosll>2.0.co;2
Wu, D., Zhang, F., and Wang, C. (2018). Impacts of diabatic heating on the Genesis and development of an inner Tibetan Plateau vortex. J. Geophys. Res. Atmos. 123 (20), 11,691–11,704. doi:10.1029/2018jd029240
Xu, G., Fei, J., and Huang, X. (2017). Simulation experiments of cloud microphysical parameterization schemes on a squall line ant its Genesis analysis (in Chinese). J. Meteorol. Sci. 37 (3), 283–292.
Xue, L., Fan, J., Lebo, Z., Wu, W., Morrison, H., Grabowski, W. W., et al. (2017). Idealized simulations of a squall line from the MC3E field campaign applying three bin microphysics schemes: Dynamic and thermodynamic structure. Mon. Wea. Rev. 145, 4789–4812. doi:10.1175/mwr-d-16-0385.1
Yuter, S. E., and Houze, R. A. (1995). Three-dimensional kinematic and microphysical evolution of Florida cumulonimbus. Part II: Frequency distributions of vertical velocity, reflectivity, and differential reflectivity. Mon. Wea. Rev. 123 (7), 1941–1963. doi:10.1175/1520-0493(1995)123<1941:tdkame>2.0.co;2
Zhang, M., Meng, Z., Huang, Y., and Wang, D. (2019). The mechanism and predictability of an elevated convection initiation event in a weak-lifting environment in central-eastern China. Mon. Wea. Rev. 147 (5), 1823–1841. doi:10.1175/mwr-d-18-0400.1
Keywords: WRF, cloud microphysics parameters, diabatic heating and cooling, graupel particles, banded convection
Citation: Wu D, Ma L, Hu T and Zhang R (2023) Impacts of microphysical parameterizations on banded convective system in convection-permitting simulation: a case study. Front. Earth Sci. 11:1149518. doi: 10.3389/feart.2023.1149518
Received: 22 January 2023; Accepted: 03 April 2023;
Published: 20 April 2023.
Edited by:
Bo Huang, Norwegian University of Science and Technology, NorwayReviewed by:
Guanghui Yuan, Nanjing University of Information Science and Technology, ChinaRuijun Dang, Lanzhou University, China
Copyright © 2023 Wu, Ma, Hu and Zhang. This is an open-access article distributed under the terms of the Creative Commons Attribution License (CC BY). The use, distribution or reproduction in other forums is permitted, provided the original author(s) and the copyright owner(s) are credited and that the original publication in this journal is cited, in accordance with accepted academic practice. No use, distribution or reproduction is permitted which does not comply with these terms.
*Correspondence: Di Wu, ZF93dUBjYXVjLmVkdS5jbg==
†These authors have contributed equally to this work and share first authorship