 Guangyin Hu
 Jingjing Hu
 Linhai Yang
- School of Geography and Tourism, Shaanxi Normal University, Xi’an, China
The area of lakes in Tibetan Plateau (TP) is 36522 km2, accounting for nearly half (49.1%) of the total lake surface area in China, and the lakes in TP are seasonally ice-covered for 4–5 months per year. In such a high-cold Third Pole with extensive lakes, how does aeolian sediment transport on ice cover and to what extent can seasonal ice-covered lake cause sediment redistribution by providing pathways for sediment migration is rarely studied. The source region of Yellow River (SRYR) is located in the northeastern TP with an altitude above 4000 m, is home to large area of seasonal frozen lakes. Nine sections of aeolian sediments were collected from SRYR for grain-size study. The end-member modeling analysis (EMMA) provides a greater chance of resolving aeolian sediment sources since it can quantitatively separate the particle size components of various sedimentary dynamic processes and sources in the sediment. The result shows great spatial difference of the mean grain sizes (mainly varying between 70 and 230 μm). Parametric EMMA is applied to study the provenance tracing of aeolian sediment, combining with remote sensing images and wind data. Aeolian processes were analyzed by separating and extracting the grain size end-members of nine sections, and four statistical end-members (modal grain size is 8.9, 79.5, 141.6, and 251.8 μm, respectively) were classified from the grain size distribution. It shows that the sedimentary sequences in sections 7 and 8 have high EM2 and EM3 fractions and very low EM4 content at all depths. Based on comprehensive analysis of aeolian sediment grain-size, phenology of ice lake, wind regime and remote sensing images, it revealed that the fine aeolian sediments (sections 7 and 8) on the downwind shore of Ngoring Lake likely transported from the upwind shore, which were blown across the ice-covered lake surface by prevailing west wind in winter and spring, but the coarse sediments could be trapped by ice cracks. Therefore, it’s concluded that the aeolian sediment transport on seasonal ice-covered lakes may lead to the spatial heterogeneity of aeolian sediment grain-size in the SRYR.
1 Introduction
The Tibetan Plateau (TP) is referred to as the “Third Pole of the Earth” after the Arctic and Antarctic, due to its low temperature, geographical location, high elevation (with an average elevation of more than 4,000 m above sea level), and covering an area of ∼2.5 million km2 (Zhang et al., 2014). TP is home to 1,424 lakes with areas greater than 1 km2 in 2018, and the total area of lakes (>1 km2) is 5.0 × 10⁴ ± 791.4 km2 (Zhang et al., 2019a). However, aeolian processes in TP have been active in both geologic period and at present in the formation of dune fields and dust accumulation (Sun et al., 2007; Dietze et al., 2014; Hu et al., 2021; Yang et al., 2021; Yu L. et al., 2022), due to more than 60% of TP is arid or semiarid with less than 500 mm of annual precipitation (Dong et al., 2017). Aeolian activities in TP mainly occur in winter and spring when climate is cold, dry and windy (Hu et al., 2013; Dong et al., 2017). In the aeolian activity seasons, the duration of complete ice cover on lakes in TP is as long as 149 days (Kropáček et al., 2013). Although the temporal and spatial coupling between aeolian activity and lake freeze-up, the interaction of aeolian sediment and lake ice-cover is very rarely studied in TP.
In the aspect of lake sedimentary processes, the effects of frozen lake surfaces in TP had been reported in several studies (Dietze et al., 2012; Wang et al., 2015; Yan et al., 2018). However, the role of lake ice-cover in TP has been seriously ignored because the studies of aeolian activity in China mainly focus on its northern sand seas. The interplay between aeolian activity and ice cover are primarily observed and studied in Earth’s north and south poles, and even polar regions of Mars.
In Antartica, aeolian sediment accumulated on the surface of a permanent ice-covered lake (Lake Bonney) was observed in high-resolution satellite image, further study revealed that the sediments play a major role in controlling the ice cover (ice thickness ranges from 6 to 10 m) because they have a pronounced effect on the thinning of the lake ice due to the absorption of the solar energy (Obryk et al., 2014). Lake Hoare in the Dry Valleys of Antarctica, is a perennially ice-covered lake with ice cover more than 3 m thick. Rough topography on the lake ice-cover surface traps sand that is transported by the wind, and then the ice cover can control sedimentation to the lake bottom (Squyres et al., 1991). In Arctic, some lakes have substantial aeolian contributions to the lake ice cover. For example, in Crater Lake Pangnirtung Pass, N.W.T., Canada, aeolian transport and niveo-aeolian deposition on the surface of ice were also observed, which are mainly driven by strong wind in winter (Neuman, 1990). The aeolian sediment on ice likely have influenced the sedimentary record. Therefore, the sedimentary pellets in lacustrine sediment were taken as an ice-cover proxy in a High Arctic ice-covered lake (Tomkins et al., 2009). In Mars, the hypothesis of ice-covered lake during the Hesperian at Gale crater is a compelling way to explain the sedimentary characteristics by aeolian sand penetrates the ice cover (Kling et al., 2020). Besides, the seasonal ice caps of CO2 ice frequently interact with aeolian sediments in polar regions of Mars (Byrne, 2009).
The lakes in the Third Pole are seasonally ice-covered for 4–5 months per year (Kirillin et al., 2021), and the area of these lakes in TP (36,522 km2) accounting for nearly half (49.1%) of the total lake surface area in China (74,395 km2) (Zhang et al., 2019b). Aeolian sediments are widely distributed in lake shores in TP, and they are generally located in the downwind shores of lake basins, such as Qinghai Lake, Hala Lake, and Co. Nag Lake. In such a high-cold Third Pole with extensive lakes, how does aeolian sediment transport on ice cover? to what extent can seasonal ice-covered lake cause sediment redistribution by providing pathways for sediment migration? And will these aeolian processes lead ultimately to the spatial heterogeneity of aeolian sediment grain-size both in lake and its surrounding areas? All of the above aeolian processes in TP are poorly understood to date. In the headwater Region of Yellow River (HRYR), the two largest lakes with a total surface area of 1,171.4 km2. These vast seasonal ice-covered lakes are likely to affect the transport processes of aeolian sediments according to our field investigations and checking on remote sensing images. In this study, we assume that aeolian sediment transport on ice-covered lake contributes to the spatial heterogeneity of aeolian sediment grain-size in HRYR. Grain-size end-member modeling analysis (EMMA) combining with remote sensing images and wind data were used to test our assumption. This study would not only be helpful for aeolian desertification controls in TP, but also for understand the aeolian processes in cold environments on both Earth and Mars.
2 Study area
The HRYR is located in the northeastern Tibetan Plateau (Figure 1A). In this study, the catchment upstream of Duoshi Gorge is considered to be the extent of HRYR (Figure 1B). It is higher in the northwest and lower in the southeast, with an average elevation of 4,280 m. Mountains, hilly terraces, and highland flatlands make up the majority of the landscape. The land use type of HRYR is dominated by grassland, woodland and marshland, accounting for more than 80% of the total area of the study area (Ye et al., 2018). Climate at HRYR is semi-arid and alpine climate types, with typical inland plateau climate Characteristic. Influenced by the interaction of the Tibetan Plateau Monsoon (TPM), the Westerlies, and the East Asian Summer Monsoon (EASM), the climate here is complex and diverse, and it is vulnerable to global climate change. No distinct seasons exist as the mean annual air temperature is less than 4°C and precipitation amounts range from 300 to 400 mm (Yu C. et al., 2022). The temporal distribution of precipitation in the region is quite concentrated. More than 80% of the total annual precipitation falls from May to September (Hu et al., 2017).
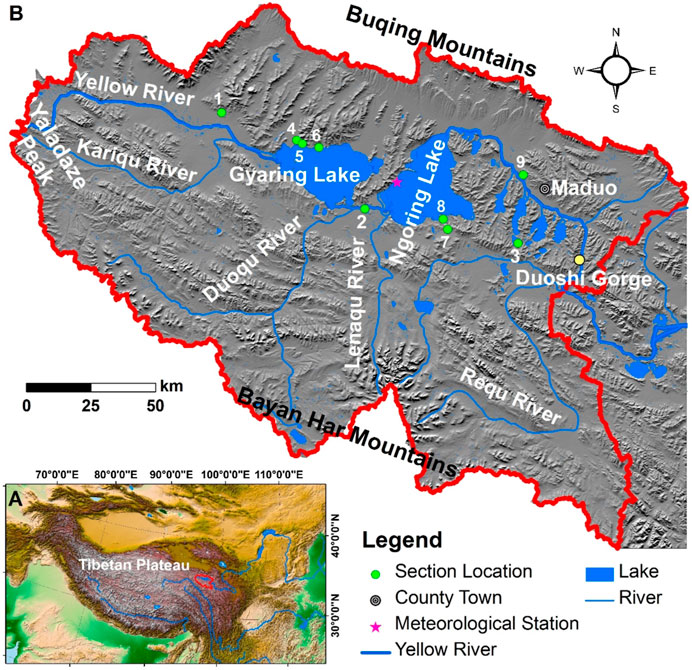
FIGURE 1. Location map of the study area. (A) Location of the Headwater Region of the Yellow River (HRYR) in the Tibetan Plateau; (B) Section locations in HRYR.
Several rivers and lakes are in HRYR with abundant water networks. Gyaring Lake and Ngoring Lake are crossed by the Yellow River at the source region, which are the two largest freshwater lakes in the upper reaches of the Yellow River. They are completely covered with ice from late November or early December to April (Wen et al., 2015; Wen et al., 2016). The surface area of large lakes in this region is about 1,350 km2 (Luo et al., 2020).
Aeolian sediments are widespread over the watershed, which mainly distribute in the broad valleys of the Yellow River and the flat lake shores. The eco-environmental problems have become prominent under the influence of both natural and human activities, such as the degradation of permafrost, the expansion of desertification and the intensification of soil erosion (Jin et al., 2009; Hu et al., 2013).
3 Data and methods
3.1 Sampling
Total of 168 samples from 9 sections collected from natural outcrops in HRYR, were used for grain-size measurement and end-member modeling analysis. Section 1 (35.10°N, 96.78°E) is located in mountain front to the west of Gyaring Lake. Section 2 (34.8°N, 97.43°E) is on the gentle slope of a hill between Gyaring Lake and Ngoring Lake. Section 3 (34.72°N, 98.10°E) and Section 9 (34.97°N, 98.11°E) are located to the north and south of the Four Sisters Lakes respectively. Section 4 (35. 03°N, 97.12°E), Section 5 (35.02°N, 97.15°E) and Section 6 (35.01°N, 97.22°E) are located to the northern shoreline of Gyaring Lake. Section 7 (34.76°N, 97.80°E) and Section 8 (34.79°N, 97.78°E) are located to the south shoreline of Ngoring Lake (Figure 1B).
All of the nine sections were dug on the basis of natural outcrops. Section 1, 2, 4, 5, 6 and 7 were dug in mountain front with gentle slope. Section 3 and 8 wind erosion residuals located on half-way up hills. Section 9 is located to the north of Yellow River. Among all the nine sections, only Section 3 exhibits distinguishable stratigraphic units with weak pedogenesis. The top soil of Section 3 has been eroded by wind, but the uppermost part (10–40 cm) of all other eight sections is composed of modern soil layer with dense plant roots.
3.2 Grain-size measurement and end-member model analysis (EMMA)
For the grain-size measurements, all the samples were measured by Malvern Mastersizer 2000 with a size range of 0.02–2000 μm. 10% HCl and 30% H2O2 were used in turn to remove carbonates and organic matter from samples, and then they were treated with 10 mL of 0.05 mol/L (NaPO3)6, shaken on an ultrasonic Vibrator for 10 min to disperse the particles. Each sample was measured twice. The results were classed according to the method mentioned by Wentworth (Wentworth, 1922).
Based on MATLAB, the AnalySize software package, design by Paterson, was used to build the non-parametric end-member modeling of the grain size distributions (Paterson and Heslop, 2015). It is calculated by performing end element separation on granularity data assuming the existence of 1–10 end elements. Three factors are typically essential for our consideration: the coefficient of determination (R2), angular deviation(θ), and the correlation between EMs (de Mahiques et al., 2021; Lai et al., 2021). The selection of the number of EMs is generally based on a relatively higher correlation (R2), a lower angle degree and fewer EMs (Paterson and Heslop, 2015). While meeting the above conditions, the number of end elements should be chosen as small as possible (Nottebaum et al., 2015; Eltijani et al., 2022).
3.3 Wind data
Data on wind direction collected by a Little Smart System at the west of Ngoring Lake (34°54′36″N, 97°34′12″E), is accessible on the National Cryosphere Desert Data Center (http://en.ncdc.ac.cn). The Routine meteorological observation dataset covers from 2013 to 2019, which observed by Kipp & Zonen CNR4, Vaisala HMP155A, PTB110 and other instruments with a temporal resolution of half an hour. It contains wind speed, wind direction, temperature, relative humidity, barometric pressure, shortwave radiation, and longwave radiation indicators. We selected the wind speed and direction data in 2016 for statistical analysis and wind rose plotting.
3.4 Remote sensing data
GF-6 is a low-orbit optical satellite put into service in 2018, equipped with both panchromatic/multi-spectral high-resolution (PMS) camera and wide field-of-view (WFV) camera. The GF-6 WFV images with 800 km observation width were used in this study, which are available from the China Centre for Resources Satellite Data and Application (https://www.cresda.com). Envi 5.3 was applied to pretreat the remote sensing image. At first, the remote sensing images were radiometrically calibrated and atmospherically corrected using the FLAASH model. And then, orthorectified the images using the image’s own RPC information and ground elevation data. At last, the images were clipped to obtain the whole study area.
4 Results
4.1 Grain size distribution
As it shows in Figure 2, the mean grain-size fluctuates with depth. The mean grain size and grain size composition of each section were obtained by averaging the values of samples in every section (Table 1). Figure 3 shows the representative grain size distribution frequency curves of the nine sections. The grain size frequency curves of aeolian sediment from Section 1–8 are typical single-peak distribution curves with unimodal, but that of Section 9 is bimodal. The mean grain size of the nine sections varies greatly, ranging from 199 to 82 μm. The mean grain size of Section 7, 8 and 9 are the smallest with an average value of 115, 82 and 89 μm, respectively (Table 1). The grain size compositions of the nine sections are dominated by fine sand, very fine sand and silt. However, the content of these compositions is highly varying among the Sections. For example, the content of fine sand fraction is up to 54% in Section 3, but with very low content of clay and silt fractions. The content of silt in Section 8 is up to 38%. In contrast, the content of coarse sand and clay in all of the sections is very low. In Section 7 and 8, the content of medium sand even as low as 2% and 1%, respectively (Table 1).
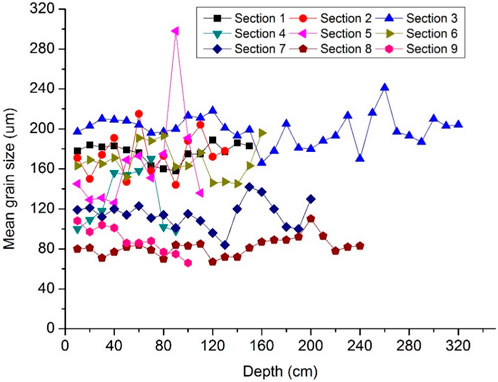
FIGURE 2. The mean grain size of sediments from the nine sections in HRYR.
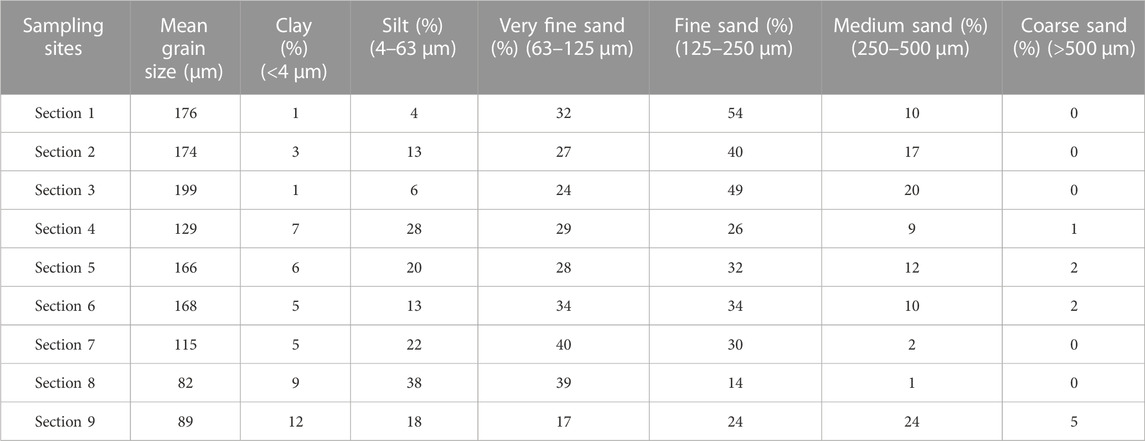
TABLE 1. Averaged mean grain size and components content of the samples in each section.
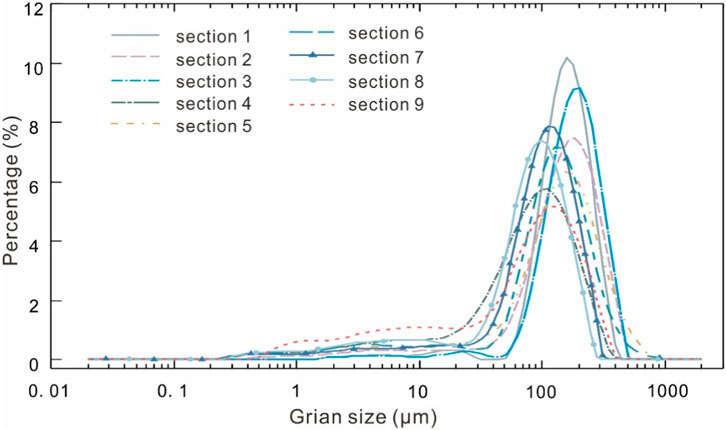
FIGURE 3. The representative grain size distribution frequency curves of the nine sections.
4.2 End-member compositions
To interpret the different transportation and deposition processes of the aeolian sediments, the end-member modeling analysis (EMMA) was used to identify different sediments sources and obtain quantitative information. With increases of the number of EMs, the goodness-of-fit statistics show an increasing fit to the raw grain-size distribution spectra (Figure 4A). Considering coefficient of determination (R2) and angular deviation as shown in Figures 4A, B, the fourth EM is a turning point in both the degree of the angle and the mean coefficient of determination.
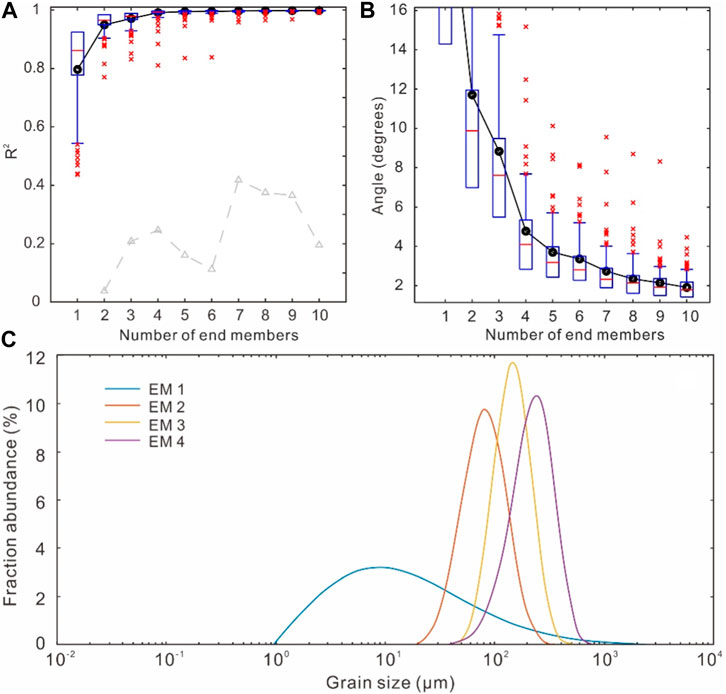
FIGURE 4. End-member modeling results of the aeolian sediments from the nine sections. (A) Coefficient of determination R2 as a function for choosing the number of end-members. (B) Angular differences between the reconstructed and observed data. (C) The four modelled end-members calculated from the total samples of grain-size measurements in the nine sections.
From the separation results of HRYR samples (Figures 4A, B), it is clear that the coefficient of determination (R2) reaches to 0.97 while the EM=3, but the angular deviation is 8.8°, which is higher than required (<5°). While EM=4, the coefficient of determination (R2) is 0.99, and there is no obvious increasing trend subsequently, the angular deviation(θ) is 4.8 when the EM=4, which meets the requirements of the selection. It follows that EM=4 was used in our study. The four end-members fit in minimum EMs with relatively high R2. Therefore, a four-EM model which explains 99.1% of the variance, was chose to depict the sediment source and their transportation processes in the HRYR. The end-member modal sizes are 8.9 μm (EM1), 79.5 μm (EM2), 141.6 μm (EM3) and 251.8 μm (EM4) (Figure 4C).
The contents of the four modeled end-members of the samples in the nine sections are shown in Figure 5, which clearly reveals that the contents of the EMs in the sections are highly varied. EM1 has a modal size of 8.9 μm with a majority in clay and silt, which shows higher content in Sections 4–9 and lower content in Sections 1–3. EM2 has a mode size of 79.5 μm with a majority in very fine sand, the content of which is very low in Section 1 and 3, but very high in Section 8 with an average content of 67%. EM3 has a mode size of 141.6 μm with a majority in fine sand, which shows the highest content in Section 1 with an average content of 50%. EM4 has a mode size of 251.8 μm with a majority in medium sand and the content of which is highest in Section 3 with an average content of 57%. However, the content of EM4 is very low in Section 7 and 8, and even there is no EM4 in most of the samples of Section 8 (Figure 5).
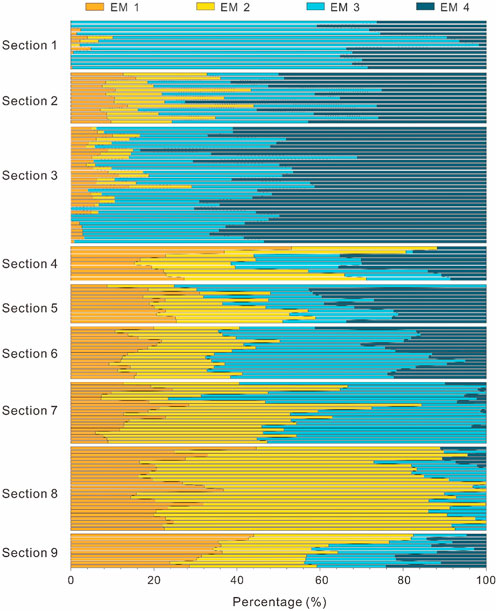
FIGURE 5. The percentage content of EMs in all of the sections. Samples from top to bottom corresponding to stratigraphic sequences in each section at an interval of 10 cm, and the sections are separated by white gaps.
5 Discussion
The grain-size results presented above revealed a very obvious spatial heterogeneity in the HRYR. In terms of mean grain-size, the sizes in section 7, 8 and 9 are much finer than the other’s (Figure 2; Table 1). Although the mean grain-size fluctuates with depth in all the sections (especially the sample at depth of 90 cm in Section 5 shows a sharp increase of up to 298 μm), the fluctuations are relatively limited except for that in section 4 and 5 (Figure 2). The spatial variations of mean grain-sizes (range from 82 to 199 μm) recorded in the section sites are much greater than that within every section (Table 1). Therefore, we will focus on the spatial differences of aeolian sediment grain-size in this study, rather than their temporal changes with the depths.
5.1 Spatial heterogeneity of aeolian sediment grain-sizes
It’s distinct that the aeolian sediment grain-sizes in sites of section 7, 8 and 9 are the smallest and the values of them are very close (with sizes of 115, 82 and 89 μm, respectively), which are much smaller than other sections (Figure 2; Table 1). In general, the spatial heterogeneity of aeolian sediment grain-size characteristics can be influenced by various factors, such as local topography, sediment transport distance, wind regime, potential provenances and the depositional environment (Sun et al., 2007; Dietze et al., 2014; Langford et al., 2016). Therefore, grain-size analysis has been widely applied to obtain sediment transport information at different spatial scales (Lancaster, 1986; Langford et al., 2016; Shen et al., 2020; Zhang X. et al., 2021). In the Kumtagh Sand Sea, northwestern China, grain-size variation was analyzed to distinguish the processes of sediment transport at a large-scale (Liang et al., 2020). In Zoige Basin, north eastern TP, the aeolian sediments experienced longer transportation distance are much finer than those with shorter ones (Hu et al., 2018). Then, what are the primary factors that control the spatial variations of grain-sizes in HRYR? To be specific, why the aeolian sediment grain-sizes in section 7, 8, and 9 are so small comparing with other sites?
Geomorphic factors can lead to the spatial heterogeneity of aeolian sediment grain-size to a certain degree, but in the grain-size dataset of this study, geomorphic factors are not so important when comparing with the distribution pattern of aeolian sediment and lakes. For example, the sections 1, 2, 4, 5, 6, and 7 were all dug in mountain front with gentle slope, but the grain-size of section 7 is much smaller than other sections. In addition to geomorphic factors, historical lake level fluctuation may change proximal material sources abruptly with climatic change. According to our previous chronology study (Hu et al., 2017) and unpublished dating ages, it’s found that the aeolian sediments were mainly deposited in the late Holocene. Except for a sample from the bottom of Section 5 was 7.12 ± 0.39 ka, the ages of all other sections correspond to the late Holocene (the earliest aeolian deposition is at 3.29 ± 0.42 ka). The shoreline-based lake-levels study in Qinghai Lake revealed that the lake experienced several transgressive/regressive cycles in the late Holocene (Huang et al., 2021). In closed-basin lakes, lake level fluctuations are predominantly affected by climatic factors. However, the highstands are mainly limited by spillway elevation in open lakes. Ngoring Lake has been externally drained at least since the early Holocene (Huang et al., 2022), as a result, its lake level fluctuations in the late Holocene would be unsensitive to climate changes and difficult to compare with the internally drained lakes in TP.
5.2 Lake ice phenology and its influence on aeolian sediments
The temporal coupling between aeolian activity and lake freeze-up in TP can well explain the interaction of aeolian sediment and lake ice-cover. Seasonal freeze-thaw cycles and ice-covered waterbodies (e.g., lake and river) play important role in material migration and energy exchange in HRYR (Kirillin et al., 2021; Yu C. et al., 2022). Ngoring Lake is ice-covered from late November or early December to late April with a maximum ice thickness over 0.8 m (Luo et al., 2020; Wang et al., 2022). From the middle of January to early March, the ice thickness of the lake is over 0.6 m (Wang et al., 2022). The freezing onset in the Gyaring Lake occurs in the end of October, which is slightly earlier than that in Ngoring Lake. However, the freeze-up of the two lakes is almost the same, because the lake ice phenology of the two lakes is influenced by both climatic and local factors. Contemporary annual ice cover duration in Gyaring Lake and Ngoring Lake is as long as 183 days (Luo et al., 2020). Such a long ice cover duration may contribute to aeolian sediment redistribution and finally result to heterogeneity of sediment grain-size in lake surrounding areas. In the lake Donggi Cona in the northeastern TP, the particles trapped in lake ice cracks proved that wind can transport them on lake ice-cover and the little sandy material can be blown to distal locations (Dietze et al., 2014). In HRYR, aeolian sediments on lake ice-cover are distinctive as it’s shown in Figure 6.
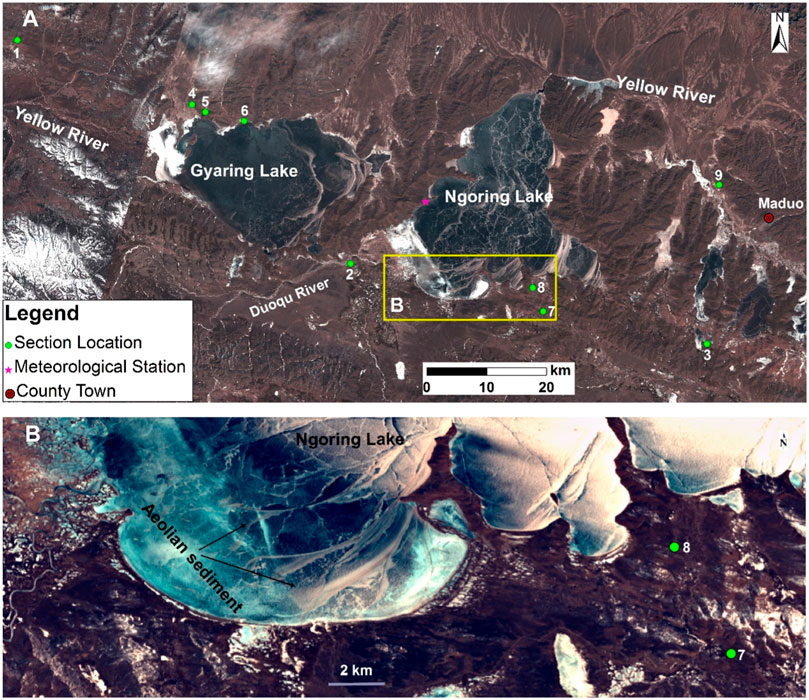
FIGURE 6. Aeolian sediment on lake ice cover recorded in remote sensing images in HRYR. (A) Landsat 8 Optical Land Imager (OLI) image of HRYR recorded on 08 February 2021 when lakes are completely ice-covered. (B) GaoFen1 (GF1) satellite image recorded on 24 February 2022 shows dusty ice cover in southern Ngoring Lake.
Aeolian sediments transport on lake ice-cover was also observed in other regions. In McMurdo dry valleys, Antarctica, it’s found that the flux of aeolian sediment on ice-covered lakes are dominated by the transport of silt and clay-sized sediments, and the dust flux are generally lower than in other desert (Lancaster, 2002). It’s also point out that only little sandy materials can be transported to the more distal sites because coarse particles are more likely to be trapped on lake ice (Nedell et al., 1987). In northeastern TP, aeolian sediment trapped in ice cracks and a brownish stained ice surface were observed in both Donggi Cona and Kuhai Lake (Dietze et al., 2014). The trapping of coarse particles (transported usually by very strong wind) on lake ice was due to less thermal capacity of the particles than that of ice. The particles heat up and melt lake ice beneath them in sunny day, then were trapped by refreezing of surrounding melted water in night or/and cold days (Qiang et al., 2007). Therefore, it’s reasonable to deduce that the aeoline sediment (transporting trough lake ice-cover surface) deposits in downwind lake shores has finer grain-sizes [e.g., the sites of section 7 and 8 (Figure 1B)]., because sand blowing wind in winter and spring are mainly from west (Dietze et al., 2014; Dong et al., 2017).
Unmixing of grain-size distributions to obtain quantitative signals from a set of grain-sizes is an effective method comparing with classical methods (Dietze et al., 2012; Paterson and Heslop, 2015). As shown in Figures 4C, 5, the robust EM1 with a dominant mode size of 8.9 μm, which is likely represent the continuous background dust input with a long-distance transport. This is supported by the dust sediment study in Donggi Cuona Lake that is very closely located to the northeast of Ngoring Lake (about 70 km) (Dietze et al., 2012). The dominant modal grain size of 108 μm from lake sediments in China was suggested as the indicator of regional dust activity (Zhang B. et al., 2021). EM2 is dominant composition in Section 8 with mode-size of 79.5 μm, and the averaged percentage content of which is up to 67%, followed by 38% in Section 7 (Figure 5). The niveo-aeolian sediment samples collected on lake ice-cover in Selin Co., central TP measured a mode-size about 70 μm (Wang et al., 2019), which is very close to the size of EM2 (79.5 μm) in this study. If the aeolian sediment grain-size on the ice of Ngoring Lake is similar with that on Selin Co. lake-ice, it may imply that EM2 in Section 7 and 8 shares the same source with the sediment on ice of Ngoring Lake. Therefore, the fluvial sediment on Duoqu River delta to the southwest of Ngoring Lake is likely the source region when take wind regime into consideration (Figure 6). The low content of EM3 and nearly scarcity of EM4 in Section 8 (Figure 5) can be explained by ice trapping because coarser particles are more likely to be trapped by ice as discussed above.
5.3 Wind regime and aeolian sediment transportation on lake ice-cover
In order to determine wind regime and aeolian sediment transport characteristics, hourly recorded wind data from a meteorological station on the western shore of Ngoring Lake was analyzed. The annual and seasonal wind roses shown in Figure 7 were made based on the data to represent the wind regime of the HRYR. Mean wind speed in this region is 4.1 m/s, which is much larger than that in Badain Jaran Desert (3.3/s) (Zhang et al., 2015a) and Tengger Desert (2.6 m/s) (Zhang et al., 2015b) in northern China, but a little smaller than the weed speed in Qaidam Basin (4.5 m/s) (Zhang et al., 2018). In HRYR, the annual frequency of sand-driving winds (winds above the threshold of 6.0 m/s) accounting for 25.3%, and the seasonal frequency of sand-driving winds is the highest in winter (Figure 7B).
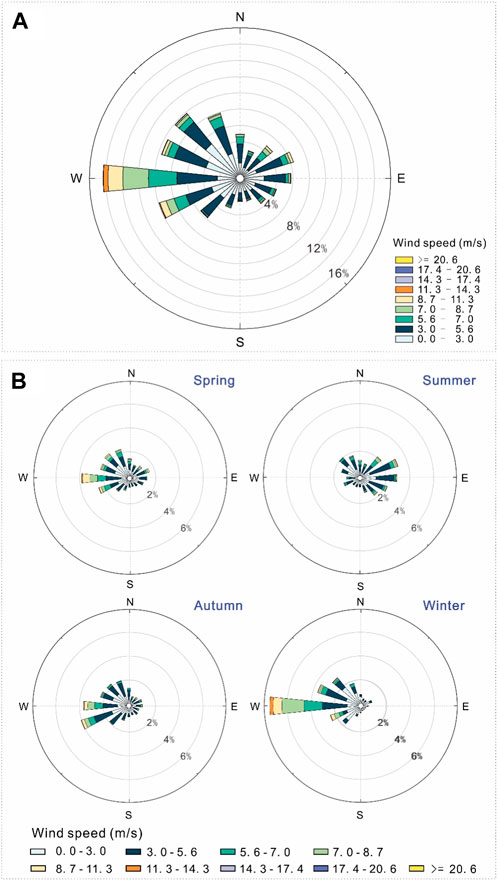
FIGURE 7. Wind roses showing the directional and frequency variability of all wind speeds for the year 2016. (A) Annual wind rose in 2016. (B) Seasonal wind roses in 2016.
As mentioned above, lakes in HRYR are ice-covered from early December to late April, which temporally couples very well with wind regime for high frequent sand-driving winds blow from west in winter and spring (Figure 7B). In winter, sand-driving winds mainly blow from W, accounting for 63.3% of the total sand-driving winds in this season, which is followed by the winds from SWW (15.7%) and NWW (10.3%). In spring, the most prevailing sand-driving wind directions are W and SWW, accounting for 32.9% and 22.6%, respectively. The high frequency of western sand-driving winds is in accordance with the prevailing westerly wind regime.
Based on field investigation and checking of remote sensing images in HRYR, it’s deduced that the prevailing sand-driving winds blow from west can transport sediment materials through the lake ice cover and deposit on downwind lake shores and even farther downwind regions (e.g., Section 7 and 8 to the south of Ngoring Lake). By checking remote sensing images, it is found that aeolian sediment transport on ice-covered lakes occurs frequently in winter and spring, because quite a lot of aeolian sediments on ice are distinguishable (Figure 6B). As for the source of the aeolian sediments on ice, most of them are blown from western shores due to the high frequency of sand-driving winds blowing from west (Figure 7). Duoqu River delta on the western shore of Ngoring Lake is the main source region for the sediments on ice cover and sites of Section 7 and 8, which is supported by both wind regime and transport pathways of the sediments (Figures 6, 7). Our field investigation in northeastern TP in March 2023 strongly proves our viewpoint. In the field investigation, it’s found that a lot of aeolian sediments were trapped in ice cracks on ice-covered Gahai Lake (Figure 8). This finding well explains why the sediment in Section 7 and 8 is finer than others, because the coarse sediments could be trapped by ice cracks. Combing with the dense ice cracks in Figure 6B, it’s likely that a lot of coarse sediments were trapped along the cracks, leading to the lack of coarse sand in Section 8. Similarly, in the west of Section 9 is seasonally ice-covered Yellow River (Figure 6A), we assume that coarse particles blown from west also could be trapped by river ice. However, as water level in the river channel usually fluctuates greatly with the seasons, a certain content of EM4 (with an averaged content of 13%) probably represents short-distance transported particles from western river beds.
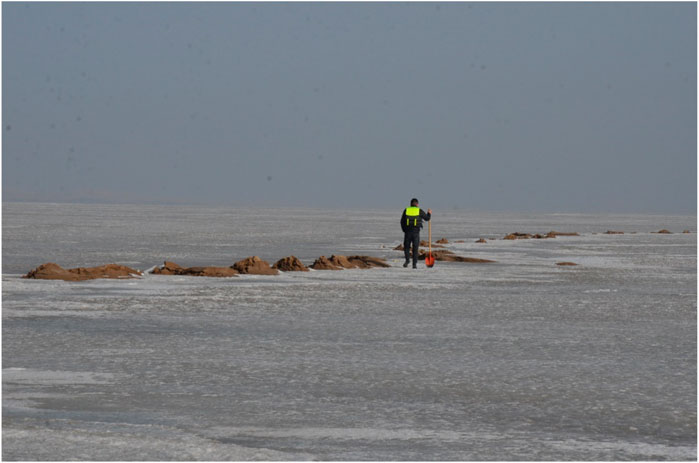
FIGURE.8. Aeolian sediment trapped by ice cracks on ice-covered Gahai Lake in TP, and the picture was taken in March 2023 by Guangyin Hu.
6 Conclusion
Based on comprehensive analysis of aeolian sediment grain-size, phenology of ice lake, wind regime and remote sensing images in the HRYR, it can be concluded that:
(1) The spatial heterogeneity of aeolian sediment grain-size in the source region is very obvious. The mean grain size of the sections varies greatly from 199 to 82 μm. The mean grain size of Section 7, 8, and 9 (located in the downwind of frozen waterbodies) are the smallest with an average value of 115, 82 and 89 μm, respectively.
(2) Strong sand blowing wind can transport sediment through ice-covered lake and deposit on the downwind shores. Due to the temporal coupling between aeolian activity and lake freeze-up in TP, the seasonal ice-covered waterbodies play important role in material migrations.
(3) The coarse particles can hardly transport through large ice-covered lakes due to ice trapping effect. The coarse particles are more likely to heat up and melt lake ice beneath them in sunny day, and then be trapped by refreezing of surrounding melted water.
(4) Aeolian desertification controls on the downwind shores of lakes in TP should pay special attention to aeolian sediment source regions, because long-distance aeolian sediment transporting on seasonal lake ice-cover may occur in some areas.
Data availability statement
The raw data supporting the conclusion of this article will be made available by the authors, without undue reservation.
Author contributions
GH: designed the study and wrote this manuscript. JH: processed the primary data and drawing figures. ZD: managed the study overall and guided the field work. LY: sample collecting and many constructive comments and suggestions.
Funding
We are grateful for the financial support provided by the National Natural Science Foundation of China (Grant No. 42071004 and 42241110) and the Second Tibetan Plateau Scientific Expedition and Research Program (STEP) (Grant No. 2019QZKK0403).
Acknowledgments
We also would like to thank National Cryosphere Desert Data Center for providing wind data, and the China Centre for Resources Satellite Data and Application for providing remote sensing images.
Conflict of interest
The authors declare that the research was conducted in the absence of any commercial or financial relationships that could be construed as a potential conflict of interest.
Publisher’s note
All claims expressed in this article are solely those of the authors and do not necessarily represent those of their affiliated organizations, or those of the publisher, the editors and the reviewers. Any product that may be evaluated in this article, or claim that may be made by its manufacturer, is not guaranteed or endorsed by the publisher.
References
de Mahiques, M. M., y Goya, S. C., Matos, M. C. d. S. N. d., Oliveira, R. A. U. d., Kim, B. S. M., Ferreira, P. A. d. L., et al. (2021). Grain-size end-members and environmentally sensitive grain-size components: A comparative study in the mud shelf depocenters off southern Brazil. Int. J. Sediment Res. 36 (2), 317–327. doi:10.1016/j.ijsrc.2020.07.004
Dietze, E., Hartmann, K., Diekmann, B., Ijmker, J., Lehmkuhl, F., Opitz, S., et al. (2012). An end-member algorithm for deciphering modern detrital processes from lake sediments of Lake Donggi Cona, NE Tibetan Plateau, China. Sediment. Geol. 243-244, 169–180. doi:10.1016/j.sedgeo.2011.09.014
Dietze, E., Maussion, F., Ahlborn, M., Diekmann, B., Hartmann, K., Henkel, K., et al. (2014). Sediment transport processes across the Tibetan Plateau inferred from robust grain-size end members in lake sediments. Clim. Past. 10 (1), 91–106. doi:10.5194/cp-10-91-2014
Dong, Z., Hu, G., Qian, G., Lu, J., Zhang, Z., Luo, W., et al. (2017). High-altitude aeolian research on the Tibetan plateau. Rev. Geophys. 55 (4), 864–901. doi:10.1002/2017rg000585
Eltijani, A., Molnár, D., Makó, L., Geiger, J., and Sümegi, P. (2022). Application of parameterized grain-size endmember modeling in the study of quaternary oxbow lake sedimentation: A case study of tövises bed sediments in the eastern great Hungarian plain. Quaternary 5, 44. doi:10.3390/quat5040044
Hu, G., Jin, H., Dong, Z., Lu, J., and Yan, C. (2013). Driving forces of aeolian desertification in the source region of the Yellow River: 1975–2005. Environ. Earth Sci. 70 (7), 3245–3254. doi:10.1007/s12665-013-2389-9
Hu, G., Yu, L., Dong, Z., Jin, H., Luo, D., Wang, Y., et al. (2017). Holocene aeolian activity in the headwater region of the Yellow River, northeast tibet plateau, China: A first approach by using OSL-dating. CATENA 149, 150–157. doi:10.1016/j.catena.2016.09.014
Hu, G., Yu, L., Dong, Z., Lu, J., Li, J., Wang, Y., et al. (2018). Holocene aeolian activity in the Zoige Basin, northeastern Tibetan plateau, China. CATENA 160, 321–328. doi:10.1016/j.catena.2017.10.005
Hu, G., Dong, Z., Zhang, Z., Yang, L., Hao, L., Hesp, P., et al. (2021). Wind regime and aeolian landforms on the eastern shore of Qinghai Lake, Northeastern Tibetan Plateau, China. J. Arid Environ. 188, 104451. doi:10.1016/j.jaridenv.2021.104451
Huang, C., Lai, Z., Liu, X., and Madsen, D. (2021). Lake-level history of Qinghai Lake on the NE Tibetan Plateau and its implications for Asian monsoon pattern - a review. Quat. Sci. Rev. 273, 107258. doi:10.1016/j.quascirev.2021.107258
Huang, X., Lai, Z., Xu, L., Luo, L., Zhong, J., Xie, J., et al. (2022). Late Pleistocene lake overspill and drainage reversal in the source area of the Yellow River in the Tibetan Plateau. Earth Planet. Sci. Lett. 589, 117554. doi:10.1016/j.epsl.2022.117554
Jin, H., He, R., Cheng, G., Wu, Q., Wang, S., Lü, L., et al. (2009). Changes in frozen ground in the source area of the Yellow River on the qinghai–tibet plateau, China, and their eco-environmental impacts. Environ. Res. Lett. 4 (4), 045206. doi:10.1088/1748-9326/4/4/045206
Kirillin, G. B., Shatwell, T., and Wen, L. (2021). Ice-covered lakes of Tibetan plateau as solar heat collectors. Geophys. Res. Lett. 48 (14), e2021GL093429. doi:10.1029/2021gl093429
Kling, A. M., Haberle, R. M., McKay, C. P., Bristow, T. F., and Rivera-Hernández, F. (2020). Subsistence of ice-covered lakes during the hesperian at Gale crater, Mars. Icarus 338, 113495. doi:10.1016/j.icarus.2019.113495
Kropáček, J., Maussion, F., Chen, F., Hoerz, S., and Hochschild, V. (2013). Analysis of ice phenology of lakes on the Tibetan Plateau from MODIS data. Cryosphere 7 (1), 287–301. doi:10.5194/tc-7-287-2013
Lai, H., Zhang, J., Li, Y., and Zhou, L. (2021). Origin and provenance of Red Clay in north Hunan Province, China: Inferred from grain-size analysis and end-member modelling. Aeolian Res. 51, 100714. doi:10.1016/j.aeolia.2021.100714
Lancaster, N. (1986). Grain-size characteristics of linear dunes in the southwestern Kalahari. J. Sediment. Res. 56 (3), 395–400.
Lancaster, N. (2002). Flux of eolian sediment in the McMurdo dry valleys, Antarctica: A preliminary assessment. Arct. Antarct. Alp. Res. 34 (3), 318–323. doi:10.1080/15230430.2002.12003500
Langford, R. P., Gill, T. E., and Jones, S. B. (2016). Transport and mixing of eolian sand from local sources resulting in variations in grain size in a gypsum dune field, White Sands, New Mexico, USA. Sediment. Geol. 333, 184–197. doi:10.1016/j.sedgeo.2015.12.010
Liang, A., Dong, Z., Qu, J., Su, Z., Wu, B., Zhang, Z., et al. (2020). Using spatial variations of grain size to reveal sediment transport in the Kumtagh Sand Sea, Northwest China. Aeolian Res. 46, 100599. doi:10.1016/j.aeolia.2020.100599
Luo, D., Jin, H., Du, H., Li, C., Ma, Q., Duan, S., et al. (2020). Variation of alpine lakes from 1986 to 2019 in the headwater area of the Yellow River, Tibetan plateau using google earth engine. Adv. Clim. Change Res. 11 (1), 11–21. doi:10.1016/j.accre.2020.05.007
Nedell, S. S., Andersen, D. W., Squyres, S. W., and Love, F. G. (1987). Sedimentation in ice-covered lake hoare, Antarctica. Sedimentology 34 (6), 1093–1106. doi:10.1111/j.1365-3091.1987.tb00594.x
Neuman, C. M. (1990). Observations of winter aeolian transport and niveo-aeolian deposition at crater lake, pangnirtung pass, N.W.T., Canada. Permafr. Periglac. Process. 1 (3-4), 235–247. doi:10.1002/ppp.3430010304
Nottebaum, V., Stauch, G., Hartmann, K., Zhang, J., and Lehmkuhl, F. (2015). Unmixed loess grain size populations along the northern Qilian Shan (China): Relationships between geomorphologic, sedimentologic and climatic controls. Quat. Int. 372, 151–166. doi:10.1016/j.quaint.2014.12.071
Obryk, M. K., Doran, P. T., and Priscu, J. C. (2014). The permanent ice cover of Lake Bonney, Antarctica: The influence of thickness and sediment distribution on photosynthetically available radiation and chlorophyll-a distribution in the underlying water column. J. Geophys. Res. Biogeosci. 119 (9), 1879–1891. doi:10.1002/2014jg002672
Paterson, G. A., and Heslop, D. (2015). New methods for unmixing sediment grain size data. Geochem. Geophys. Geosyst. 16 (12), 4494–4506. doi:10.1002/2015gc006070
Qiang, M., Chen, F., Zhang, J., Zu, R., Jin, M., Zhou, A., et al. (2007). Grain size in sediments from lake sugan: A possible linkage to dust storm events at the northern margin of the Qinghai–Tibetan plateau. Environ. Geol. 51 (7), 1229–1238. doi:10.1007/s00254-006-0416-9
Shen, Y., Zhang, C., Wang, R., Wang, X., Cen, S., and Li, Q. (2020). Spatial heterogeneity of surface sediment grain size and aeolian activity in the gobi desert region of northwest China. CATENA 188, 104469. doi:10.1016/j.catena.2020.104469
Squyres, S. W., Andersen, D. W., Nedell, S. S., and Wharton, R. A. (1991). Lake hoare, Antarctica: Sedimentation through a thick perennial ice cover. Sedimentology 38 (2), 363–379. doi:10.1111/j.1365-3091.1991.tb01265.x
Sun, J., Li, S.-H., Muhs, D. R., and Li, B. (2007). Loess sedimentation in tibet: Provenance, processes, and link with quaternary glaciations. Quat. Sci. Rev. 26 (17), 2265–2280. doi:10.1016/j.quascirev.2007.05.003
Tomkins, J. D., Lamoureux, S. F., Antoniades, D., and Vincent, W. F. (2009). Sedimentary pellets as an ice-cover proxy in a High Arctic ice-covered lake. J. Paleolimnol. 41 (1), 225–242. doi:10.1007/s10933-008-9255-x
Wang, R., Zhang, Y., Wünnemann, B., Biskaborn, B. K., Yin, H., Xia, F., et al. (2015). Linkages between Quaternary climate change and sedimentary processes in Hala Lake, northern Tibetan Plateau, China. J. Asian Earth Sci. 107, 140–150. doi:10.1016/j.jseaes.2015.04.008
Wang, C., Wang, H., Song, G., and Zheng, M. (2019). Grain size of surface sediments in Selin Co (central Tibet) linked to water depth and offshore distance. J. Paleolimnol. 61 (2), 217–229. doi:10.1007/s10933-018-0054-8
Wang, M., Wen, L., Li, Z., Leppäranta, M., Stepanenko, V., Zhao, Y., et al. (2022). Mechanisms and effects of under-ice warming water in Ngoring Lake of qinghai–tibet plateau. Cryosphere 16 (9), 3635–3648. doi:10.5194/tc-16-3635-2022
Wen, L., Lv, S., Li, Z., Zhao, L., and Nagabhatla, N. (2015). Impacts of the two biggest lakes on local temperature and precipitation in the Yellow River source region of the Tibetan plateau. Adv. Meteorol. 2015, 248031–248110. doi:10.1155/2015/248031
Wen, L., Lyu, S., Kirillin, G., Li, Z., and Zhao, L. (2016). Air–lake boundary layer and performance of a simple lake parameterization scheme over the Tibetan highlands. Tellus A Dyn. Meteorol. Oceanogr. 68 (1), 31091. doi:10.3402/tellusa.v68.31091
Wentworth, C. K. (1922). A scale of grade and class terms for clastic sediments. J. Geol. 30, 377–392. doi:10.1086/622910
Yan, D., Wünnemann, B., Zhang, Y., Long, H., Stauch, G., Sun, Q., et al. (2018). Response of lake-catchment processes to Holocene climate variability: Evidences from the NE Tibetan Plateau. Quat. Sci. Rev. 201, 261–279. doi:10.1016/j.quascirev.2018.10.017
Yang, S., Luo, Y., Li, Q., Liu, W., Chen, Z., Liu, L., et al. (2021). Comparisons of topsoil geochemical elements from Northwest China and eastern Tibetan Plateau identify the plateau interior as Tibetan dust source. Sci. Total Environ. 798, 149240. doi:10.1016/j.scitotenv.2021.149240
Ye, H., Zhang, T., Guihua, Y., Li, J., Bie, X., Liu, D., et al. (2018). Spatio-temporal characteristics of evapotranspiration and its relationship with climate factors in the source region of the Yellow River from 2000 to 2014. Acta Geogr. Sin. 73 (11), 2117–2134.
Yu, C., Hua, K., Huang, C.-S., Jin, H., Sun, Y., and Yu, Z. (2022). Spatiotemporal characteristics of arsenic and lead with seasonal freeze-thaw cycles in the source area of the Yellow River Tibet Plateau, China. J. Hydrol. Reg. Stud. 44, 101210. doi:10.1016/j.ejrh.2022.101210
Yu, L., Sun, Y., An, P., Greenbaum, N., and Roskin, J. (2022). Dunefield expansion and paleoclimate during MIS 3 in the Qaidam Basin, northeastern Tibetan plateau: Evidence from aeolian-fluvial processes and revised luminescence chronologies. CATENA 215, 106354. doi:10.1016/j.catena.2022.106354
Zhang, Y., Li, B., and Zheng, D. (2014). Datasets of the boundary and area of the Tibetan Plateau. Acta Geogr. Sin. 69, 164–168.
Zhang, Z., Dong, Z., and Li, C. (2015a). Wind regime and sand transport in China’s Badain Jaran Desert. Aeolian Res. 17, 1–13. doi:10.1016/j.aeolia.2015.01.004
Zhang, Z., Dong, Z., Wen, Q., and Jiang, C. (2015b). Wind regimes and aeolian geomorphology in the Western and southwestern Tengger Desert, NW China. Geol. J. 50 (6), 707–719. doi:10.1002/gj.2586
Zhang, Z., Dong, Z., Qian, G., Li, J., and Luo, W. (2018). Formation and development of dunes in the northern qarhan desert, central Qaidam Basin, China. Geol. J. 53 (3), 1123–1134. doi:10.1002/gj.2947
Zhang, G., Luo, W., Chen, W., and Zheng, G. (2019a). A robust but variable lake expansion on the Tibetan Plateau. Sci. Bull. 64 (18), 1306–1309. doi:10.1016/j.scib.2019.07.018
Zhang, G., Yao, T., Chen, W., Zheng, G., Shum, C. K., Yang, K., et al. (2019b). Regional differences of lake evolution across China during 1960s–2015 and its natural and anthropogenic causes. Remote Sens. Environ. 221, 386–404. doi:10.1016/j.rse.2018.11.038
Zhang, B., Liu, X., and Li, J. (2021). The aeolian component inferred from lake sediments in China. Aeolian Res. 50, 100700. doi:10.1016/j.aeolia.2021.100700
Zhang, X., Zhang, H., Chang, F., Xie, P., Li, H., Wu, H., et al. (2021). Long-range transport of aeolian deposits during the last 32 kyr inferred from rare Earth elements and grain-size analysis of sediments from Lake Lugu, Southwestern China. Palaeogeogr. Palaeoclimatol. Palaeoecol. 567, 110248. doi:10.1016/j.palaeo.2021.110248
Keywords: aeolian sediment, grain size, ice-covered lake, spatial heterogeneity, source region of the Yellow River, Tibetan Plateau, Spatial Heterogeneity
Citation: Hu G, Hu J, Dong Z and Yang L (2023) Seasonal ice-covered lake surface likely caused the spatial heterogeneity of aeolian sediment grain-size in the source region of Yellow River, northeastern Tibetan Plateau, China. Front. Earth Sci. 11:1150585. doi: 10.3389/feart.2023.1150585
Received: 24 January 2023; Accepted: 24 April 2023;
Published: 09 May 2023.
Edited by:
Lupeng Yu, Linyi University, ChinaReviewed by:
Zhiyong Ding, Chengdu University of Technology, ChinaZhiyong Ling, Chinese Academy of Sciences (CAS), China
Copyright © 2023 Hu, Hu, Dong and Yang. This is an open-access article distributed under the terms of the Creative Commons Attribution License (CC BY). The use, distribution or reproduction in other forums is permitted, provided the original author(s) and the copyright owner(s) are credited and that the original publication in this journal is cited, in accordance with accepted academic practice. No use, distribution or reproduction is permitted which does not comply with these terms.
*Correspondence: Guangyin Hu, Z3Vhbmd5aW5odUBzbm51LmVkdS5jbiYjeDAyMDBhOw==