 Chunlei Meng
 Haidong Jin2
- 1Institute of Urban Meteorology, China Meteorological Administration, Beijing, China
- 2Tianjin Meteorological Service, China
Soil moisture is an important parameter in numerical weather forecasting and climate projection studies, and it is extremely important for arid and semiarid areas. Different from those in relatively wet areas, for arid and semiarid areas, mechanisms associated with the transportation, condensation, and evaporation of water vapor in soil interior cannot be neglected. In this paper, schemes associated with soil evaporation and coupled transport of soil moisture and heat were developed for the integrated urban land model (IUM) to improve the simulation of soil moisture in arid and semiarid areas. The whole layer soil evaporation (WSE) scheme was developed to improve the simulation of soil evaporation. The soil’s inner layer water vapor transport is considered a part of WSE. The transport of water and heat in the inner soil was linked to the phase change of water. The NASA Soil Moisture Active Passive (SMAP) mission Level-4 Soil Moisture product and 10-cm volumetric soil moisture observations in 358 autonomic soil moisture observation sites were used for validating the simulation results. The results indicate that after using the WSE scheme and considering the coupled transport of moisture and heat in the soil interior, the simulation of soil moisture was improved definitely. For June, July, and August, the biases of soil moisture simulation decreased by approximately 22.5, 34.4, and 27.5%, respectively, while the RMSEs decrease by approximately 7.0, 8.7, and 9.6%, respectively. The improvement of soil moisture simulation indicates that in arid and semiarid areas soil water vapor transport is important and cannot be neglected.
1 Introduction
Soil moisture is a key parameter in land surface modeling. It is an important parameter in numerical weather forecasting and climate projection studies and extremely important in agriculture and hydrology fields in arid and semiarid areas (Koster et al., 2004; Santanello JR. et al., 2019; Kumar et al., 2020; Humphrey et al., 2021). Different from those in relatively wet areas, for arid and semiarid areas, mechanisms associated with the transport, condensation, and evaporation of water vapor in the soil interior cannot be neglected. Compared to soil temperature, soil moisture states have a memory operating at subseasonal time scales (Koster et al., 2011; Seo et al., 2019; Seo et al., 2020), and it is more important in climate projection studies. As multiple factors can influence the simulation result of soil moisture, such as topography, evaporation, and infiltration, it is harder to simulate accurately.
Soil evaporation is one of the most important parameters in land surface modeling (Wang and Dickinson, 2012) because it links the energy balance and water balance of the land surface. Plenty of parameterization schemes were developed to parameterize soil evaporation (Godfrey and Stensrud, 2010; Jung et al., 2010; Lawrence et al., 2011; Mueller et al., 2011; Tang and Riley, 2013), but only a few of them considered soil inner layer evaporation. In the semiarid and arid regions, as volumetric soil moisture is relatively low, water vapor transport cannot be neglected. Soil inner evaporation is important and encompasses a considerable proportion of total soil evaporation.
For land surface models, soil moisture and heat transport are almost always considered separately. The simultaneous existence of water potential and temperature gravity can induce energy and moisture transport at the same time. The study of soil evaporation and coupled transport of soil moisture and heat (Wang and Yang, 2018) is important in land surface and climate modeling, especially for arid and semiarid areas.
In this article, schemes associated with soil evaporation and coupled transport of soil moisture and heat are developed for the integrated urban land model (IUM) (Meng, 2015) to improve the simulation of soil moisture in arid and semiarid areas. The whole layer soil evaporation (WSE) scheme was developed to improve the simulation of soil evaporation. The soil's inner layer water vapor transport is considered a part of soil evaporation. The transport of water and heat in the inner soil was linked to the phase change of water. The findings of this article are important for agricultural and climate change studies in arid and semiarid areas.
2 Data and method
2.1 Study area
Northwestern China and its surrounding areas are examined in this study. The study area is located at 35–50°N, 72–112°E (Figure 1A). The land cover data are based on the United States Geological Survey (USGS) land cover dataset (Figure 1B). Arid and semiarid regions are predominant in the study area. Temperate continental climate occupies most regions of the study area. The temperature is extremely high in summer and extremely low in winter. Precipitation in the whole year is very low, and the annual precipitation in most of the regions is lower than 200 mm. Soil moisture observations at a depth of 10 cm in 358 autonomic soil moisture observation sites are chosen to validate the soil moisture simulation (Figure 1A).
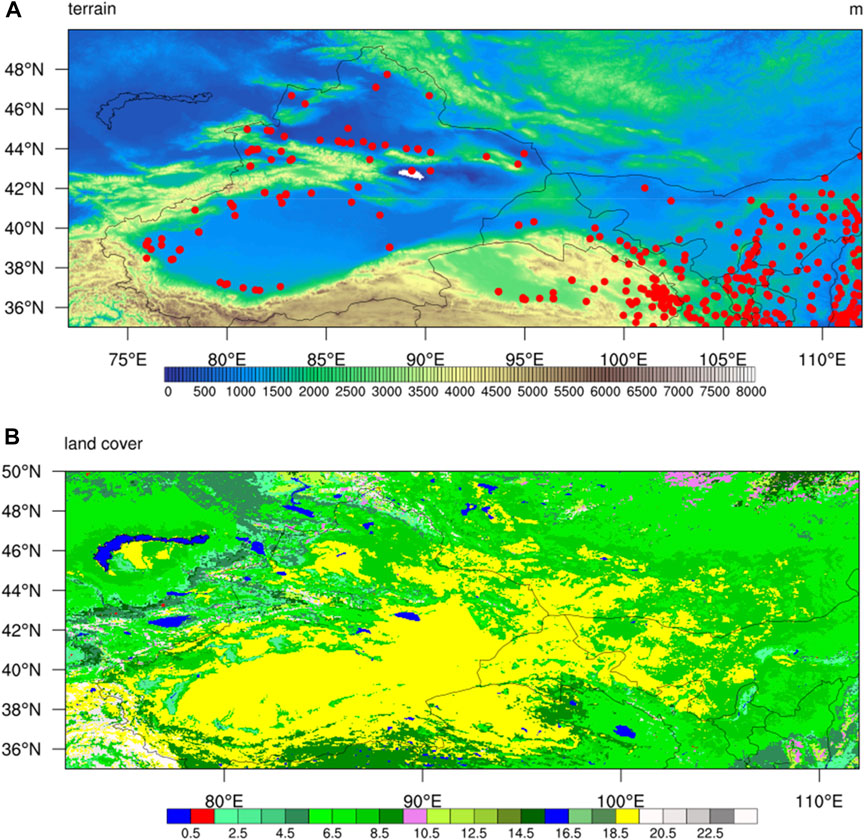
FIGURE 1. (A) Shaded relief elevation above sea level (m) and the locations of 358 soil moisture sites (red dots); (B) land cover based on USGS categories. (1. urban and built-up land. 2. Dryland cropland and pasture. 3. Irrigated cropland and pasture. 4. Mixed dryland/irrigated cropland and pasture. 5. Cropland/grassland mosaic. 6. Cropland/woodland mosaic. 7. Grassland. 8. Shrubland. 9. Mixed shrubland/grassland. 10. Savanna. 11. Deciduous broadleaf forest. 12. Deciduous needleleaf forest. 13. Evergreen broadleaf forest. 14. Evergreen needleleaf forest. 15. Mixed forest. 16. Water bodies. 17. Herbaceous wetland. 18. Wooded wetland. 19. Barren or sparsely vegetated. 20. Herbaceous tundra. 21. Wooded tundra. 22. Mixed tundra. 23. Bare-ground tundra. 24. Snow or ice).
2.2 Data
The NASA Soil Moisture Active Passive (SMAP) mission Level-4 (L4) Soil Moisture product (Reichle et al., 2019) provides global, 3-hourly, 9-km resolution estimates of surface (0–5 cm) and root zone (0–100 cm) soil moisture with a mean latency of −2.5 days. The SMAP soil moisture product has been widely used in soil moisture monitoring and assimilation and validated using in situ observations (Reichle et al., 2017; Chen et al., 2019; Colloander et al., 2020; Zheng et al., 2022).
The SMAP 10-cm volumetric soil moisture data and 10-cm autonomic soil moisture observation data from 358 sites in the research region are used for validation. Three months from June to August 2017 are used to perform the simulation results before and after considering the WSE scheme and coupled transport of soil moisture and heat. The spatial and temporal resolutions of SMAP soil moisture data are 9 km and 3 h, respectively. They were interpolated to 0.05 and 1 month by using a bilinear spatial interpolation method and arithmetic mean method, respectively (Figure 2). The temporal resolution of soil moisture observation data is 1 h, and it was aggregated and averaged to 1 month by using an arithmetic mean method. The observation data are downloaded from the National Meteorological Information Center of China at data.cma.cn. The soil moisture data were observed using an autonomic tensiometer. The temporal resolution of the observed soil moisture data is 1 hour.
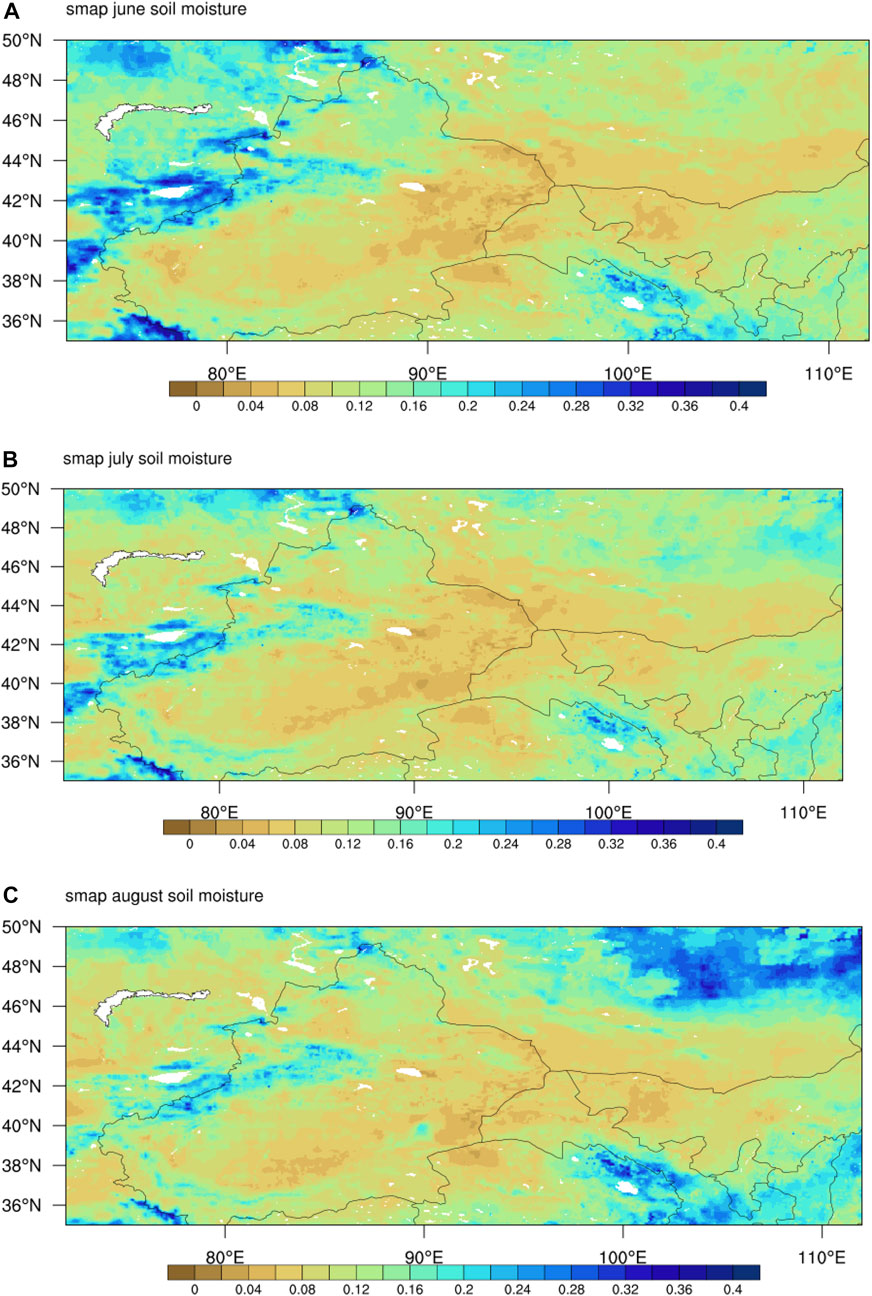
FIGURE 2. Monthly average 10-cm-deep volumetric soil moisture by SMAP L4. (A) June; (B) July; (C) August.
The atmospheric forcing data used to drive the IUM are from the Global Land Data Assimilation System (GLDAS) (Rodell et al., 2004). The atmospheric forcing data include downward shortwave radiation, downward longwave radiation, near-surface air temperature, near-surface air humidity, near-surface wind speed, near-surface wind direction, near-surface air pressure, and precipitation. The spatial and temporal resolutions of GLDAS data are 0.25° and 3 h, respectively. The GLDAS data were interpolated spatially and temporally to 0.05° and 1 h by using a bilinear and cubic spline interpolation method, respectively.
2.3 Method
2.3.1 Whole layer soil evaporation (WSE)
The IUM was used to perform the validation and comparison of the soil moisture simulation results. The IUM was developed based on the common land model (CoLM) (Dai et al., 2003). As an integrated land model, the IUM integrates the urban land model with the common land model. For the natural land surface, the IUM was developed based on the CoLM. For the urban land surface, the energy and water balance models were modified. Urban land surface parameters, such as anthropogenic heat (AH), albedo, surface roughness length, and imperious surface evaporation, were also reparametrized. A mosaic scheme was applied in order to maximize the use of the high-resolution land use and land cover (LULC) data. Soil evaporation in the IUM is calculated as follows:
where
In Equation 1, only soil surface layer evaporation is considered. Water vapor is transferred within the whole soil layer. Water vapor transfer cannot be neglected, especially in arid and semiarid regions. Considering the water vapor transfer within the soil, the WSE can be written as follows:
where
where
where a is the air content in soil and
where
2.3.2 Coupled transport of soil moisture and heat
In the IUM, soil heat and moisture transport are considered to be independent processes. Soil moisture transport is parameterized based on Darcy’s law.
where
Without considering the effect of root water uptake, the continuity equation for soil water is as follows:
From Eqs 6, 7, the soil water transport equation is as follows:
where
Soil heat transport is parameterized based on the heat conduction law and energy conservation equation. The heat conduction law for soil is as follows:
where
where
For arid and semiarid regions, as the volumetric soil moisture is relatively low, water vapor transport cannot be neglected. Since water vapor evaporation (condensation) can absorb (release) heat, soil moisture and heat transport can be coupled with water vapor transport. Water vapor flux is associated with the gradient of soil water potential and soil temperature, and can be calculated as follows:
where
where
After considering soil water vapor transport, for soil heat transport, in addition to soil heat conduction, the soil inner layer latent heat transport should be considered. The soil heat flux is as follows:
where
2.4 Experimental design
Two sets of experiments are designed to perform the simulation. Set 1 is the control run, and the WSE scheme and coupled transport schemes are not used; set 2 is the contrast run, and the WSE scheme and coupled transport schemes are used. The simulation time period is from June to August in 2017.
3 Results and discussion
Figure 3 shows the scatter plot of the monthly average 10-cm-deep volumetric soil moisture from SMAP and IUM simulations in the control run and contrast run. For all the 3 months, the biases and root mean square errors (RMSEs) of the contrast run are all smaller than those of the control run. The biases decreased by approximately 22.5, 34.4, and 27.5%, respectively, while the RMSEs decreased by approximately 7.0, 8.7, and 9.6%, respectively. The comparison results indicate the WSE and coupled transport of moisture and heat schemes can definitely improve the simulation of soil moisture, especially in arid and semiarid regions. From Figure 3, both sets of simulations underestimate the amount of 10-cm-deep volumetric soil moisture. As a whole, for the contrast run, the amount of 10 cm volumetric soil moisture increased. The reasons why the 10-cm-deep volumetric soil moisture increased for the contrast run compared with the control run are relatively complex. Generally, for most of the areas in the research region, the inner layer soil evaporation was negative. As a result, for the contrast run, after using WSE, soil evaporation decreased. As less water evaporates for the soil surface, the volumetric soil moisture increases.
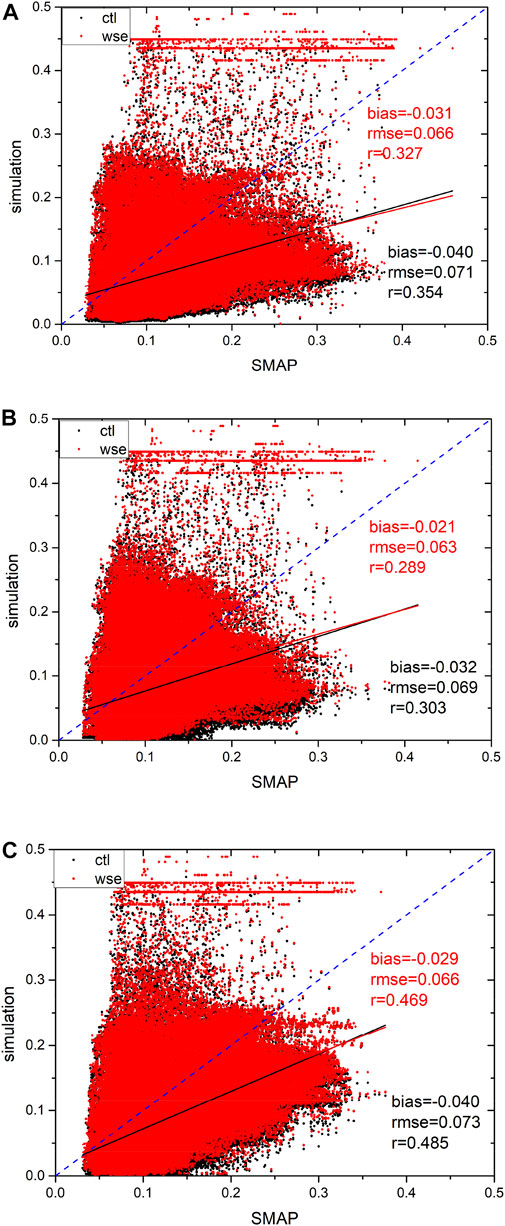
FIGURE 3. Scattered plots of the monthly average 10-cm-deep volumetric soil moisture from SMAP and IUM simulation. (ctl: control run; WSE: contrast run): (A) June, (B) July, (C) August.
After comparing the simulation results of relative and absolute soil evaporation differences between the control and contrast run with the SMAP 10-cm-deep volumetric soil moisture (Figure 4), it is concluded that the simulation differences of soil evaporation are relatively large when the volumetric soil moisture is relatively low. This also means WSE and the coupled transport of moisture and heat scheme can improve the simulation, especially when the soil is relatively dry. In arid and semiarid areas, soil water vapor transport is relatively important and cannot be neglected.
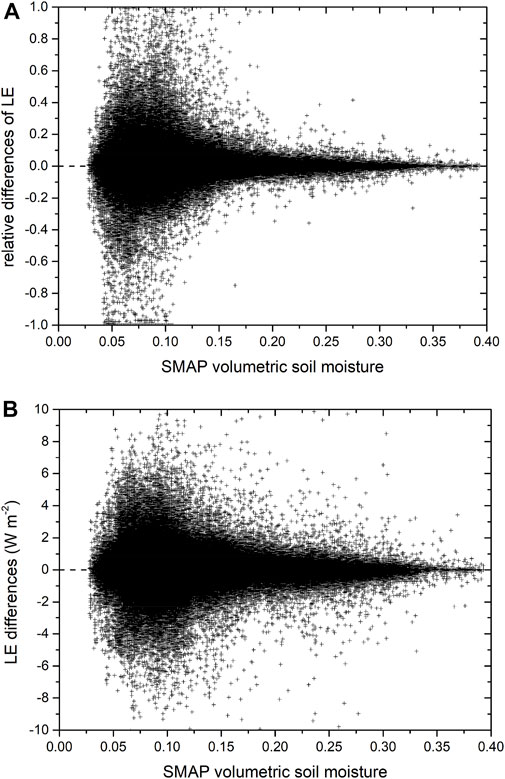
FIGURE 4. Scattered plots of the time series resulting in relative (A) and absolute (B) ET differences between the two simulation results and the SMAP volumetric soil moisture.
Volumetric soil moisture observations at 10 cm depth in 358 autonomic soil moisture observation sites were chosen to validate the soil moisture simulation for the control and contrast run during the summer of 2017 (Figure 5). The bias and RMSE of the contrast run are all smaller than those of the control run. The bias decreased by approximately 2.9%, while the RMSE decreased by approximately 0.12%. However, both the correlation coefficients between the two simulations and the observation were relatively small. Using station observations to validate the grid simulation is still a big challenge. The simulation results reflect a spatially averaged value for the simulation grid and that the land cover was usually heterogeneous, while the station observation reflects the value at a designated site and that the land cover was usually homogeneous. Here are some possible methods to address this challenge in future studies. First, the land cover of the underlying surface of the stations should be ascertained. Second, single-point validation should be used to compare the simulation result with the in situ observation.
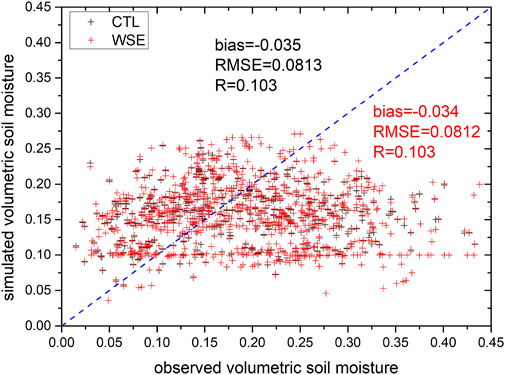
FIGURE 5. Scattered plot of the monthly average 10-cm-deep volumetric soil moisture from autonomic soil moisture observation sites and IUM simulations.
4 Summary
In this article, schemes associated with soil evaporation and coupled transport of soil moisture and heat are developed for the IUM to improve the simulation of soil moisture in arid and semiarid areas.
The results indicate that after using the WSE scheme and considering the coupled transport of moisture and heat in the soil interior, the simulation of soil moisture was definitely improved. The WSE and the coupled transport of moisture and heat scheme can improve the simulation, especially when the soil is relatively dry. In arid and semiarid areas, soil water vapor transport is relatively important and cannot be neglected.
In the near future, single-point validation will be implemented to validate the simulation results of the control and contrast run with in situ observations. As soil moisture is important, especially in arid and semiarid areas, the findings of this article are important for agricultural and climate change studies in arid and semiarid areas.
Data availability statement
The raw data supporting the conclusion of this article will be made available by the authors, without undue reservation.
Author contributions
All authors listed have made a substantial, direct, and intellectual contribution to the work and approved it for publication.
Funding
This work was supported by the National Natural Science Foundation of China under Grant no. 42130108 and the Typhoon Foundation of Shanghai Typhoon Institute, CMA under Grant no. TFJJ202106.
Acknowledgments
The authors would like to thank the United States Geological Survey (USGS) for LULC data (https://www.usgs.gov/programs/gap-analysis-project/science/land-cover-data-download), National Aeronautics and Space Administration (NASA) for GLDAS data (https://hydro1.gesdisc.eosdis.nasa.gov/data/GLDAS/GLDAS_NOAH025_3H.2.1/) and SMAP data (https://gmao.gsfc.nasa.gov/GMAO_products/SMAP_L4/), and the National Meteorological Information Center for autonomic soil moisture observation data (data.cma.cn).
Conflict of interest
The authors declare that the research was conducted in the absence of any commercial or financial relationships that could be construed as a potential conflict of interest.
The reviewer JL declared a shared affiliation with the author to the handling editor at the time of review.
Publisher’s note
All claims expressed in this article are solely those of the authors and do not necessarily represent those of their affiliated organizations, or those of the publisher, the editors, and the reviewers. Any product that may be evaluated in this article, or claim that may be made by its manufacturer, is not guaranteed or endorsed by the publisher.
References
Chen, F., Crow, W. T., Cosh, M. H., Collianer, A., Asanuma, J., Aaron, B., et al. (2019). Uncertainty of reference pixel soil moisture averages sampled at SMAP core validation sites. J. Hydrometeorol. 20, 1553–1569. doi:10.1175/jhm-d-19-0049.1
Colliander, A., Jackson, T., J., Berg, A., Bosch, D. D., Caldwell, T., Chan, S., et al. (2020). Effect of rainfall events on SMAP radiometer-based soil moisture accuracy using core validation sites. J. Hydrometeorol. 21, 255–264. doi:10.1175/jhm-d-19-0122.1
Dai, Y., Zeng, X. B. Z., Dickinson, R. E., Baker, I., Bonan, G. B., Bosilovich, M. G., et al. (2003). The common land model. Bull. Amer. Meteor. Soc. 84, 1013–1023.
Godfrey, C. M., and Stensrud, D. J. (2010). An empirical latent heat flux parameterization for the noah land surface model. J. Appl. Meteor. Climatol. 49, 1696–1713. doi:10.1175/2010jamc2180.1
Humphrey, V., Berg, A., Ciais, P., Gentine, P., Jung, M., Reichstein, M., et al. (2021). Soil moisture-atmosphere feedback dominates land carbon uptake variability. Nature 592, 65–69. doi:10.1038/s41586-021-03325-5
Jung, M., Reichstein, M., Ciais, P., Seneviratne, S. I., Sheffield, J., Goulden, M. L., et al. (2010). Recent decline in the global land evapotranspiration trend due to limited moisture supplydecline in the global land evapotranspiration trend due to limited moisture supply. Nature 467 (7318), 951–954. doi:10.1038/nature093962010: Recent
Koster, R. D., Dirmeyer, P. A., Guo, Z., Bonan, G., Chan, E., Cox, P., et al. (2004). Regions of strong coupling between soil moisture and precipitation. Science 305, 1138–1140. doi:10.1126/science.1100217
Koster, R., Mahanama, S., Yamada, T., Balsamo, G., Berg, A., Boisserie, M., et al. (2011). The second phase of the global land–atmosphere coupling experiment: Soil moisture contributions to subseasonal forecast skill. J. Hydrometeorol. 12, 805–822. doi:10.1175/2011jhm1365.1
Kumar, S., Newman, M., Lawrence, D. M., Lo, M.-H., Akula, S., Lan, C.-W., et al. (2020). The GLACE-hydrology experiment: Effects of land-atmosphere coupling on soil moisture variability and predictability. J. Clim. 33, 6511–6529. doi:10.1175/jcli-d-19-0598.1
Lawrence, D. M., Oleson, K. W., Flanner, M. G., Thornton, P. E., Swenson, S. C., Lawrence, P. J., et al. (2011). Parameterization improvements and functional and structural advances in version 4 of the community land model. J. Adv. Model. Earth Syst. 3, 2011MS000045. doi:10.1029/2011ms00045
Meng, C. L. (2015). The integrated urban land model. J. Adv. Model. Earth Syst. 7, 759–773. doi:10.1002/2015ms000450
Mueller, B., Seneviratne, S. I., Jimenez, C., Corti, T., Hirschi, M., Balsamo, G., et al. (2011). Evaluation of global observations-based evapotranspiration datasets and IPCC AR4 simulations. Geophys. Res. Lett. 38, L06402. doi:10.1029/2010GL046230
Reichle, R. H., De Lannoy, G. J. M., Liu, Q., Ardizzone, J. V., Colliander, A., Conaty, A., et al. (2017). Assessment of the SMAP level-4 surface and root-zone soil moisture product using in situ measurements. J. Hydrometeorol. 18, 2621–2645. doi:10.1175/jhm-d-17-0063.1
Reichle, R. H., Liu, Q., Koster, R. D., Crow, W. T., De Lannoy, G. J. M., Kimball, J. S., et al. (2019). Version 4 of the SMAP level-4 soil moisture algorithm and data product. J. Adv. Model. Earth Syst. 11, 3106–3130. doi:10.1029/2019ms001729
Rodell, M., Houser, P. R., Jambor, U., Gottschalck, J., Mitchell, K., Meng, C. J., et al. (2004). The global land data assimilation system. Bull. Amer. Meteor. Soc. 85, 381–394. doi:10.1175/bams-85-3-381
Seo, E., Lee, M.-I., Schubert, S. D., Koster, R. D., and Kang, H.-S. (2020). Investigation of the 2016 Eurasia heat wave as an event of the recent warming. Environ. Res. Lett. 15, 114018. doi:10.1088/1748-9326/abbbae
Santanello, J. A., Lawston, P., Kumar, S., and Dennis, E. (2019). Understanding the impacts of soil moisture initial conditions on NWP in the context of land-atmosphere coupling. J. Hydrometeorol. 20, 793–819. doi:10.1175/jhm-d-18-0186.1
Seo, E., Lee, M. I., Jeong, J. H., Koster, R. D., Schubert, S. D., Kim, H. M., et al. (2019). Impact of soil moisture initialization on boreal summer subseasonal forecasts: Mid-latitude surface air temperature and heat wave events. Clim. Dyn. 52, 1695–1709. doi:10.1007/s00382-018-4221-4
Tang, J., and Riley, W. J. (2013). Impacts of a new bare-soil evaporation formulation on site, regional, and global surface energy and water budgets in CLM4. J. Adv. Model. Earth Syst. 5, 558–571. doi:10.1002/jame.20034
Wang, C., and Yang, K. (2018). A new scheme for considering soil water-heat transport coupling based on community land model: Model description and preliminary validation. J. Adv. Model. Earth Syst. 10, 927–950. doi:10.1002/2017ms001148
Wang, K., and Dickinson, R. E. (2012). A review of global terrestrial evapotranspiration: Observation, modeling, climatology and climatic variability. Rev. Geophys. 50, RG2005. doi:10.1029/2011rg000373
Keywords: whole layer soil evaporation, soil moisture, coupled transport of soil moisture and heat, SMAP, IUM
Citation: Meng C, Jin H and Jin B (2023) Parameterization of soil evaporation and coupled transport of moisture and heat for arid and semiarid regions. Front. Earth Sci. 11:1151405. doi: 10.3389/feart.2023.1151405
Received: 26 January 2023; Accepted: 27 February 2023;
Published: 13 March 2023.
Edited by:
Kai Yang, Lanzhou University, ChinaReviewed by:
Jianduo Li, China Meteorological Administration, ChinaMeixian Liu, SYSU, China
Linlin Lu, Aerospace Information Research Institute, Chinese Academy of Sciences (CAS), China
Copyright © 2023 Meng, Jin and Jin. This is an open-access article distributed under the terms of the Creative Commons Attribution License (CC BY). The use, distribution or reproduction in other forums is permitted, provided the original author(s) and the copyright owner(s) are credited and that the original publication in this journal is cited, in accordance with accepted academic practice. No use, distribution or reproduction is permitted which does not comply with these terms.
*Correspondence: Chunlei Meng, Y2xtZW5nQGl1bS5jbg==