 Wenfa Shan
 Xiancheng Mao2,3*
 Zhankun Liu
- 1Computational Geosciences Research Centre, Central South University, Changsha, China
- 2MOE Key Laboratory of Metallogenic Prediction of Nonferrous Metals and Geological Environment Monitoring, School of Geosciences and Info-Physics, Central South University, Changsha, China
- 3Hunan Key Laboratory of Nonferrous Resources and Geological Hazards Detection, Changsha, China
- 4Zhaojin Mining Industry Co., Ltd., Yantai, China
The Sanshandao-Haiyu gold belt, Jiaodong Peninsula, Eastern China accounts for more than 1,400 t gold resources, which is always recognized as a coupled result of structural deformation, pore-fluid flow, and hydrothermal alteration-mineralization processes. However, the ore-forming processes associated with this gold belt has not been fully understood by the coupled perspective. In this paper, we use computational modeling to study the spatial distribution of dilation (positive volumetric strain) and the mineralization rate, which can predict the mineralization patterns from a chemical perspective, so as to solve the fully coupled problem during ore-forming processes. The model was loaded on the FLAC3D platform to test four scenarios: 1) Syn-compression in the NW-SE direction; 2) syn-compression in the WNW-ESE direction; 3) syn-compression in the NNW-SSE direction, and 4) syn-extension in the NW-SE direction. The simulation results show that only the syn-compressional scenario can produce wide dilation zones with a distribution pattern similar to the known orebodies. The higher dilation zones with the volumetric strain (>0.1%) and the highest pore-fluid flux are closely associated with the fault geometry, particularly for the gentle segments near the steep-flat transition areas. Besides, the dilation zones also occur with very high absolute values of pore-fluid pressure gradient and temperature gradient, indicating significantly perturbed physical-chemical conditions. The receiver operating characteristic (ROC) curves of the mineralization rate show that the area under the curve (AUC = 0.862) of the NW-SE syn-compression model is the highest among these four scenarios, indicating a major paleo compression stress direction of NW-SE during ore-forming period. Furthermore, based on the mineralization rate, we estimated that the mineralization duration of the Sanshandao-Haiyu gold belt would be less than 100,000 years. These simulation results can not only enhance our understanding of the ore-forming processes in the Sanshandao-Haiyu gold belt and Jiaodong Peninsula but also demonstrate that these can be used directly or indirectly for deep mineral exploration.
Introduction
The Jiaodong Peninsula in the eastern North China Craton (NCC; Figure 1A) hosts more than 5,000 t gold resources and has been documented as the third largest gold province in the world (Song et al., 2015; Groves et al., 2018; Deng et al., 2020; Liu et al., 2021a). The formation of the deposits happens at a time of 120 ± 5 Ma in a craton reworking setting and is linked to structural-magmatic-hydrothermal processes that involve moderate temperature gold-bearing fluids ascending, pooling, and reacting with wall rocks (Fan et al., 2003; Song et al., 2015; Zhang et al., 2020; Liu et al., 2021b). Fracture zones due to structural activities are critical to the gold mineralizing processes by increasing permeability and pore-fluid conduits that focus pore-fluids into favorable sites, facilitating the fluid-wall rock interaction for gold deposition at Jiaodong (Chen et al., 2004; Song et al., 2012; Mao et al., 2019; Wang et al., 2019; Liu et al., 2021c).
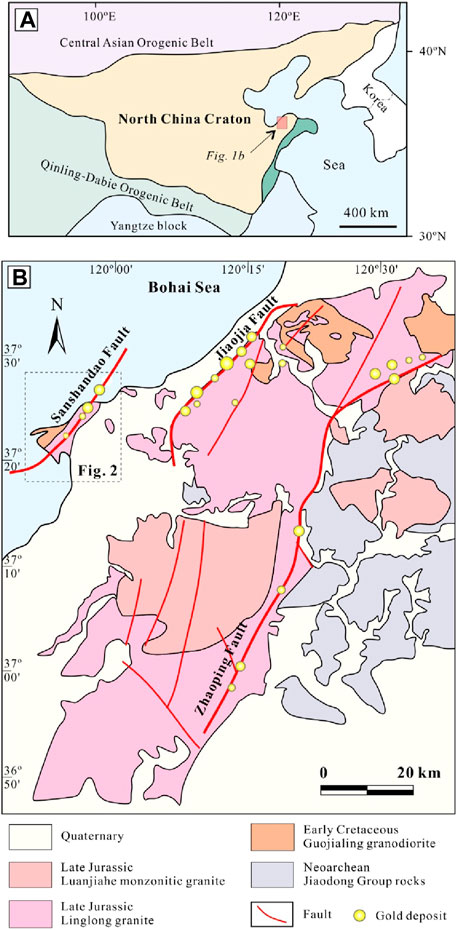
FIGURE 1. Geological map of the North China (A) and the Northwestern Jiaodong Peninsula (B), showing the formation, intrusions, and locations of gold deposits (Modified from Yang et al., 2016b; Mao et al., 2019).
Numerous studies have been carried out to understand the formation of gold deposits in the Jiaodong Peninsula. These studies have demonstrated that: 1) Regional ore-controlling faults during the main mineralization period provide channels, migration dynamics, and precipitation sites for fluid flow (Song et al., 2015; Yang et al., 2016a; Deng et al., 2019; Mao et al., 2019; Mao et al., 2020; Zhang et al., 2020; Liu et al., 2021d); 2) the fertile mineralization occurs in the gentle segment where the fault also changes from steep to flat (Goldfarb and Santosh, 2014; Song et al., 2015); 3) water-rock reactions associated with gold mineralization is caused by coupling different chemical composition and thermodynamic features of the pore-fluid (Wen et al., 2016; Xu et al., 2016). However, the ore-forming processes of gold deposits in the Jiaodong Peninsula has not been fully investigated from the perspective of the coupled processes involved in rock deformation, pore-fluid flow, heat transfer, mass transport, and chemical reactions.
As a direct consequence of establishing emerging computational geosciences, extensive studies have demonstrated that hydrothermal gold mineralization of structurally-controlled mineral systems is a result of coupled physical and chemical processes (Phillips, 1991; Zhao et al., 2009; Zhao et al., 2010; Zhao et al., 2015; Nield and Bejan, 2013; Hu et al., 2020). In terms of the physical process aspect, the pore-pressure gradient induced by non-uniform distributions of structural stress can drive the advective pore-fluid flow, which carries metals from the high-energy place to the low-energy place. Typically, a large volume of ore-forming fluids flow into depositional sites such as dilation sites, or damaged areas, which are caused by inelastic deformation linked to structural formation. The dilation process related to fault rupture increases permeability and pore-fluid flux, and the related dilation sites have been considered the key control of the location of mineralization areas (Cox, 2004; Micklethwaite et al., 2004; Cox, 2005; Micklethwaite et al., 2006; Zhang et al., 2008; Zhang et al., 2011; Cox, 2010; Cox, 2016; Li et al., 2017a; Li et al., 2017b; Mazzarini et al., 2019; Liu et al., 2021d). In terms of the chemical process aspect, chemical dissolution-front instability (Zhao, 2009; Zhao, 2014; Zhao, 2015; Ladd et al., 2020; Ladd and Szymczak, 2021), which can change the mechanical property of wall rock associated with the evolution of porosity due to fluid-rock interactions (Lin et al., 2019; Zhao et al., 2021; Zhao et al., 2022a; Zhao et al., 2022b; Prakash et al., 2022), can further affect the permeability and location of the ore-forming fluid distribution. In order to solve the problem of mineral precipitation and/or dissolution during fluid flow transporting aqueous metal species in the ore-forming system, the mineralization rate concept and modern mineralization theory (Zhao et al., 2002; Zhao et al., 2008b) have been proposed. The modern mineralization theory of a mineral, which is interpreted as the change in mineral weight per unit volume rock per unit time in ore-forming systems, makes use of the pore-fluid velocity, temperature, pore-fluid pressure, and relevant chemical species to calculate the dissolution/precipitation of the mineral (Zhao et al., 2002; Zhao et al., 2008b). It can be used to calculate the duration of mineralization based on a known average grade, which is a crucial parameter for predicting new deposits and extracting metals directly from metal fluids (Buret et al., 2016; Zhao et al., 2018; Hu et al., 2020; Li et al., 2023). Therefore, computational simulation methods provide a potential and effective approach for addressing the challenge of obtaining deep-seated information in deep mineral exploration, by extending and extrapolating existing mineralization elements/information in both spatial and temporal dimensions (Wang S. F. et al., 2020; Xiao et al., 2021; Chen et al., 2022), and facilitating a comprehensive understanding of hydrothermal ore-forming processes, as demonstrated in previous studies (Hobbs et al., 2000; Lin et al., 2003; Lin et al., 2006; Lin et al., 2008; Lin et al., 2009; Liu et al., 2005; Liu et al., 2010; Liu et al., 2011; Xing et al., 2008; Alt-Epping and Zhao, 2010; Schmidt et al., 2010; Zhang et al., 2011; Lei et al., 2013; Cox., 2016; Wang et al., 2016; Wang S. R. et al., 2020; Cox, 2020).
With the above-mentioned considerations, this study selected the large-scale Sanshandao-Haiyu gold belt (>1400 t Au) as a case study of the gold deposits in the Jiaodong Peninsula to use the computational simulation method for investigating the realistic ore-forming processes of gold deposits in the Jiaodong Peninsula. The 3D computational model was performed on the FLAC3D (Itasca Consulting Group, 2012) platform to couple structural deformation, pore-fluid flow and heat transfer processes. We developed a new computer program to extract the temperature, pore-fluid velocity, and pore-fluid pressure from the FLAC3D simulation results in order to calculate temperature gradients and pore-fluid pressure gradients, which are key parameters for predicting the mineralization rate distribution. By analyzing the computational simulation results, we examined the correlation between dilation zones and known mineralization distribution. Furthermore, our research extracted quantitative results from simulation results to calculate the mineralization rate and identify chemical factors that affect gold precipitation processes, as well as estimate mineralization duration based on average gold grade. This study may provide new insights into the ore-forming processes and deep mineral exploration associated with the gold deposits in the Sanshandao-Haiyu belt and Jiaodong Peninsula.
Geology setting
Regional geology
The Jiaodong Peninsula, located on the eastern margin of the NCC (Figure 1A), is comprised of two units of the Jiaobei terrane and the Sulu ultra-high pressure terrane, which are separated by the NNE-oriented Wulian-Yantai fault (Li et al., 2016a). The Jiaobei terrane hosts most gold deposits in the Jiaodong region. It is covered by Neoarchean Jiaodong Group rocks (Figure 1B), which consist of tonalite–trondhjemite–granodiorite (TTG) gneiss, granulites, and amphibolites. The large-scale magmatism in the Jiaodong Peninsula occurs in the Mesozoic and is related to the lithosphere thinning of the NCC (Yang et al., 2008; Goldfarb and Santosh, 2014). These Mesozoic magmatic rocks were emplaced during two main periods: Jurassic and Early Cretaceous. The Jurassic magmatic activity is characterized by the 160–155 Ma Linglong granite (Yang et al., 2012; Mao et al., 2020), while the Early Cretaceous granites (namely, the Guojialing, Weideshan, and Laoshan granites, 130–113 Ma) are genetically associated with extensive crust-mantle interactions (Goss et al., 2010; Guo et al., 2013; Tang et al., 2014).
Sanshandao-Haiyu gold belt
The Sanshandao gold belt is hosted by the Sanshandao fault (Figure 2). The Sanshandao fault zone has a general trend of NE 35°and dips SE 35°–45° (Figure 2). The fault zone is mainly characterized by brittle-ductile fracturing, with a width of 30–200 m. The hanging wall of the Sanshandao fault is the Linglong granite, while the footwall rock is broken and altered Mesozoic Guojialing and minor Linglong granitic rocks.
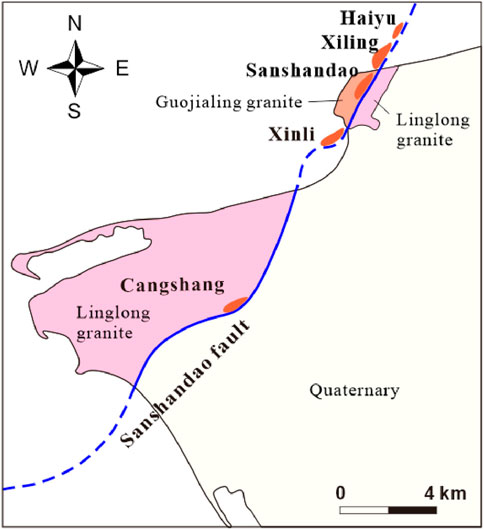
FIGURE 2. Geological map of the Sanshandao-Haiyu gold belt (Modified from Fan et al., 2003).
In the Sanshandao gold belt, the thick orebodies are found in the gentle-dipping part while the orebodies are commonly absent in steep dipping parts in the vertical direction (Figure 3A; Song et al., 2012; Song et al., 2015). Four major gold deposits are located in the Sanshandao gold belt, namely, the Xinli, Sanshandao, Xiling, and Haiyu deposits (Figure 3B). The four deposits coincide with the distribution of the Sanshandao fault, presenting a parallel feature. The alteration-mineralization zone exhibits a similar zonation pattern that comprises overprinting quartz-pyrite-sericite alteration and silicification + carbonation as the center near the Sanshandao fault (Figure 3A) as well as the potassic alteration in the outward (Song et al., 2015; Mao et al., 2019). The gold mineralization zones are constrained within the Sanshandao fault with >5 km length and an uneven width (2–30 m). Gold ore in the Sanshandao belt is characterized by the disseminated and veinlet style associated with pyrite–sericite–quartz alteration (Song et al., 2015). It is typically found in the footwall of the Sanshandao fault.
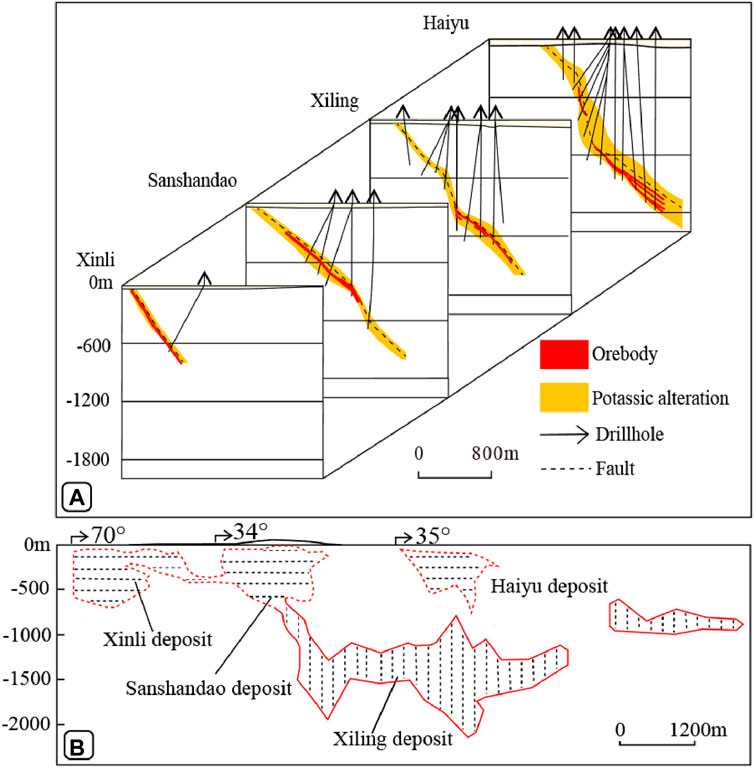
FIGURE 3. (A) Geological sections and (B) mineralization projection of the Sanshandao-Haiyu gold belt (modified from Song et al., 2015; Song et al., 2022).
Methodology
Simulation workflow
The computational simulation used in this study includes the following four major steps (Figure 4). 1) We first collect the exploration data and construct a 3D geometry model, which is further divided into blocks (meshes) corresponding to the elastic-plastic Mohr-Coulomb material and then loaded into FLAC3D (Fast Lagrangian Analysis of the Continuum in 3-D; Itasca Consulting Group, 2012). The rocks of the different groups in the model are treated as a continuum, carrying average values of mechanical, thermal, and hydraulic properties (Oliver et al., 2006). 2) We use the FLAC3D software (Itasca Consulting Group, 2012) to simulate rock deformation, pore-fluid flow, and heat transport processes in the ore-forming system. 3) We predict the metallogenic pattern and duration of the ore-forming system by using the mineralization rate (Zhao et al., 2002; Zhao et al., 2008b). Since the chemical reactions associated with the formation of mineral assemblages cannot be simulated in the FLAC3D software, we develop a new computer program to extract the temperature, pore-fluid velocity, and pore-fluid pressure from the FLAC3D simulation results, to calculate temperature gradients and pore-fluid pressure gradients, which are key parameters for predicting the mineralization rate distribution. 4) We discuss the relationship between the volumetric strain, mineralization rate, and mineralization pattern to provide constraints on the genesis of the Sanshandao-Haiyu gold belt.
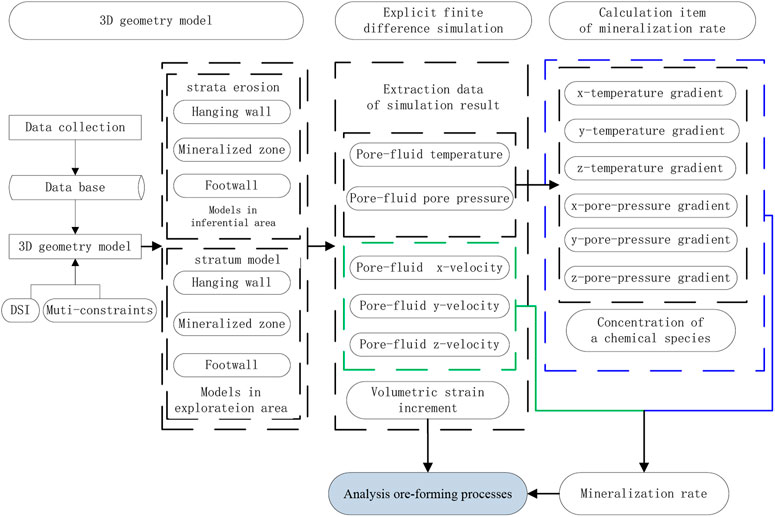
FIGURE 4. Workflow for simulating the ore-forming processes associated with the Sanshandao-Haiyu gold belt.
Mathematical equation of mineralization rate
The mineralization rate of a mineral is described as the change in the weight of the mineral per unit volume rock in unit time during mineralization (Zhao et al., 2002; Zhao et al., 2008b). By using this description, a positive mineralization rate of gold implies that gold dissolves from the rock in the hydrothermal system, and conversely, a negative mineralization rate implies that gold precipitates from the pore-fluids in the hydrothermal system (Zhao et al., 2002; Zhao et al., 2008b). The mathematical equation describing the mineralization rate can be derived from the law of mass conservation as follows (Zhao et al., 2002; Zhao et al., 2008b):
where
where
where
Mineralization duration and Au equilibrium concentration
The auriferous hydrothermal fluid of the Sanshandao-Haiyu gold belt is slightly acidic. Gold in this mineralizing fluid is mainly transported as
where
The equilibrium concentration of
where
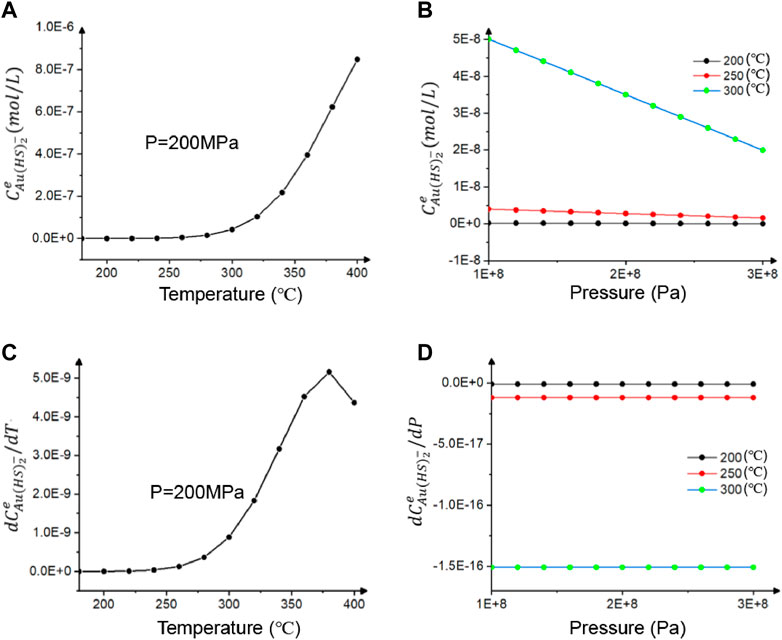
FIGURE 5. Variations of (A)
It is noted that Eq. 8 is used as the key factor to minimize the loss function. Finally, the mathematical model of
Where
Then the first derivatives of
Model construction and related parameters
Both the genetic and computational models were constructed to simulate the ore-forming processes associated with the Sanshandao-Haiyu gold belt. The genetic model for the Mesozoic gold deposits in the Sanshandao-Haiyu gold belt involves the evolution of fault deformation, pore-fluid flow through the fault channels, and preferential gold deposition (Figure 6). Four computational models were built using geological data mainly from the Shandong Gold Group Co. Ltd., which included 617 drill holes and 80 cross sections. These data were integrated on the SKUA-GOCAD platform to construct 3D geometric surface model including a 5 km thickness of erosion cover (Figure 7; Liu et al., 2017), which was then converted into a solid model consisting of tetrahedral elements that were constrained by cross sections, level plans, drill holes, and other relevant data. Subsequently, this solid model was converted into a tetrahedral discrete model of FLAC3D utilizing a new computer program, due to incompatible data formats between the SKUA-GOCAD platform and FLAC3D software.
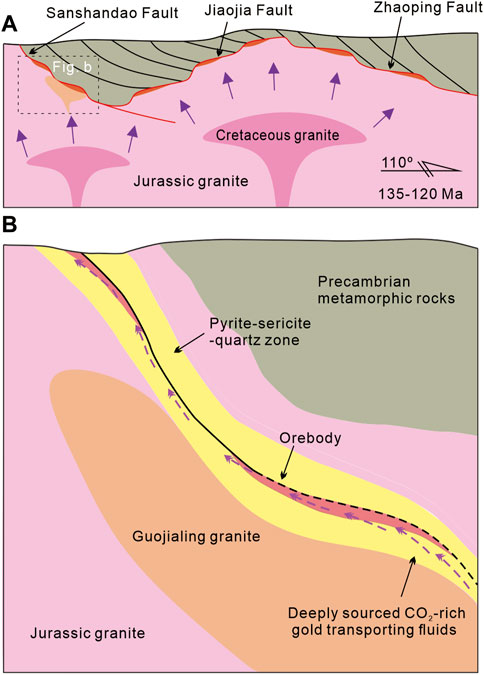
FIGURE 6. Metallogenic models for the Northwestern Jiaodong gold province (A) and the Sanshandao-Haiyu gold belt [(B); Modified from Yang et al., 2014; Yang et al., 2017; Song et al., 2015)].
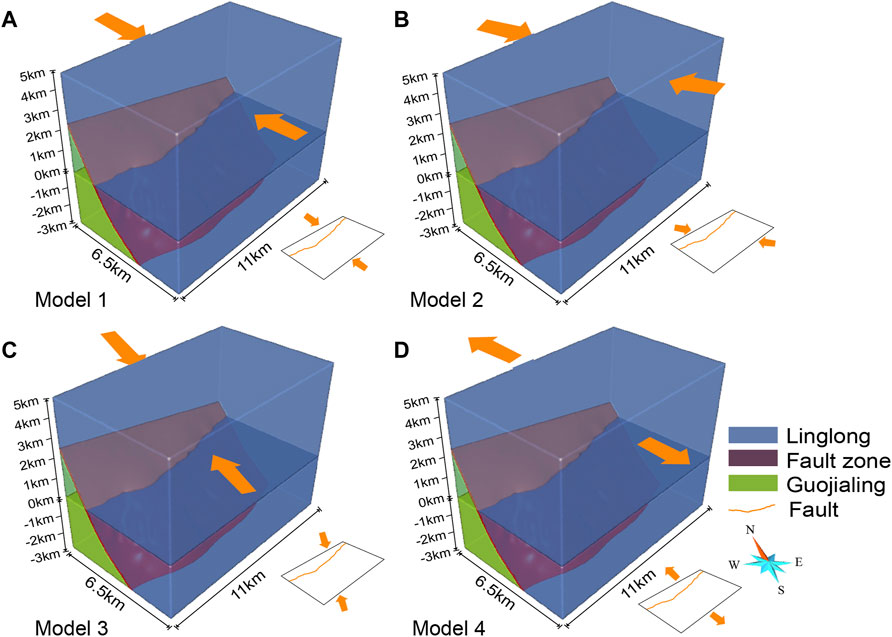
FIGURE 7. Dynamic computational model and the kinematic states associated with (A) compression in the NW-SE direction; (B) compression in the WNW-ESE direction; (C) compression in the NNW-SSE direction; and (D) extension in the NW-SE direction.
All units in the computational models were assigned mechanical, thermal, and hydrological properties (Table 1) on the basis of published compilations (Schön, 1998; Li et al., 2016b; He et al., 2016; Wang Y. et al., 2020). Some properties in the geological reality had a great variation with the depth of burial, thus, the data used in our model were determined by extensive comparative experiments within the general range of physical parameters for lithological classification (Schön, 1998), rather than directly obtaining unique values. It is selected on the judgement criteria of: 1) The property variation trend, such as mineral association, porosity and geochemical anomaly, and 2) minimizing the difference between the geological reality and simulation results formed by different data properties (Liu et al., 2014).

TABLE 1. Rock parameters used in the computational model.
An initial temperature of the top surface of the computational model was set at a constant value of 25°C, and the temperature gradient for the unit was 20 °C per kilometer. Previous studies showed that gold mineralization temperature is in the range of 230°C–340°C (Song et al., 2014; Yang et al., 2014). The initial temperature of the ore-forming fluids in this study was assumed to be 400°C. During simulation, the pore-fluid was unable to flow out at the bottom and vertical boundaries of the computational model, whereas the top boundary was free for pore-fluid flow. Based on the general model of Fournier (1999), the porous spaces were fully saturated in the initial state.
Due to the dominant gold mineralization formed in the quartz-pyrite-Au stage and the spatial overlapping of late mineralization as well as a stable stress setting, this study mainly focused on the ore-forming processes and environment for the dominant gold mineralization in the Sanshandao-Haiyu gold belt. Considering the unclear stress state during the mineralization period in the Sanshandao-Haiyu belt (i.e., NW-SE compression or extension; Yang et al., 2017; Yang et al., 2017; Deng et al., 2015; Zhang et al., 2020), as well as the impact of stress regimes in different directions on the ore-forming processes, the following four scenarios with different stress directions were implemented.
Scenario 1: Model 1 was subjected to compression in the NW-SE direction (Figure 7A) with an zero initial stress at the top and the incremental gradient of 2.0×10⁴ N/m2 per meter along the Z downward direction, which was applied symmetrically to left and right sections divided by the fault plane.
Scenario 2, 3: Compared to Model 1, Models 2 and 3 had the compression in the WNW-ESE (Figure 7B) and NNW-SSE (Figure 7C) directions respectively, but with the same stress magnitude and other parameters.
Scenario 4: Models 4, 1 had the same stress in magnitude and other parameters but opposite stress direction, that is, Model 4 was subjected to extension in the NW-SE direction (Figure 7D).
Model quantitative estimation
The receiver operating characteristic (ROC) curves are frequently used to measure the performance of binary classifier systems (Andrew, 1997; Molodianovitch et al., 2006). It has the x-axis and y-axis representing the false positive rate (i.e., the specificity) and true positive rate (i.e., the sensitivity), respectively. Since the mineralization rate is able to indicate whether gold is precipitated from pore fluids based on the above description, it can be transformed into a binary classification problem that can be tested for validity using the ROC curve approach. In this paper, the true positive rate indicates a correct identification between the known mineralization and non-mineralization zones, whereas the false positive rate describes an incorrect identification between them. The performance of classifier systems can be quantitatively assessed using the area under the curve (AUC), which ranges from 0 to 1, as demonstrated by Pablo et al. (2022). A higher AUC value suggests a more excellent classifier system, while an AUC value of 0.5 indicates a random guess.
Results
Since Models 1, 2 and 3 are in the compression structural regime and their simulation results (i.e., the volumetric strain, temperature and pore-fluid pressure) occur no significant difference, only the mineralization rate of Models 2 and 3 is shown in this paper. Thus, the other simulation result differences between the compression structural regime represented by Model 1 and the compression structural regime represented by Model 4 are not duplicated for comparisons.
Volumetric strain
The findings from Model 1 simulations indicate that the volumetric strain within the Sanshandao-Haiyu gold belt exhibits a range of −0.6%–0.5% with a variance of 1.1% along the fault zone, as illustrated in Figure 8. The distribution of volumetric strain is notably uneven, as the dilation zones (>0%) are predominantly present in the −400 m to −2000 m levels, with a south-to-north orientation in the Sanshandao fault, although occasional high-dilation areas occur in shallow regions (Figure 8A). Substantial dilation (positive volumetric strain) is observed near the gentle areas of the fault (Figures 8B–E), however, the magnitude and shape of respective dilation zones vary slightly. Conversely, the steep fault does not lead to significant dilation zones and instead contains dominant zones of volumetric contraction (Figures 8B–E). Notably, it is observed that higher dilation zones (>0.1%) are strongly correlated with the dip variations of the fault, with the highest dilation occurring at the gently sloped sections near the steep-flat transition (Figures 8B–E).
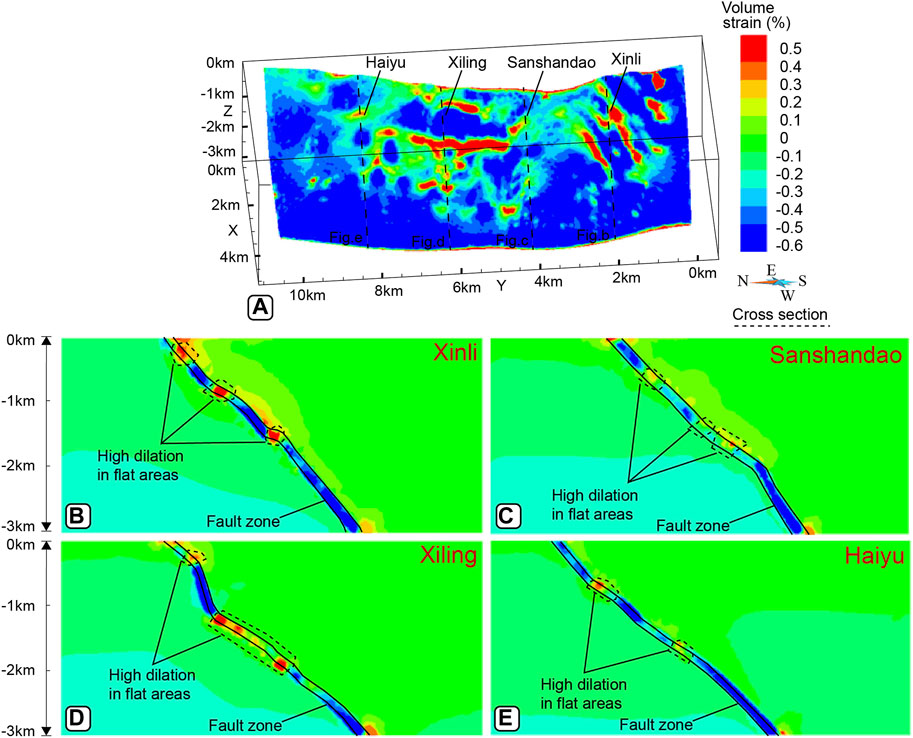
FIGURE 8. Volumetric strain distribution in the Sanshandao gold belt yielded by models in the NW-SE compressional structural regime (Model 1). (A) 3D models and (B–E) representative cross-sections. Note that positive and negative values of volumetric strain represent the increase and decrease of volume, respectively.
The simulation results in Model 4 show negative volumetric strain mostly occurs in the gentle areas of the fault, while the dilation zones are observed in steep parts (Figure 9).
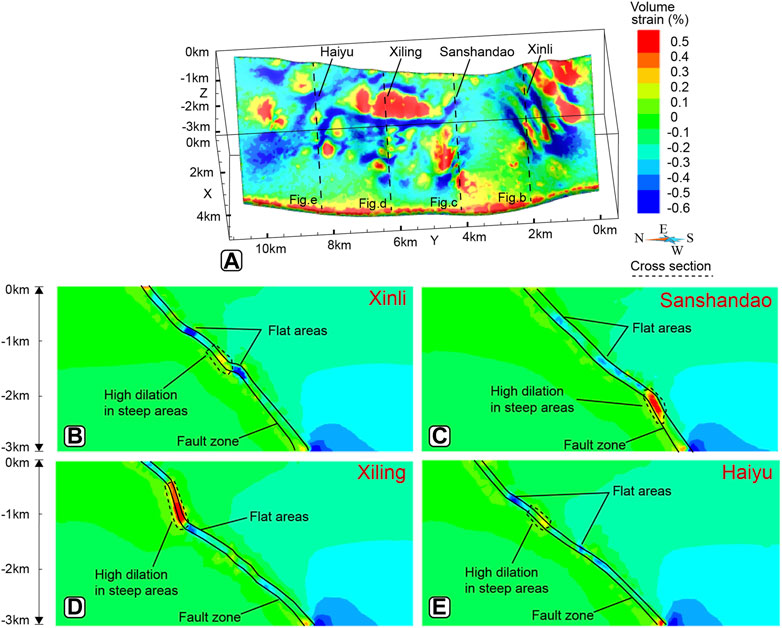
FIGURE 9. Volumetric strain distribution in the Sanshandao gold belt yielded by models in the NW-SE extensional structural regime (Model 4). (A) 3D models and (B–E) representative cross-sections. Note that positive and negative values of volumetric strain represent the increase and decrease of volume, respectively.
Pore-fluid pressure and temperature
The pore-fluid pressure in Model 1 is significantly decreased near the fault, particularly at depths ranging from −400 m to −2000 m, exhibiting an uneven distribution with large fluctuations (Supplementary Figure S1). Two obvious pore-fluid pressure gradient zones are continuously distributed in the hanging wall and footwall of the Sanshandao fault (Figures 10C–F). They have positive and negative values, respectively, with the most significant difference (>160,000 Pa/m) observed near the flat areas that are encircled by high pore-fluid flux emanating from the surrounding wall rocks (Figure 10). In other areas, including the steep parts of the fault, the direction of pore-fluid flow along the fault is upward (Figures 10B–F).
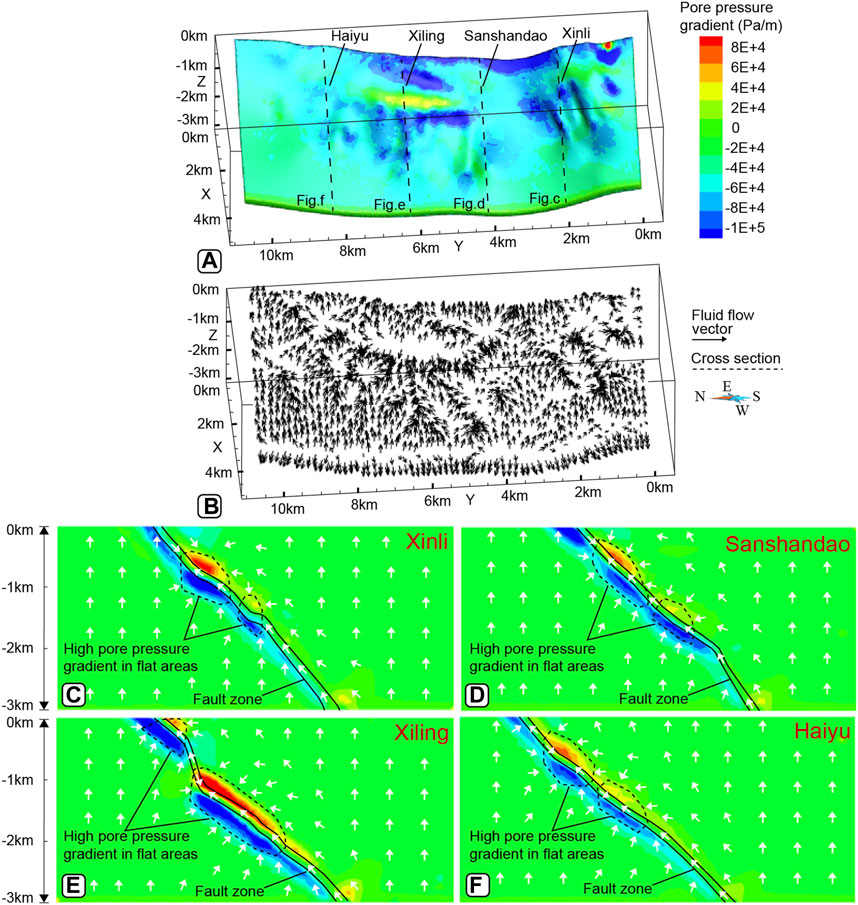
FIGURE 10. (A) Pore-fluid pressure gradient in the z-direction distribution in the Sanshandao gold belt yielded by models in the NW-SE compressional structural regime (Model 1); (B) Pore-fluid velocity and directions of Model 1 simulation results. The velocity ranges from 2×10⁻¹⁰ m/s to 1×10⁻⁷ m/s; (C–F) Representative cross-sections of Model 1 simulation results.
The temperature distribution in Model 1 exhibits a discontinuous characteristic at similar depths, which is manifested by the emergence of local high-temperature zones near the fault gentle areas (Supplementary Figure S2). Notably, the high-temperature variation involving a bending of the temperature contour occurs in the dilation zones (Figure 8A; Supplementary Figure S2a). The temperature gradient distribution closely mimics that of the pore-fluid pressure gradient (Figures 10C–F, 11B–E). Moreover, the flat zones of the fault display a high absolute value of temperature gradient (>0.1 °C/m), as illustrated in Figures 11B–E, while the steep zones demonstrate a relatively low temperature gradient (<0.05°C/m).
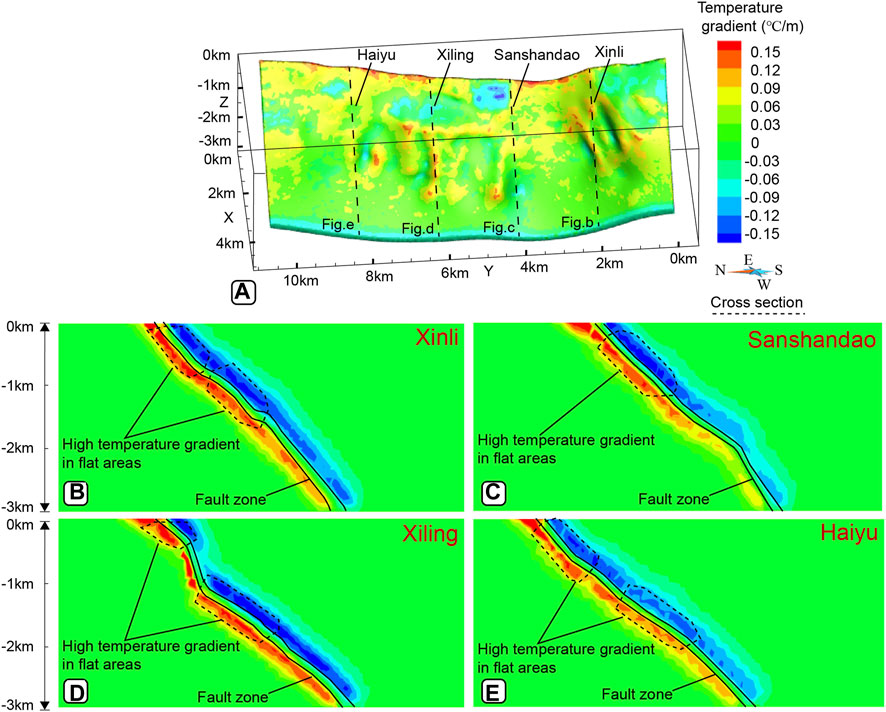
FIGURE 11. Temperature gradient distribution in z-direction in the Sanshandao gold belt yielded by models in the NW-SE compressional structural regime (Model 1). (A) 3D models and (B–E) representative cross-sections.
The spatial distribution of pore-fluid pressure and temperature in Model 4 has particular characteristics, compared to that in Model 1, such as more significant pore-fluid pressure variation in the steep areas (Supplementary Figure S3) and fewer local high-temperature areas (Supplementary Figures S4C–E). The pore-fluid pressure gradient has no obvious change near the gentle areas of the fault (Figures 12D–F), and the temperature gradient varies relatively mild (Figure 13A). Moreover, the transport of ore-forming fluids from deeper to shallower levels displays fewer convergent characteristics near the gentle areas of the fault (Figures 12B–F).
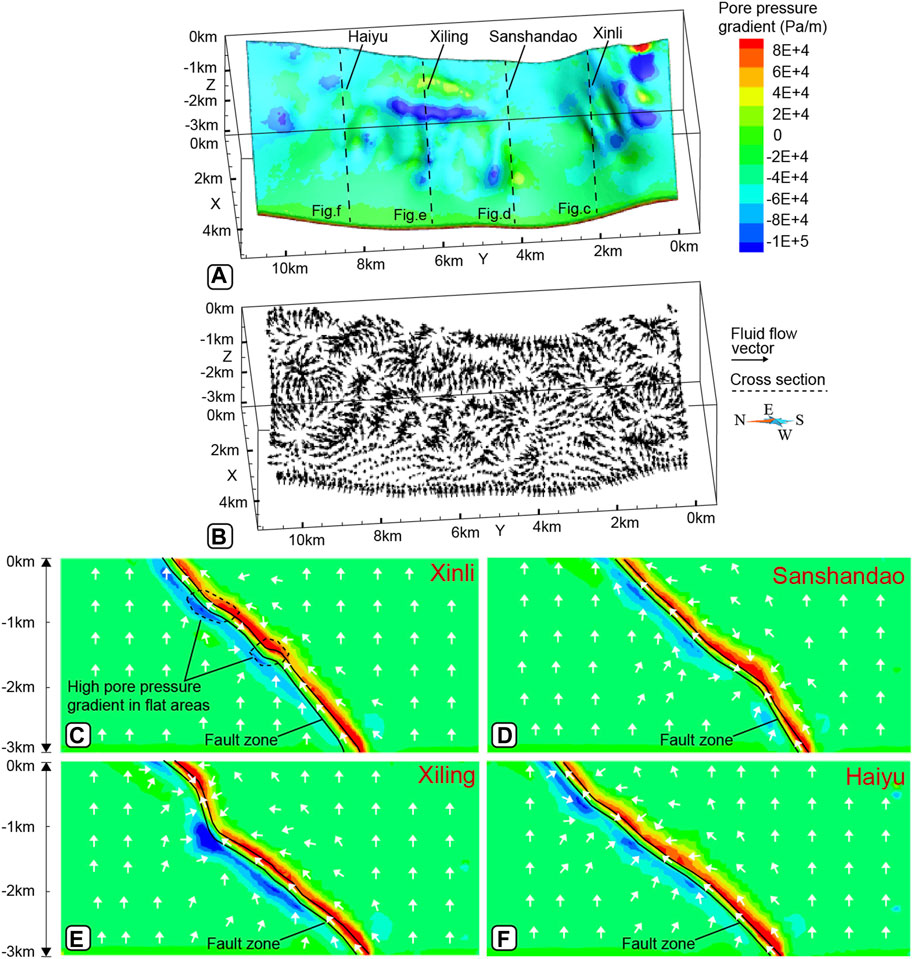
FIGURE 12. (A) Pore-fluid pressure gradient in the z-direction distribution in the Sanshandao gold belt yielded by models in the NW-SE extensional structural regime (Model 4); (B) Pore-fluid velocity and directions of Model 4 simulation results. The velocity ranges from 2×10⁻⁹ m/s to 5.7×10⁻⁷ m/s; (C–F) Representative cross-sections of Model 4 simulation results.
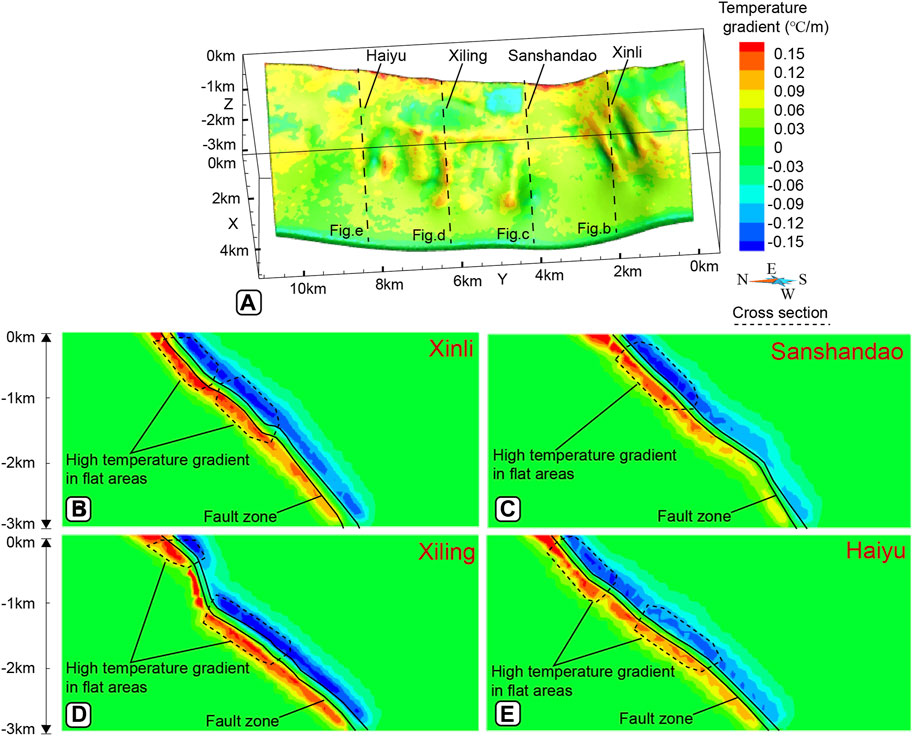
FIGURE 13. Temperature gradient in z-direction in the Sanshandao gold belt yielded by models in the NW-SE extensional structural regime (Model 4). (A) 3D models and (B–E) representative cross-sections.
Mineralization rate
The mineralization rate in Model 1 associated with the Sanshandao-Haiyu gold mineralization belt displays values of gold precipitation ranging from −6×10⁻¹⁷ to 0 kmol/(m3s) (Figures 14B–F). Gold precipitation is predominantly found in the flat areas of the Sanshandao fault, whereas it is rarely observed in the steep areas. The distinctive feature of gold precipitation (Figure 14B) exhibits vertical connectivity from shallow (southern) to deep (northern), which is in consistent with the known mineralization distribution (Figure 14A). Compared with Model 1, Gold precipitation in Models 2 and 3 has no notable change visually, except near the Haiyu and Sanshandao deposits, where the mineralization rate values are different (Supplementary Figures S5, S6). However, the mineralization rate in Model 4 shows that the spatial distribution of gold precipitation is significantly inconsistent with that of known orebodies (Figures 15A, B), typically exhibiting more gold precipitation near the steep areas and less near the gentle areas (Figures 15C–F).
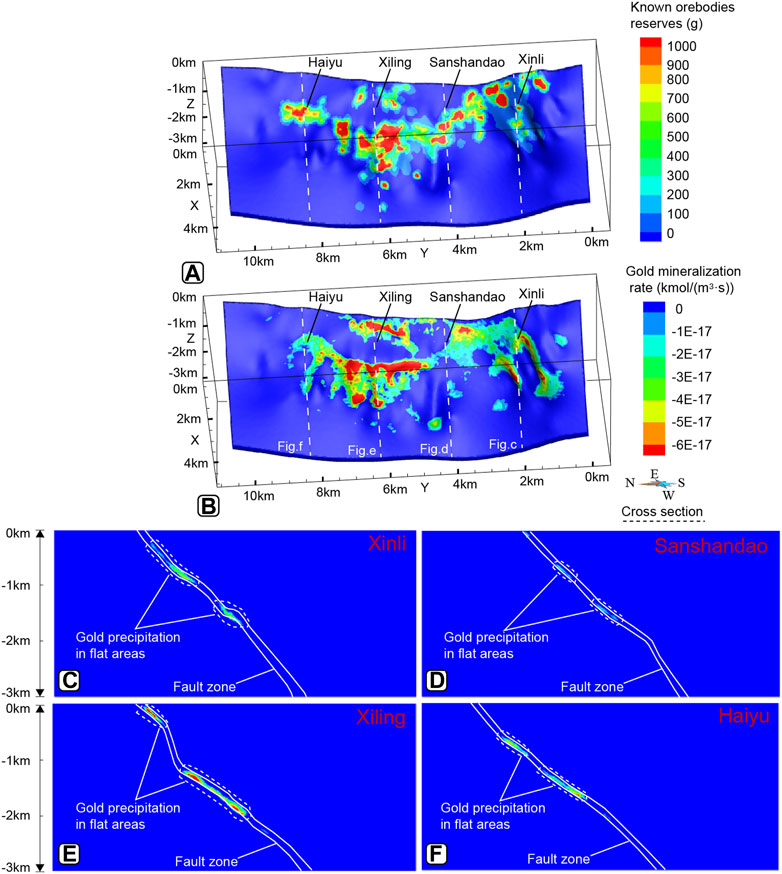
FIGURE 14. (A) Known gold mineralization distribution in the Sanshandao gold belt; (B) Gold precipitation distribution yielded by models in the NW-SE compressional structural regime (Model 1); (C–F) Representative cross-sections of Model 1 simulation results. Note that the gold mineralization rate with negative values denotes mineralization formation.
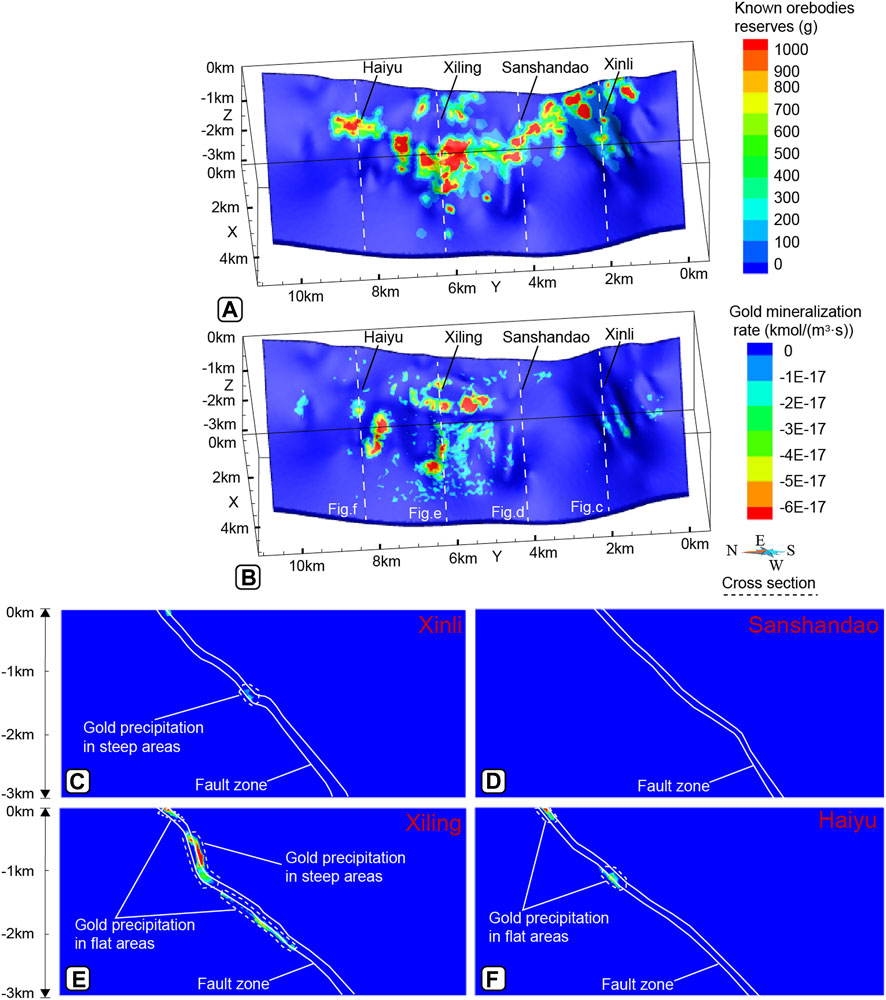
FIGURE 15. (A) Known gold mineralization distribution in the Sanshandao gold belt; (B) Gold precipitation distribution yielded by models in the NW-SE extensional structural regime (Model 4); (C–F) Representative cross-sections of Model 4 simulation results. Note that the gold mineralization rate with negative values denotes mineralization formation.
The association between the volumetric strain and mineralization rate is spatially correlated by the fault features, where obvious zones of dilation and ore precipitation are generated in low-degree undulations in both the strike and dip directions (Figures 8B–E, 14C–F). The relatively high volumetric strain (>0.1%) and mineralization rate [<–1×10-17 kmol/(m3s); Figures 8B–E, 14C–F], meaning the higher volumetric expansion and more gold precipitation, generally have similar distribution patterns to the known mineralization (i.e., the Xinli, Sanshandao, Xiling, and Haiyu deposits).
Quantitative estimation results for simulation models
In the compressional structural regime, the AUC values of Model 1 (=0.862; Supplementary Figure S7A) are slightly higher than those of Models 2 (=0.834; Supplementary Figure S7B) and 3 (=0.823; Supplementary Figure S7C). However, the AUC value of Model 4 (=0.588) in the extensional structural regime is significantly lower than those of the compressional structural regime (Supplementary Figure S7D), which is close to the random guess. Furthermore, its high and low false sensitivity ranges are also obviously lower than those of the compressional structural regime.
Discussion
Structural control on the mineralization
The spatial distribution of dilation areas is obviously subject to the dip variations and the direction of applied stress of the Sanshandao fault. In Model 1, continuous dilation areas imply that its rocks are damaged to some extent near the gentle areas of the fault from shallow (southern) to deep (northern) within the depths of −400 m to −2000 m (Figure 8), which can enhance permeability and yield continuous space to trap pore-fluids. In Model 4, dilation areas are mainly located near steep areas of the fault with dispersed spatial characteristics (Figure 9), and it is challenging to capture a large range of continuous pore-fluids compared to Model 1.
The relationship between dilation and pore-fluid convergence is positively correlated, which is indicated by the overlap between dilation and pore-fluid convergence in Figures 8A, 9A, 10A, and B12B. As dilation areas cause a drop in pore-fluid pressure, resulting in inhomogeneous pore-fluid pressure gradients (Figures 10, 12). These gradients facilitate the flow of pore-fluid from the surrounding rock into the dilation zones, and also its high-pressure gradients can enhance more pore-fluid convergence. In Model 1, continuous pore-fluid convergence occurs within the dilation areas (Figures 8A, 10B), which would escape slowly in the lateral direction due to the gentle areas of the fault. It extends the trapped duration of the pore-fluid, which provides sufficient time for continuous spatial mineralization. However, in Model 4, the pore-fluid convergence (Figure 12B) is discontinuously distributed in the steep areas of the fault compared to Model 1, which is inconsistent with the spatial distribution of the known orebodies.
From a chemical point of view, it can be inferred that dilation areas of the fault exhibit distinct variations in temperature and pore-fluid pressure gradients, providing an ideal environment for chemical reactions to occur (Liu et al., 2015; Zou et al., 2017) and trigger gold precipitation. The mineralization rate (Zhao et al., 2002; Zhao et al., 2008b) can be used to estimate the spatial distribution of precipitation-enrichment and mineralization of metals as well as the related controlling factors of ore-forming processes (Gow et al., 2002; Ord et al., 2002; Schaubs and Zhao, 2002; Sorjonen-Ward et al., 2002; Zhao et al., 2002; Zhao et al., 2008b; Ju et al., 2011). In Models 1, 2, and 3, all the simulation results exhibit that the continuous distribution of gold precipitation is sensitive to the gentle areas of the fault (Figure 14; Supplementary Figures S5, S6), implying that strong chemical reactions occurred in these areas. In Model 4, the gold precipitation distribution pattern is similar to that of dilation (Figures 9, 15), namely, more orebodies precipitated in the steep areas of the fault. The degree of correspondence between the gold precipitation patterns and known orebodies gradually decreases from the NW-SE compression direction towards both sides, reaching its lowest point in the NW-SE extension direction (Supplementary Figure S7). It may be related to the fact that the closer to the NW-SE compression direction can create the more significant dilation and more pore-fluid convergence in the flat areas of the fault, bringing a more comfortable environment for chemical reactions. The high AUC difference (=0.274) between Model 1 (=0.862; Supplementary Figure S7A) and Model 4 (=0.588; Supplementary Figure S7D) further supports, from a statistics view, that the gold precipitation distribution pattern associated with the compression in the NW-SE direction is more consistent with the geological reality.
All modeling results under different stress directions applied the model demonstrate that the formation of the Sanshandao-Haiyu gold belt involves a complex coupling of physical and chemical processes. Among all ore-related factors, the high dilation, pore-fluid convergence and gold precipitation indicated by mineralization rate, which are most consistent with the reality of gold mineralization, are caused by regional compression deformation, especially in the NW-SE direction (Yang et al., 2017; Yang et al., 2019).
Evaluation of the mineralization time
The duration of hydrothermal systems is a critical parameter required to enhance our ability to predict new ore deposits and extract metals directly from metal fluids. However, traditional methods for obtaining this information have limitations due to either low temporal resolution or undertake considerable uncertainty (Buret et al., 2016; Hu et al., 2020; Li et al., 2023). To address this issue, our study introduces a novel approach that utilizes the mineralization rate to calculate the duration of gold precipitation given knowledge of the average grade of the precipitated gold, with the following mathematical equation (Zhao et al., 2018):
where
The molar mass of a gold atom is 196.966569 g/mol according to the periodic table of chemical elements. From the known Au grade data (1.74–15.4 g/t) of the Sanshandao-Haiyu gold belt, the average grade data of Au is equal to 3.25 g/t. The average precipitation rate, which was obtained from the computational simulation, is equal to 1.52×10⁻¹⁷ kmol/(m3 s). By using the mineralization rate and Eqs. 13, 14, we estimated that the total duration of the cumulative metallogenic processes in the Sanshandao-Haiyu gold belt would be less than 100,000 years.
Conclusions
(1) The simulation results of the NW-SE compressional structural regime show that the mineralization rate is most closely consistent with the reality compared with other stress scenarios, which model also has a largest AUC (=0.862). The NW-SE compressional structural regime may control the mineralization distribution of the Sanshandao-Haiyu belt.
(2) The simulation results of the mineralization rate reflect the essential physical–geochemical influence on the formation of the Sanshandao-Haiyu gold belt, in which the direction of pore-fluid flow (physical factors) controlled the fluid pooling and the gold precipitation (chemical factors) influence on the final gold occurrence.
(3) The mineralization process of the Sanshandao-Haiyu gold belt is estimated to last less than 100,000 years by using the mineralization rate.
Data availability statement
The original contributions presented in the study are included in the article/Supplementary Material, further inquiries can be directed to the corresponding authors.
Author contributions
WS wrote the original draft preparation. XM and ZL were responsible for the guidance of the overall idea and the review of the draft. LT and DW did data and sample collection. YP and YL did model construction. HD and YP were responsible for conducting all the experiments. All authors contributed to the article and approved the submitted version.
Funding
This study is funded by projects from National Natural Science Foundation of China (Nos. 42030809, 41972309, 42072325, 42172328, and 42162028), Open Research Fund Program of Key Laboratory of Metallogenic Prediction of Nonferrous Metals and Geological Environment Monitoring (Central South University), Ministry of Education (No. 2021YSJS07), the science and technology innovation Program of Hunan Province (2021RC4055), the Research Foundation of Education Bureau of Hunan Province, China (Grant No. 20C0372), and 2023-2024 Vocational Education Research Project of Jiangsu Province (XHZDB2023025).
Acknowledgments
We thank Fenglin Zhao of the Shandong Gold Group Co., Ltd. for permitting access to the Sanshandao gold mine.
Conflicts of interest
Authors LT and DW were employed by Zhaojin Mining Industry Co., Ltd.
The remaining authors declare that the research was conducted in the absence of any commercial or financial relationships that could be construed as a potential conflict of interest.
Publisher’s note
All claims expressed in this article are solely those of the authors and do not necessarily represent those of their affiliated organizations, or those of the publisher, the editors and the reviewers. Any product that may be evaluated in this article, or claim that may be made by its manufacturer, is not guaranteed or endorsed by the publisher.
Supplementary material
The Supplementary Material for this article can be found online at: https://www.frontiersin.org/articles/10.3389/feart.2023.1154945/full#supplementary-material
References
Alt-Epping, P., and Zhao, C. B. (2010). Reactive mass transport modelling of a three-dimensional vertical fault zone with a finger-like convective flow regime. J. Geochem. Explor. 106, 8–23. doi:10.1016/j.gexplo.2009.12.007
Andrew, P. B. (1997). The use of the area under the ROC curve in the evaluation of machine learning algorithms. Pattern Recogn. 30 (7), 1145–1159. doi:10.1016/s0031-3203(96)00142-2
Buret, Y., Albrecht, V. Q., Christoph, H., David, S., Markus, W., and Irena, P. (2016). From a long-lived upper-crustal magma chamber to rapid porphyry copper emplacement: Reading the geochemistry of zircon crystals at Bajo de la Alumbrera (NW Argentina). Earth Planet. Sc. Lett. 450 (15), 120–131. doi:10.1016/j.epsl.2016.06.017
Chen, W. L., Xiao, F., Peng, T. C., Liaw, F. Y., Chao, Y. P., and Kao, T. W. (2022). Advances in numerical modeling of metallogenic geodynamics: A review of theories, methods and technologies. Bull. Geol. Sci. Technol. 41 (4), 1–21. doi:10.1017/S1368980022000684
Chen, Y. J., Pirajno, F., Lai, Y., and Li, C. (2004). Metallogenic time and tectonic setting of Jiaodong gold province, eastern China. Acta Petrol. Sin. 20 (4), 907–922.
Cox, S. F. (2005). Coupling between deformation, fluid pressures, and fluid flow in ore-producing hydrothermal systems at depth in the crust. Econ. Geol. 100, 39–75.
Cox, S. F. (2016). Injection-Driven swarm seismicity and permeability enhancement: Implications for the dynamics of hydrothermal ore systems in high fluid-flux, overpressured faulting regimes—an invited paper. Econ. Geol. 111, 559–587. doi:10.2113/econgeo.111.3.559
Cox, S. F., and Ruming, K. (2004). The St Ives mesothermal gold system, Western Australia–a case of golden aftershocks? J. Struct. Geol. 26 (6-7), 1109–1125. doi:10.1016/j.jsg.2003.11.025
Cox, S. F. (2010). The application of failure mode diagrams for exploring the roles of fluid pressure and stress states in controlling styles of fracture-controlled permeability enhancement in faults and shear zones. Geofluids 10 (1-2), 217–233. doi:10.1111/j.1468-8123.2010.00281.x
Cox, S. F. (2020). The dynamics of permeability enhancement and fluid flow in overpressured, fracture-controlled hydrothermal systems. Rev. Econ. Geol. 21, 25–82.
Deng, J., Wang, C. M., Bagas, L., Carranza, E. J. M., and Lu, Y. J. (2015). Cretaceous–cenozoic tectonic history of the jiaojia fault and gold mineralization in the Jiaodong Peninsula, China: Constraints from zircon U–Pb, illite K–Ar, and apatite fission track thermochronometry. Min. Deposita. 50 (8), 987–1006. doi:10.1007/s00126-015-0584-1
Deng, J., Yang, L. Q., Groves, D. I., Zhang, L., Qiu, K. F., and Wang, Q. F. (2020). An integrated mineral system model for the gold deposits of the giant Jiaodong province, Eastern China. Earth-Sci. Rev. 208, 103274. doi:10.1016/j.earscirev.2020.103274
Deng, J., Yang, L. Q., Li, R. H., Groves, D. I., Santosh, M., Wang, Z. L., et al. (2019). Regional structural control on the distribution of world-class gold deposits: An overview from the Giant Jiaodong Gold Province, China. Geol. J. 54, 378–391. doi:10.1002/gj.3186
Dick, J. M. (2019). Chnosz: Thermodynamic calculations and diagrams for geochemistry. Front. Earth Sci. 7, 180. doi:10.3389/feart.2019.00180
Fan, H. R., Zhai, M. G., Xie, Y. H., and Yang, J. H. (2003). Ore-forming fluids associated with granite-hosted gold mineralization at the Sanshandao deposit, Jiaodong gold province, China. Min. Deposita7 38, 739–750. doi:10.1007/s00126-003-0368-x
Fournier, R. O. (1999). Hydrothermal processes related to movement of fluid from plastic into brittle rock in the magmatic-epithermal environment. Econ. Geol. 98, 1193–1211. doi:10.2113/gsecongeo.94.8.1193
Goldfarb, R. J., and Santosh, M. (2014). The dilemma of the Jiaodong gold deposits: Are they unique? Geosci. Front. 5, 139–153. doi:10.1016/j.gsf.2013.11.001
Goss, S. C., Wilde, S. A., Wu, F. Y., and Yang, J. (2010). The age, isotopic signature and significance of the youngest mesozoic granitoids in the Jiaodong terrane, Shandong province, north China craton. Lithos 120, 309–326. doi:10.1016/j.lithos.2010.08.019
Gow, P., Upton, P., and Hill, K. (2002). Copper-gold mineralisation in New Guinea: Numerical modelling of collision, fluid flow and intrusion-related hydrothermal systems. Aust. J. Earth. Sci. 49, 753–771. doi:10.1046/j.1440-0952.2002.00945.x
Groves, D. I., Santosh, M., Goldfarb, R. J., and Zhang, L. (2018). Structural geometry of orogenic gold deposits implications for exploration for world-class and giant deposits. Geosci. Front. 9, 116–1177.
Guo, P., Santosh, M., and Li, S. (2013). Geodynamics of gold metallogeny in the Shandong Province, NE China: An integrated geological, geophysical and geochemical perspective. Gondwana Res. 24, 1172–1202. doi:10.1016/j.gr.2013.02.004
He, S. B., Wang, H. W., Guo, Y., and Li, W. (2016). Analysis of characteristics of seepage field in Sanshandao island gold mine under the action of water chemical damage. Mater. Min. 480, 167–172.
Hobbs, B. E., Zhang, Y. H., Ord, A., and Zhao, C. (2000). Application of coupled deformation, fluid flow, thermal and chemical modelling to predictive mineral exploration. J. Geochem. Explor. 69, 505–509. doi:10.1016/s0375-6742(00)00099-6
Hu, X. Y., Li, X. H., Yuan, F., Alison, O., Simon, M. j., Li, Y., et al. (2020). Numerical modeling of ore-forming processes within the Chating Cu-Au porphyry-type deposit, China: Implications for the longevity of hydrothermal systems and potential uses in mineral exploration. Ore Geol. Rev. 116, 103230. doi:10.1016/j.oregeorev.2019.103230
Itasca Consulting Group, I. (2012). FLAC3D user's guide, version 5.0. Minneapolis, MN, United States: Itasca Consulting Group.
Ju, M. H., Zhao, C., Dai, T. G., and Yang, J. W. (2011). Finite element modeling of pore-fluid flow in the Dachang ore district, Guangxi, China: Implications for hydrothermal mineralization. Geosci. Front. 2 (3), 463–474. doi:10.1016/j.gsf.2011.05.008
Ladd, A. J. C., and Szymczak, P. (2021). Reactive flows in porous media: Challenges in theoretical and numerical methods. Annu. Rev. Chem. Biomol. 12, 543–571. doi:10.1146/annurev-chembioeng-092920-102703
Ladd, A. J. C., Yu, L., and Szymczak, P. (2020). Dissolution of a cylindrical disk in hele-shaw flow: A conformal-mapping approach. J. Fluid Mech. 903, A46. doi:10.1017/jfm.2020.609
Lei, X. Q., Chen, Y. P., Zhao, C. B., and Zhao, J. M. (2013). Three-dimensional thermo-mechanical modeling of the Cenozoic uplift of the Tianshan mountains driven tectonically by the Pamir and Tarim. J. Asian Earth Sci. 62, 797–811. doi:10.1016/j.jseaes.2012.11.034
Li, H. K., Geng, K., Zhuo, C. Y., and Liang, T. T. (2016a). Tectonic setting and mineralization of the Jiaodong gold deposit. Beijing: Geological Publishing House, 85–244 (in Chinese).
Li, K. P., Ma, F. S., Guo, J., Lu, R., Zhang, H. X., and Li, W. (2016b). Numerical simulation of mine backfill and surrounding rock deformation when exploiting Sanshandao seabed gold mine. Gold Sci. Technol. 24 (4), 73–79.
Li, Y., Pan, J., Y., Wu, L. G., H, S., Bachmann, O., and Li, X. H. (2023). Transient tin mineralization from cooling of magmatic fluids in a long-lived system. Geology 51 (3), 305–309. doi:10.1130/g50781.1
Li, Z. H., Chi, G. X., Bethune, K. M., Eldursi, K., Thomas, D., Quirt, D., et al. (2017a). Synchronous egress and ingress fluid flow related to compressional reactivation of basement faults: The Phoenix and Gryphon uranium deposits, southeastern Athabasca Basin, Saskatchewan, Canada. Min. Depos. 53, 277–292. doi:10.1007/s00126-017-0737-5
Li, Z. H., Chi, G. X., Bethune, K. M., Thomas, D., and Zaluski, G. (2017b). Structural controls on fluid flow during compressional reactivation of basement faults: Insights from numerical modeling for the formation of unconformity-related uranium deposits in the athabasca basin, Canada. Can. Econ. Geol. 112, 451–466. doi:10.2113/econgeo.112.2.451
Lin, G., Peng, M. L., Zhao, C. B., Zhang, L., Zhang, D. S., and Liu, S. L. (2009). Numerical analysis and simulation experiment of lithospheric thermal structures in the South China Sea and the Western Pacific. J. Earth Sci-China 20, 85–94. doi:10.1007/s12583-009-0009-0
Lin, G., Zhao, C. B., Hobbs, B. E., Ord, A., and Mühlhaus, H. B. (2003). Theoretical and numerical analyses of convective instability in porous media with temperature-dependent viscosity. Commun. Numer. Meth. En. 19, 787–799. doi:10.1002/cnm.620
Lin, G., Zhao, C. B., Hobbs, B. E., Zhang, L., and Zhou, Y. (2008). Potential effects of upward throughflow on thermal structure models within the continental lithospheric mantle-crust. Chin. J. Geophys-Ch. 51 (2), 393–401.
Lin, G., Zhou, Y., Wei, X. R., and Zhao, C. B. (2006). Structural controls on fluid flow and related mineralization in the Xiangshan uranium deposit, Southern China. J. Geochem. Explor. 89, 231–234. doi:10.1016/j.gexplo.2005.11.051
Lin, Y., Gao, F., Zhou, K., Gao, R., and Guo, H. (2019). Mechanical properties and statistical damage constitutive model of rock under a coupled chemical-mechanical condition. Geofluids 2019. doi:10.1155/2019/7349584
Liu, L. M., Sun, T., and Zhou, R. C. (2014). Epigenetic Genesis and magmatic intrusion's control on the Dongguashan stratabound Cu-Au deposit, Tongling, China: Evidence from field geology and numerical modeling. J. Geochem. Explor. 144, 97–114. doi:10.1016/j.gexplo.2014.03.008
Liu, L. M., Wan, C. L., Zhao, C. B., and Zhao, Y. L. (2011). Geodynamic constraints on orebody localization in the Anqing orefield, China: Computational modeling and facilitating predictive exploration of deep deposits. Ore Geol. Rev. 43, 249–263. doi:10.1016/j.oregeorev.2011.09.005
Liu, L. M., Yang, G. Y., Peng, S. L., and Zhao, C. B. (2005). Numerical modeling of coupled geodynamical processes and its role in facilitating predictive ore discovery: An example from tongling, China. Resour. Geol. 55, 21–31. doi:10.1111/j.1751-3928.2005.tb00225.x
Liu, L. M., Zhao, Y. L., and Zhao, C. B. (2010). Coupled geodynamics in the formation of Cu skarn deposits in the Tongling–Anqing district, China: Computational modeling and implications for exploration. J. Geochem. Explor. 106, 146–155. doi:10.1016/j.gexplo.2010.01.002
Liu, X., Fan, H. R., Evans, N. J., Yang, K. F., Danišík, M., McInnes, B. I. A., et al. (2017). Exhumation history of the Sanshandao Au deposit, Jiaodong: Constraints from structural analysis and (U-Th)/He thermochronology. Sci. Rep. 7, 7787. doi:10.1038/s41598-017-08103-w
Liu, Y., Dai, T. G., Xia, S. H., and Tian, H. L. (2015). Computational simulation of iron ore-forming processes in the Caiyuanzi siderite ore district, Guizhou, China. J. Geochem. Explor. 158, 155–167. doi:10.1016/j.gexplo.2015.07.012
Liu, Z. K., Chen, J., Mao, X. C., Tang, L., Yu, S., Deng, H., et al. (2021d). Spatial association between orogenic gold mineralization and structures revealed by 3D prospectivity modeling: A case study of the xiadian gold deposit, Jiaodong Peninsula, China. Nat. Resour. Res. 30, 3987–4007. doi:10.1007/s11053-021-09956-9
Liu, Z. K., Hollings, P., Mao, X. C., Lawley, C. J., Yang, B., and Tang, L. (2021c). Metal remobilization from country rocks into the Jiaodong-type orogenic gold systems, Eastern China: New constraints from scheelite and galena isotope results at the Xiadian and Majiayao gold deposits. Ore Geol. Rev. 134, 104126. doi:10.1016/j.oregeorev.2021.104126
Liu, Z. K., Mao, X. C., Jedemann, A., Bayless, R. C., Bayless, R. C., Deng, H., et al. (2021b). Evolution of pyrite compositions at the sizhuang gold deposit, Jiaodong Peninsula, eastern China: Implications for the genesis of jiaodong-type orogenic gold mineralization. Minerals 11, 344. doi:10.3390/min11040344
Liu, Z. K., Mao, X. C., Wang, F. Y., Tang, L., Chen, G. H., Chen, J., et al. (2021a). Deciphering anomalous Ag enrichment recorded by galena in Dayingezhuang Au (-Ag) deposit, Jiaodong Peninsula, Eastern China. Trans. nonferr. Metal. Soc. 31, 3831–3846. doi:10.1016/s1003-6326(21)65768-0
Mao, X. C., Ren, J., Liu, Z. K., Chen, J., Tang, L., Deng, H., et al. (2019). Three-dimensional prospectivity modeling of the jiaojia-type gold deposit, Jiaodong Peninsula, eastern China: A case study of the dayingezhuang deposit. J. Geochem. Explor. 203, 27–44. doi:10.1016/j.gexplo.2019.04.002
Mao, X. C., Wang, Q., Chen, J., Deng, H., Liu, Z. K., Wang, J. L., et al. (2020). Three-dimensional modeling of deep metallogenic structure in northwestern Jiaodong Peninsula and its gold prospecting significance. Acta Geosci. Sin. 41, 166–178.
Mazzarini, F., Musumeci, G., Viola, G., Garofalo, P. S., and Mattila, J. (2019). Structural and lithological control on fluid circulation, dilation and ore mineralization (Rio Albano mine, Island of Elba, Italy). J. Struct. Geol. 126, 210–230. doi:10.1016/j.jsg.2019.06.012
Micklethwaite, S., and Cox, S. F. (2004). Fault-segment rupture, aftershock-zone fluid flow, and mineralization. Geology 32 (9), 813–816. doi:10.1130/g20559.1
Micklethwaite, S., and Cox, S. F. (2006). Progressive fault triggering and fluid flow in aftershock domains: Examples from mineralized Archaean fault systems. Earth Planet. Sc. Lett. 250 (1-2), 318–330. doi:10.1016/j.epsl.2006.07.050
Molodianovitch, K., Faraggi, D., and Reiser, B. (2006). Comparing the areas under two correlated ROC curves: Parametric and non-parametric approaches. Biom. J. 48 (5), 745–757. doi:10.1002/bimj.200610223
Nield, D. A., and Bejan, A. (2013). Convection in porous media. New York, NY, United States: Springer-Verlag.
Oliver, N. H. S., McLellan, J. G., Hobbs, B. E., Cleverley, J. S., Ord, A., and Feltrin, L. (2006). 100th anniversary special paper: Numerical models of extensional deformation, heat transfer, and fluid flow across basement-cover interfaces during basin-related mineralization. Econ. Geol. 101, 1–31. doi:10.2113/gsecongeo.101.1.1
Ord, A., Hobbs, B. E., Zhang, Y., Broadbent, G. C., Brown, M., Willetts, G., et al. (2002). Geodynamic modelling of the century deposit, Mt isa province, queensland. Aust. J. Earth. Sci. 49, 1011–1039. doi:10.1046/j.1440-0952.2002.00968.x
Pablo, M. C., Sonia, P. F., and Susana, D. C. (2022). The area under the generalized receiver-operating characteristic curve. Int. J. Biostat. 18 (1), 293–306. doi:10.1515/ijb-2020-0091
Phillips, O. M. (1991). Flow and reactions in permeable rocks. Cambridge, England: Cambridge University Press.
Prakash, R., Nguene, P. C. K., Noshadravan, A., and Abedi, S. (2022). Chemical reactions of carbonate-rich mudstones with aqueous CO2 and their impacts on rock's local microstructural and chemo-mechanical properties. J. Nat. Gas. Sci. Eng. 103, 104587. doi:10.1016/j.jngse.2022.104587
Schaubs, P., and Zhao, C. B. (2002). Numerical models of gold-deposit formation in the bendigo-ballarat zone, victoria. Aust. J. Earth. Sci. 49, 1077–1096. doi:10.1046/j.1440-0952.2002.00964.x
Schmidt, A., Brugger, J., and Schacht, U. (2010). Fluids in geological processes: The present state and future outlook. J. Geochem. Explor. 106, 1–7. doi:10.1016/j.gexplo.2010.01.005
Schön, J. H. (1998). Physical properties of rocks: Fundamentals and principles of petrophysics. Amsterdam, Netherlands: Elsevier.
Song, M. C., Deng, J., Yi, P. H., Yang, L. Q., Cun, S. X., Xu, J. X., et al. (2014). The kiloton class Jiaojia gold deposit in eastern Shandong Province and its Genesis. Acta Geol. sin-engl. 88, 801–824. doi:10.1111/1755-6724.12239
Song, M. C., Ding, Z. J., Liu, X. D., Li, S. Y., Li, J., Dong, L. L., et al. (2022). Structural controls on the Jiaodong type gold deposits and metallogenic model. Acta Geol. Sin. 96 (5), 1774–1802.
Song, M. C., Li, S. Z., Santosh, M., Zhao, S. J., Yu, S., Yi, P. H., et al. (2015). Types, characteristics and metallogenesis of gold deposits in the Jiaodong Peninsula, eastern North China craton. Ore Geol. Rev. 65, 612–625. doi:10.1016/j.oregeorev.2014.06.019
Song, M. C., Pihou, Y. I., Junxiang, X. U., Cui, S. X., Shen, K., Jiang, H. L., et al. (2012). A step metallogenetic model for gold deposits in the northwestern Shandong Peninsula, China. Sci. China Earth Sci. 55, 940–948. doi:10.1007/s11430-012-4366-7
Sorjonen-Ward, P., Zhang, Y., and Zhao, C. B. (2002). Numerical modelling of orogenic processes and gold mineralisation in the southeastern part of the Yilgarn Craton, Western Australia. Aust. J. Earth. Sci. 49, 935–964. doi:10.1046/j.1440-0952.2002.00969.x
Tang, H., Zheng, J., Yu, C. M., Ping, X. Q., and Ren, H. W. (2014). Multistage crust–mantle interactions during the destruction of the North China craton: Age and composition of the early cretaceous intrusions in the Jiaodong Peninsula. Lithos 190, 52–70. doi:10.1016/j.lithos.2013.12.002
Wang, S. F., Wang, K., Ma, F. S., and Lu, R. (2020a). Optimization of three-underground mining technology and disaster prevention in Sanshandao gold mine. Gold Sci. Technol. 28 (5), 734–741.
Wang, S. R., Yang, L. Q., Cheng, H., Li, D. P., Shan, W., and Yuan, J. J. (2020b). Effect of basement structure on the spatial distribution of gold deposits: Structure stress transfer modeling of Jiaojia fault. Acta Pet. Sin. 36 (5), 1529–1546. doi:10.18654/1000-0569/2020.05.13
Wang, S. R., Yang, L. Q., and Kong, P. F. (2016). Permeability structure and gold deposits cluster mechanism along the Jiaojia fault, China: Structure stress transfer modeling. Acta Pet. Sin. 32 (8), 2494–2508.
Wang, S. R., Yang, L. Q., Wang, J. G., Wang, E. J., and Xu, Y. L. (2019). Geostatistical determination of ore shoot plunge and structural control of the sizhuang world-class epizonal orogenic gold deposit, Jiaodong Peninsula, China. Minerals 9 (4), 214. doi:10.3390/min9040214
Wang, Y., Zhou, Y. Z., Xiao, F., Wang, J., Wang, K. Q., and Yu, X. T. (2020c). Prenatal diagnosis of duchenne muscular dystrophy revealed a novel mosaic mutation in dystrophin gene: A case report. Geotect. Metallog. 44 (2), 222–230. doi:10.1186/s12881-020-01157-0
Wen, B. J., Fan, H. R., Hu, F. F., Liu, X., Yang, K. F., Sun, Z. F., et al. (2016). Fluid evolution and ore Genesis of the giant Sanshandao gold deposit, Jiaodong gold province, China: Constrains from geology, fluid inclusions and H–O–S–He–Ar isotopic compositions. J. Geochem. Explor. 171, 96–112. doi:10.1016/j.gexplo.2016.01.007
Williams-Jones, A. E., Bowell, R. J., and Migdisov, A. A. (2009). Gold in solution. Elements 5, 281–287. doi:10.2113/gselements.5.5.281
Xiao, F., and Wang, K. Q. (2021). Faults and intrusion occurrence control on copper mineralization in dexing porphyry copper deposit in jiangxi, China: A perspective from stress deformation-heat transfer-fluid flow coupled numerical modeling. Earth Sci. Front. 28 (3), 190–207.
Xing, H. L., Makinouchi, A., and Zhao, C. B. (2008). Three-dimensional finite element simulation of large-scale nonlinear contact friction problems in deformable rocks. J. Geophys. Eng. 5, 27–36. doi:10.1088/1742-2132/5/1/003
Xu, W. G., Fan, H. R., Yang, K. F., Hu, F. F., Cai, Y. C., and Wen, B. J. (2016). Exhaustive gold mineralizing processes of the Sanshandao gold deposit, Jiaodong Peninsula, eastern China: Displayed by hydrothermal alteration modeling. J. Asian Earth Sci. 129, 152–169. doi:10.1016/j.jseaes.2016.08.008
Yang, J. H., Wu, F. Y., Wilde, S. A., Belousova, E., and Griffin, W. L. (2008). Mesozoic decratonization of the North China block. Geology 36, 467–470. doi:10.1130/g24518a.1
Yang, K. F., Fan, H. R., Santosh, M., Hu, F. F., Wilde, S. A., Lan, T. G., et al. (2012). Reactivation of the archean lower crust: Implications for zircon geochronology, elemental and Sr–Nd–Hf isotopic geochemistry of late mesozoic granitoids from northwestern Jiaodong terrane, the North China craton. Lithos 146–147, 112–127. doi:10.1016/j.lithos.2012.04.035
Yang, K. F., Zhu, J. T., Cheng, S. H., Liu, X., Jiang, P., and Fan, H. R. (2017). Structural controls of the Sanshandao gold deposit in the northwestern Jiaodong district, China. Geotect. Metallogenia 41 (2), 272–282.
Yang, L. Q., Deng, J., Guo, L. N., Wang, Z. L., Li, X. Z., and Li, J. L. (2016a). Origin and evolution of ore fluid, and gold deposition processes at the giant Taishang gold deposit, Jiaodong Peninsula, eastern China. Ore Geol. Rev. 72, 585–602. doi:10.1016/j.oregeorev.2015.08.021
Yang, L. Q., Deng, J., Song, M. C., Yu, X. F., Wang, Z. L., Li, R. H., et al. (2019). Structure control on formation and localization of giant deposits:An example of Jiaodong gold deposits in China. Geotect. Metallogenia 43 (3), 431–446.
Yang, L. Q., Deng, J., Wang, Z. L., Zhang, L., Goldfarb, R. J., Yuan, W. M., et al. (2016b). Thermochronologic constraints on evolution of the Linglong metamorphic core complex and implications for gold mineralization: A case study from the xiadian gold deposit, Jiaodong Peninsula, eastern China. Ore Geol. Rev. 72, 165–178. doi:10.1016/j.oregeorev.2015.07.006
Yang, L. Q., Deng, J., Wang, Z. L., Zhang, L., Guo, L. N., Song, M. C., et al. (2014). Mesozoic gold metallogenic system of the Jiaodong gold province, eastern China. Acta Petrol. Sin. 30, 2447–2467.
Zhang, L., Li, Z., Zhao, C. B., Lin., G., and Guo, H. D. (2011). Numerical simulation of the effects of upward throughflow on the thermal structure and the thickness of the continental lithosphere. J. Geophys. Eng. 8, 322–329. doi:10.1088/1742-2132/8/2/017
Zhang, L., Weinberg, R. F., Yang, L.-Q., Groves, D. I., Sai, S.-X., Matchan, E., et al. (2020). Mesozoic orogenic gold mineralization in the Jiaodong Peninsula, China: A focused event at 120±2 Ma during cooling of pregold granite intrusions. Econ. Geol. 115 (2), 415–441. doi:10.5382/econgeo.4716
Zhang, Y. H., Schaubs, P. M., Zhao, C. B., Ord, A., Hobbs, B. E., and Barnicoat, A. C. (2008). Fault-related dilation, permeability enhancement, fluid flow and mineral precipitation patterns: Numerical models. Geo. Soc. Lond. Spec. Pub. 299, 239–255. doi:10.1144/sp299.15
Zhao, C. (2015). Advances in numerical algorithms and methods in computational geosciences with modeling characteristics of multiple physical and chemical processes. Sci. China Technol. Sc. 58, 783–795. doi:10.1007/s11431-015-5784-5
Zhao, C. (2009). Dynamic and transient infinite elements: Theory and geophysical, geotechnical and geoenvironmental applications. Berlin, Germany: Springer.
Zhao, C., Hobbs, B. E., and Ord, A. (2021). An accurate porosity-velocity-concentration approach for solving reactive mass transport problems involving chemical dissolution in fluid-saturated porous media with arbitrarily initial porosity distributions. Int. J. Numer. Meth. Eng. 122, 7354–7377. doi:10.1002/nme.6833
Zhao, C., Hobbs, B. E., and Ord, A. (2008b). Convective and advective heat transfer in geological systems. Berlin, Germany: Springer.
Zhao, C., Hobbs, B. E., and Ord, A. (2009). Fundamentals of computational geoscience: Numerical methods and algorithms. Berlin, Germany: Springer.
Zhao, C., Hobbs, B. E., and Ord, A. (2008a). Investigating dynamic mechanisms of geological phenomena using methodology of computational geosciences: An example of equal-distant mineralization in a fault. Sci. China Earth Sci. 51, 947–954. doi:10.1007/s11430-008-0070-z
Zhao, C., Hobbs, B. E., and Ord, A. (2018). Modeling of mountain topography effects on hydrothermal Pb-Zn mineralization patterns: Generic model approach. J. Geochem. Explor. 190, 400–410. doi:10.1016/j.gexplo.2018.04.004
Zhao, C., Hobbs, B. E., and Ord, A. (2022a). Semi-analytical finite element method for simulating chemical dissolution-front instability problems in fluid-saturated porous media. Eng. Comput. 39, 1781–1801. doi:10.1108/ec-05-2021-0286
Zhao, C., Hobbs, B. E., and Ord, A. (2015). Theoretical analyses of chemical dissolution-front instability in fluid-saturated porous media under non-isothermal conditions. Int. J. Numer. Anal. Mater. 39, 799–820. doi:10.1002/nag.2332
Zhao, C., Hobbs, B. E., and Ord, A. (2010). Theoretical analyses of nonaqueous-phase-liquid dissolution induced instability in two-dimensional fluid-saturated porous media. Int. J. Numer. Anal. Mater. 34, 1767–1796. doi:10.1002/nag.880
Zhao, C., Hobbs, B. E., and Ord, A. (2022b). Two different mathematical schemes for solving chemical dissolution-front instability problems in fluid-saturated rocks. Sci. China Technol. Sc. 65, 147–156.
Zhao, C., Lin, G., Hobbs, B. E., Wang, Y. J., Mühlhaus, H. B., and Ord, A. (2002). Finite element modelling of reactive fluids mixing and mineralization in pore-fluid saturated hydrothermal/sedimentary basins. Eng. Comput. 19, 364–387. doi:10.1108/02644400210423990
Zhao, C. (2014). Physical and chemical dissolution front instability in porous media: Theoretical analyses and computational simulations. Heidelberg, Germany: Springer.
Keywords: ore-forming processes, computational simulation, gold distribution pattern, mineralization rate, Sanshandao-Haiyu gold belt
Citation: Shan W, Mao X, Liu Z, Deng H, Tang L, Wang D, Pan Y and Liu Y (2023) Computational simulation of the ore-forming processes associated with the Sanshandao-Haiyu gold belt, Jiaodong Peninsula, eastern China: implications for the duration of ore formation. Front. Earth Sci. 11:1154945. doi: 10.3389/feart.2023.1154945
Received: 03 February 2023; Accepted: 10 May 2023;
Published: 24 May 2023.
Edited by:
John Mavrogenes, Australian National University, AustraliaReviewed by:
Hong-Rui Fan, Chinese Academy of Sciences (CAS), ChinaXunyu Hu, China University of Mining and Technology, China
Fan Xiao, Sun Yat-sen University, China
Copyright © 2023 Shan, Mao, Liu, Deng, Tang, Wang, Pan and Liu. This is an open-access article distributed under the terms of the Creative Commons Attribution License (CC BY). The use, distribution or reproduction in other forums is permitted, provided the original author(s) and the copyright owner(s) are credited and that the original publication in this journal is cited, in accordance with accepted academic practice. No use, distribution or reproduction is permitted which does not comply with these terms.
*Correspondence: Xiancheng Mao, bXhjQGNzdS5lZHUuY24=; Zhankun Liu, emtsaXUwMzIyQGNzdS5lZHUuY24=