 Fahad Alshehri
 Kamal Abdelrahman
- 1Abdullah Alrushaid Chair for Earth Science Remote Sensing Research, Geology and Geophysics Department, College of Science, King Saud University, Riyadh, Saudi Arabia
- 2Department of Geology and Geophysics, College of Science, King Saud University, Riyadh, Saudi Arabia
The Wadi Fatimah area suffers from a lack of freshwater resources, so this study aimed to analyze the groundwater in this region and evaluate its quality for irrigation and drinking purposes. Eleven water quality parameters, including pH, total dissolved solids (TDS), Ca2+, HCO−3, NO−3, F−, Cl−, K+, Mg2+, SO2−4, and Na+, were utilized to evaluate the quality of the water and produce a water quality index (WQI). These parameters were measured at 100 different chosen locations. The spatial distribution map revealed that all parameters are high in the southern part except K+. Using the correlation matrix, a high positive correlation is obtained among TDS, Cl−, Mg2+, and Ca2+ in addition to a high correlation among TDS with Cl− and Na+. From PCA analysis, PCA1, PCA2, and PCA3 represent about 52%, 12%, and 10% of all components along the study area, respectively. PCA1 has low variance than PCA2 and PCA3. The majority of the Southern region’s sites went from having extremely poor to poor water classifications and from poor to unsuitable water. However, the center part possesses exceptionally high-quality groundwater. According to the results from the current study’s water quality index, the presence of nitrate and fluoride in the groundwater samples was primarily responsible for their high WQI values. The statistics showed that a higher percentage of the population had poor drinking water due to direct pollutant release, agricultural effects, and excessive groundwater resource use. The study offers a groundwater quality modeling technique that is both affordable and replicable in other areas.
1 Introduction
Less frequent rainfall and high evaporation rates in arid regions, like Saudi Arabia’s dry soil, can lead to fractionation processes that have a big impact on the chemistry of shallow groundwater (Reddy et al., 2012; Verma et al., 2020). This is true of the alluvium deposits in the Kingdom’s western region (Sharaf and Hussein, 1996). Certain hydrochemical processes may have an impact on the ionic composition of groundwater as it moves from recharge areas to discharge areas and interacts with rock minerals. The majority of earlier studies on the major wadis in the Western Region noted that the main determinants of groundwater salinity are rock types and agricultural practices. Actually, the middle and lower reaches of the wadis were the focus of this research (e.g., Memon et al., 1984; A1-Kabir, 1985; Sharaf et al., 1988; Jamman, 1978; A1-Khatib, 1977; Alyamani and Hussain, 1995; Sharaf, 2013). However, studies on these locations have generally focused on evaluating the hydrochemical conditions, paying little attention to the groundwater chemistry or the main source of recharge in the higher catchment areas, where processes and products can be recognized with the greatest ease (Sharaf and Hussein, 1996). The groundwater composition in upstream regions would resemble that of rain that falls on recharge zones (Abdel-Sattar et al., 2017). Such investigations, which are essential, can offer extra valuable information regarding the chemistry of groundwater’s evolution.
Due to the rapid urbanization process, population growth, and increase in anthropogenic activities, groundwater represents the most important freshwater for human drinking purposes. Agricultural, industrial, and domestic activities are major sources of groundwater pollution worldwide (Bi et al., 2021). Groundwater degradation is mostly caused by changes in its quality parameters beyond normal variations brought on by the addition or removal of various contaminants (Todd, 2001). Unfortunately, this resource is under threat from urban, modern agricultural, and industrial operations, as well as from the rising amount of soluble chemical input they produce (Aydi et al., 2013). As a result, the quality of the water is determined socially based on its intended or desired use. The continual monitoring of water quality is the most important phase in the management of water resources not only for human survival but also for the integrity of entire ecosystems. Different water quality requirements are established for various uses, and these standards are upheld through ongoing water quality monitoring (Shabbir and Ahmad, 2015). Determining the quality of the groundwater has become essential for the long-term development of fresh groundwater aquifers in Faisalabad because of the city’s numerous enterprises. Understanding the spatial distribution of environmental characteristics is essential for assessing the water quality (Solangi et al., 2018). In order to support such monitoring efforts, accurate and flexible instruments are required because monitoring is expensive, especially for large groundwater areas (Wong et al., 2021). The potential cost is further reduced by using modular technologies, like a geographic information system (GIS), because fewer observation wells are needed to evaluate the groundwater quality throughout the entire region (Verma et al., 2020). One of the most often used methods for classifying and reflecting the condition of water quality in a particular location (WQI) is the GIS-based water quality index (Mahmood et al., 2011). A helpful method for maintaining water quality is the mapping of water quality indices within the GIS. It is useful to provide three-dimensional patterns in water quality variation in order to better comprehend the current situation regarding the numerous parameters of the water quality studied. Several researchers from different countries have utilized the WQI to evaluate the water quality in that area (Arkoç, 2016).
Facilitating the unified environmental simulation models using the GIS requires more effective data processing and specialized solutions. The internet, global positioning systems, and remote sensing, among other techniques for obtaining and producing data, have all advanced (Sweeney, 1997). In arid and semiarid regions of the world where the populace and industry are strongly dependent on this irreplaceable resource, the groundwater quality evaluation for public health is crucial. The study’s objective is to assess the groundwater quality in the Wadi Fatimah area using various physiochemical indicators and then to use the WQI to produce a distributed-scale geospatial water quality map. The objectives of this work are to 1) conduct a laboratory-scale assessment of the groundwater quality by gathering physiochemical data for a few parameters and 2) weighted overlay the physiochemical features in ArcGIS to obtain the WQI.
Together with population growth, groundwater demand is rapidly increasing and climate change is further taxing water resources. Notwithstanding the importance of drinking water to the local population’s health in underdeveloped countries and the fact that groundwater is frequently the main source of drinking water, it is important to consider the water’s chemical purity (Alsuhaimi et al., 2019; Ahmed et al., 2020; Metta et al., 2020; Nwankwo et al., 2020; Panneerselvam et al., 2020; Singh et al., 2020; Salem et al., 2022). The groundwater monitoring network provides data on potential measures and when to adjust the settings for our water management system. Comparative studies should highlight the various components of groundwater and their effects on human health. The study’s objectives are to comprehend the existing groundwater quality conditions in the relevant locations, including the sources of pollution, and to develop a particular dataset for chemometric-based future research. The study also intends to grasp the ecological circumstances of the close-by regions while comprehending groundwater’s appropriateness for irrigation and understanding its household and commercial application utilizing certain water quality indices. The results of the study will serve as a baseline for further research in Wadi Fatimah and surrounding areas, including the strengthening of groundwater management standards, leading to more sustainable decision-making and a reduction in the region’s groundwater and environmental pollution issues.
2 Materials and methods
2.1 Study area
The western portion of Saudi Arabia’s Makkah region is where Wadi Fatimah is located. The recharge zones are close to Taif province. Two examples of cities that are next to a wadi are Jamoum and Bahrah. Figure 1 illustrates the general area, which is approximately 4,050 km2 in size and spans a distance of 250 km from the Taif mountains to the Red Sea coastal plain. According to Walter et al. (1975), Harnickell, and Mueller-Dombois, the study location is in a region with a subtropical dry climate, which is distinguished by hot summers and mild winters (1975). The maximum average temperature for the year is 31.2°C, with July being the hottest month with a maximum average temperature of 36.25°C. January is the coldest winter month with a maximum average temperature of 24.12°C. With an average annual precipitation of 84 mm/year and a monthly mean that varies from 0 mm in June to 25.5 mm in November, rainfall is scarce and unreliable. The Precambrian plutonic rocks that make up Wadi Fatimah are found inside the Makkah Quadrangle, along with some Tertiary volcanic rocks and Quaternary clastic deposits.
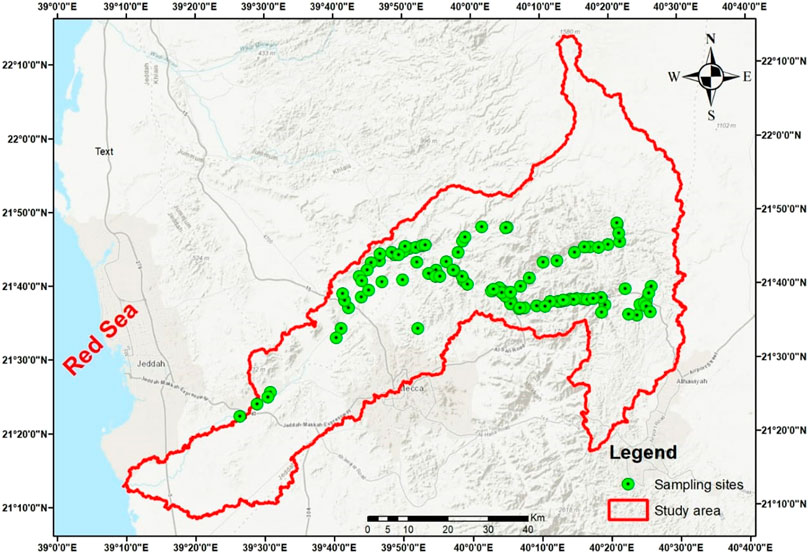
FIGURE 1. Geographical location of Wadi Fatimah, KSA, and sampling locations.
2.2 Hydrogeological settings
Since geology governs how aquifers recharge, geology is regarded as a key determinant of their hydrogeological properties (Ganapuram et al., 2009). Figure 2 shows the geology map of Wadi Fatimah. According to the thoroughly studied geological map, Wadi Fatimah is a sedimentary basin with a diversity of geological components, spanning from Quaternary to Jurassic formations with a predominance of Tertiary formations. The study area’s center is taken up by granite. The Fatimah basin’s Quaternary wadi fill deposits range in thickness from 10 to 20 m upstream to roughly 80 m downstream. These deposits are made up of mudstones, sandstones, and conglomerates. Another good location for groundwater preservation is Wadi Fatimah, whose bedrock is made up of severely worn, fractured Arabian Shield igneous and metamorphic rocks (Sharaf et al., 2004). Additionally, the porosity of this shallow aquifer ranges from 14% to 30%, and its average transmissivity is 140 m2/day. Its average storativity is similarly 0.1 (Jamman, 1978; Es-Saeed et al., 2004). These characteristics collectively show that the aquifer is unconfined and shows moderate potential. As the geology affects groundwater penetration, the ranks were assigned accordingly. Quaternary, thus, obtained the best rating, whereas Jurassic received the worst.
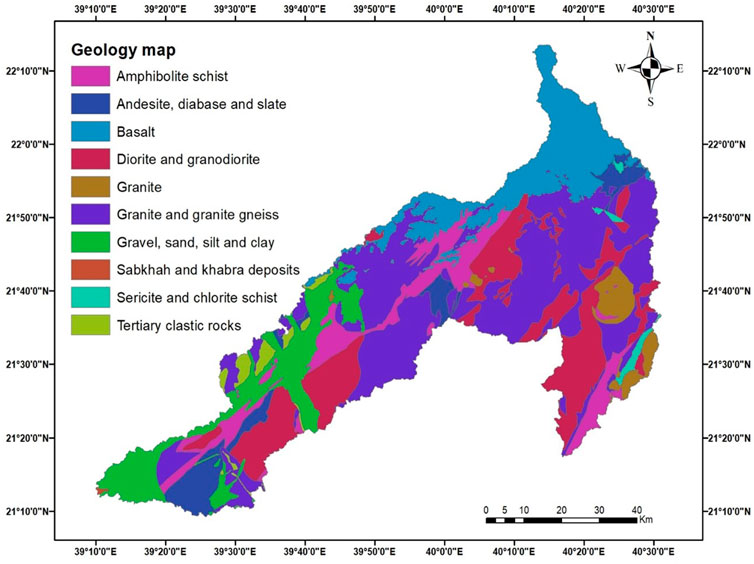
FIGURE 2. Geology map of Wadi Fatimah.
The Fatimah catchment’s entire surface area is approximately 4,650 km2, and it almost perfectly parallels the Red Sea from east to west. Jado and Zotl (1984) claimed that following the intense rains that fall on the higher portions of the Arabian Shield, the deeply cut gorges serve as the gathering pathways for greater floods. In the southwest corner of this wadi, these chasms (deep fissures) rise to elevations of more than 2,000 m above sea level. Groundwater recharge spots can be found in main and sub-catchments because surface characteristics are among the most crucial controlling variables for rainwater dispersion across the catchment. The Fatimah catchment area is seen on the topographic map in Figure 3, and it is clear that the catchment’s highest peaks are in its northeastern region, close to the Hijaz Escarpment. Different lithologies, tectonic movements, weathering, erosion, climatic influences, and geological formations are what determine the surface features. Additional elevational variations have been caused by the Harrat Rahat basalt explosions, particularly in the northeastern catchment zones.
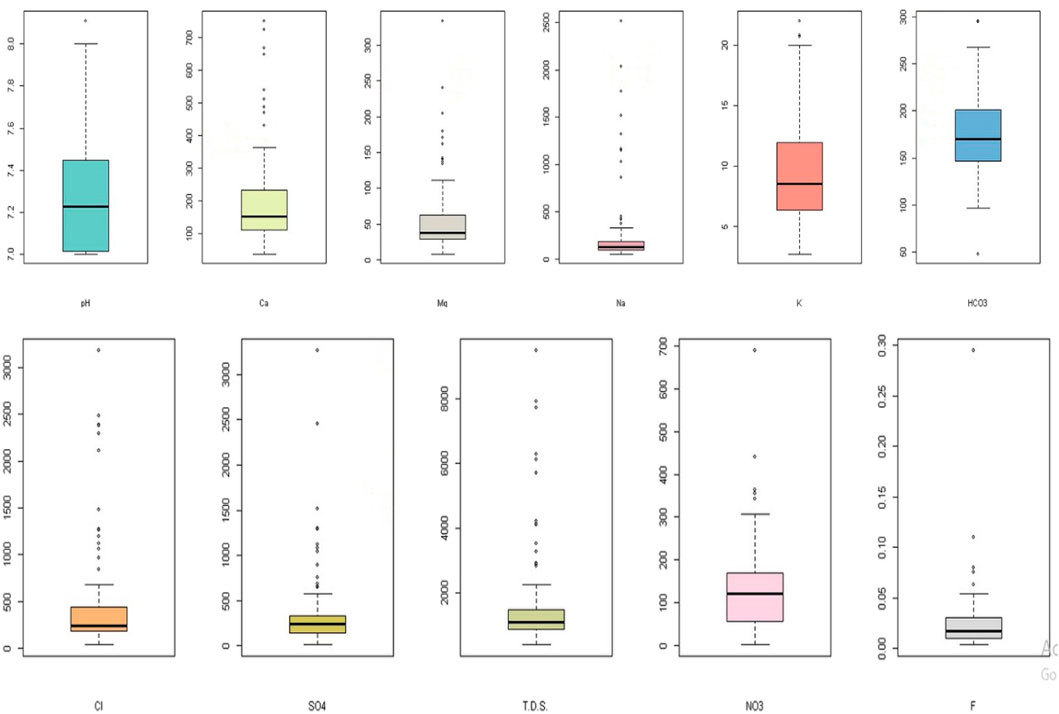
FIGURE 3. Box diagram of all parameter concentrations in groundwater.
In general, the catchment area can be thought of as having three distinct elevations: the coastal area, which has elevations less than 100 m; the middle area, which has elevations between 100 m and 600 m; and finally, higher elevations, which include the edges of the Hijaz Escarpment, which have elevations greater than 600 m. Groundwater flow routes also follow a similar pattern based on this classification. According to this structure, the shallowest alluvium fills are found at high elevations and include relatively coarse grains, whereas the alluvium thickness increases toward the lower reaches and contains smaller grains.
The sub-basins of the Fatimah catchment exhibit typical characteristics of arid or semiarid environments, including multiple segments of ephemeral flow systems that are shallow and narrow and have irregular recharges. In the region of the Harrat Rahat basaltic area in the northeast and close to the Hijaz Escarpment in the east, this catchment contains steep slopes with significant running water energy, which reduces toward the lowlands where thick silt accumulations occur. Since higher places are predicted to have larger values of hydraulic conductivity than other locations, these locations are predicted to have high groundwater seepages in the longitudinal direction. Along the whole wadi, the aquifer thickness in this location is the thinnest.
3 Data collection and analysis
A total of 100 sampling locations were selected to map the groundwater quality (Figure 1). A variety of wells were used to collect samples of the groundwater used for agriculture, drinking water, and other domestic and industrial uses. Prior to collecting the samples, polypropylene containers were thoroughly washed multiple times with the sample water. All of the water samples were kept in a cooler filled with ice while the fieldwork was being performed. The samples were stored in a refrigerator in the lab, which was kept at a temperature of 2°C–4°C. The increased temperature of the circulation, which causes a greater degree of mineral breakdown, and the mixing of fresh, shallow groundwater with deeper saline water, as can be observed on Piper and Durov plots, can be linked to the high TDS of the geothermal samples (Alshehri et al., 2022). All reasonable measures were made to reduce contamination during sample collection and processing. According to the American Public Health Association, these samples were collected and examined for several physiochemical factors (APHA, 1998) using standard methods. The parameters which were analyzed included pH, total dissolved solids (TDS), Ca2+, HCO−3, NO−3, F−, Cl−, K+, Mg2+, Na+, and SO2−4. K+ and Na+ were determined using a flame photometer. Ca2+, Mg2+, Cl−, and HCO−3 were analyzed by the titrimetric method. SO2−4 was determined using a digital spectrophotometer.
3.1 Data analysis using the GIS
The sampling sites were taken using portable GPS. Through a point layer, the various sampling sites were loaded into GIS software. A unique code was given to each sample point and entered into the point attribute table. All chemical parameter values and sample codes for each sampling site were separated into separate columns in the database file. The geodatabase was used to construct the spatial distribution maps for a number of water quality metrics, including the water quality index (WQI) for drinking water. Using the inverse distance weighted (IDW) raster interpolation method, the spatial analyst module of ArcGIS 10.8 was used to depict the spatial distribution of various water pollutants (Kumar et al., 2007).
3.2 Water quality index
The water quality index (WQI) has been calculated in three steps using weighed arithmetic index techniques (Ramakrishnaiah et al., 2009; Akter et al., 2016). First, as shown in Table 1, the water quality parameters that have been selected and given weights are essential for establishing the quality of drinking water. The metrics MPN and nitrate both received the maximum weight of five because of their significant roles in the WQI. When calculated with a minimum weight of 1, it was found that potassium and total hardness cannot be damaging to people’s health. The next step involves calculating Wi (relative weight) using the following formula.
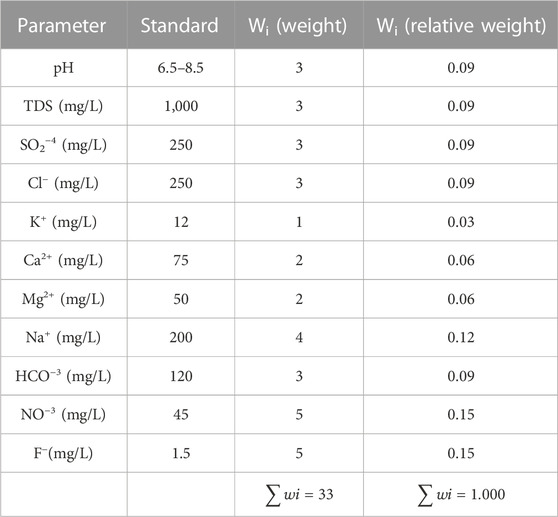
TABLE 1. Relative weight for the chosen parameters and the weight assigned.
In this case, Wi denotes relative weight, Wi denotes the weight of each chosen water quality parameter, and n is the total number of water quality parameters. Table 1 displays the computed Wi (relative weight) values for each water quality indicator. In the third stage, the qi (quality rating scale) for each specific water quality parameter is computed by dividing the observed value in the relevant water sample by the standard specified in the (BIS, 2012) drinking water guidelines and then multiplying the result by 100.
Quality rating is determined by qi, and the concentration of specific chemical (Ci) traits in each sample of water measured in mg/L, as well as SI, is based on the WHO standard (BIS, 2012) recommendations. First, SI is calculated for each chemical parameter in order to calculate the WQI by multiplying the quality rating by the relative weight. Next, the sum of the sub-indices is used to calculate the WQI using the following formula:
Here, the ith water quality parameter is the sub-index (SIi) and the rating qi is based on the concentration of the ith parameter and the total number of water quality parameters (n) used to calculate the GWQI. According to Table 2, the GWQI values are divided into five categories, from “Excellent water” to “Water unsuitable for drinking.”
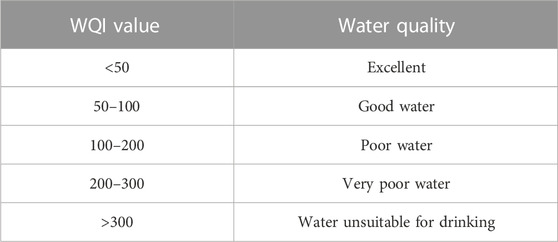
TABLE 2. Groundwater classification using the water quality index.
3.3 Statistical analysis
In environmental studies, multivariate statistics are typically used to categorize and evaluate soil characteristics. The data can be condensed, unified, and categorized using multivariate approaches in order to extract meaningful information. The method can also be used to explain temporal and spatial variations caused by connections between seasonality and outside factors, both natural and artificial. The data gathered for the groundwater samples were evaluated using principal component analysis. The most popular method for converting the original variables into new, uncorrelated variables (axes), or principal components is principal component analysis (PCA). PCA allows for the straightforward accounting of data variations (Pop et al., 2009). PCA has been used to evaluate the salinity and alkalinity of soil (Mohamedou et al., 1999). The relationships in the original data are maintained while providing essential information for the entire data set.
4 Results and discussion
4.1 Physicochemical parameters
According to the physicochemical analysis of major groundwater quality parameters of the 100 groundwater samples in Wadi Fatimah, the WQI was calculated, as shown in Table 3. The value of pH ranges from 7 to 8.11 with a mean value of 7.2. The pH level was largely constant due to the low S.D. value (0.2). The groundwater quality is important because it is the main factor in determining whether it is suitable for drinking (Kumar et al., 2007). Although it has no direct impact on consumers, one of the most important indicators of water quality is often its pH. Typically, the needed optimal pH ranges from 7.0 to 8.5 (World Health Organization, 2004). The value of Ca2+ ranges from 36.4 to 750.2 with a mean value of 202. The value of Mg2+ ranges from 7.8 to 334 with a mean value of 58. The value of Na+ ranges from 50 to 2,520 mg/L with a mean value of 281 mg/L. The value of K+ ranges from 2.7 to 22 mg/L with a mean value of 9.7 mg/L. The value of HCO3− ranges from 47.8 to 295.5 with a mean value of 175.6. The value of Cl− ranges from 41.8 to 3,180 mg/L with a mean value of 482.03 mg/L. The value of SO42− ranges from 18.5 to 3,264 mg/L with a mean value of 385.85 mg/L. The value of TDS ranges from 411 to 9,488 mg/L with a mean value of 1714.29 mg/L. The value of NO−3 ranges from 2.04 to 690 mg/L with a mean value of 137.14 mg/L. The value of F− ranges from 0.004 to 0.295 mg/L with a mean value of 0.03 mg/L. The box diagram of all parameters in the groundwater of Wadi Fatimah water is shown in Figure 3. Based on Figure 4, there is a high positive correlation among TDS, Cl−, Mg2+, and Ca2+ in addition to a high correlation among TDS with Cl− and Na+.
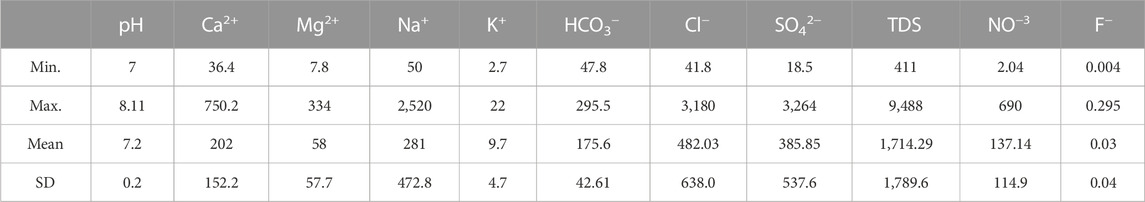
TABLE 3. Physico-chemical parameter statistics for groundwater samples.

FIGURE 4. Correlation among all parameter concentrations in groundwater.
4.2 Principal component analysis
From PCA analysis, PCA1, PCA2, and PCA3 represent about 52, 12, and 10% of all components along the study area, respectively. PCA 1 has low variance than PCA2 and PCA3. Based on these data, three components were selected for further analysis, as shown in Figure 5. In addition, it was shown that TDS, Cl−, Mg2+, Na+, and Ca2 are correlated with each other and less correlated with K+.in the present study; seawater intrusion is the source of high release of cations and anions in Wadi Fatimah.
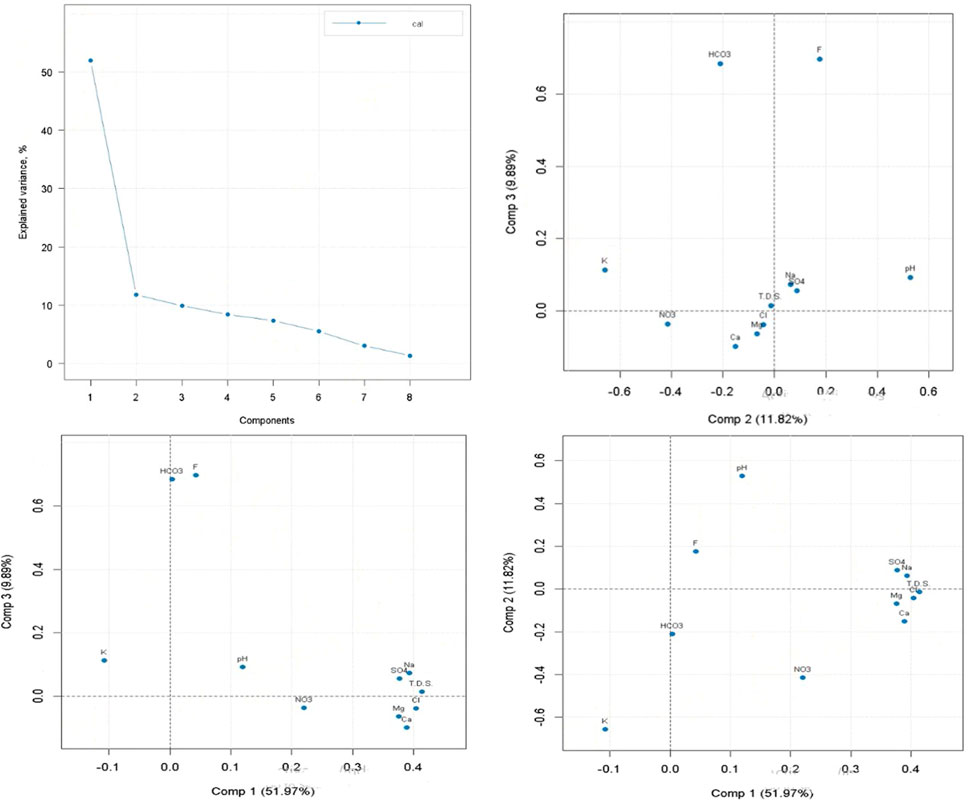
FIGURE 5. PCA components of all parameters in the groundwater of Wadi Fatimah.
4.3 Spatial analysis of groundwater quality
Figures 6A–C present the spatial distributions of pH, total dissolved solids (TDS), Ca2+, HCO−3, NO−3, Cl−, K+, Mg2+, Na+, and SO2−4. The pH values are very spatially heterogeneous in the present study as it tends to increase in the southern part of Wadi Fatimah. The southern portion of Wadi Fatimah was mostly home to regions with high TDS, Mg2+, Na+, and SO2−4 concentrations; on the other hand, K+ concentrations were low. It was shown that chloride concentrations exceeded the standard limit in some sampling locations. Cl− contamination from anthropogenic sources like industrial discharge may also be related to the high concentration of Cl− in water samples. Furthermore, nitrate exceeded the standard limit in some locations. Anthropogenic pollution is shown by the greater NO−3 content. Additionally, agricultural practices add NO−3 to groundwater, which lowers its quality (Cardona et al., 2004). Regular fertilizer applications on crop fields and a process that causes the nutrients to build up in groundwater are the two main causes of agricultural contamination of groundwater (Chae et al., 2004). Finally, due to greater groundwater extraction near the shore, seawater intrusion is more prevalent and a source of high cations and anions.
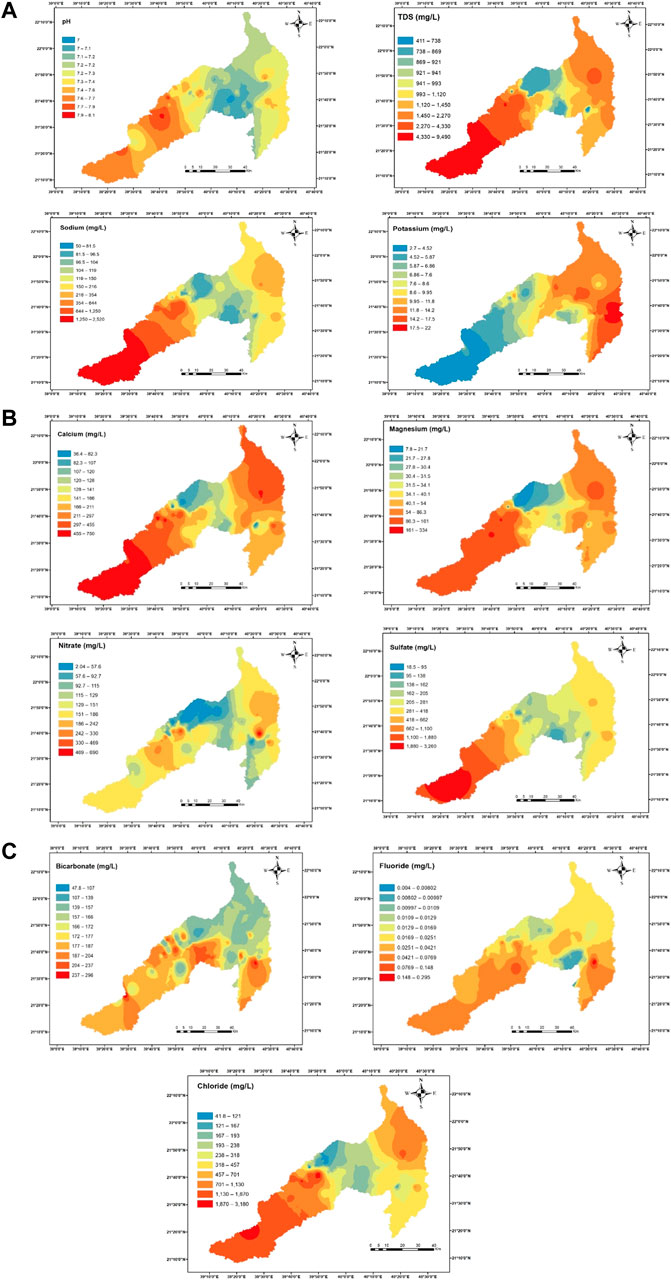
FIGURE 6. (A–C) Spatial distribution of physico-chemical parameters along the study area.
4.4 Water quality index
The quality of groundwater characteristics has been utilized to forecast the irrigation and drinking water quality (Subba Rao, 2006). In the current study in Wadi Fatimah, KSA, the WQI was chosen to ascertain whether the water is fit for drinking. For the computation of the WQI, many parameters were chosen and weights were assigned to each parameter based on the perceived influence on human health (Saeedi et al., 2010). Nitrate and fluoride have been assigned a maximum weight of 5 in accordance with WHO regulations (Srinivasamoorthy et al., 2008). According to how important they were in influencing the water quality, many other criteria were assigned a weight between 1 and 5. The groundwater samples’ computed WQI values were categorized, as stated in Table 2. As indicated in Figure 7, none of the groundwater samples were “excellent water,” only 33% were “good water,” and the remainder were “poor, extremely poor, and unsuitable for drinking water.” the spread of polluted water in Wadi Fatimah’s southern section. Groundwater quality is at risk due to industrial and municipal waste, according to Haq and Cheema (2011). The administration and authorities of Makkah City might utilize the created map to supervise a plan for discharging sewage water into Wadi Fatimah.
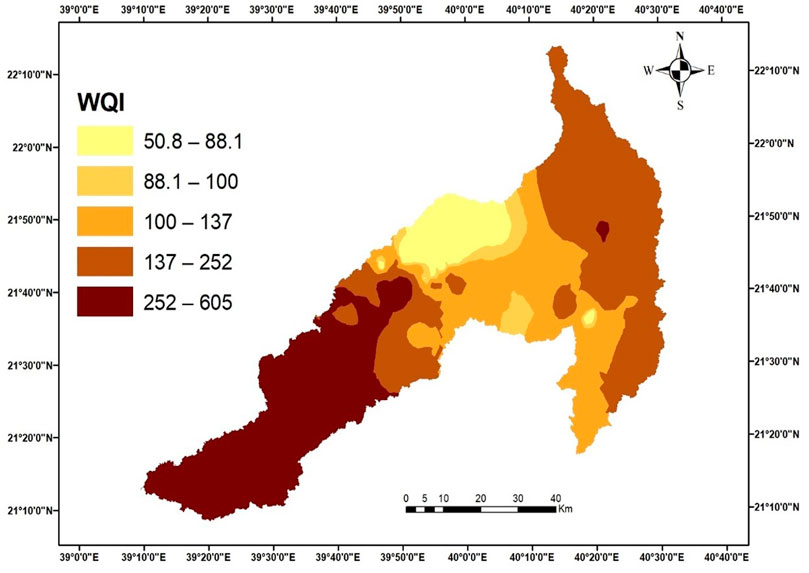
FIGURE 7. Water quality index spatial distribution.
Hydrologically, Wadi Fatimah and the nearby lands get sporadic rainfall, with the uppermost part of the wadi receiving a significant amount (170 mm/year) and the average annual rainfall not exceeding 60 mm. The Wadi Fatimah basin is filled with Quaternary sediments, whose thickness varies from 10 to 20 m upstream to roughly 80 m downstream (Sharaf, 2013). Both the underlying weathered Precambrian bedrock and the shallow Quaternary alluvial layers contain Wadi Fatimah’s groundwater. According to Hem (1970), Drever (1982), Appelo and Postma (1993), and Sharaf and Subyani (2011) found that the distribution of trace elements in the groundwater of Wadi Fatimah is primarily regulated by various processes and the groundwater has a wide range of chemical compositions. Wadi Fatima’s southern part was made up of areas with high concentrations of TDS, Mg2+, Na+, and SO2−4; on the other hand, K+ concentrations were low. The high content of Cl− in water samples may also be attributed to Cl− contamination from anthropogenic sources like industrial effluent. Because of the impending seawater intrusions, these samples show significantly salinized water (Sharaf et al., 2001). The groundwater in the Wadi Fatimah upstream sections has a normal salinity and is acceptable for irrigation purposes. The primary mechanisms changing the chemical composition of groundwater include evaporation, irrigation water recycling, and chemical weathering reactions of silicate minerals.
5 Conclusion
Most of the components of general water chemistry are somewhat provided by rainfall chemistry, which is also thought to be a significant source of Cl− and SO42− ions. The primary rock-forming minerals’ chemical weathering reactions can be a substantial long-term neutralizing process of the groundwater’s chemical composition, resulting in Mg2+, Ca2+, Na+, K+, and HCO3− ions and being significant for Mg2+ and Ca2+ ions. For irrigation and other human uses, groundwater is a significant source of freshwater. However, recently, the socioeconomic and health effects of groundwater contamination brought on by human activities from both point and non-point sources have gotten worse. The WQI is particularly effective and efficient when it comes to summarizing and reporting observed effects to policy authorities so they may better understand the state of groundwater quality today and have the chance to use it in the future in a more advantageous way. The results and analysis demonstrated the value of using the GIS to produce digital thematic layers and maps that display the spatial distribution of various water quality parameters. In the study area, the quality of the drinking water has significantly declined. The continuous discharge of industrial effluents from various firms, especially those without sewage treatment facilities, is thought to be the main reason for the prevalence of nitrate and fluoride. As a result, proper planning is necessary. A variety of treatment techniques should be utilized to get rid of heavy metals and other contaminants before releasing effluents into the environment. The current focus of the study is mostly on the groundwater quality; additional investigation is needed to examine the consequences for socioeconomics and health. The study’s conclusions can serve as a roadmap for groundwater management and pollution control in the study area and other places, according to water system operators and authorities.
Data availability statement
The original contributions presented in the study are included in the article/Supplementary Material; further inquiries can be directed to the corresponding author.
Author contributions
All authors listed have made a substantial, direct, and intellectual contribution to the work and approved it for publication.
Funding
The authors extend their appreciation to the Deputyship for Research & Innovation, “Ministry of Education” in Saudi Arabia for funding this research work through the project number (IFKSUDR_F157).
Conflict of interest
The authors declare that the research was conducted in the absence of any commercial or financial relationships that could be construed as a potential conflict of interest.
Publisher’s note
All claims expressed in this article are solely those of the authors and do not necessarily represent those of their affiliated organizations, or those of the publisher, the editors, and the reviewers. Any product that may be evaluated in this article, or claim that may be made by its manufacturer, is not guaranteed or endorsed by the publisher.
References
Abdel-Satar, A. M., Al-Khabbas, M. H., Alahmad, W. R., Yousef, W. M., Alsomadi, R. H., and Iqbal, T. (2017). Quality assessment of groundwater and agricultural soil in Hail region, Saudi Arabia. Egypt. J. Aquatic Res. 43 (1), 55–64. doi:10.1016/j.ejar.2016.12.004
Ahmad, A. Y., Al-Ghouti, M. A., Khraisheh, M., and Zouari, N. (2020). Hydrogeochemical characterization and quality evaluation of groundwater suitability for domestic and agricultural uses in the state of Qatar. Groundw. Sustain. Dev. 11, 100467. doi:10.1016/j.gsd.2020.100467
Akter, T., Jhohura, F. T., Akter, F., Chowdhury, T. R., Mistry, S. K., Dey, D., et al. (2016). Water quality index for measuring drinking water quality in rural Bangladesh: A cross-sectional study. J. Health, Popul. Nutr. 35, 4. doi:10.1186/s41043-016-0041-5
Al-Kabir, M. A. (1985). Recharge characteristics of groundwater aquifers in Jeddah, Makkah, Taif area. M.Sc. Thesis. Jeddah, Saudi Arabia: Faculty of Earth Sci., King Abdulaziz Uni.
Al-Khatib, E. A. B. (1977). Hydrogeology of usfan district. M.Sc. Thesis. Jeddah: Institute of Applied Geology. King Abdulaziz Univ., 302.
Alshehri, F., Zaidi, F. K., and Alzahrani, H. (2022). Hydrochemical characterization of geothermal and non-geothermal waters from Wadi Fatima, Western Saudi Arabia. J. King Saud Univ. . Sci. 34 (1), 101717. doi:10.1016/j.jksus.2021.101717
Alsuhaimi, A. O., Almohaimidi, K. M., and Momani, K. A. (2019). Preliminary assessment for physicochemical quality parameters of groundwater in Oqdus Area, Saudi Arabia. J. Saudi Soc. Agric. Sci. 18 (1), 22–31. doi:10.1016/j.jssas.2016.12.002
Alyamani, M. S., and Hussein, M. T. (1995). Hydrochemical study of groundwater in recharge area, Wadi Fatimah basin, Saudi Arabia. GeoJournal 37, 81–89. doi:10.1007/bf00814887
American Public Health Association (APHA) (1998). Standard methods for the examination of water and wastewater. 18th edn. Washington: MWWA&WPCF.
Appelo, C. A. J., and Postma, D. (1993). Geochemistry, groundwater and pollution. Rotterdam: Balkema.
Arkoç, O. (2016). Application of water quality index with the aid of geographic information system in eastern thrace to assess groundwater quality. Jeol. Mühendisli ˘gi Derg. 40, 189–208.
Aydi, W., Saidi, S., Chalbaoui, M., Chaibi, S., and Ben Dhia, H. (2013). Evaluation of the groundwater vulnerability to pollution using an intrinsic and a specific method in a GIS environment: Application to the plain of sidi bouzid (Central Tunisia). Arab. J. Sci. Eng. 38, 1815–1831. doi:10.1007/s13369-012-0417-9
Bi, P., Pei, L., Huang, G., Han, D., and Song, J. (2021). Identification of groundwater contamination in a rapidly urbanized area on a regional scale: A new approach of multi-hydrochemical evidences. Int. J. Environ. Res. Public Health 18, 12143. doi:10.3390/ijerph182212143
BIS (2012). Indian standard, DRINKING WATER-SPECIFICATION (second revision). New Delhi, New Delhi: Bureau of Indian Standards.
Cardona, A., Carrillo-Rivera, J. J., Huizar-Aolvarez, R., and Graniel-Castro, E. (2004). Salinization in coastal aquifers of arid zones: An example from santo domingo, baja California sur, Mexico. Environ. Geol. 45, 350–366. doi:10.1007/s00254-003-0874-2
Chae, G. T., Kim, K., Yun, S. T., Kim, K. H., Kim, S. O., Choi, B. Y., et al. (2004). Hydro geochemistry of alluvial groundwaters in an agricultural area: An implication for groundwater contamination susceptibility. Chemosphere 55, 369–378. doi:10.1016/j.chemosphere.2003.11.001
Es-Saeed, M., Şen, Z., Basamad, A., and Dahlawi, A. (2004). Strategic groundwater storage in wadi numan, Makkah region. Technical report-SGSTR-2004-1. Saudi Arabia: Saudi Geological Survey.
Ganapuram, S., Kumar, G. V., Krishna, I. M., Kahya, E., and Demirel, M. C. (2009). Mapping of groundwater potential zones in the Musi basin using remote sensing data and GIS. J. Adv. Eng. Softw. 40 (7), 506–518. doi:10.1016/j.advengsoft.2008.10.001
Haq, I., and Cheema, W. A. (2011). Adverse effects of poor wastewater management practices on ground water quality in rawalpindi and mitigation strategies. Avaliable At: http://www.wasa.rda.gov.pk/MD_Papers/Paper_for_Engineering_congress. pdf.
Hem, J. D. (1970). Study and interpretation of the chemical characteristics of natural waters. Geological Survey Water-Supply Paper 1473.
Jado, A. R., and Zotl, J. G. (1984). Quaternary Period in Saudi Arabia. Wien, New York: Springer-Verlag, 360.
Jamman, A. M. (1978). Hydrogeology of wadi naman, Saudi Arabia. M.Sc. Thesis. Jeddah: Faculty of Earth Sci., King Abdulaziz Uni, 132.
Kumar, M., Kumari, K., Ramanathan, A. L., and Saxena, R. (2007). A comparative evaluation of groundwater suitability for irrigation and drinking purposes in two intensively cultivated districts of Punjab, India. Environ. Geol. 5, 553–574. doi:10.1007/s00254-007-0672-3
Mahmood, A., Muqbool, W., Mumtaz, M. W., and Ahmad, F. (2011). Application of multivariate statistical techniques for the characterization of groundwater quality of Lahore, Gujranwala and Sialkot (Pakistan). Pak. J. Anal. Environ. Chem. 12, 102–112.
Matta, G., Nayak, A., Kumar, A., Kumar, P., and Tiwari, A. K. (2020). Determination of water quality of Ganga River System in Himalayan region, referencing indexing techniques. Arabian J. Geosciences 13, 1027. doi:10.1007/s12517-020-05999-z
Memon, B. A., Kazi, A., and Bazuhair, A. S. (1984). Hydrogeology of wadi Al-yammaniyah, Saudi Arabia. Ground Water 22 (4), 406–411. doi:10.1111/j.1745-6584.1984.tb01410.x
Mohamedou, A. O., Aventurier, A., Barbiero, L., Caruba, R., and Valles, V. (1999). Geochemistry of clay dunes and associated pan in the Senegal Delta, Mauritania. Arid. Soil Res. Rehabil. 13 (3), 265–280. doi:10.1080/089030699263302
Nwankwo, C. B., Hoque, M. A., Islam, M. A., and Dewan, A. (2020). Groundwater constituents and trace elements in the basement aquifers of Africa and sedimentary aquifers of Asia: Medical hydrogeology of drinking water minerals and toxicants. Earth Syst. Environ. 4, 369–384. doi:10.1007/s41748-020-00151-z
Panneerselvam, B., Paramasiva, S. K., Karuppannan, S., Ravichandran, N., and Selvaraj, P. (2020). A GIS-based evaluation of hydrochemical characterization of groundwater in hard rock region, South Tamil Nadu India. Arabian J. Geosciences 13 (17), 1–22. doi:10.1007/s12517-020-05813
Pop, H. F., Einax, J. W., and Srbu, C. (2009). Classical and fuzzy principal component analysis of some environmental samples concerning the pollution with heavy metals. Chemom. Intell. Lab. Syst. 97, 25–32. doi:10.1016/j.chemolab.2008.06.006
Ramakrishnaiah, C. R., Sadashivaiah, C., and Ranganna, G. (2009). Assessment of water quality index for the groundwater in tumkur taluk, Karnataka state, India. E-Journal Chem. 6, 523–530. doi:10.1155/2009/757424
Reddy, T. B., Ramana, C. V., Bhaskar, C., and Chandrababu, J. P. (2012). Assessment of heavy metal study on ground water in and around Kapuluppada MSW site, Visakhapatnam, AP IJSN 3 (2). 468–471.
Saeedi, M., Abessi, O., Sharifi, F., and Meraji, H. (2010). Development of groundwater quality index. Environ. Monit. Assess. 163, 327–335. doi:10.1007/s10661-009-0837-5
Salem, I. B., Nazzal, Y., Howari, F. M., Sharma, M., Mogaraju, J. K., and Xavier, C. M. (2022). Geospatial assessment of groundwater quality with the distinctive portrayal of heavy metals in the united Arab emirates. Water 14, 879. doi:10.3390/w14060879
Shabbir, R., and Ahmad, S. S. (2015). Use of geographic information system and water quality index to assess groundwater quality in rawalpindi and islamabad. Arab. J. Sci. Eng. 40, 2033–2047. doi:10.1007/s13369-015-1697-7
Sharaf, M. A., Farag, M. H., and Gazzaz, M. (1988). Groundwater chemistry of wadi uoranah-AI abdiah area, western province, Saudi Arabia. JKAU Earth Sci. 1, 103–112. doi:10.4197/ear.1-1.5
Sharaf, M. A., and Hussein, M. T. (1996). Groundwater quality in the saq aquifer, Saudi Arabia. Hydrol. Sci. J. 41 (5), 683–696. doi:10.1080/02626669609491539
Sharaf, M. A. M., Hussein, M. T., and Al-Bassam, A. M. (2001). Upconing and saline water intrusion and the need for water conservation in the lower part of wadi Fatimah, western Saudi Arabia. Water Res. Dev. 17 (2), 211–226. doi:10.1080/07900620120031270
Sharaf, M. A. M. (2013). Major elements hydrochemistry and groundwater quality of wadi Fatimah, west central arabian Shield, Saudi Arabia. Arab. J. Geosci. (2013) 6, 2633–2653. doi:10.1007/s12517-012-0544-3
Sharaf, M. A. M., and Subyani, A. M. (2011). Assessing groundwater contamination by toxic elements through multivariate statistics and spatial interpolation, wadi Fatimah, western arabian Shield, Saudi Arabia. Int. J. Sci. Eng. Res. 2, 9.
Sharaf, M. A. M., Alyamani, M. S., and Subyani, A. M. (2004). The regional study of the rare and trace elements in the groundwater of the major wadi basins (An Numan, Usfan, and Fatimah) in Western Saudi Arabia and their suitability for various purposes. Project No. (204/423). Saudi Arabia: King Abdulaziz University. Jeddah.
Singh, K. K., Tewari, G., and Kumar, S. (2020). Evaluation of groundwater quality for suitability of irrigation purposes: A case study in the udham Singh nagar uttarakhand. Hindawi J. Chem. 2020, 1–15. doi:10.1155/2020/6924026
Solangi, G. S., Siyal, A. A., Babar, M. M., and Siyal, P. (2018). Evaluation of surface water quality using the water quality index (wqi) and the synthetic pollution index (spi): A case study of indus delta region of Pakistan. Desalin. Water Treat. 118, 39–48. doi:10.5004/dwt.2018.22407
Srinivasamoorthy, K., Chidambaram, M., Prasanna, M. V., Vasanthavigar, M., John, P. A., and Anandhan, P. (2008). Identification of major sources controlling groundwater chemistry from a hard rock terrain—A case study from mettur taluk, Salem district, tamilnadu, India. J. Earth Syst. Sci. 117 (1), 49–58. doi:10.1007/s12040-008-0012-3
Subba Rao, N. (2006). Seasonal variation of groundwater quality in a part of Guntur District, Andhra Pradesh, India. Environ. Geol. 49, 413–429. doi:10.1007/s00254-005-0089-9
Verma, P., Singh, P. K., Sinha, R. R., and Tiwari, A. K. (2020). Assessment of groundwater quality status by using water quality index (WQI) and geographic information system (GIS) approaches A case study of the Bokaro district, India. Appl. Water Sci. 10, 27. doi:10.1007/s13201-019-1088-4
Walter, H., Harnickell, E., and Mueller-Dombois, D. (1975). Climate diagram maps. Berlin, Germany: Springer Verlag.
Wong, Y. J., Nakayama, R., Shimizu, Y., Kamiya, A., Shen, S., Rashid, I. Z. M., et al. (2021). Toward industrial revolution 4.0: Development, validation, and application of 3D-printed IoT-based water quality monitoring system. J. Clean. Prod. 324, 129230. doi:10.1016/j.jclepro.2021.129230
Keywords: groundwater, Wadi Fatimah, remote sensing, physiochemical parameters, IDW, WQI
Citation: Alshehri F and Abdelrahman K (2023) Integrated approach for the investigation of groundwater quality using hydrochemical and geostatistical analyses in Wadi Fatimah, western Saudi Arabia. Front. Earth Sci. 11:1166153. doi: 10.3389/feart.2023.1166153
Received: 14 February 2023; Accepted: 15 March 2023;
Published: 06 April 2023.
Edited by:
Ahmed M. Eldosouky, Suez University, EgyptReviewed by:
Shahfahad., Jamia Millia Islamia, IndiaFathy Shaaban, Umm al-Qura University, Saudi Arabia
Khaled Omar, National Research Institute of Astronomy and Geophysics, Egypt
Copyright © 2023 Alshehri and Abdelrahman. This is an open-access article distributed under the terms of the Creative Commons Attribution License (CC BY). The use, distribution or reproduction in other forums is permitted, provided the original author(s) and the copyright owner(s) are credited and that the original publication in this journal is cited, in accordance with accepted academic practice. No use, distribution or reproduction is permitted which does not comply with these terms.
*Correspondence: Fahad Alshehri, ZmFsc2hlaHJpYUBrc3UuZWR1LnNh