 Katarína Pukanská1
 Karol Bartoš1*
 Matúš Bakoň2,3
 Juraj Papčo4Lukáš Kubica4Ján Barlák3Martin Rovňák3
 Ľubomír Kseňak1
 Martina Zelenakova5
 Ihor Savchyn6Daniele Perissin7
- 1Institute of Geodesy Cartography and GIS, Technical University of Kosice, Košice, Slovakia
- 2Insar.sk Ltd, Presov, Slovakia
- 3Department of Finance, Accounting and Mathematical Methods, University of Presov, Presov, Slovakia
- 4Department of Theoretical Geodesy and Geoinformatics, Slovak University of Technology in Bratislava, Bratislava, Slovakia
- 5Department of Environmental Engineering, Technical University of Kosice, Kosice, Slovakia
- 6Institute of Geodesy, Lviv Polytechnic National University, Lviv, Ukraine
- 7RASER Limited, Hong Kong SAR, China
Salt deposits were a rich source of mineral resources in the past, and some are still mined today. However, salt mines, especially abandoned ones, pose a threat to populated areas, infrastructure and the natural environment. Solotvyno (Ukraine) is one of the most significantly affected areas, with a deformation zone where significant year-on-year subsidences occur. Mining activities have caused a disturbance of the balance in the mountain massif, and as a consequence, the mountains are being reshaped, and the land cover is deformed. Deformation zone of the historical salt mine Solotvyno (Ukraine), Tyachiv district of Zakarpattia region is situated on the right bank of the Tisza river in the border area with Romania in Central Europe. This paper deals with the multi-sensor monitoring of the active deformation zone over the Solotvyno salt mine using satellite radar data (Sentinel-1), optical satellite imagery (Pleiades, SPOT) and in-situ UAV photogrammetry. Since the area represents a significant geohazard from a hydrogeological (Tisza River) and civil security standpoints (infrastructure of the inhabited regions), the design of a high-precision monitoring system to monitor and evaluate current environmental changes is proposed. Multi-temporal InSAR analysis exposed steeper subsidence tendencies of >−2 cm in the central part of the monitored area. Optical satellite and UAV images confirmed the increase in water surface in sinkhole areas up to 28,500 m2 and proved the emergence of new sinkholes in the central part of the Solotvyno mine. The aim of this study is to describe the post-collapse deformation processes by Pleiades and SPOT multi-spectral sensors and Sentinel-1 satellite SAR sensors since the 2010 collapse in order to describe the trends of deformation due to undermining and propose a high-precision permanent monitoring system based on satellite radar interferometry (InSAR).
1 Introduction
Even after mining activities have ceased, landscape deformation is a problem in many regions. Land surface deformation endangers human lives and property by causing severe damage to both buildings and transportation infrastructure (Guzy and Witkowski, 2021). Mining development causes serious damage to land resources. Besides the mining industry and civil facilities raising damages by occupying land resources during the exploration process, the most devastating destruction was produced during the mine exploitation process (Yang et al., 2009). Aquifer deformation contributes to various socioeconomic effects and high infrastructure-related repair costs as a consequence of mining activity, even in long-abandoned mining operations, causing considerable environmental consequences. A new stress distribution occurs, and a shift of the mass point towards the mine work occurs also. The most frequently observed form of linear deformation is a step in the ground, connected with mining extraction led in a few coal seams to the same boundary, especially in the vicinity of tectonic faults. The most common form of surface-type deformations are sinkholes (Chudek and Strzałkowski, 2019), (Bali et al., 2021). In addition to subsidence movements, horizontal and vertical displacement of geological strata, subsidence of the formation, changes in slope, underground bending, cracking, collapse and tilting of surface structures can also occur, which can be fatal (Akcin et al., 2006).
The Transylvanian Basin is the site of a unique rock salt deposit, where layers of salt were deposited and later deformed by diapirism in the Carpathian Mountains. Salt deposits were a rich source of mineral resources in the past, and some are still mined today. However, salt mines, especially abandoned ones, pose a danger to populated areas, infrastructure and the natural environment. Solotvyno is one of the most affected areas where surface caves have collapsed. Within the fields of the flooded mines, karst-breakdown processes and subsidence of the ground surface are actively expanding. They have a long-term character in the conditions of increasing deformations of mine workings and humidification of the saline body (Trofymchuk et al., 2020). Salt dissolution as a negative consequence of mine subsidence is not only a local problem but, in the future, may cause problems on a regional scale. The infiltration of salts into the underground freshwater system of the Tisza River can cause serious ecological as well as economic damage (Molenka and Kidawa, 2022). The deformation model results show that the deformation rate is almost linear throughout the study area. The dramatic increase in the freshwater infiltration inflow and the related active development of technogenic karst caused the formation of destructive deformations of the land surface and rocks of the residential and industrial buildings foundation, roads and water-pumping networks of Solotvyno village (Trofymchuk et al., 2021). Around the main sinkhole, the maximum deformation rate is around 5 cm/year. To the south of the main deformation, there are boreholes that reach a higher rate of deformation. A deformation zone with an average deformation rate of 102 cm/year has been located in the area where small ponds are located, about 2 km from the production area (Szűcs et al., 2021).
The salt mines are located in the basin of the right-bank tributary of the Tisza River. The mining area is situated in the area of active infiltration of water sources. The susceptibility of the area to flood activity complicates and negatively influences the mining-geological and ecological-geological processes of mine management. The resulting increasing deformations are still active, and the land surface constantly subsides in the flooded mines. The impact of freshwater infiltration and active development of tectonic karst has caused the formation of destructive deformations of the ground surface and bedrock. The largest destructions occur mainly in the southern direction of the Tisza riverbed and north to the slope of the Magura mountains (Trofymchuk et al., 2020).
The Solotvyno Salt Anticline Structure (SSAS) area, with its eponymous rock salt deposit, which has been intensively developed since the end of the 18th century, has undergone significant technogenic influence. In the northeastern part of the field, there were old mines, ‘Kunigunda’, ‘Mykolay’, ‘Albert’, ‘Hrystyna’, and ‘Josyp’, which disappeared because they were flooded with water. It is obvious that the hydro geomechanical condition of the salt massif has changed significantly as a result of the development of the mines and all the above-mentioned objects (Yakovlev et al., 2016). Flooding of the underground mines began in 1908. This process led to the formation of Lake Kunigunda and later to the creation of new smaller lakes. The water that flooded the mines was pumped into the River Tisza by a number of pumps. However, with the transition to the new political regime, some of the mines were filled in and closed, and pumping out the water was highly economically inefficient. Therefore, pumping, as well as the reconstruction and maintenance of the mines, was suspended. The mines were flooded again, the salt slowly dissolved, and the land slowly subsided. In 2000, the land subsided, and several residential buildings were damaged (Onencan et al., 2018). The current hydrological situation is addressed in several scientific texts such as (Chonka et al., 2013), (Stoeckl et al., 2020), (Onencan et al., 2018).
As problems began to appear in its operating mines from the mid-1990s, it led to a dangerous man-made ecological situation, which reached the state level in 2010 (expert opinion of the Ministry for Emergency Situations of Ukraine dated 09.12.2010 No. 02-17292/165). As a result of this, mining works were stopped, salt production was terminated, as well as the operation of the underground department of the spelosanatorium of the Ukrainian Remediation Facilities and the laboratory of the Institute of Physics of the National Academy of Sciences of Ukraine was also terminated.
Currently, the deposit area is undergoing landscape degradation, relief destabilization and other hazardous man-made and geological processes that extend beyond the boundaries of the mining concession of the mines. Dangerous processes of karst formation are actively manifested in the area of mines no. 7-9. In addition, the erosion of the landscape, its degradation as a result of uncontrolled development of the salt karst, and pollution of surface and groundwater - all this gives neighbouring countries (Hungary, Romania) grounds for concern about the deterioration of the environmental parameters of the pollution of the Tisza River. In 2015, the Ministry of Foreign Affairs of Ukraine and the initiatives of several governmental structures and the Hungarian government initiated an appeal to the EU regarding the involvement of an EU expert mission to Ukraine to assess the threats and risks regarding this emergency. (Yakovlev et al., 2016).
1.1 Structure of the solotvyno dome, geological characteristics
The Solotvyno rock salt deposit is located in a subducted block in the south-southwestern extension of the Dibrovskaya and Solotvyno anticlines. According to the nature of the structure, the supra salt plain is close to the brachyanticlinal fold with a salt core. The thickness of salt in the anticlinal core is over 1,500 m. The inclination angles of the Solotvyno and Teresvyna rocks, which frame the shaft, are 40°–60°. The dip of the lateral wings of the salt massif is much steeper than the dip angles of the host rocks. The zone of lateral contact between the salt and host rocks is tectonic in nature, complicated by hypo- and exogenic processes, has zones of crushing, brecciation, fissures, etc., and represents potential and already realized pathways of groundwater and surface water migration.
The surface of the core structure of the salt-field structure is characterized by ruggedness (Yakovlev et al., 2016; Stoeckl et al., 2020), which is due to the erosional activity of the Tisza River, the water of alluvial terrace formations, small currents and atmospheric precipitation, recent neotectonic movements, as well as technogenic activity. The surface relief of the salt core structure has absolute features that range from 187 to 285 m. The internal structure of the SSAS core (Figure 1) is discordantly folded, block-lensed, represented by alternating layers and lenses of pure rock salt, salt with varying contents of water-insoluble residues, layers, beds, lenses and blocks of intra-salt terrigenous, salt-terrigenous and breccia layers.
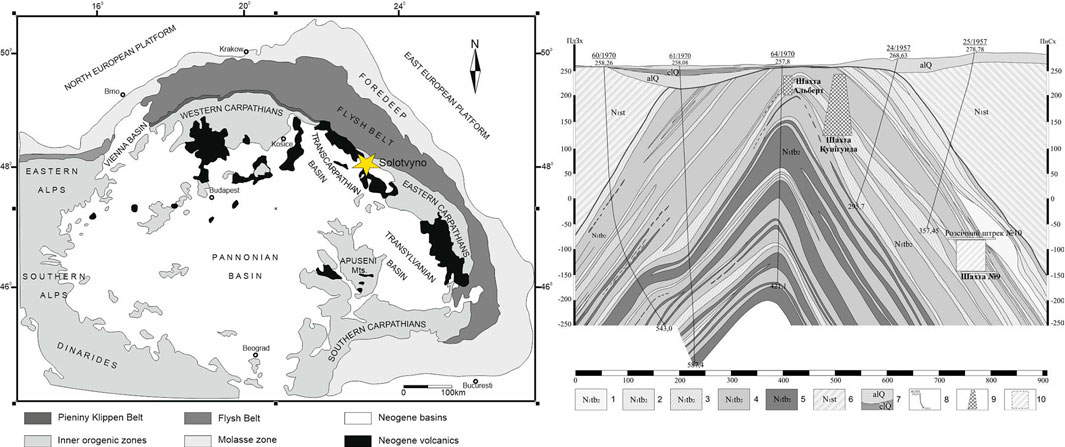
FIGURE 1. Main geological units distribution in Central Europe and geological sections of the Solotvyno rock salt deposit (Jacko et al., 2016; Yakovlev et al., 2016). 1—Tereblianska suite, alternating rock salt: white, water-insoluble residue (i.r.) content up to 2%; 2—tereblianska suite, alternating rock salt: white, light gray, content up to 2.5%; 3—Tereblianska suite, alternating rock salt: light gray and gray, content less than 3%; 4—Tereblianska suite, alternating rock salt: gray, earthy, content more than 3%; 5—Tereblianska suite, alternating: clays, mudstones; 6—Solotvynska site. Alternating: siltstone mudstone, sandstone and tuff; 7– Quater sediments, alternating: boulder-gravel beds and clay; 8—borehole; 9—old mine outline; 10—mine no. Nine outline.
1.2 Aims of the research
The aim of this research is a multi-sensor and multi-temporal approach in monitoring of deformation zone with permanent monitoring solution and management of environmental changes in the Solotvyno mining area. Many studies focusing mainly on sinkhole formation have been published in the field of defining surface deformation in the Solotvyno Salt Mine, forecasting, and development, accompanied by surface deformation processes (Yakovlev et al., 2016; Velasco et al., 2017; Onencan et al., 2018; Stoeckl et al., 2020; Pakshyn et al., 2021; Trofymchuk et al., 2021; Dobos et al., 2022; Molenda and Kidawa, 2022). These studies to date are mainly concerned with the description of the hydrological situation after the collapse of the salt mine, surface deformation monitoring, risk mapping and stress-strain state analysis in the surroundings of the Solotvyno Salt Mine, and for this, they use only InSAR technology to numerically quantify subsidence.
The novelty of this research is a multi-sensor (InSAR, very high-resolution multi-spectral satellite images, UAV optical images), multi-temporal (2014-2022) and graphical approach to monitor this study area with a design for future high precision monitoring using permanent artificial corner reflectors (ACRs). The particular benefit of ACR units installed in-situ would be the knowledge of their effective phase center, allowing the direct co-location with other geodetic measurements (GNSS, leveling) and achieving accuracy better than the measurement noise of the observation techniques at hand.
2 Materials and methods
2.1 Creation of a sinkhole
The subsidence basin develops gradually, first above the fault and later with a temporal and spatial displacement behind the advancing wall fault. The displacement at the earth’s surface consists of two components: a vertical component - subsidence and a horizontal component - horizontal displacement (Figure 2). When assessing the impact of quarrying on the surface, the denivelation - tilt, stresses in objects, and the curvature of deformed terrain are also considered. Factors influencing the magnitude of movement are geological (physical-mechanical properties of rocks, tectonics, sequence of strata, etc.), spatial factors (depth and method of quarrying, length-width of fault, thickness of strata), and temporal factors (rate of subsidence of overburden strata and rate of quarrying) (Kovanič et al., 2016).
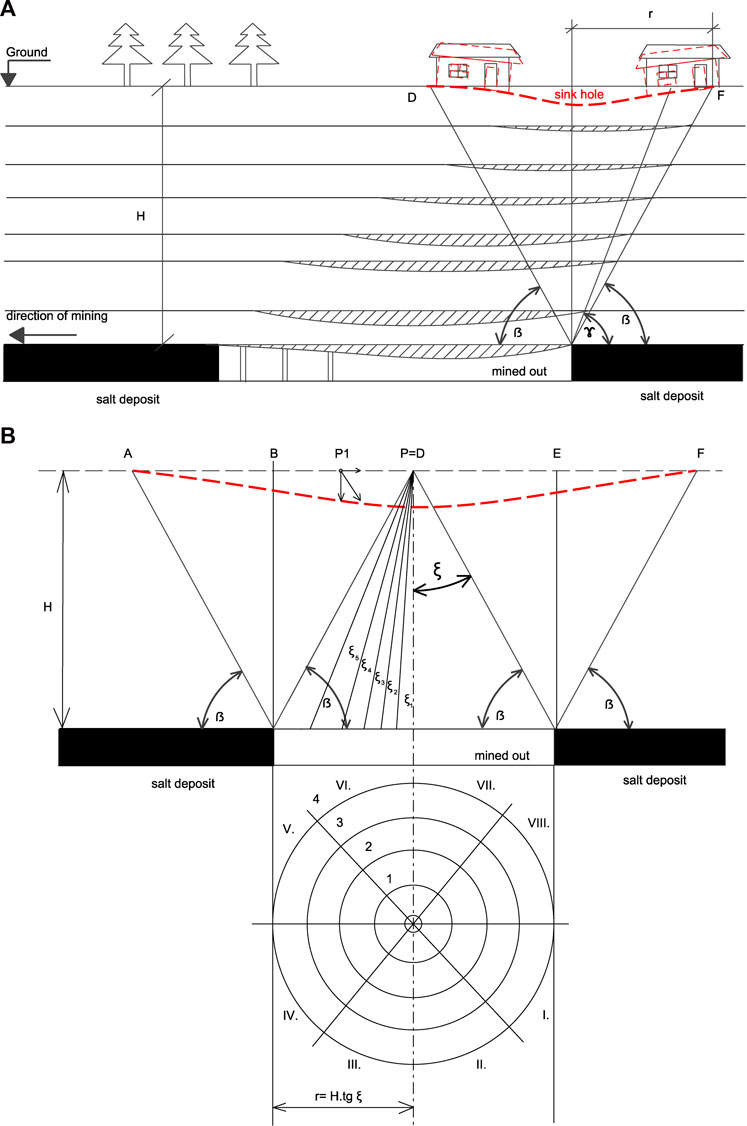
FIGURE 2. (A) Creation of a sinkhole and (B) Meaning of the effective area, P-point drop scheme on the effective area (Trnka et al., 1968).
The dip angle γ initially defines the subsidence basin, and at the final stage, after the fault has reached the surface, the edge of the subsidence basin is defined by the limiting angle β.
To determine the subsidence of any point located in the middle of the subsidence basin, the magnitude of vertical movement is given as:
where s is the subsidence of the observed point (mm, cm), m - is the power of the mined deposit (mm, cm), a - is the mining coefficient (method of mining), z–is the time coefficient (indicates the full subsidence of the point in time, varies in time according to the nature of the overburden, the storage parameters and the method of mining), e–is the effect coefficient (the ratio of the actually mined area under the considered point to the fully effective area of this point, it is influenced by the force factor).
The horizontal displacement hd is defined as:
where ξ is the band angle (Figure 2B). The effects of mining are not only manifested in the diameter of the mined area on the surface, but also outside it and up to a certain distance r depending on the depth of the deposit H and the limiting angle β according to the relation:
The period of descent can be divided into 3 stages.
1. The stage of initial subsidence - from the appearance of the first subsidence on the surface until the time of intense subsidence. The duration of this stage depends mainly on the speed of the quarrying operations.
2. Intensive subsidence stage - when the subsidence of surface points is 70%–80% of the total subsidence, it is the most dangerous stage for surface objects due to rapid changes.
3. Maturation stage - subsidence is smaller, so it cannot be detected by measurement. After a certain period of time, the subsidence is already negligible from a technical point of view.
2.2 Methods
2.2.1 Multi-temporal InSAR analysis
The area of interest to investigate the deformation phenomena (Figure 3) covers approximately 5 by 4 km (20 km2) area over Solotvyno town. The area corresponds mostly to urbanized zones, with a higher presence of vegetated regions in the surroundings.
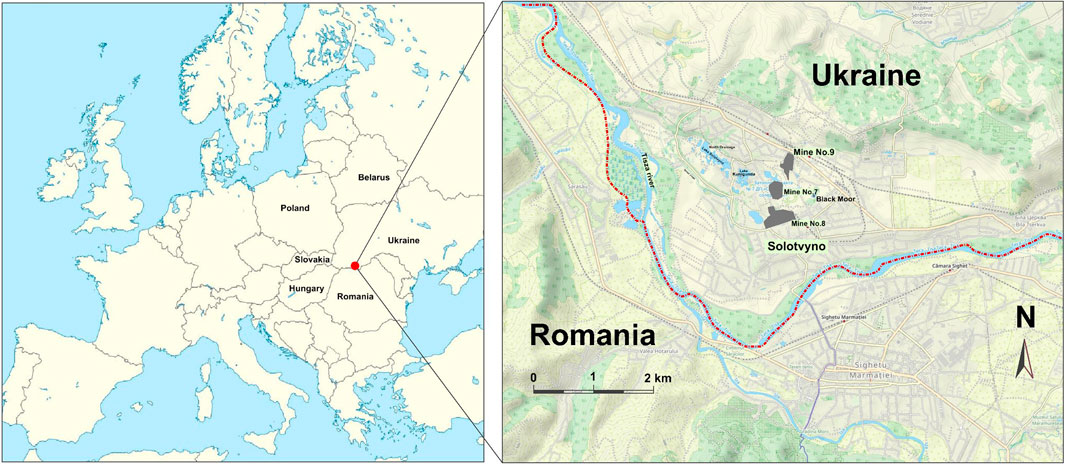
FIGURE 3. Solotvyno region (Source: authors, base maps SAS. Planet v221122.10312 Nightly; Yakovlev et al., 2016).
Multi-temporal InSAR analysis (Ferretti et al., 2000; Ferretti et al., 2001; Kampes, 2006; Ketelaar, 2009), is an advanced technique of multi-temporal satellite radar interferometry which is established as an operational tool for low-cost, wide-area coverage and millimetric precision ground deformation monitoring. MTInSAR aims to identify coherent radar targets exhibiting high phase stability over the entire observation period and derives point data with locations corresponding mainly to the point-wise, man-made features (e.g., buildings, bridges, monuments, antennas, poles, conducts, etc.). Phase stable points can be used as a “natural GNSS network” to monitor terrain motion, analyzing the phase history among them. Displacement maps, products of MTInSAR analysis, are point clouds with precise displacement time-series over monitored objects. Objects can be measured with sensitivity to millimetric changes over wide areas utilizing frequent Sentinel-1 acquisitions (12/6 days).
2.2.2 SAR GRD images
In this study, Sentinel-1 product level Ground Range Detected (GRD) SAR images were also selected to compare temporal changes in individual Sinkholes in the study area. The selection of images was matched with the reference multi-spectral data of Pléiades and SPOT and their acquisition dates. To compare the effect of polarization configuration and orbit type on the accuracy of the results, 2 SAR images with ascending and descending orbit tracks were selected for each time interval. Both types of polarization configurations of the GRD product, namely, VV and VH, were used for processing.
It is widely known that GRD products are obtained using the interferometric Wide Swath IW scanning mode (250-km wide satellite scanning swath) and also that, compared to SLC products, they do not contain phase information (ESA, 2023). Standard SAR GRD image preprocessing procedures include the import of precise orbit parameters (satellite position and velocity) and the elimination of thermal noise, especially for cross-polarized channels (Filipponi, 2019). In the next stage, the radiometric correction process recalculates the SAR intensity to Sigma 0 values and also performs radar noise filtering (Lee 3x3, Lee 5x5, and Lee Sigma). In the last stage, the preprocessing is complemented by the application of Doppler terrain correction in order to eliminate the topographic distortion using the DEM digital elevation model and to transform the SAR images into a cartographic projection (Bayanudin and Jatmiko, 2016). For further processing, the initial value is then the pixel intensity, converted by a logarithmic transformation to a physical quantity called the backscatter coefficient. The processing then consists of manual (ESA SNAP) or semi-automatic (Google earth Engine) thresholding for the subsequent generation of water masks (Kseňak et al., 2022).
2.2.3 Multi-spectral satellite images
Optical remote sensing uses visible, near-infrared, and shortwave infrared sensors to produce images of the earth’s surface by detecting solar radiation reflected from targets on the ground. Different materials reflect and absorb different wavelengths. Therefore, targets can be distinguished by their spectral reflectance features in remote sensing images. Depending on the number of spectral bands used in the imaging process, optical remote sensing systems are divided into basic types - panchromatic, multi-spectral, and hyperspectral images.
For the analysis of temporal changes in the study area by multi-spectral satellite images, we used two satellite constellations.
• Pléiades-1A and Pléiades-1B,
• SPOT-6 and SPOT-7.
2.2.3.1 Pléiades satellite system
The Pléiades satellite constellation was designed for military and civil use by the French-Italian program ORFEO (Optical and Radar Federated earth Observation) in 2001–2003. This constellation consists of two satellites–Pléiades-1A and Pléiades-1B, operating on the same phased orbit. Pléiades-1A and 1B were built by AIRBUS Defence and Space and launched on 16 December 2011 (1A) and 2 December2,012 (1B). Pléiades constellation delivers imagery products with 0.5 m resolution phased 180° apart. They operate in the same near-polar sun-synchronous orbit at an altitude of 694 km. Pléiades product consists of 5 bands–PANchromatic (0.45–0.75 µm), Blue (0.45–0.52 µm), Green (0.53–0.60 µm), Red (0.62–0.69 µm), and Near Infrared (0.76–0.89 µm).
2.2.3.2 SPOT satellite mission
SPOT6 and SPOT7 are the latest in the SPOT (“Satellite pour l'Observation de la Terre”) satellite series and were designed to continue the SPOT4 and SPOT5 missions. The first five satellites were designed by the French National Centre for Space Studies (CNES) and launched in 1986–2015. The latest SPOT6 and SPOT7 are commercial satellites owned by AIRBUS Defence and Space launched on 9 September 2012 (SPOT6) and 30 June 2014 (SPOT7). They operate on the same orbit phased 180° apart with a resolution of 1.5 m (panchromatic) and 6 m (multi-spectral). Pléiades product consists of 5 bands–PANchromatic (0.48–0.82 µm), Blue (0.45–0.53 µm), Green (0.51–0.59 µm), Red (0.62–0.70 µm), and Near Infrared (0.775–0.915 µm).
To analyze temporal changes in the study area from multi-spectral images, we decided to monitor surface water area at individual sinkhole/mine localities using remote sensing indices for water monitoring. Considering the bands provided in products from Pléiades and SPOT images, we used the Normalized Difference Water Index NDWI:
NDWI index is based on the reflectance in the green and near-infrared (NIR) bands. The water body has strong absorption and low emissivity in the visible to infrared wavelength range. It is sensitive to built-up areas and results in sometimes overestimated water areas, which had to be taken into account during the extraction of water area. To eliminate the occurrence of false positives in built-up areas, we used a threshold value of 0.3.
Multi-spectral images were obtained for the years 2014–2022 from AIRBUS OneAtlas service Living Library as pansharpened GeoTIFF format for Pléiades (“© CNES (2014, 2015, 2017, 2021, 2022), Distribution Airbus DS”) and SPOT (“© Airbus DS (2016, 2018, 2019, 2020)"). The final set of images is summarized in Table 1.
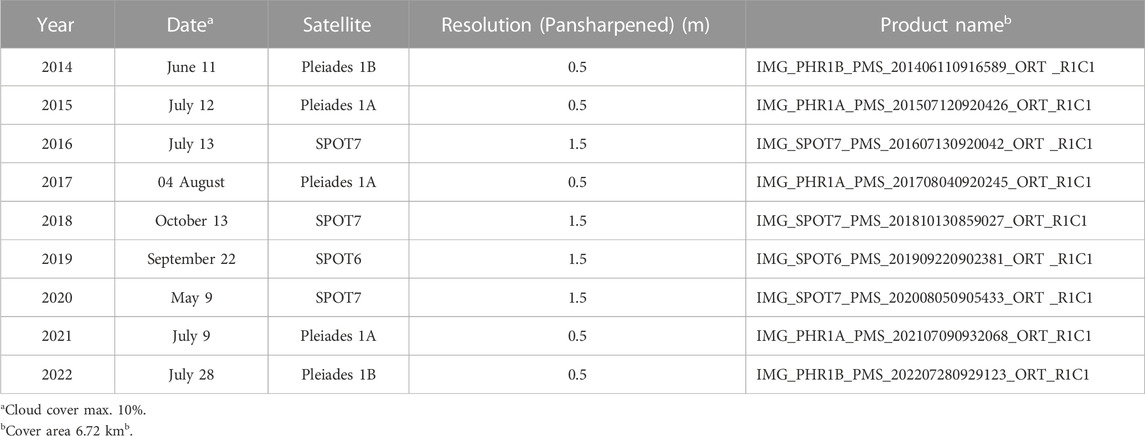
TABLE 1. Specification of the used Pléiades and SPOT multi-spectral images.
2.2.4 Aerial survey
The FLIRT Arrow aerial survey system developed by ABRIS Design Group (Ukraine) was used to perform aerial surveying of the studied territory located in the city of Solotvyno. The methodology of the aerial survey included the following four main stages: the creation of an aerial survey project; determination of the coordinates of reference and control points; performing aerial survey; the processing of aerial survey results.
2.2.4.1 Creation of an aerial survey project
FlightPlanner software was used to сreate an aerial survey project. The key parameters for the creation of the project were the boundaries of the studied territory and the required resolution in 4 cm. Forward and side overlap of 80% and 70%, respectively, was used in the project. The project also took into account the approximate terrain, wind speed and wind direction. The prepared project was loaded into the UAV autopilot before the start of the aerial survey.
2.2.4.2 Determination of the coordinates of reference and control points
The coordinates of the situational points were determined within the survey area, which served as reference and control points for the aerial survey. The coordinates were determined by GNSS receiver SOUTH galaxy G1 in RTK mode. Coordinates of points were determined from the GNSS stations SOLT (Solotvyno), which belongs to the GeoTerrace GNSS network (Ukraine). A total of 12 reference and 47 control points were determined in the given area. Reference points were used to georeference the results of aerial surveys, and control points for quality control of work performed. The coordinates were determined in the Ukrainian state coordinate system USK 2000, as a height system was used WGS84 (ellipsoidal). It should be noted that the mean square error of reference and control points determination does not exceed 19 mm.
2.2.4.3 Performing of aerial survey
The aerial survey was performed in November 2021 in sunny weather with moderate surface winds up to 5 m/s with the help of FLIRT Arrow aerial survey system. As a result of the aerial survey, 1,154 aerial images were obtained.
2.2.4.4 Processing of aerial survey results
The materials of the aerial survey were analyzed, and an a priori assessment of the accuracy of obtaining the coordinates of the points of the terrain was performed. Then the preliminary processing of aerial survey materials was performed, which includes the preparation and introduction of survey parameters, creation and export of reference and control point coordinates catalogue, and construction of image pyramids. The final processing of the prepared data was performed in specialized software Pix4Dmapper - software for photogrammetry and professional mapping with the help of UAVs.
3 Results
3.1 Multi-temporal InSAR analysis
The work aimed to perform Multi-temporal InSAR analysis (Ferretti et al., 2000; Ferretti et al., 2001; Kampes, 2006; Ketelaar, 2009) covering the target area with ascending track 131 (331 images acquired from 14.10.2014 to 22.5.2021) and descending track 7 (328 images acquired from 25.10.2014 to 2.6.2020) from Sentinel-1A/B satellites. The dataset analyzed in this work contains a total number of 659 Sentinel-1A/B satellite radar images. The areas of interest to investigate the deformation phenomena is shown in Figure 3. All available SLC images for respective orbit tracks acquired during repeated satellite passes are firstly co-registered on the sampling grid of a unique Master acquisition. The Master acquisitions were selected by optimizing the distribution of perpendicular and temporal baselines (Figure 4) together with assessing the weather conditions and information about precipitation during Master acquisition time (Weather Underground Inc, 2020).
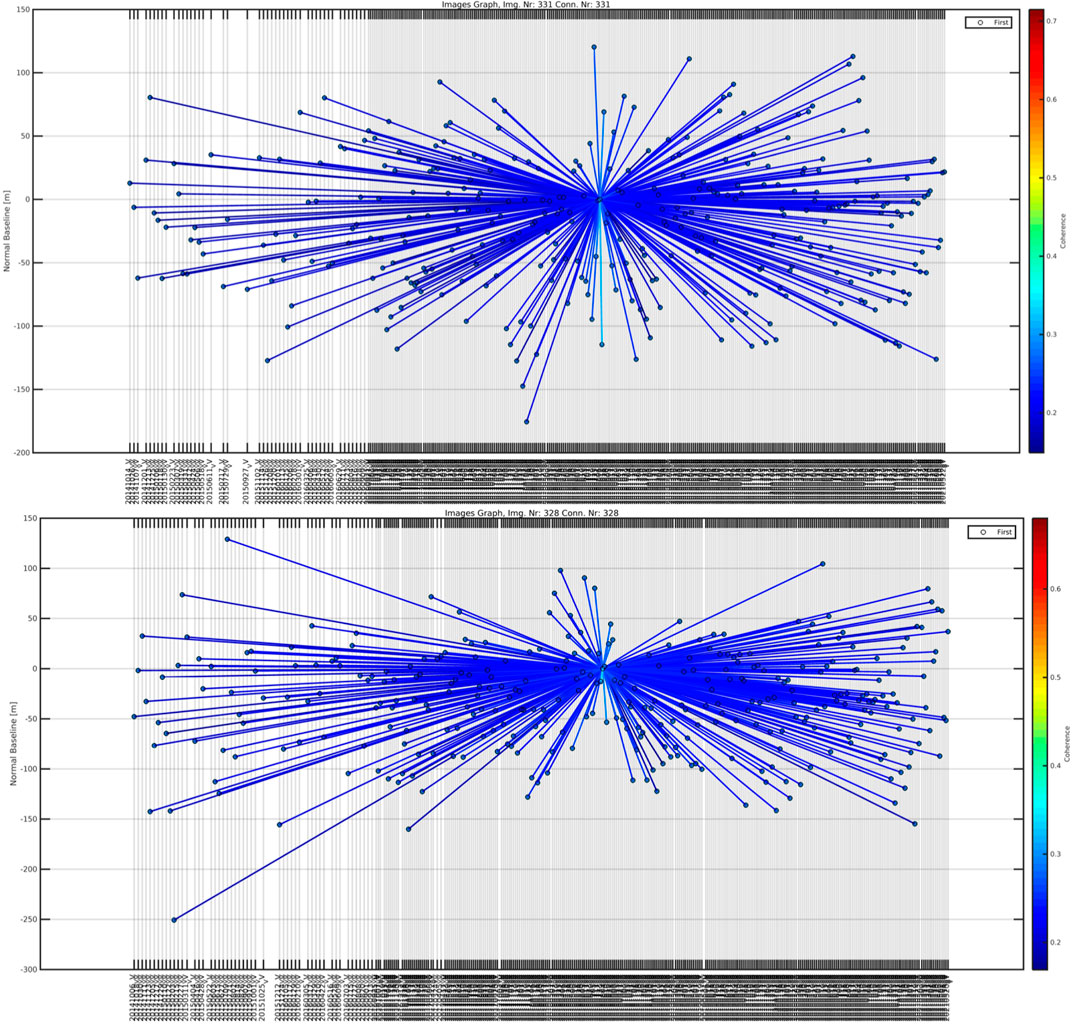
FIGURE 4. Distribution of normal (vertical axis) and temporal (horizontal axis) baselines for Ascending Track 131 (top) and Descending Track 7 (bottom).
The data are then analyzed on a pixel-by-pixel basis in order to identify a sparse grid of points, usually corresponding to man-made structures (e.g., buildings, bridges, monuments, antennas, poles, conducts, etc.). This strategy allows for more effective filtering of the atmospheric noise and more accurate compensation of the topographic artifacts (which may impair single interferogram analysis). A threshold of 0.5 on Amplitude Stability Index (Lei et al., 2013) is used to create a network of pre-selected points with stable electromagnetic signature. Two key parameters are estimated in a network of pre-selected points: residual height and displacement velocity. As with the classical methodology of MT-InSAR analysis, a linear model assumption for the deformation estimates is used. Finally, for each persistent scattering point, a displacement time-series are estimated with respect to the local reference point identified for each AOI in a scatterer with high amplitude stability (Amplitude Stability Index >.9). Displacement maps with mean Line-of-sight velocities from ascending and descending orbit passes are shown in Section: Results.
3.1.1 Ascending track 131
The area of approximately 5x4 km around Solotvyno town has been analyzed from Sentinel-1A/B’s ascending track, with results shown in Figure 5. The estimated displacement rates are in the interval of +15 to −15 mm/year (Figure 5). Point scattering targets in Figure 5 are visualized with color proportional to line-of-sight (LOS) velocities (mm/year). The reference point for the analysis was located at 47.94724651°N, 23.88053400°E for the ascending track (white label). The motions detected over subsiding zones are even exceeding −15 mm/year, reaching the values of −20 mm/year over the most affected parts. Due to visualization purposes, the color scale limit has been set to −15 mm/year to better expose the spatial distribution of obtained deformation estimates and in order to highlight the most significantly affected zones (red) together with shallow subsiding zones of approx. −5 mm/year (yellow). Temporal coherence thresholds of 0.6, representing 60% quality of the extracted displacement time-series have been used in order to visualize only highly reliable targets. In overall, 2,845 persistent scattering targets with precise deformation time-series have been detected. The positive values (blue color) of LOS velocities correspond to the decrease of the sensor-to-target distance or, in other words, displacement towards the satellite. The red areas are showing subsiding parts of the displacement field or motion away from the satellite, i.e., increase in sensor-to-target distance. The velocities are homogeneously distributed suggesting that the area is sufficiently coherent with a good availability of persistent scattering points and satisfactory density of PS point, aside from the very central area of Solotvyno where stronger displacement momentum of up to −20 mm year is observable around this area. It is assumed that the surface in the very central area where there’s no presence of persistent scattering target is affected by steeper displacements trends exceeding motion detectable in one pixel (∼2.8 cm per 6 days for Sentinel-1) or the respective zone was changed significantly in the monitoring period from 2014–2021 as steeper displacement gradients might also correspond to the significant reflectivity changes of the surface such as reconstruction and/or surface elements added or removed within the time interval of satellite monitoring (October 2014 - May 2021). Therefore, the area needs to be further assessed in the light of the ground-truth information, best with the installation of an artificial corner reflector utilizing high-resolution X-band observations of TerraSAR-X/PAZ or Cosmo-SkyMed satellites.
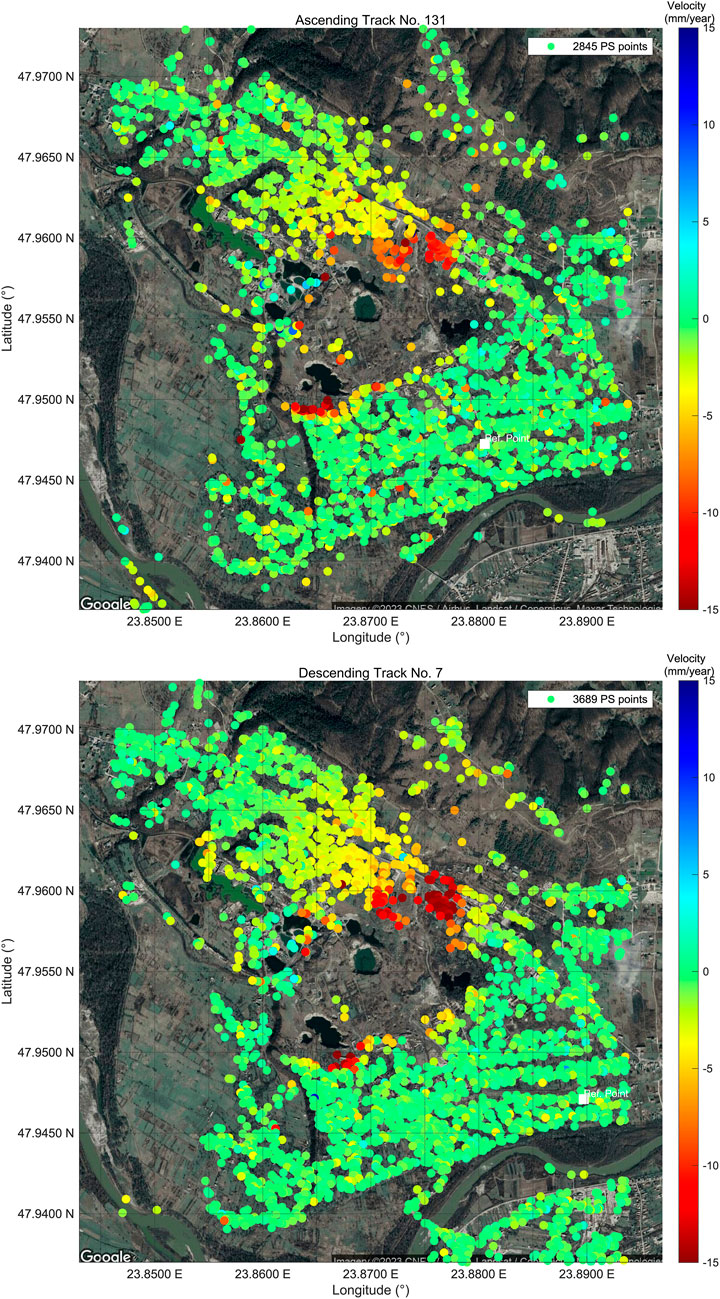
FIGURE 5. Line-of-sight (LOS) displacement velocity map from Ascending Track No. 131 (top) and Descending Track No. 7 (bottom).
Similarly to the analysis of ascending track 131, the line-of-sight (LOS) velocities in millimeters per year obtained by MT-InSAR analysis are depicted in Figure 5 for points with temporal coherence higher than 0.6 totaling 3689 identified in a monitored area. The deformation rates represent velocities within the same interval of +15 (blue) to −15 (red) millimeters per year, and the reference point for the analysis was located at the stable southern part of the city at 47.94709267°N, 23.88970492°E (Figure 5, bottom) close to the location of a point from ascending track (Figure 5 top). Deformation patterns detected over the central region from ascending track are confirmed via independent measurements from descending track, with similar location and extent of the affected areas. Subsidence with movement trends of up to −20 (red) mm/year were detected both from Ascending Track 131 and Descending Track 7 measurements (Figure 5).
Example of the displacement time-series for the PS point with velocity of −14.3 mm/year over subsiding zone is shown in Figure 6.
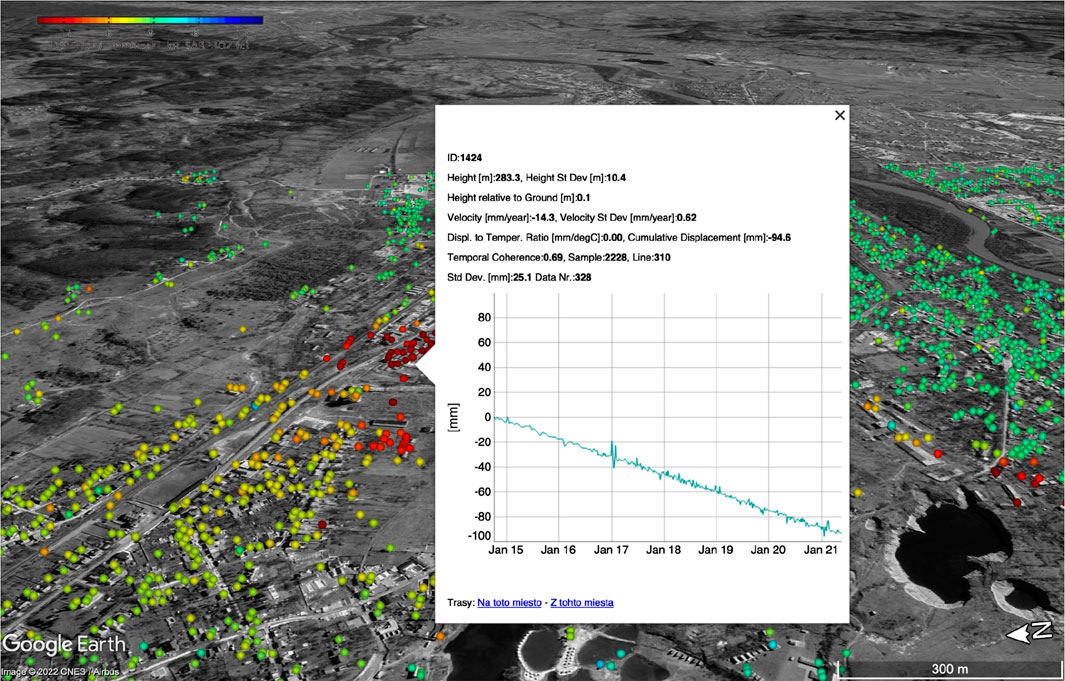
FIGURE 6. Displacement time-series from Descending Track No. 7 shown for the subsiding area from the point over the industrial building with the velocity of −14.3 mm/year.
3.2 Optical images analysis
Given the study area and other works dealing with the Solotvyno area (Stoeckl et al., 2020; Trofymchuk et al., 2020; Szűcs et al., 2021; Dobos et al., 2022), four distinctive areas where sinkholes and water started to appear over the monitored period were defined (Figure 7). These 4 main areas of interest were analyzed from aerial survey data, multi-spectral satellite images, and SAR GRD images. Figure 8.
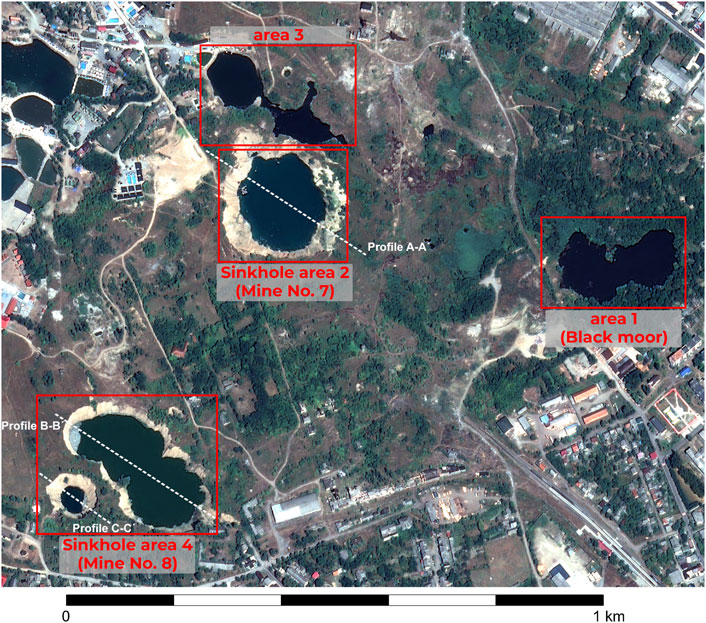
FIGURE 7. Location of monitored areas and sinkhole profiles (base image: "© CNES (2022), Distribution Airbus DS").
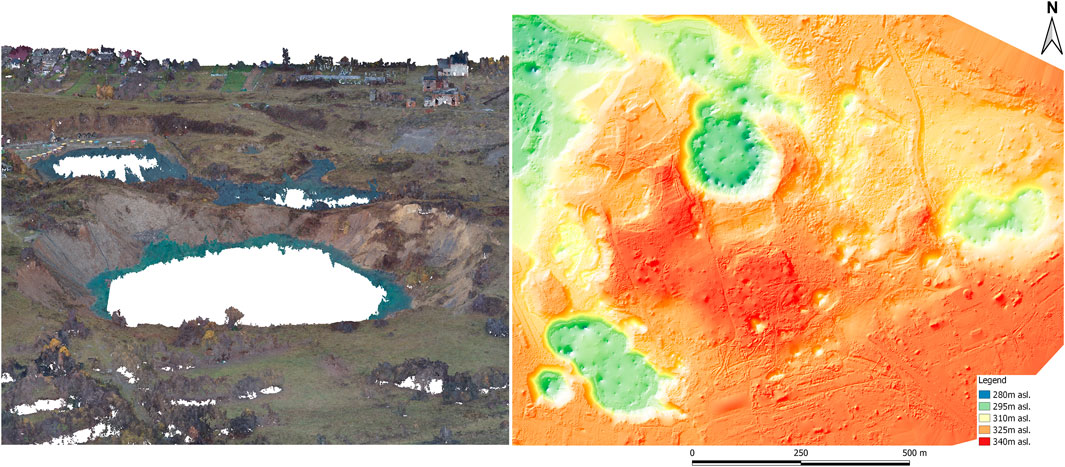
FIGURE 8. Detail of the point cloud and DTM of the monitored area in Solotvyno.
3.2.1 Aerial survey
A total of 12 ground control points were used to georeferenced results, and 47 points were used as control points, with the mean square error of their placement not exceeding 19 mm. As a results of processing aerial survey results in the Pix4Dmapper, a point cloud, digital terrain model (Figure 10) and orthophotomosaic of the research area were created. The resolution of all received data was within 4 cm. The point cloud was filtered and cleaned of noise and classified into common classes. In order to get properly classified ground data, vegetation filtering on a steep slope within sinkholes had to be done (Štroner et al., 2021).
From the aerial survey data, we were also able to derive water levels in individual sinkholes. These data show a varying water level within all sinkholes.
• area 1 (black moor) - 308.520 m asl.
• area 2–297.130 m asl.
• area 3–303.700 m asl.
• area 4–300.260 m asl.
3.2.2 Multi-spectral satellite images
Retrieved multi-spectral images were initially processed in ESA SNAP software (SNAP - ESA Sentinel Application Platform v9.0.0, http://step.esa.int) by their reprojection to UTM 34N coordinate reference system, NDWI calculation, extraction of water area, and exporting as GeoTIFF format. These were subsequently imported into qGIS 3.26 software (QGIS Development Team, 2023. QGIS Geographic Information System. Open Source Geospatial Foundation. URL http://qgis.org) to get the final surface water area. Extracted water surfaces in geoTIFF format for years 2014–2022 were vectorized and analyzed in qGIS software. The final water surface area for individual locations is given in Table 2. From multi-spectral images in 2014 and 2022. Also the total subsided area of sinkholes in areas 2 and 4 was derived.
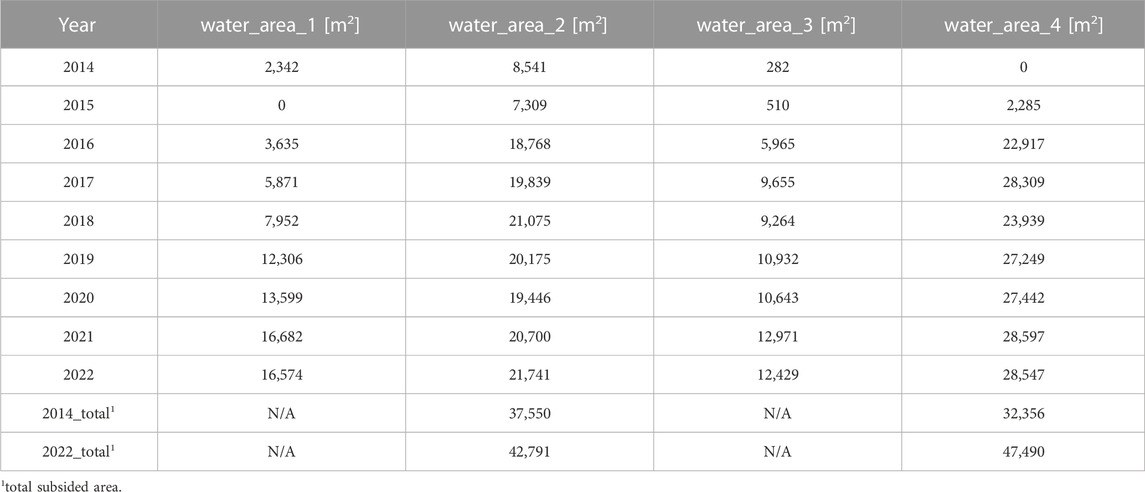
TABLE 2. Water surface area of individual sinkholes in 2014–2022.
Using the terrain shading visualisation tool Ambient occlusion (sky-view) (Čučković, 2021) in qGIS on the DTM product from the aerial survey, we were able to detect newly created sinkholes (dashed circles in Figure 9). By combining RGB compositions from multi-spectral satellite images, orthophotomosiac and DTM from the aerial survey, a varying extent of sinkholes in 2014–2022 was determined (Figure 9).
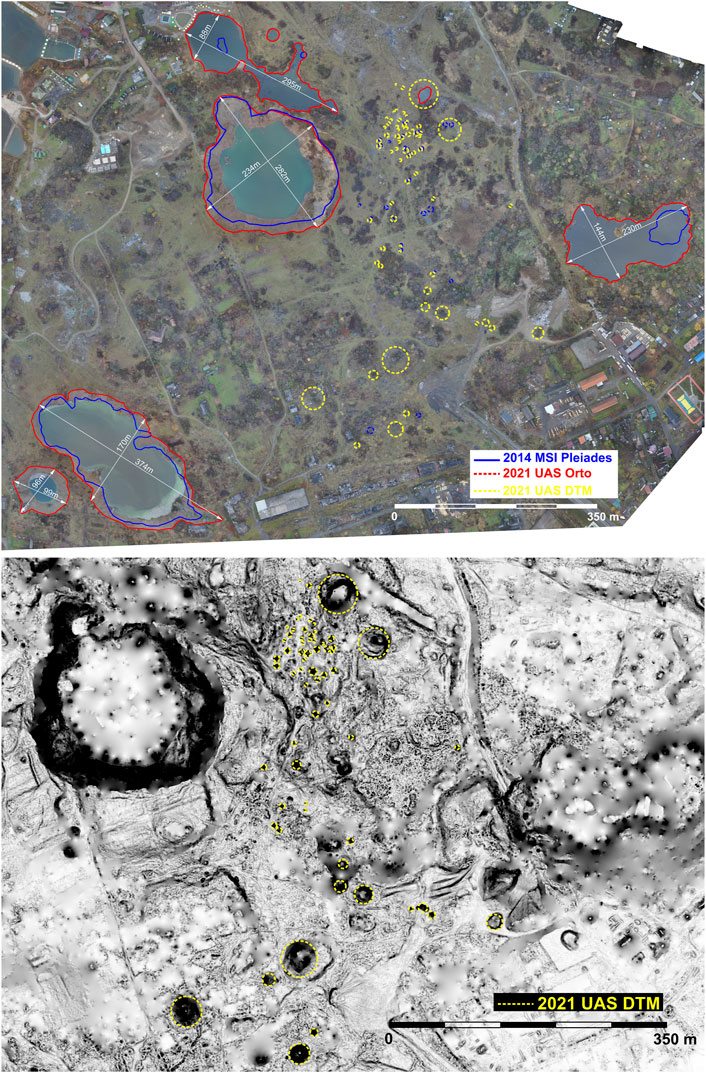
FIGURE 9. Extent of monitored areas in 2014 and 2021based on 2021 UAS orthophotomosaic (top); and newly emerging sinkholes detected on DTM (bottom).
4 Discussion
Land cover interpretation using multi-sensor remote sensing images is an important task that allows the extraction of information that is useful for several applications (Farah et al., 2008; Fenk, 2021; Zaczek-Peplinska et al., 2021; Bandura and Gallay, 2022). A multiseason approach dealing with an increasing number of images captured over the years; multi-sensor image fusion, optical and radar, or even satellite and aerial or UAV data for large-scale mapping; the creation of training samples and processing automation archives into the universal and repeatable models (Pluto-Kossakowska, 2021).
4.1 InSAR analysis
In this work, the area around the Solotvyno mine in Ukraine has been analyzed utilizing the Multi-temporal satellite radar interferometry (MT-InSAR) technique and Signal-to-Clutter Ratio (SCR) analysis. Two orbit paths of Sentinel-1A/B satellites were analyzed in monitoring periods from October 2014 to May 2021, with a total amount of 331 satellite radar images from Sentinel-1’s Ascending Track 131 and 328 images from Descending Track 7.
The application of MT-InSAR technique (Ferretti et al., 2000; Ferretti et al., 2001; Kampes, 2006; Ketelaar, 2009) with the linear model assumption for deformation estimates has been capable of providing sufficient amounts of persistent scattering targets in the monitored area. Steeper displacement trends (>-2 cm) were recorded for the very central part of the Solotvyno, progressing significantly also in recent monitoring periods of the year 2021. These measurements were confirmed via the independent analysis of both sensing geometries (ascending/descending). The central area with no persistent targets might correspond to the significant physical changes of the surface exceeding motion detectable in one pixel (∼2.8 cm per 6 days for Sentinel-1) induced by activities such as mining or digging, adding/removal of buildings or their parts, etc. Such areas shall be further analyzed, validated and interpreted by geotechnical experts who are familiar with a monitored structure and its anthropological or naturally induced changes that might have occurred during the monitoring period from October 2014 to May 2021. Satellite monitoring using MT-InSAR techniques should be applied for the time-interval, or historical period, without significant changes to objects’ reflectance. Specific site analysis via advanced processing strategies considering non-linear motion estimation (Bakon et al., 2014) and partially coherent targets (Perissin and Wang, 2021) were performed, but did not contribute to the overall robustness of displacement estimates, detection of steeper deformation profiles or final densities of points. In line with the results of previous studies (Szűcs et al., 2021; Dobos et al., 2022) where sufficient PS density over the subsidence zone was not achieved due to the complexity of the mechanism driving surface deformation, the installation of artificial corner reflectors (ACRs) in the area of interest, collocated with GNSS measurements and continuous InSAR monitoring, is proposed as a solution for future monitoring tasks.
The InSAR monitoring system for continuous monitoring tasks and regular updates is described in (Bakon et al., 2020). Radar corner reflectors are most commonly used for SAR sensor calibration and validation, both radiometric and geometric. Corner reflectors are also used for SAR interferometry (InSAR) quality assessment, InSAR applications over areas with few natural coherent scatterers, such as monitoring of landslides, land subsidence (Figure 10), infrastructure stability, glaciers, and also recently for InSAR datum connection and geodetic integration (Czikhardt et al., 2021). The Corner reflector’s Radar Cross Section (RCS) is very high. Known high RCS and consequently high Signal-to-Clutter ratio (SCR) (Czikhardt et al., 2022) allows to study the radiometric calibration constants and the spatial resolution. The known position of the effective phase centre allows to determine the SAR positioning errors and opens possibilities for geodetic InSAR co-location. The exploitation of several CRs covering the whole critical area can create a subsidence monitoring network which can provide reliable displacement time series over the critical subsidence zones, strengthen the natural PS estimation network, improve the positioning precision of the nearby natural PS and provide an absolute geodetic reference for the InSAR displacement estimates (Czikhardt et al., 2021; 2022).
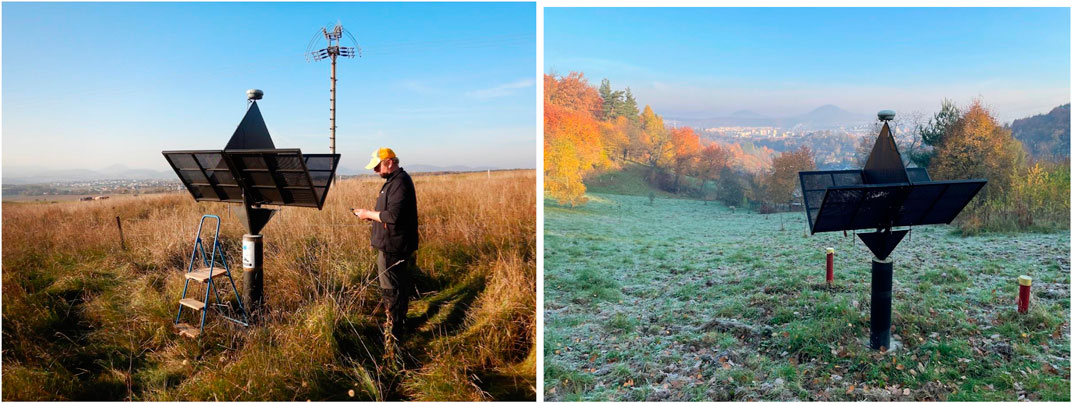
FIGURE 10. Example of CR installation and stabilization in a landslide zone.
The particular benefit of using artificial reflectors is the precise knowledge of their effective phase centre, allowing the direct co-location with other geodetic measurements in the observation space with local ties known with accuracy better than the measurement noise of the observation techniques at hand. The only remaining assumption is that the measurement points of different techniques undergo the same motion in time. To satisfy this assumption, measurement points of different techniques could be rigidly connected within a single instrument. Co-locating radar reflectors and continuous GNSS measurements allows a reliable network of reference points, transformations of multiple InSAR measurements from different acquisition geometries into a terrestrial reference frame; and the InSAR measurement quality validation. The deployment of the permanent collocation InSAR-GNSS station (example shown in Figure 11) follows these steps.
1. The pillar is founded in a drilled borehole, with special steel construction prepared to drill the two pairs (upper and lower) of mounting bolts for the reflectors.
2. The construction is rotated so that the holes for the bolts are perpendicular with respect to the geodetic north of the conventional TRF. The orientation is assisted by the pair of north/south points (with the same ellipsoidal longitude), which are staked out using RTK GNSS.
3. After the proper orientation, mounting bolts are drilled into the pipe, which is consequently filled with concrete.
4. Corner reflectors are mounted on the bolts with screws and nuts for finer alignment of the reflector’s central plate with respect to the geodetic north. The precise alignment is performed by tacheometry.
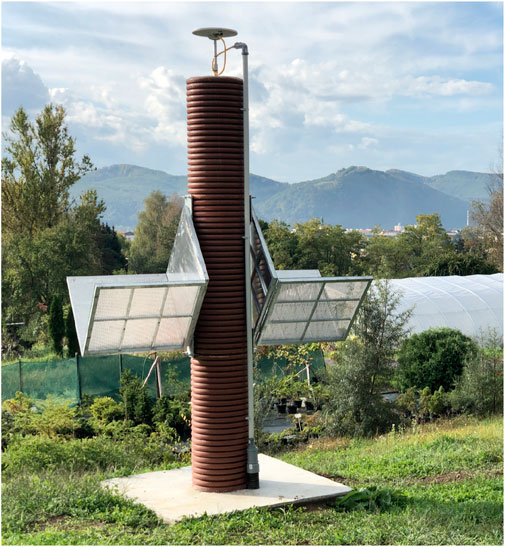
FIGURE 11. The new type of InSAR and GNSS co-location reference station (ZVOL) of the permanent SKPOS network (SKPOS 2021).
Expected Signal-to-clutter Ratio (SCR) (Czikhardt et al., 2021 and; 2022) maps of stations should serve as initial guidance for deciding the proper situation of artificial radar reflectors. SCR maps were produced using simulated corner reflector response of triangular trihedral with an inner leg-length of 1 m (and corresponding RCS of 30 dB m2) (Czikhardt et al., 2021; 2022). Using simple thresholding on SCR maps, given the condition of a single Sentinel-1 C-band phase measurement standard deviation of 0.5 mm, the SCR should be more than 20 dB. Hence all areas with SCR >20 dB and at least a single resolution cell in both range and azimuth separated from nearby strong scatterers can be considered viable for installation. However, one has to be aware that the applied simulation does not consider the sensor’s thermal noise and other InSAR-related noises, such as residual atmospheric path delay, unmodelled deformation or orbital errors. Additionally, the optimal installation location should not contain any strong point scatterers within plus/minus two Sentinel-1 IW SLC resolution cells (∼40–50 m) in azimuth and range, respectively. It is strongly encouraged to carry up a final decision on installation location in accordance with in-situ information; the decision process and monitoring/collocation requirements shall be used for refining the final situation of planned artificial reflectors.
Expected SCR for the Solotvyno area is visualized in Figure 12 and Figure 13 and can be used as an initial guidance for situating artificial radar reflectors both for monitoring purposes and also for the permanent GNSS station collocated with InSAR passive radar reflectors. The red color in Figures 12, 13 represents a signal-to-clutter ratio of 0–20 dB and areas with not ideal conditions for the installation of artificial radar reflector (ACR) units, whilst orange areas are possible locations (20–25 dB), light green (25–30 dB) represent optimal and dark green (30–35 dB) best possible sites for placement of artificial radar reflector or GNSS collocation station. A detailed look into intervals of 0–20 dB SCR is provided in Figures 12, 13 to additionally highlight areas where the installation of CRs is not suitable.
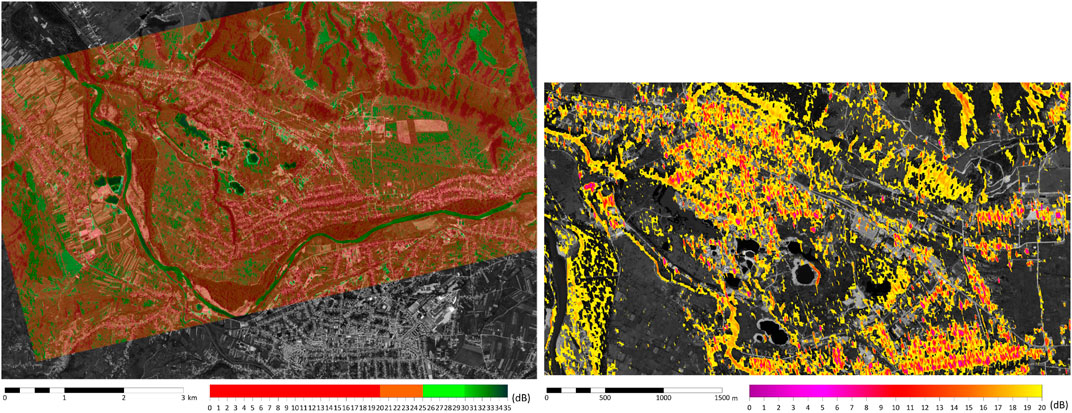
FIGURE 12. Expected SCR from Ascending Track No. 131 using last-year Sentinel-1 acquisitions for estimation (202012-202112), marked critical non-usage areas with SCR <20 dB.
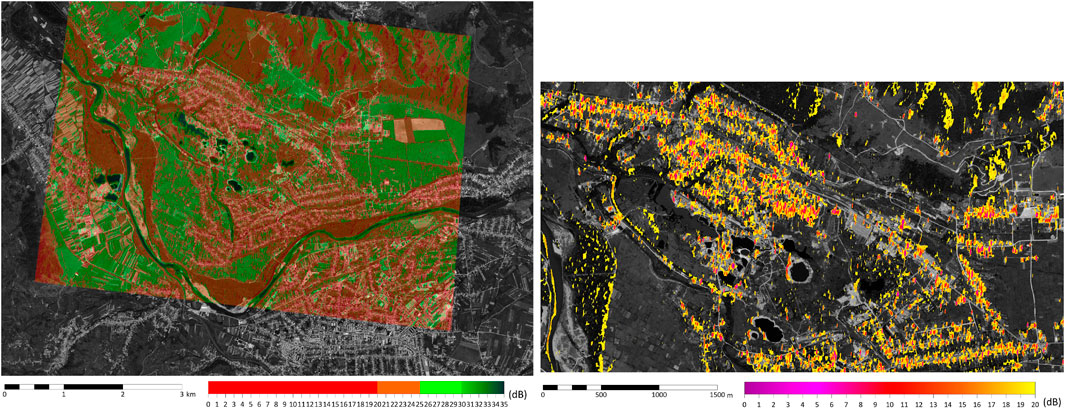
FIGURE 13. Expected SCR from Descending Track No. 7 using last-year Sentinel-1 acquisitions for estimation (202012-202112), marked critical non-usage areas with SCR <20 dB.
4.2 Multi-spectral and aerial survey images
Optical data have been used in monitoring landslides, undermined areas, or changes in critical infrastructure and their subsequent impact on the environment for a long time in varying degrees and in different data types (Hofierka et al., 2016). A combination of aerial optical and lidar data can be useful for monitoring critical infrastructure (Bakuła et al., 2020). However, in order to get accurate data from aerial surveys, it is important to have proper positional data, which onboard GNSS navigation data can do, as shown by Urban et al. (2020). Also, terrestrial photogrammetry can successfully monitor mining infrastructure and analyze its deformations (Fraštia et al., 2011). An automatic ground deformation measurement can be done by the precise orthorectification of optical satellite images proposed by Leprince et al. (2007).
From the SPOT and Pléiades multi-spectral imagery processing for the Solotvyno area, it is evident that from 2014 to 2022, there has been a significant expansion of existing sinkhole areas in the study area, as well as the creation of new ones, all of which are characterized by their inundation (Figure 7; Table 2). The most significant increase in water area occurred in Sinkhole Area 4, where the water area started to appear only in 2015 and reached over 28,000 m2 by 2022. Similarly, significant increases in water surface area have occurred in areas 3 and 4. An increase in water surface area also occurred in Sinkhole area 2, but as early as 2014, it was 8,500 m2, with the largest increase occurring in 2016 to a level of almost 19,000 m2. Since then, the water surface area has remained at similar levels with minimal increase.
Total subsided areas for Areas 2 and 4 were also derived from the multi-spectral imagery (Table 5). Already in 2014, these areas reached over 30,000 m2, and by 2022, they had expanded to approximately 43,000 and 47,000 m2, respectively.
Based on the results from the aerial survey, it was also possible to graphically evaluate the spatial extent of individual areas 1-4 (Figure 9). Using terrain shading visualization on the DTM from the UAV photogrammetry, we clearly identified newly forming craters in the monitoring area, which clearly indicate that significant subsidence is still occurring in the area and these craters may expand over time, forming large sinkholes and contributing to further degradation of the area (Figure 8).
4.3 SAR GRD water extraction
The evaluation of the individual Sinkholes in terms of water extraction was as follows. Sinkhole 1 is formed by a water surface with different reflection characteristics than the other sinkholes. This was reflected in the resulting water surface extraction. On the one hand, demonstrably better values were obtained using the polarization configuration of the VV, but still with a relatively high deviation compared to the multi-spectral processing using SPOT and Pléiades satellite imagery. Also, the resulting extraction values were underestimated from 29% to almost 100% compared to the reference images. Thus, the results obtained in this way cannot be considered relevant.
In the case of Sinkhole area 2 and Sinkhole area 4, the extraction results were slightly more favourable, mainly due to the larger spatial extent of the water surface. For area 4 in 2019 and 2021, almost the same results can be observed as extraction using MSI imagery with Overal Accuracy as high as 92%. In other cases, however, the Overal Accuracy is lower, ranging from 60% to 75%. A separate thresholding approach, for example, using the Double-window Flexible Pace Search (DFPS) method (Choudhary and Ghosh, 2022), could improve the results.
However, in the SAR GRD extraction results, the effect of the ascending and descending orbit of the satellite on the accuracy of water extraction can be observed. The largest differences were found at Sinkhole area 2, where there are larger elevation differences between the terrain and the water surface in the sinkhole, involving the steep slope of the sinkhole terrain. The relative differences, in this case, ranged from 2% (2016) to 26% (2020). To refine the results in this case, information from both ascending and descending dual-polarized images combined with polarimetric components such as SPAN, DI and PR can be incorporated (Sayedain et al., 2020).
The above extraction uncertainties are primarily due to the limited spatial resolution of the Sentinel-1 GRD products, which is lower than the SPOT and Pléiades products. A suitable tool to improve the spatial resolution of the image and hence the extraction process could be the use of the GAN (Generative Adversarial Network) algorithm with machine learning techniques in the pre-processing stage of SAR image, which is also confirmed by other research (He and Yokoya, 2018), (Ao et al., 2018), (Jamali et al., 2021). Of course, the use of images from other SAR constellations with higher spatial resolution, e.g., TerraSAR-X, seems to be beneficial for this type of tracking of sinkhole changes.
4.4 Future work
As researched by different remote sensing methods (Section 3: Results), the area of Solotvyno mine is affected by steep subsidence associated with the ongoing formation of new sinkholes or extension of existing ones. Since such effects pose a direct threat to surrounding buildings and infrastructure, the proposal for frequent continuous surveillance of the area is being discussed among authorities responsible for protection of the affected zones and civil safety.
In order to determine the velocity rate of deformation processes, which would make it possible to forecast and anticipate dangerous processes in the Solotvyno region in the future, it is planned to conduct several additional cycles of aerial survey. These cycles will be conducted in different periods of the year to establish the possible relationship between deformation processes and seasonality. Additionally, to increase accuracy, the possibility of using lidar technologies in the future is being considered.
For precise engineering tasks and analysis over the objects with potential deformation threats, it is recommended to continue the monitoring at monthly or quarterly intervals, primarily utilizing InSAR technology and higher-resolution satellite missions such as TerraSAR-X/PAZ with the installation of artificial corner reflectors (ACR) in the monitored area.
5 Conclusion
The assessment of the surface displacement of the undermined Solotvyn was based on a multi-sensor approach of imaging the area, which was performed using data from the Sentinel-1 SAR satellites, the very high-resolution multi-spectral satellites Péiades and SPOT covering the time period between 2014-2022, and optical images from the aerial survey. The analysis performed has confirmed the continuous surface displacement and subsidence over the mining area, suggesting that abandoned salt mines still pose a significant threat to the Solotvyno area. The MT-InSAR analysis shows that steeper trends of >−2 cm of displacement have been recorded in the central part of the Solotvyno monitoring area, which has also progressed significantly in the current monitoring period. Moreover, the results suggest that in the central area without permanent reflectors, there may be surface movements that exceed the movement detectable in 1 pixel—about 2.8 cm in 6 days for Sentinel-1. This area should be further analyzed and interpreted for any anthropological or other natural changes that may have occurred during the monitoring period.
The analysis of the high-resolution optical multi-spectral images of the Pléiades and SPOT over the period 2014–2022 shows that there is a significant expansion of the individual sinkholes in the monitoring area and an increase in the water area within them. The largest increase in water surface area has occurred in Area 4, where over 28,000 m2 of water surface area was created from 2015 to 2022. Conversely, in Sinkhole Area 2, the extent of the water surface has been almost stable since 2016.
In addition, the DTM from the aerial survey shows the clear emergence of several smaller sinkholes in the central part of the monitored area, confirming the constant ongoing movements in this area. A comparison of the satellite RGB composite and UAV orthophotomosaics shows that the total subsided area for Sinkholes 2 (Mine no. 8) and 4 (Mine no. 7) changed minimally between 2014-2022, while the areas of Area 1 and 3 increased their area significantly. The aerial survey data also shows that the water surface elevation varies from area to area, and the maximum difference is almost 11 m.
It is clear from these results that continuous monitoring of the area is essential to prevent further damage to the surrounding settlements and infrastructure. It is the InSAR technology that represents a high potential for the development of a suitable system for automated and high-precision monitoring and continuous risk detection. This research proposed a geodetic solution for permanent satellite monitoring, which will utilize multiple CRs covering the whole critical area and thus can establish a subsidence monitoring network that can provide reliable time series of displacements in critical subsidence zones, strengthen the natural PS estimation network, improve the positioning accuracy of nearby natural PSs, and provide an absolute geodetic reference for InSAR displacement estimation. Before that, however, it is necessary to make a final decision on the installation site in accordance with the in-situ assessment.
Data availability statement
The raw data supporting the conclusion of this article will be made available by the authors, without undue reservation.
Author contributions
KP conceived the research idea and contributed to conception and design of the study, KB processed multi-spectral data, MZ conceived the research idea, IS processed UAS data, MB performed the InSAR processing, JP performed the SCR analysis. MB, JP, JB, and LK analyzed the InSAR results. LK, JB, and MR revised the article and assisted with the interpretation of InSAR results, DP provided consultations on InSAR data processing. ĽK processed SAR GRD water extraction, KP, KB, MB, JP, and MZ drafted the article. All authors contributed to the finalization of this paper. All authors have read and agreed to the published version of the manuscript.
Funding
This work was supported by the grant No. 1/0340/22, 1/0648/21 and 2/0100/20 funded by the Scientific Grant Agency of The Ministry of Education, Science, Research and Sport of the Slovak Republic (VEGA), and No. 003 TUKE-4/2023 and 055 TUKE-4/2021 funded by the Cultural and Education Grant Agency of The Ministry of Education, Science, Research and Sport of the Slovak Republic (KEGA). This work was supported by the project HUSKROUA/1901/8.1/0072 REVITAL.
Acknowledgments
Sentinel-1 data were provided by ESA under free, full, and open data policy adopted for the Copernicus program. Data was processed by SARPROZ utilizing Matlab and Google Maps. Pleiades and SPOT data were provided by Airbus DS.
Conflict of interest
Author MB was employed by the company Insar.sk Ltd. Author DP was employed by the company RASER Limited.
The remaining authors declare that the research was conducted in the absence of any commercial or financial relationships that could be construed as a potential conflict of interest.
Publisher’s note
All claims expressed in this article are solely those of the authors and do not necessarily represent those of their affiliated organizations, or those of the publisher, the editors and the reviewers. Any product that may be evaluated in this article, or claim that may be made by its manufacturer, is not guaranteed or endorsed by the publisher.
References
Akcin, H., Degucci, T., and Kutoğlu, H. S. (2006). Monitoring mining induced subsidence's using GPS and InSAR. TS 48—engineering surveys for construction works II, XXIII. Germany: FIG Congress, 1–12.
Ao, D., Dumitru, C. O., Schwarz, G., and Datcu, M. (2018). Dialectical GAN for SAR image translation: From sentinel-1 to TerraSAR-X. Remote Sens. 10, 1597. doi:10.3390/rs10101597
Bakon, M., Czikhardt, R., Papco, J., Barlak, J., Rovnak, M., Adamisin, P., et al. (2020). remotIO: A sentinel-1 multi-temporal InSAR infrastructure monitoring service with automatic updates and data mining capabilities. Remote Sens. 12, 1892. doi:10.3390/rs12111892
Bakon, M., Perissin, D., Lazecky, M., and Papco, J. (2014). Infrastructure non-linear deformation monitoring via satellite radar interferometry. Procedia Technol. 16, 294–300. doi:10.1016/j.protcy.2014.10.095
Bakuła, K., Pilarska, M., Salach, A., and Kurczyński, Z. (2020). Detection of levee damage based on UAS data—Optical imagery and lidar point clouds. ISPRS Int. J. Geo-Information 9, 248. doi:10.3390/ijgi9040248
Bali, B. S., Wani, A. A., Bhat, G. R., and Mir, S. A. (2021). GPR investigation of mining induced subsidence and its effects on surface structures: A case study of srinagar city, J&K, India, NW himalayas. J. Geol. Soc. India 97, 751–759. doi:10.1007/s12594-021-1756-5
Bandura, P., and Gallay, M. (2022). Applicability of the global tandem-X elevation data for terrain modelling of a forested karst area: A case study from Slovak karst. Geogr. Cassoviensis 16, 3. doi:10.33542/gc2022-1-03
Bayanudin, A. A., and Jatmiko, R. H. (2016). Orthorectification of sentinel-1 sar (synthetic aperture radar) data in some parts of south-eastern Sulawesi using sentinel-1 toolbox. IOP Conf. Ser. Earth Environ. Sci. 47, 012007. doi:10.1088/1755-1315/47/1/012007
Chonka, Y., Lemko, I., Sichka, M., Buleza, B., Yarosh, V., Tzoma, I., et al. (2013). Physico-chemical and microbiological monitoring of solotvino salt lakes. Balneo Res. J. 4, 115–120. doi:10.12680/balneo.2013.1050
Choudhary, S. S., and Ghosh, S. K. (2022). Surface water area extraction by using water indices and DFPS method applied to satellites data. Sens. Imaging 23, 33. doi:10.1007/s11220-022-00403-4
Chudek, M., and Strzałkowski, P. (2019). Assessment of the hazard level posed to a post-mining area by discontinuous surface deformations. IOP Conf. Ser. Earth Environ. Sci. 261, 012004. doi:10.1088/1755-1315/261/1/012004
Čučković, Z. (2021). Terrain shading: A QGIS plugin for modelling natural illumination over digital terrain models. Avaliable At: https://github.com/zoran-cuckovic/QGIS-terrain-shading.
Czikhardt, R., van der Marel, H., and Papco, J. (2021). Gecoris: An open-source toolbox for analyzing time series of corner reflectors in Insar geodesy. Remote Sens. 13, 926. doi:10.3390/rs13050926
Czikhardt, R., van der Marel, H., van Leijen, F. J., and Hanssen, R. F. (2022). Estimating signal-to-clutter ratio of insar corner reflectors from Sar Time Series. IEEE Geoscience Remote Sens. Lett. 19, 1–5. doi:10.1109/lgrs.2021.3070045
Dobos, E., Kovács, I. P., Kovács, D. M., Ronczyk, L., Szűcs, P., Perger, L., et al. (2022). Surface deformation monitoring and risk mapping in the surroundings of the Solotvyno Salt Mine (Ukraine) between 1992 and 2021. Sustainability 14, 7531. doi:10.3390/su14137531
ESA (2023). User guides - sentinel-1 SAR - acquisition modes - sentinel online. Available at: https://sentinel.esa.int/web/sentinel/user-guides/sentinel-1-sar/acquisition-modes (Accessed February 8, 2023).
Farah, I. R., Boulila, W., Ettabaa, K. S., Solaiman, B., and Ahmed, M. B. (2008). Interpretation of multi-sensor remote sensing images: Multiapproach fusion of uncertain information. IEEE Trans. Geoscience Remote Sens. 46, 4142–4152. doi:10.1109/tgrs.2008.2000817
Fenk, J. (2021). On the prognosis of sinkholes. Geotechnik 44 (4), 281–282. doi:10.1002/gete.202000043
Ferretti, A., Prati, C., and Rocca, F. (2000). Nonlinear subsidence rate estimation using permanent scatterers in differential SAR interferometry. IEEE Trans. Geoscience Remote Sens. 38, 2202–2212. doi:10.1109/36.868878
Ferretti, A., Prati, C., and Rocca, F. (2001). Permanent scatterers in sar interferometry. IEEE Trans. Geoscience Remote Sens. 39, 8–20. doi:10.1109/36.898661
Filipponi, F. (2019). “Sentinel-1 GRD preprocessing workflow,” in 3rd international electronic conference on remote sensing Vol. 18. ECRS-3 2019, MDPI. doi:10.3390/ecrs-3-06201
Fraštia, M., Plakinger, M., and Beck, J. (2011). Photogrammetric observation of deformation of the vertical mining shaft. Acta Montan. Slovaca 16, 276–286.
Guzy, A., and Witkowski, W. T. (2021). Land subsidence estimation for aquifer drainage induced by underground mining. Energies 14, 4658. doi:10.3390/en14154658
He, W., and Yokoya, N. (2018). Multi-temporal sentinel-1 and -2 data fusion for optical image simulation. ISPRS Int. J. Geo-Information 7, 389. doi:10.3390/ijgi7100389
Hofierka, J., Gallay, M., Kaňuk, J., and Šašak, J. (2016). Modelling karst landscape with massive airborne and terrestrial laser scanning data. Lect. Notes Geoinformation Cartogr. 29, 141–154. doi:10.1007/978-3-319-45123-7_11
Jacko, S., Farkašovský, R., Dirnerová, D., Kondela, J., Rzepa, G., and Zakršmídová, B. (2016). The late cretaceous conditions of the gombasek beds sedimentation (silica nappe, western carpathians). Acta Montan. Slovaca 21, 259–271.
Jamali, A., Mahdianpari, M., Mohammadimanesh, F., Brisco, B., and Salehi, B. (2021). A synergic use of sentinel-1 and sentinel-2 imagery for complex wetland classification using generative adversarial network (GAN) scheme. Water 13, 3601. doi:10.3390/w13243601
Kampes, B. M. (2006). “ The permanent scatterer technique,” in Radar interferometry. Vol. 12 (Dordrecht: Springer). doi:10.1007/978-1-4020-4723-7_2
Ketelaar, V. B. H. (2009). “Satellite radar interferometry: Subsidence monitoring techniques,” in Springer Science and Business Media (Dordrecht: Springer). doi:10.1007/978-1-4020-9428-6
Kovanič, ml., Ľ., Hurčíková, V., Molčíková, S., and Kovanič st., Ľ., (2016). Geodézia v podzemných priestoroch II. Košice, Slovakia: Fakulta BERG, TU v Košiciach.
Kseňak, Ľ., Pukanská, K., Bartoš, K., and Blišťan, P. (2022). Assessment of the usability of SAR and optical satellite data for monitoring spatio-temporal changes in surface water: Bodrog River Case study. Water 14, 299. doi:10.3390/w14030299
Lei, L., Perissin, D., and Qin, Y. (2013). “Change detection with spaceborne insar technique in Hong Kong,” in 2013 IEEE International Geoscience and Remote Sensing Symposium - IGARSS, Melbourne, VIC, Australia, 21-26 July 2013 (IEEE). doi:10.1109/igarss.2013.6721161
Leprince, S., Barbot, S., Ayoub, F., and Avouac, J. P. (2007). Automatic and precise orthorectification, coregistration, and subpixel correlation of satellite images, application to ground deformation measurements. IEEE Trans. Geoscience Remote Sens. 45, 1529–1558. doi:10.1109/tgrs.2006.888937
Molenda, T., and Kidawa, J. (2022). A study of a hypersaline, Heliothermic Lake that formed in an anthropogenic-karst sinkhole. Mine Water Environ. 41, 817–827. doi:10.1007/s10230-022-00887-2
Onencan, A., Meesters, K., and Van de Walle, B. (2018). Methodology for participatory GIS risk mapping and citizen science for Solotvyno Salt Mines. Remote Sens. 10, 1828. doi:10.3390/rs10111828
Pakshyn, M., Liaska, I., Kablak, N., and Yaremko, H. (2021). Geodynamics. GEODYNAMICS 2 (31), 41–52. doi:10.23939/jgd2021.02.041
Perissin, D., and Wang, T. (2021). Repeat-pass SAR interferometry with partially coherent targets. IEEE Trans. Geoscience Remote Sens. 50, 271–280. doi:10.1109/TGRS.2011.2160644
Pluto-Kossakowska, J. (2021). Review on multitemporal classification methods of satellite images for crop and arable land recognition. Agriculture 11, 999. doi:10.3390/agriculture11100999
Sayedain, S. A., Maghsoudi, Y., and Eini-Zinab, S. (2020). Assessing the use of cross-orbit Sentinel-1 images in land cover classification. Int. J. Remote Sens. 41 (20), 7801–7819. doi:10.1080/01431161.2020.1763512
Stoeckl, L., Banks, V., Shekhunova, S., and Yakovlev, Y. (2020). The hydrogeological situation after salt-mine collapses at Solotvyno, Ukraine. J. Hydrology Regional Stud. 30, 100701. doi:10.1016/j.ejrh.2020.100701
Štroner, M., Urban, R., Lidmila, M., Kolář, V., and Křemen, T. (2021). Vegetation filtering of a steep rugged terrain: The performance of standard algorithms and a newly proposed workflow on an example of a railway ledge. Remote Sens. 13, 3050. doi:10.3390/rs13153050
Szűcs, E., Gönczy, S., Bozsó, I., Bányai, L., Szakacs, A., Szárnya, C., et al. (2021). Evolution of surface deformation related to salt-extraction-caused sinkholes in Solotvyno (Ukraine) revealed by sentinel-1 radar interferometry. Nat. Hazards Earth Syst. Sci. 21, 977–993. doi:10.5194/nhess-21-977-2021
Trnka, O., Pácl, V., Vavro, M., Limber, V., and Kubec, K. (1968). Dobývaní ložisek. Praha, Czech Republic: SNTL – nakladatelství technické literatury. ALFA – Nakladateľstvo. Bratislava.
Trofymchuk, O., Anpilova, Y., Myrontsov, M., and Okhariev, V. (2021). “Ecological situation of post-mining regions in Ukraine,” in Systems, decision and control in energy II. Editor Y. Yakovliev (Cham, Switzerland: Springer), 293–306.
Trofymchuk, O., Anpilova, Y., Yakovliev, Y., and Zinkiv, I. (2020). “Ground deformation mapping of Solotvyno Mine area using radar data and GIS,” in Geoinformatics: Theoretical and applied aspects (Kyiv, Ukraine: European Association of Geoscientists & Engineers). doi:10.3997/2214-4609.2020geo138
Urban, R., Štroner, M., and Kuric, I. (2020). The use of onboard UAV GNSS navigation data for area and volume calculation. Acta Montan. Slovaca 25, 361–374. doi:10.46544/ams.v25i3.9
Velasco, V., Sanchez, C., Papoutsis, I., Antoniadi, S., Kontoes, C., Aifantopoulou, D., et al. (2017). “Ground deformation mapping and monitoring of salt mines using InSAR technology,” in Proceedings of the solution mining research Institute (Münster, Germany: Springer).
Weather Underground, Inc (2020). History and data archive. AvaliableAt: https://www.wunderground.com/history/.
Yakovlev, E. O., Shekhunova, S. B., Aleksieienkova, M. V., and Siumar, N. P. (2016). Assessment of complex stress-strain state of the Solotvyno Salt Anticline structure (basing on technique of natural pulse electromagnetic field of the Earth). Collect. Sci. Works Inst. Geol. Sci. NAS Ukraine 9, 83–96. doi:10.30836/igs.2522-9753.2016.144246
Yang, F., Shao, Y., Ma, G., and Qin, Z. (2009). “The application of Remote Sensing Technology in monitoring environmental disasters of mining cites,” in 2009 Joint Urban Remote Sensing Event, Shanghai, China, 20-22 May 2009 (IEEE). doi:10.1109/urs.2009.5137590
Keywords: salt mine collapse, sinkholes, InSAR, UAV, Solotvyno, multi-spectral optical images
Citation: Pukanská K, Bartoš K, Bakoň M, Papčo J, Kubica L, Barlák J, Rovňák M, Kseňak Ľ, Zelenakova M, Savchyn I and Perissin D (2023) Multi-sensor and multi-temporal approach in monitoring of deformation zone with permanent monitoring solution and management of environmental changes: A case study of Solotvyno salt mine, Ukraine. Front. Earth Sci. 11:1167672. doi: 10.3389/feart.2023.1167672
Received: 16 February 2023; Accepted: 04 April 2023;
Published: 17 April 2023.
Edited by:
Chong Xu, Ministry of Emergency Management (China), ChinaReviewed by:
Tao Chen, China University of Geosciences Wuhan, ChinaZizheng Guo, Hebei University of Technology, China
Copyright © 2023 Pukanská, Bartoš, Bakoň, Papčo, Kubica, Barlák, Rovňák, Kseňak, Zelenakova, Savchyn and Perissin. This is an open-access article distributed under the terms of the Creative Commons Attribution License (CC BY). The use, distribution or reproduction in other forums is permitted, provided the original author(s) and the copyright owner(s) are credited and that the original publication in this journal is cited, in accordance with accepted academic practice. No use, distribution or reproduction is permitted which does not comply with these terms.
*Correspondence: Karol Bartoš, a2Fyb2wuYmFydG9zQHR1a2Uuc2s=