 Renjie Guo
 Anning Cai
 Xin Chen3
- 1Faculty of Geographical Science, Beijing Normal University, Beijing, China
- 2Tourism and Social Administration College, Nanjing Xiaozhuang University, Nanjing, Jiangsu, China
- 3School of Geographical Sciences, Nanjing University of Information Science & Technology, Nanjing, Jiangsu, China
Vegetation has changed dramatically in recent years as a result of various disturbances, but the factors influencing vegetation growth vary geographically. We looked into the impact of climate change and human activity on vegetation growth in the Yangtze River Basin (YRB). We characterized vegetation growth in the YRB using gross primary production (GPP) and the leaf area index (LAI), analyzed the relationship between vegetation growth and climate change using the standardized precipitation evapotranspiration index (SPEI), and quantified the relative contribution rate of climate change and human activity to vegetation growth in the YRB by using residual trend method. The findings revealed that: 1) From 2000 to 2018, the YRB showed an increasing trend of temperature (0.03°C yr−1) and precipitation (4.02 mm yr−1) and that the entire area was gradually becoming warmer and wetter; 2) Vegetation growth in the YRB showed a significant increasing trend (GPP: 7.83 g C m−2 yr−2, LAI: 0.02 years-1). Among them, 87.40% of the YRB showed an increasing trend, primarily in the northern, eastern, and southern parts, while decreasing areas were primarily found in the Yangtze River Delta (YRD) and the YRB’s west region. 3) Vegetation had a significant positive correlation with SPEI in most areas of the YRB, and it was more sensitive to SPEI over a long time scale. The effects of climate change and human activity on vegetation growth in the YRB were spatially heterogeneous, and climate change was the primary driving factors of vegetation change in the YRB (accounting for 61.28%). A large number of grass were converted into forest, crop and urban. Overall, climate change and human activity promoted the growth of vegetation in the middle and upper reaches of YRB (MUYRB) while inhibited the growth of vegetation in the YRD. The findings of this study will contribute to a better understanding of the effects of climate change and human activity on vegetation growth in the YRB, as well as provide a scientific foundation for future ecological restoration in humid and semi-humid areas.
1 Introduction
Research focusing on long-term changes in large-scale terrestrial vegetation has demonstrated that vegetation serves as an accurate indicator of the impacts caused by various disturbance factors on regional terrestrial ecosystems. Moreover, it plays a crucial role as an ecological indicator in response to global changes (Forkel et al., 2016). In large-scale terrestrial ecological research, the intricate dynamics of vegetation development are significantly influenced by a combination of climate and human factors (Suzuki et al., 2007; Metcalfe et al., 2010). With the deepening of global change research, it is becoming more and more important to accurately quantify the effects of climate change and human activity on vegetation growth (Liu et al., 2015; Piao et al., 2020).
The impacts of climate change on terrestrial ecosystems are expected to alter the temperature, light availability, and water conditions necessary for vegetation growth. Consequently, these changes will have implications for the stability of terrestrial ecosystems, particularly manifested through variations in vegetation leaf area and productivity (Piao et al., 2020). Many studies have shown that vegetation growth under different temperature and humidity conditions has different sensitivity to meteorological conditions (Jiao et al., 2019; Rahmani and Fattahi, 2021). In the middle and high latitudes of the northern hemisphere, increasing temperatures have been found to promote vegetation growth (Mao et al., 2012). In arid regions, vegetation has a significant correlation with precipitation (Li et al., 2015), while in most other areas, it has a high correlation with temperature (Piao et al., 2015). In humid regions, vegetation growth is highly responsive to temperature fluctuations (Ma et al., 2019). Changes in temperature can influence various physiological processes within plants, such as photosynthesis and transpiration, ultimately affecting the overall productivity and health of vegetation in humid environments (Mathur et al., 2014). The responsiveness of vegetation to temperature fluctuations highlights the intricate relationship between climate conditions and the dynamic nature of plant ecosystems in humid regions. It should be noted that the growth of vegetation is also affected by a variety of meteorological factors, including light, humidity, etc., so multiple factors need to be considered comprehensively in research and monitoring. It is worth noting human activity is an important contributor to both climate change and the growth of vegetation (Li et al., 2022). China and India are crucial to the greening of the world’s terrestrial vegetation, which is greatly impacted by human activity through afforestation projects and increased agricultural efficiency (Chen et al., 2019). Urbanization brought by human activity will lead to a sizable portion of crop and grass being taken up by urban land, and vegetation coverage will decrease significantly (Jin et al., 2018). With the implementation of the carbon neutral strategy, regional vegetation growth will benefit from initiatives like converting crop back to grass and forest (Zhao et al., 2018). Therefore, regional and even global vegetation growth processes will be strongly affected by human activity and climate change (Liu et al., 2015).
Many studies have quantified the effects of climate change and human activity on vegetation at a regional scale. It is found that the warm and wet climate in North China has a significant positive correlation with regional greening, in which climate change has a more significant impact on vegetation cover than human activity (Cao et al., 2021). The trend of warm and humid climate was favorable to grass growth, in which the relatively dry and warm climate had a more significant effect on vegetation growth (Han et al., 2018). However, Economic development and population growth had hampered grass growth (Han et al., 2018). In the Loess Plateau, long-term water availability is the dominant climate factor influencing vegetation growth, with the long-term NDVI trend being more sensitive to climate change compared to the short-term trend (Shi et al., 2021). Moreover, in areas experiencing vegetation degradation, human activity has a significantly greater impact on vegetation compared to climate change (Shi et al., 2021). However, studies mainly focus on arid and semi-arid areas, while there are few analyses on humid and semi-humid areas, and most studies only focus on the effects of precipitation and temperature on vegetation growth, which may be insufficient.
The Yangtze River Basin (YRB) is the third largest basin in the world and the main humid and semi-humid region in China. The vegetation in the YRB is very important to maintain the regional carbon and water balance (Qu et al., 2018). In addition, the YRB is one of China’s representative regions with a thriving economy and dense population (Yang et al., 2022). The YRB’s terrestrial ecosystem has been severely hampered in recent years by environmental issues brought on by population increase, climate change, and economic growth (Zhang et al., 2020). It is crucial to understand the characteristics of vegetation change in the YRB and to separate and estimate the relative contributions of climate change and human activity to vegetation growth in light of the dual impacts of climate change and human activity.
This study used meteorological data, GPP, LAI, and SPEI to examine the effects of climate change and human activity on vegetation in the YRB from 2000 to 2018. To be more precise, it mostly consists of three contents: 1) To determine the characteristics of climate change in the YRB by analyzing changes in temperature, precipitation, radiation and SPEI; 2) To determine the characteristics of vegetation change in the YRB by analyzing the state of vegetation growth and the transfer of land cover; and 3) To distinguish between the effects of climate change and human activity on vegetation growth by residual trend method and to quantify the relative contributions.
2 Data and methods
2.1 Study area
The YRB covers an area of approximately 1.8 million square kilometers. It is located between approximately 24°N and 37°N latitude and 90°E and 122°E longitude. The YRB benefits from a subtropical monsoon climate, characterized by a wet and hot season that creates favorable conditions for vegetation growth (Qu et al., 2018). As shown in Figure 1A, the YRB has a variety of land cover types, with forest predominating in the basin’s southwest, southeast, and north. The Sichuan Basin and the middle and lower reaches of the YRB (MLYRB) are the primary regions where most crops are cultivated. The central, western, and southern regions of the YRB, along with the high-altitude regions of the Qinghai-Tibet Plateau, are predominantly covered by grass. The Yangtze River Delta (YRD) and the MLYRB contain the majority of China’s urban land. The YRB’s topography is uneven, and it has a stepped distribution as the elevation gradually drops from west to east (Figure 1B). With its elevated western regions and lower eastern areas, the Yangtze River gracefully meanders from west to east, eventually emptying into the Pacific Ocean.
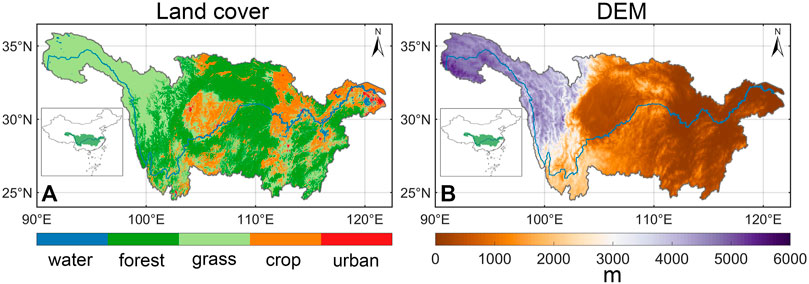
FIGURE 1. Regional overview of the YRB. (A)Land cover types in 2018 (water, forest, grass, crop, and urban). (B) Elevation.
2.2 Meteorological data
China Meteorological Forcing Dataset (CMFD) datasets combine multiple sets of reanalysis data and site-level data, and has undergone strict quality control and calibration, with high data quality and accuracy (Yang et al., 2010; He et al., 2020). In order to study the climatic change in the YRB, we picked the monthly temperature, precipitation and downward shortwave radiation data with a spatial resolution of 0.1°.
2.3 Vegetation data
GPP is usually used to characterize the photosynthetic capacity of an ecosystem (Anav et al., 2015). LAI is an index to measure vegetation density and coverage degree, which can reflect the number and distribution of plant leaves, and is usually used to represent the inter-annual dynamic changes of vegetation (Sun and Qin, 2016). In order to study the change of vegetation in the YRB, LAI dataset of GEOV2 and GPP dataset based on NIRv vegetation index were used (Vickers et al., 2016; Wang et al., 2021). The spatial resolutions of GEOV2_LAI and NIRv_GPP are 1 km and 0.05°, respectively, and the temporal resolutions are 10 days and monthly, respectively. We uniformly converted GPP and LAI data into 0.1°, month-scale spatio-temporal resolution to match meteorological data, and analyzed vegetation change in the YRB.
2.4 Drought index
SPEI is useful for identifying how variations in wet and dry conditions affect vegetation (Vicente-Serrano et al., 2010). To study the dry and wet fluctuations in the YRB, SPEI is typically utilized as the drought index (Wang et al., 2020). The SPEI dataset (Global SPEI database) we used has a spatiotemporal resolution of 0.5° and monthly scales (Beguería et al., 2010; Beguería et al., 2014). When examining how various vegetation types respond to drought, the time scale of the drought index is crucial. SPEI at various time scales is a representation of the cumulative water balance over time. SPEI of 1–2 month-scales is often used to characterize agricultural drought (Mishra and Desai, 2005), and SPEI of 3–6 month-scales is often used to study soil water loss (Ji and Peters, 2003; Lotsch et al., 2003; Hirschi et al., 2011). In order to assess the dry and wet changes in the YRB, we employed SPEI with time scales of 1, 6, and 12 months, labeling them as SPEI01, SPEI06, and SPEI12, respectively. We converted 0.5° SPEI data to 0.1° for dry and wet analysis to match the spatial resolution of meteorological data.
2.5 Land cover data
The MCD12Q1 and MCD12C1 Version 6 dataset are derived using a supervised classification of MODIS Terra and Aqua reflectance, which are then subjected to additional post-processing, incorporating prior knowledge and auxiliary information to further refine a particular category. Therefore, we used MCD12Q1 data with a spatial resolution of 500 m from 2001 to 2018 to describe the land cover change of YRB. Additionally, we employed MCD12C1 to quantify the impacts of climate change and human activity on various vegetation types (Friedl and Sulla-Menashe, 2015). Land cover was categorized using the International Geosphere Biosphere Programme (IGBP) guidelines (Friedl et al., 2010). Land cover was categorized into water, forest, grass, crop, and urban by merging the primary vegetation types in the YRB. Since MCD12Q1 and MCD12C1 lack 2000 land cover data, we used 2001 land cover data instead for land cover conversion analysis.
2.6 Residual trend analysis and relative contribution calculation
We separated and measured the effects of human activity and climate change on vegetation using the residual trend method (Evans and Geerken, 2004; Jiang et al., 2017). The residual trend method was divided into three steps: 1) Combined with the idea of binary linear regression, temperature and precipitation were considered the independent variables, and vegetation was chosen as the dependent variable, and linear regression parameters are calculated by establishing regression models; 2) The estimated vegetation (
Estimated vegetation and remote sensing vegetation data were denoted in the formula by the letters
Utilizing the residual trend approach, we distinguished between the effects of climate change and human activity on vegetation, and then, using the following formula in combination (Table 1), we computed the relative contribution rates of climate change and human activity on vegetation (Shi et al., 2021).
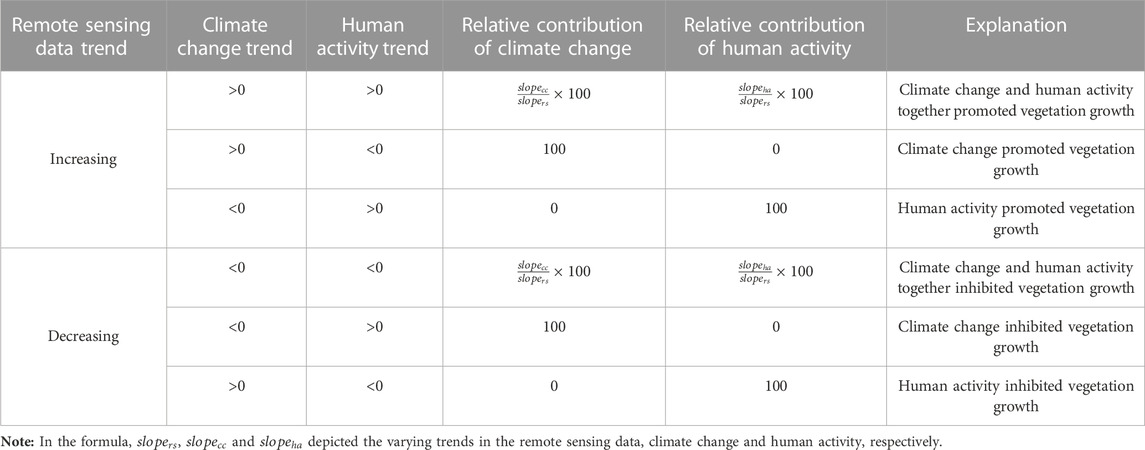
TABLE 1. Calculation table of the rate at which climate change and human activity contribute to vegetation.
2.7 Land cover transfer matrix
The land cover transfer matrix shows the alterations and directions of all types of land cover in the research region before and after conversion, as well as the area where each type of land cover will be converted (Wang and Bao, 1999). The expression is as follows:
The land cover types at the start and end of the study, respectively, were represented by
3 Results
3.1 Climate change
With high temperatures in the east and low temperatures in the west, as well as high temperatures in the south and low temperatures in the north, the spatial distribution of air temperature in the YRB displayed a spatial heterogeneity pattern (Figure 2A). As a whole, the temperature increasing rate in the west was higher than that in the east, and the rate of increase in the south was faster than in the north. The fastest-growing and significant regions were located in the middle and upper reaches of YRB (MUYRB) and YRD (Figures 2B, C). In the YRB, the yearly precipitation variation trend showed a sizable geographical disparity. The YRB’s eastern, middle, and southern regions experienced about 1,500 mm of precipitation, compared to barely 500 mm in the western and the Yangtze River Source region (YRS) (Figure 2D). The southern and northern regions of China experienced a drop in annual precipitation. The YRS exhibited the largest decreasing trend, reaching −40 mm yr−1. Precipitation in the eastern coastal areas showed an obvious increasing trend, and some areas showed inter-annual variation of precipitation greater than 40 mm yr−1 (Figures 2E, F). Contrary to the distribution of precipitation and temperature, the radiation distribution in the west is higher than that in the east (Figure 2G). As shown in Figures 2H, I, the spatial variation of radiation is high in the west and low in the east. On the whole, the temperature in most areas of the YRB showed a significant upward trend, the precipitation increased in the east and decreased in the west, and the radiation variation was relatively low.
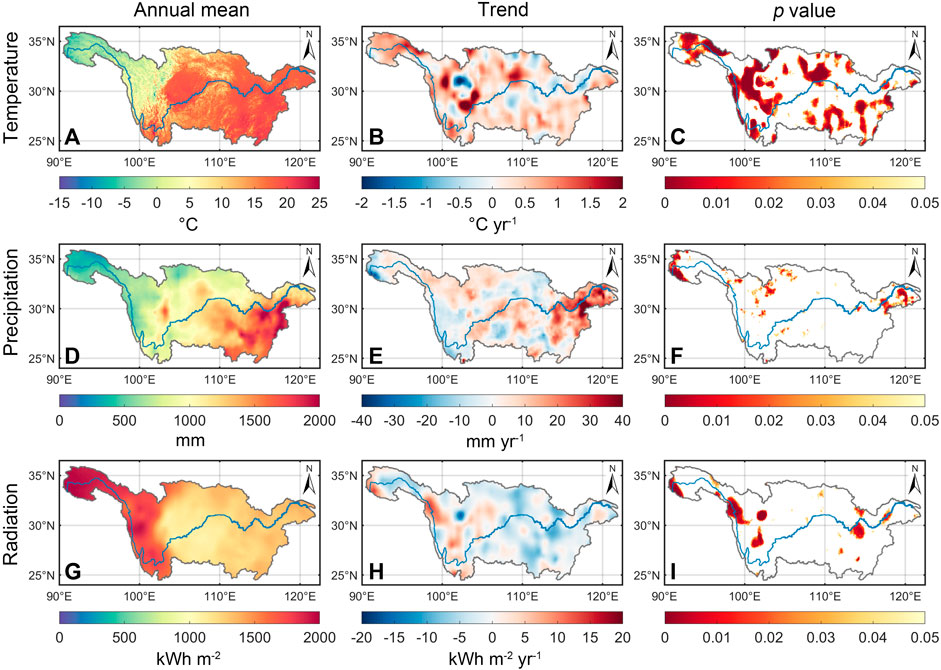
FIGURE 2. Temperature, precipitation and radiation distributions in the YRB from 2000 to 2018. (A,D,G) Annual mean value, respectively. (B,E,H) Annual trend, respectively. (C,F,I) Significance p-value (p < 0.05), respectively.
The YRB’s average annual temperature from 2000 to 2018 was 12.41°C, and it increased at a significant rate of 0.03°C yr−1 (p < 0.05) (Figure 3A). The YRB experienced strong summer and low winter temperature variations, with the peak temperature reaching 22.28°C in July (Figure 3D). The YRB’s average annual precipitation from 2000 to 2018 was 1,052.16 mm, with a 4.02 mm yr−1 overall increase, however this trend was not statistically significant (p = 0.33) (Figure 3B). The maximum precipitation (1,204.54 mm) occurred in 2016, while the minimum precipitation (892.03 mm) occurred in 2011. Consistent with temperature, the monthly precipitation showed obvious seasonal changes in Figure 3E, with little precipitation in winter and more precipitation in summer, and the peak value appeared in June (170.04 mm). In Figure 3C, the inter-annual variation of radiation was low, showing a decreasing trend of −1.08 kWh yr−1 (p = 0.40). On the monthly scale, the overall change is similar to temperature and precipitation, but it is worth mentioning that there is a decline of about 20 kWh in June (Figure 3F). Therefore, climate change in the YRB was observed to present a trend of warming and wetting.
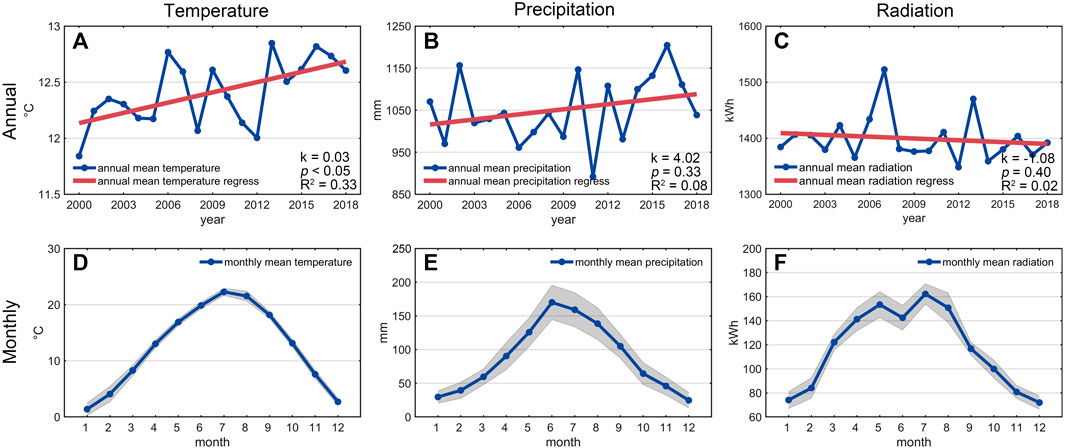
FIGURE 3. Temperature and precipitation changes in the YRB from 2000 to 2018. (A,D) Temperature annual and monthly changes, respectively. (B,E) Precipitation annual and monthly changes, respectively. (C,F) Radiation annual and monthly changes, respectively.
Figure 4 shows that the SPEI in the northern and southwestern parts of the YRB is less than 0, showing a slight drought. The SPEI in the YRB displayed a more significant spatial variation trend as time scale increased, and the SPEI in the majority of locations displayed an increasing trend. By averaging SPEI of different time scales, it could be found that 69.76% of the grid points were positive and 30.24% of the grid points were negative, indicating that the majority of the YRB became wetter. The YRB’s central and eastern regions had an increase in SPEI, indicating a tendency toward a progressive wetness with an increase in precipitation. The SPEI displayed a decreasing tendency in the western and northern regions of the YRB, which was consistent with the local temperature’s upward and downward trends. It was clear that the SPEI could accurately capture the impact of temperature and precipitation together.
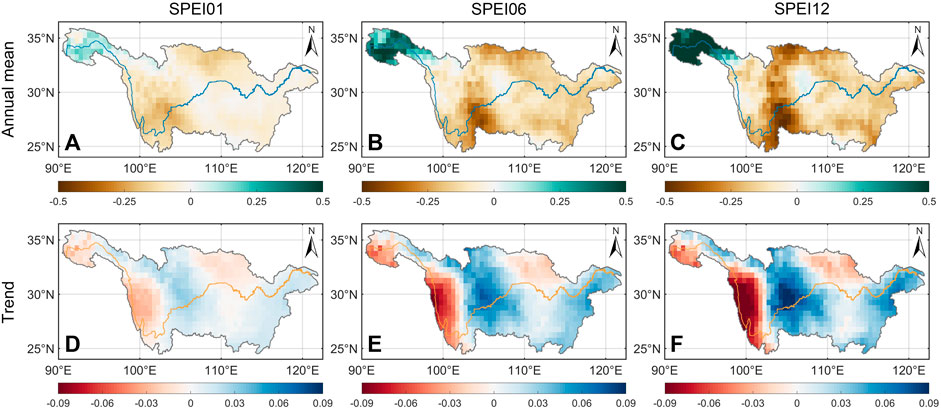
FIGURE 4. SPEI (1, 6, and 12 month-scales) spatial distribution in the YRB from 2000 to 2018. (A–C) Annual mean value, respectively. (D–F) Annual trend, respectively.
Overall, through the calculation of the SPEI in the YRB, we observed a consistent and increasing trend in the inter-annual variation of SPEI at the 1, 6, and 12 month-scales (0.01 years−1). This trend indicates that the YRB has been experiencing a progressive increase in moisture levels over time, as depicted in Figure 5. The consistent pattern observed across the 1, 6, and 12 month-scales implies a sustained influence of climate factors on the basin’s hydrological conditions.
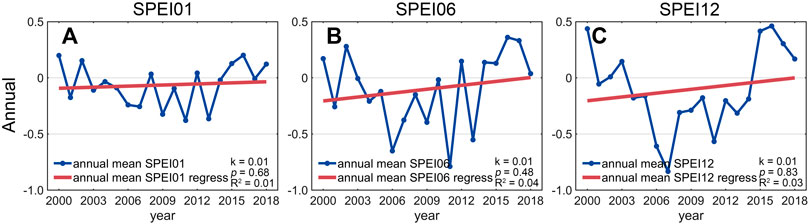
FIGURE 5. Changes of SPEI in the YRB from 2000 to 2018. (A–C) Annual trends of SPEI in 1, 6, and 12 month-scales, respectively.
3.2 Vegetation and land cover change
As shown in Figure 6A, GPP value was higher in the eastern and southern parts of the YRB, with an annual mean value of around 2,000 g C m−2 yr−1. However, only about 500 g C m-2 yr-1 of GPP was produced on average annually in the YRD and the YRS. Figure 6B demonstrated that the GPP in the middle of the YRB increased at a rate of around 10 g C m−2 yr−2 while decreasing at a rate of about 10 g C m−2 yr−2 in the YRD and the MLYRB. The YRS remained largely constant and shown a decreasing tendency in some parts, while the MUYRB and northern regions of the YRB showed an increasing trend. Figure 6C showed a similar regional distribution of multi-year LAI mean values in the YRB as Figure 6A, indicating that LAI values in the YRS and the YRD were low. In Figure 6D, LAI decreasing regions were mostly found in the YRD and the MLYRB. It is important to note that while LAI in the majority of the western regions showed little change, LAI in the north, south, and southeast of the YRB exhibited an increasing trend of more than 0.06 years−1. In the western YRB, GPP showed a decreasing trend, while LAI did not change significantly. Overall, from 2000 to 2018, the increasing trend in GPP accounted for 83.78% and the increasing trend in LAI accounted for 91.02%. Only 16.22% of the GPP and 8.98% of the LAI showed a declining trend in the YRB. From 2000 to 2018, most vegetation in the YRB showed continuous greening.
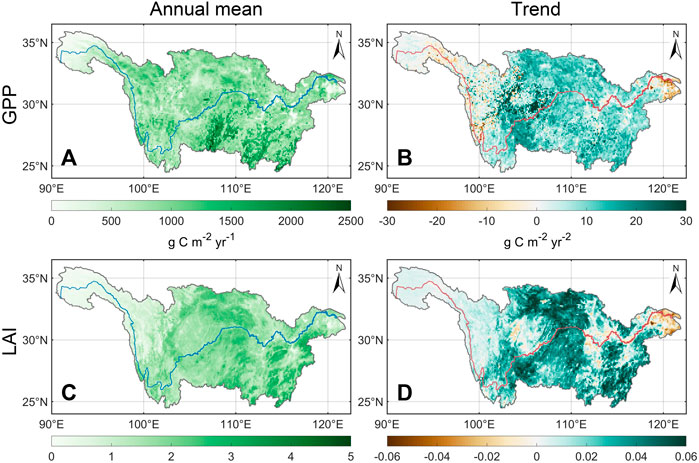
FIGURE 6. GPP and LAI spatial distribution in the YRB from 2000 to 2018. (A,C) Annual mean value, respectively. (B,D) Annual trend, respectively.
By calculating the total amount of vegetation in the YRB, we could find the inter-annual variation trend of GPP in the YRB increased significantly, reaching 7.83 g C m−2 yr−2 (p < 0.01) (Figure 7A). The annual average GPP increased by 115.92 g C m−2 yr−1 from 804.20 g C m−2 yr−1 in 2000 to 920.12 g C m−2 yr−1 in 2018. The monthly pattern of vegetation growth shown by GPP peaked at 162.93 g C m−2 yr−1 in July (Figure 7B). The LAI inter-annual trend was 0.02 years-1 (p < 0.01), the same as the GPP inter-annual trend (Figure 7C). With a growth rate of 0.02 years-1 (p < 0.01), the monthly mean LAI values in the YRB increased from 1.38 in 2000 to 1.74 in 2018, and peaked in July, consistent with the monthly variation pattern of GPP (Figure 7D). Therefore, we could find that the overall vegetation in the YRB is gradually turning green.
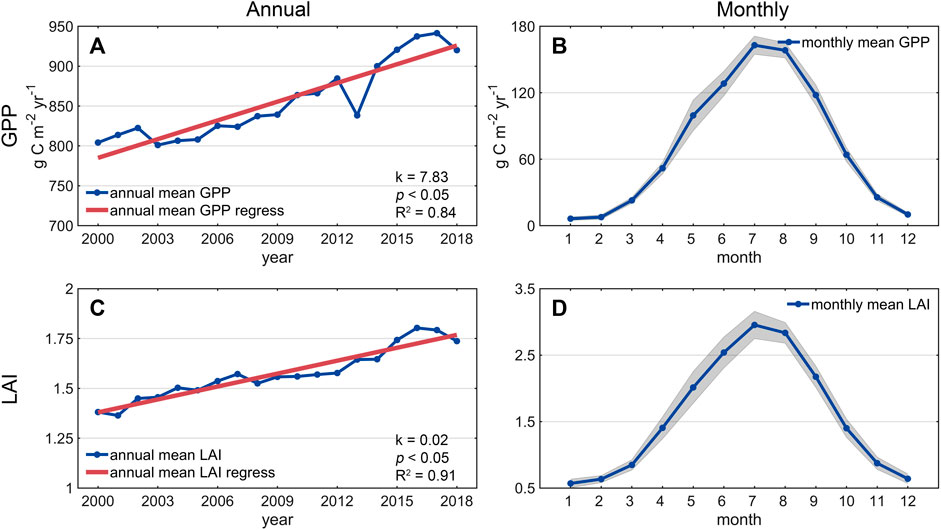
FIGURE 7. Changes of GPP and LAI in the YRB from 2000 to 2018. (A,C) GPP and LAI annual trends, respectively. (B,D) GPP and LAI monthly changes, respectively.
As shown in Table 2, significant spatial changes had taken place in land cover during 2001–2018. A total of 287,842 pixels of grass were converted into forest, making up 90.28% of the total gain in forest, which resulted in a net increase of 58,050 pixels in forest. Next came the contribution from crop, with 30,974 converted pixels, comprising 9.71% of the area increase overall. In the YRB, forest had the largest vegetation increase, with a net increase of 58,050 pixels, comprising 38.95% of the research region’s total increasing area. The grass decreased by 149,041 pixels net, accounting for 1.75% of the basin’s total area, and was primarily converted to forest, urban and crop. It could be seen that the mutual conversion of grass, forest and crop is the main mode of vegetation conversion in the YRB. The net increase of 1,857 pixels in the water represented the gradual expansion of the river and lake area in the humid state of the YRB. The urban expanded by 55,428 pixels, of which crop and grass contributed 98.88%. As a result of the YRB’s ongoing urbanization, a large amount of crop and grass has been converted into urban.
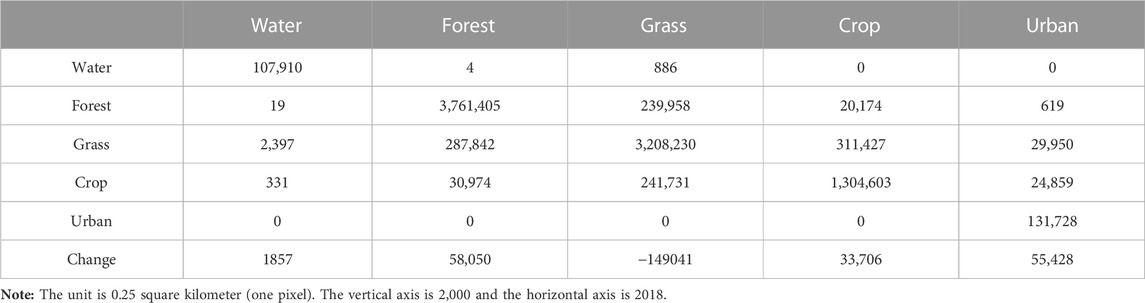
TABLE 2. The YRB’s land cover transfer matrix from 2000 to 2018.
3.3 Relative contributions of climate change and human activity to vegetation growth
In Figure 8, the correlation coefficient and time scale between vegetation and SPEI respectively represented the vegetation’s response and sensitivity to climate change. The spatial distribution of the maximum correlation between vegetation and SPEI01, SPEI06, and SPEI12 was depicted in Figures 8A, E, respectively. The majority of the YRB (79.93%) showed a positive correlation between climate change and vegetation growth, and 48.33% of those areas showed a significant positive correlation. This was particularly true in the central and southern regions of the YRB, where the correlation coefficient was greater than 0.5, demonstrating that climate change was a significant factor influencing YRB vegetation growth. The negative correlation was mainly concentrated in the YRS, western and northern part of the YRB, which were the main artificial ecological construction protection areas of the YRB, while the YRD was a rapidly developing area of urbanization (Figure 1A). According to Figures 8B, F, vegetation was most sensitive to SPEI12 (41.39%), which was mostly dispersed in the eastern and central portions of the YRB and the YRS. SPEI06 (30.50%) and SPEI01 (28.11%) were the next two most sensitive SPEIs to vegetation. Through the classification analysis of different vegetation can be found that the mean correlation of different vegetation types and time scales is positive (Figures 8C, G). In addition, there was a significant positive correlation between forest (0.31) and crop (0.28). Grass had the lowest sensitivity to SPEI, with an average correlation coefficient of 0.20 and a standard deviation of 0.28. The mean correlations of forest and crop were similar, but they were dispersed differently. The correlation standard deviations for forest and crop were 0.23 and 0.25, respectively, indicating that forest responded to climate change more evenly than crop. In descending order, the average correlation between SPEI and vegetation at different time periods was 0.21 for vegetation at 12 month-scale, 0.20 for vegetation at 6 month-scale, and 0.18 for vegetation at 1 month-scale, demonstrating that long-term climate change had a higher impact on vegetation growth (Figures 8D, H).
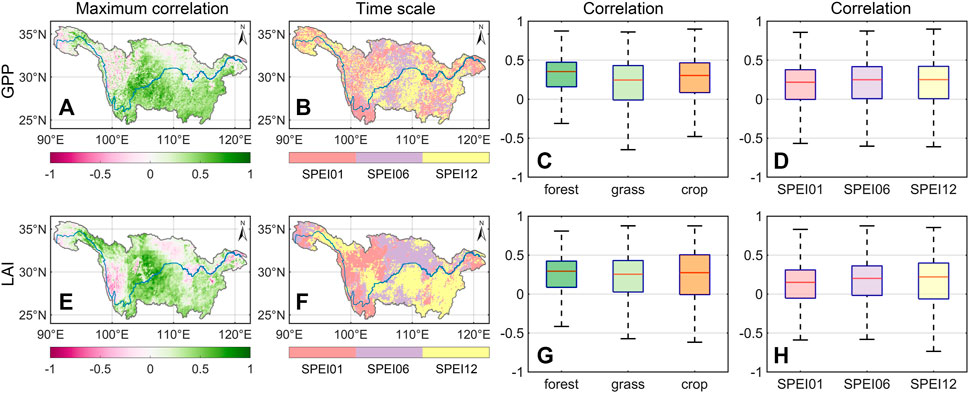
FIGURE 8. Correlation between SPEI and vegetation. (A,E) The maximum correlation between GPP, LAI, and SPEI, respectively. (B,F) The time scale corresponding to SPEI, respectively. (C,G) Correlation of different land cover types, respectively. (D,H) Correlation of different SPEI time scales, respectively.
The findings of residual trend analysis demonstrated the significant regional variability of the effects of human activity and climate change on vegetation in the YRB (Figure 9). We could find that not all regions meet the use conditions of residual analysis (R2 > 0.3, p < 0.05). Therefore, we analyzed the regions that meet the criteria. Most frequently seen in the northern and southern regions of the YRB, roughly 92.01% of the regions in the YRB demonstrated that climate change contributed to the rise in GPP. The region where climatic change prevented an increase in GPP accounted for 7.99% of the total area, and was primarily spread in the YRD (Figure 9A). Compared with GPP, LAI showed a similar spatial distribution of climate change impacts, in which 86.13% of the regions showed that climate change promoted the increase of GPP, while 13.87% of the regions showed that climate change inhibited vegetation growth (Figure 9E). Figure 9B shows that approximately 90.49% of GPP growth is influenced by human activity. The region where climate change increased GPP increased by 1.52% when compared to the impact of human activity, primarily in the central and northern regions of the YRB. The inhibition of human activity on the growth of GPP accounted for 9.51% of the total area, mainly concentrated in the YRD. The spatial area of LAI influenced by human activity and climate change was larger than that of GPP, but the distribution pattern was similar to that of GPP (Figures 9E, F).
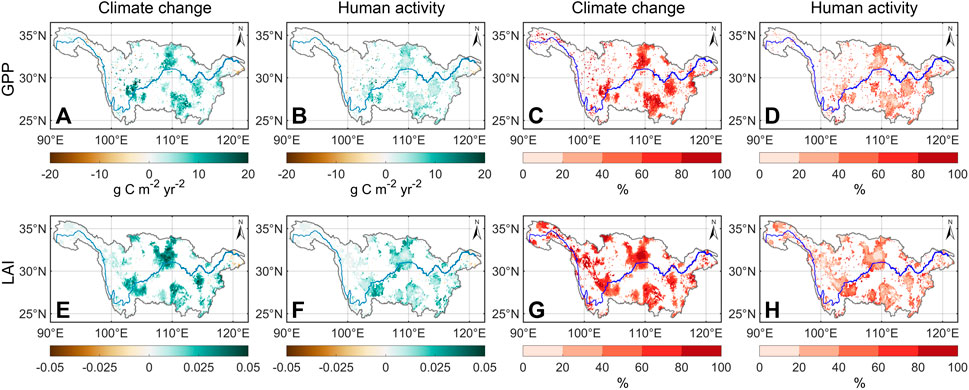
FIGURE 9. Effects of human activity and climate change on vegetation growth. (A,B) Trends of climate change and human activity impact on GPP. (C,D) Relative contributions of climate change and human activity impact on GPP. (E,F) Trends of climate change and human activity impact on LAI. (G,H) Relative contributions of climate change and human activity impact on LAI.
By comparing the proportional rates of climate change and human activity, it was discovered that climate change contributed up to 61.28% of the YRB’s vegetation growth, while human activity contributed 38.72%. Only 26.87% of the YRB’s vegetative area was less impacted by climate change than by human activity, and it was primarily concentrated in the region’s center and southern (Figures 9C, D, G, H). It was evident that vegetation growth in the YRB was mainly driven by climate change, and human activity was mainly auxiliary.
Additionally, the contribution rates of climate change and human activity to various vegetation types varied (Table 3). The average relative contribution of human activity to crops reached the highest value (43.62%), while that of climate change reached the lowest value (56.38%). Climate change and human activity each contributed on average 60.71% and 39.29% of forest, respectively. In grass, climate change and human activity had contributed 63.66% and 36.34%, respectively. Therefore, in all vegetation, climate change dominated the vegetation growth process, and human activity contributed more to crop growth than other vegetation.
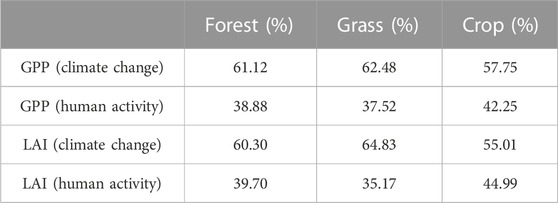
TABLE 3. Different vegetation types’ relative contributions from human activity and climate change.
4 Discussion
For the investigation and measurement of the natural drivers of ecosystems, the vegetation is sensitive to the influence of climate (Knapp and Smith, 2001; Piao et al., 2020). From 2000 to 2018, the YRB showed a climate change characteristic of warming and wetting (Figure 2; Figure 3). As a typical humid and semi-humid region, temperature has the greatest effect on vegetation growth (Zhang et al., 2020). Since vegetation growth in the YRB was easily affected by temperature change, the correlation between SPEI and vegetation was mostly positive (Figure 8), which is consistent with other research results in the YRB (Chen et al., 2018; Shi et al., 2022). The negative correlation accounted for only 20.07% of the YRB area and was concentrated in northern crop, the urban of the YRD and the western alpine grass (Figure 8). In these areas, the radiation amount is large and the temperature is high (Figure 2), resulting in low precipitation and large surface evapotranspiration, which makes SPEI show a downward trend and show the characteristics of gradual drought (Pan et al., 2015).
Human activity has transformed vast amounts of grass into urban, crop and forest in the YRB (Table 2). Since crop growth is still mainly affected by climate change and is more affected by human land management than other vegetation types, the contribution rate of human activity to crop growth is relatively high (Table 3), resulting in a decrease in the sensitivity of crop growth to climate change (Xin et al., 2008; Piao et al., 2010). The climate in the high altitude area changes with the increase of altitude, the radiation increases, and the temperature and precipitation decreased gradually. Due to the high sensitivity of grass to climate change, the growth of western alpine grass was limited (Nemani et al., 2003; Páscoa et al., 2018; Gao et al., 2019), thus shrinking the grass area in the western YRB (Table 2). With the gradual decrease of altitude, temperature and precipitation gradually increased as controlling factors influencing vegetation growth, and the change rate of temperature and precipitation would also gradually increase (Figure 2). However, long-term climate change had a higher impact on vegetation than short-term climate change (Figure 8), which is in line with other research findings (Wu et al., 2015; Chen et al., 2020).
The climate of the YRB had become warmer and wetter (Figure 3), which effectively promoted the growth of vegetation. However, the direct and indirect influences of human activity on vegetation growth should also be considered (Piao et al., 2015; Piao et al., 2020). Both climate change and human activity were discovered to have an impact on vegetation change in the YRB, but the relative proportions were very different. As shown in Figure 9, climate change and human activity mainly promoted vegetation growth, and there were few areas that inhibited vegetation growth. Among them, the YRD is the main area where human activity inhibited vegetation growth. A large amount of crop and forest around urban was converted into urban to meet the needs of urban development, leading to a significant reduction of vegetation around urban land (Table 2). It could be seen that urbanization progress is an important cause of vegetation degradation (Fu et al., 2018). The MUYRB is an important ecological area in China, as well as key area for the implementation of the project of returning crop to forest and the construction of artificial forests. Human activity had shown that they promote vegetation growth and increase forest (Table 2). In Figure 9, It could be seen that the project of returning crop to forest effectively improved the human-land relationship and promoted the growth of vegetation in the MUYRB (Wang et al., 2015). Although human activity were important drivers of crop cultivation (Chen et al., 2019; Wang et al., 2023), but some vegetation in the YRD still showed negative growth (Figure 9), which was caused by the conversion of a large number of grass areas into crop and urban (Table 2), which reduced the vegetation coverage area and weakened the carbon sequestration ability of vegetation, thus showing the inhibition effect of human activity on vegetation growth (Yang et al., 2022).
By comparing relative contribution rates, it could be found that human activity was an important influence on vegetation growth in the YRB, but climate change lead vegetation change in all vegetation types (Figure 9; Table 3). Therefore, studying the interaction between YRB vegetation and climate change and understanding the response of ecosystem to human activity will provide an important reference for the future construction of YRB ecological conservation projects.
At present, the use of residual analysis method to study the typical humid and semi-humid YRB has certain limitations in the quantitative assessment of the impacts of climate change and human activity on vegetation. The residual analysis method relies on reliable remote sensing data and climate data. However, the widely used CMFD data sets in China have low spatial resolution. Therefore, obtaining high-quality, high spatio-temporal resolution data remains a challenge. The residual analysis method mainly focuses on the modeling and analysis of linear relationships, while the response of vegetation to climate change and human activity may have nonlinear characteristics. Therefore, it is of great significance to further study the mechanism and method of vegetation nonlinear response for more accurate interpretation of vegetation dynamic change.
In general, the use of residual analysis method to study the impact of vegetation on the typical humid and semi-humid YRB has limitations in data availability, model complexity, research comprehensiveness and nonlinear response challenges. The future development direction should focus on improving the quality and availability of data, improving the accuracy of the model, considering the influence of multiple factors, and deeply studying the nonlinear response. This will help to evaluate the driving mechanism of dynamic vegetation change in the YRB more comprehensively and accurately, and predict the future vegetation change trend.
5 Conclusion
This study looked at how climate change and human activity affected vegetation growth from 2000 to 2018. The SPEI was used to examine how vegetation responded to climate change in the YRB. Additionally, the relative contribution rate was calculated to examine the effects of climate change and human activity on vegetation growth. Quantitative analysis of the effects of climate change and human activity on vegetation change in humid and sub-humid areas is novel in this study.
The YRB experienced an annual average temperature warming rate of 0.03°C yr−1 and an increase in precipitation of 4.02 mm yr−1, presenting a gradually warm and wet state. There was a significant positive correlation between vegetation and SPEI in most areas of the YRB (79.93%), indicating that climate change has significantly affected vegetation growth. Vegetation in the YRB was more susceptible to SPEI over a long time scale. The forest cover has significantly increased during 2000–2018, on the YRB. The vegetation of the YRB showed a significant increasing trend (7.83 g C m−2 yr−2). With the continuous development of urbanization, a large number of crop and grass were converted into urban. It reduced the area covered by vegetation and weakened the carbon sequestration ability of vegetation. Climate change and human activity were both driving factors affecting vegetation changes. Among all vegetation changes in the YRB, the relative effect of climate change accounted for 61.28%, and the relative effect of human activity accounted for 38.72%, among which crops were most affected by human activity and the average relative contribution rate of human activity reached the maximum (43.62%), indicating that agricultural management was the important driving factor of crop change. Human activity not only promoted the growth of crop, but also inhibited YRD vegetation growth. Nevertheless, human activity has played a crucial role in promoting vegetation growth in the YRB, with the extent of promotion covering approximately 90.49% of the area. In general, vegetation growth in the YRB is positively influenced by both climate change and human activity, with climate change playing a prominent role. Therefore, coordinating climate change with reducing intensive human activity was a reasonable way to restore the ecosystem in the YRB.
Data availability statement
The original contributions presented in the study are included in the article material, further inquiries can be directed to the corresponding author.
Author contributions
The authorship of this research was divided among RG, AC, and XC. RG and AC contributing to the conceptualization and writing of the original draft, and all authors being involved in the data curation and visualization. XC provided additional support in writing, review, and editing. All authors contributed to the article and approved the submitted version.
Funding
This study was financially supported by the National Natural Science Foundation of China (Grant No. 52078237) and the Jiangsu Province Postgraduate Research and Practice Innovation Plan Project (Grant No. KYCX23_1322) in 2023.
Acknowledgments
The authors extend their gratitude to the editorial team and reviewers for their insightful comments and suggestions, which significantly contributed to the enhancement of the present article.
Conflict of interest
The authors declare that the research was conducted in the absence of any commercial or financial relationships that could be construed as a potential conflict of interest.
Publisher’s note
All claims expressed in this article are solely those of the authors and do not necessarily represent those of their affiliated organizations, or those of the publisher, the editors and the reviewers. Any product that may be evaluated in this article, or claim that may be made by its manufacturer, is not guaranteed or endorsed by the publisher.
References
Anav, A., Friedlingstein, P., Beer, C., Ciais, P., Harper, A., Jones, C., et al. (2015). Spatiotemporal patterns of terrestrial gross primary production: a review. Rev. Geophys. 53, 785–818. doi:10.1002/2015rg000483
Beguería, S., Vicente-Serrano, S. M., and Angulo-Martínez, M. (2010). A multiscalar global drought dataset: the SPEIbase: a new gridded product for the analysis of drought variability and impacts. Bull. Am. Meteorological Soc. 91, 1351–1356. doi:10.1175/2010bams2988.1
Beguería, S., Vicente-Serrano, S. M., Reig, F., and Latorre, B. (2014). Standardized precipitation evapotranspiration index (SPEI) revisited: parameter fitting, evapotranspiration models, tools, datasets and drought monitoring. Int. J. Climatol. 34, 3001–3023. doi:10.1002/joc.3887
Cao, W., Wu, D., Huang, L., Pan, M., and Huhe, T. (2021). Determinizing the contributions of human activities and climate change on greening in the Beijing–Tianjin–Hebei Region, China. Sci. Rep. 11, 21201. doi:10.1038/s41598-021-00788-4
Chen, C., Park, T., Wang, X., Piao, S., Xu, B., Chaturvedi, R. K., et al. (2019). China and India lead in greening of the world through land-use management. Nat. Sustain. 2, 122–129. doi:10.1038/s41893-019-0220-7
Chen, S., Zhang, L., Liu, X., Guo, M., and She, D. (2018). The use of SPEI and TVDI to assess temporal-spatial variations in drought conditions in the middle and lower reaches of the Yangtze River basin, China. Adv. Meteorology 2018, 1–11. doi:10.1155/2018/9362041
Chen, Z., Wang, W., and Fu, J. (2020). Vegetation response to precipitation anomalies under different climatic and biogeographical conditions in China. Sci. Rep. 10, 830. doi:10.1038/s41598-020-57910-1
Evans, J., and Geerken, R. (2004). Discrimination between climate and human-induced dryland degradation. J. arid Environ. 57, 535–554. doi:10.1016/s0140-1963(03)00121-6
Forkel, M., Carvalhais, N., Rödenbeck, C., Keeling, R., Heimann, M., Thonicke, K., et al. (2016). Enhanced seasonal CO2 exchange caused by amplified plant productivity in northern ecosystems. Science 351, 696–699. doi:10.1126/science.aac4971
Friedl, M. A., Sulla-Menashe, D., Tan, B., Schneider, A., Ramankutty, N., Sibley, A., et al. (2010). MODIS Collection 5 global land cover: algorithm refinements and characterization of new datasets. Remote Sens. Environ. 114, 168–182. doi:10.1016/j.rse.2009.08.016
Friedl, M., and Sulla-Menashe, D. (2015). “MCD12C1 MODIS/Terra+ Aqua land cover type yearly L3 global 0.05 Deg CMG V006,” in NASA EOSDIS land processes DAAC (Washington, United States: NASA).
Fu, W., Lü, Y., Harris, P., Comber, A., and Wu, L. (2018). Peri-urbanization may vary with vegetation restoration: a large scale regional analysis. Urban For. Urban Green. 29, 77–87. doi:10.1016/j.ufug.2017.11.006
Gao, M., Piao, S., Chen, A., Yang, H., Liu, Q., Fu, Y. H., et al. (2019). Divergent changes in the elevational gradient of vegetation activities over the last 30 years. Nat. Commun. 10, 2970. doi:10.1038/s41467-019-11035-w
Han, Z., Song, W., Deng, X., and Xu, X. (2018). Grassland ecosystem responses to climate change and human activities within the Three-River Headwaters region of China. Sci. Rep. 8, 9079. doi:10.1038/s41598-018-27150-5
He, J., Yang, K., Tang, W., Lu, H., Qin, J., Chen, Y., et al. (2020). The first high-resolution meteorological forcing dataset for land process studies over China. Sci. data 7, 25. doi:10.1038/s41597-020-0369-y
Hirschi, M., Seneviratne, S. I., Alexandrov, V., Boberg, F., Boroneant, C., Christensen, O. B., et al. (2011). Observational evidence for soil-moisture impact on hot extremes in southeastern Europe. Nat. Geosci. 4, 17–21. doi:10.1038/ngeo1032
Ji, L., and Peters, A. J. (2003). Assessing vegetation response to drought in the northern Great Plains using vegetation and drought indices. Remote Sens. Environ. 87, 85–98. doi:10.1016/s0034-4257(03)00174-3
Jiang, L., Bao, A., Guo, H., and Ndayisaba, F. (2017). Vegetation dynamics and responses to climate change and human activities in Central Asia. Sci. Total Environ. 599, 967–980. doi:10.1016/j.scitotenv.2017.05.012
Jiao, W., Chang, Q., and Wang, L. (2019). The sensitivity of satellite solar-induced chlorophyll fluorescence to meteorological drought. Earth's Future 7, 558–573. doi:10.1029/2018ef001087
Jin, K., Wang, F., and Li, P. (2018). Responses of vegetation cover to environmental change in large cities of China. Sustainability 10, 270. doi:10.3390/su10010270
Knapp, A. K., and Smith, M. D. (2001). Variation among biomes in temporal dynamics of aboveground primary production. Science 291, 481–484. doi:10.1126/science.291.5503.481
Li, S., Yang, S., Liu, X., Liu, Y., and Shi, M. (2015). NDVI-based analysis on the influence of climate change and human activities on vegetation restoration in the Shaanxi-Gansu-Ningxia Region, Central China. Remote Sens. 7, 11163–11182. doi:10.3390/rs70911163
Li, X., Du, L., Li, X., Yao, P., Luo, Z., and Wu, Z. (2022). Effects of human activities on urban vegetation: explorative analysis of spatial characteristics and potential impact factors. Remote Sens. 14, 2999. doi:10.3390/rs14132999
Liu, Y., Li, Y., Li, S., and Motesharrei, S. (2015). Spatial and temporal patterns of global NDVI trends: correlations with climate and human factors. Remote Sens. 7, 13233–13250. doi:10.3390/rs71013233
Lotsch, A., Friedl, M. A., Anderson, B. T., and Tucker, C. J. (2003). Coupled vegetation-precipitation variability observed from satellite and climate records. Geophys. Res. Lett. 30. doi:10.1029/2003gl017506
Ma, D., Deng, H., Yin, Y., Wu, S., and Zheng, D. (2019). Sensitivity of arid/humid patterns in China to future climate change under a high-emissions scenario. J. Geogr. Sci. 29, 29–48. doi:10.1007/s11442-019-1582-5
Mao, J., Shi, X., Thornton, P. E., Piao, S., and Wang, X. (2012). Causes of spring vegetation growth trends in the northern mid–high latitudes from 1982 to 2004. Environ. Res. Lett. 7, 014010. doi:10.1088/1748-9326/7/1/014010
Mathur, S., Agrawal, D., and Jajoo, A. (2014). Photosynthesis: response to high temperature stress. J. Photochem. Photobiol. B Biol. 137, 116–126. doi:10.1016/j.jphotobiol.2014.01.010
Metcalfe, D. B., Meir, P., Aragão, L. E., Lobo-Do-Vale, R., Galbraith, D., Fisher, R., et al. (2010). Shifts in plant respiration and carbon use efficiency at a large-scale drought experiment in the eastern Amazon. New Phytol. 187, 608–621. doi:10.1111/j.1469-8137.2010.03319.x
Mishra, A., and Desai, V. (2005). Drought forecasting using stochastic models. Stoch. Environ. Res. risk Assess. 19, 326–339. doi:10.1007/s00477-005-0238-4
Nemani, R. R., Keeling, C. D., Hashimoto, H., Jolly, W. M., Piper, S. C., Tucker, C. J., et al. (2003). Climate-driven increases in global terrestrial net primary production from 1982 to 1999. science 300, 1560–1563. doi:10.1126/science.1082750
Pan, S., Tian, H., Dangal, S. R., Yang, Q., Yang, J., Lu, C., et al. (2015). Responses of global terrestrial evapotranspiration to climate change and increasing atmospheric CO 2 in the 21st century. Earth's Future 3, 15–35. doi:10.1002/2014ef000263
Páscoa, P., Gouveia, C. M., Russo, A. C., Bojariu, R., Vicente-Serrano, S. M., and Trigo, R. M. (2018). Vegetation vulnerability to drought on southeastern Europe. Hydrology Earth Syst. Sci. Discuss., 1–29.
Piao, S., Ciais, P., Huang, Y., Shen, Z., Peng, S., Li, J., et al. (2010). The impacts of climate change on water resources and agriculture in China. Nature 467, 43–51. doi:10.1038/nature09364
Piao, S., Wang, X., Park, T., Chen, C., Lian, X., He, Y., et al. (2020). Characteristics, drivers and feedbacks of global greening. Nat. Rev. Earth Environ. 1, 14–27. doi:10.1038/s43017-019-0001-x
Piao, S., Yin, G., Tan, J., Cheng, L., Huang, M., Li, Y., et al. (2015). Detection and attribution of vegetation greening trend in China over the last 30 years. Glob. change Biol. 21, 1601–1609. doi:10.1111/gcb.12795
Qu, S., Wang, L., Lin, A., Zhu, H., and Yuan, M. (2018). What drives the vegetation restoration in Yangtze River basin, China: climate change or anthropogenic factors? Ecol. Indic. 90, 438–450. doi:10.1016/j.ecolind.2018.03.029
Rahmani, F., and Fattahi, M. H. (2021). A multifractal cross-correlation investigation into sensitivity and dependence of meteorological and hydrological droughts on precipitation and temperature. Nat. Hazards 109, 2197–2219. doi:10.1007/s11069-021-04916-1
Shi, M., Yuan, Z., Shi, X., Li, M., Chen, F., and Li, Y. (2022). Drought assessment of terrestrial ecosystems in the Yangtze River Basin, China. J. Clean. Prod. 362, 132234. doi:10.1016/j.jclepro.2022.132234
Shi, S., Yu, J., Wang, F., Wang, P., Zhang, Y., and Jin, K. (2021). Quantitative contributions of climate change and human activities to vegetation changes over multiple time scales on the Loess Plateau. Sci. Total Environ. 755, 142419. doi:10.1016/j.scitotenv.2020.142419
Sun, J., and Qin, X. (2016). Precipitation and temperature regulate the seasonal changes of NDVI across the Tibetan Plateau. Environ. Earth Sci. 75, 291–299. doi:10.1007/s12665-015-5177-x
Suzuki, R., Masuda, K., and Dye, D. G. (2007). Interannual covariability between actual evapotranspiration and PAL and GIMMS NDVIs of northern Asia. Remote Sens. Environ. 106, 387–398. doi:10.1016/j.rse.2006.10.016
Vicente-Serrano, S. M., Beguería, S., and López-Moreno, J. I. (2010). A multiscalar drought index sensitive to global warming: the standardized precipitation evapotranspiration index. J. Clim. 23, 1696–1718. doi:10.1175/2009jcli2909.1
Vickers, H., Høgda, K. A., Solbø, S., Karlsen, S. R., Tømmervik, H., Aanes, R., et al. (2016). Changes in greening in the high arctic: insights from a 30 year AVHRR max NDVI dataset for svalbard. Environ. Res. Lett. 11, 105004. doi:10.1088/1748-9326/11/10/105004
Wang, J., Wang, K., Zhang, M., and Zhang, C. (2015). Impacts of climate change and human activities on vegetation cover in hilly southern China. Ecol. Eng. 81, 451–461. doi:10.1016/j.ecoleng.2015.04.022
Wang, Q., Huang, K., Liu, H., and Yu, Y. (2023). Factors affecting crop production water footprint: A review and meta-analysis. Sustain. Prod. Consum. 36, 207–216. doi:10.1016/j.spc.2023.01.008
Wang, S., Zhang, Y., Ju, W., Qiu, B., and Zhang, Z. (2021). Tracking the seasonal and inter-annual variations of global gross primary production during last four decades using satellite near-infrared reflectance data. Sci. Total Environ. 755, 142569. doi:10.1016/j.scitotenv.2020.142569
Wang, X., and Bao, Y. (1999). Study on the methods of land use dynamic change research. Prog. Geogr. 18, 81–87. doi:10.1007/s41748-017-0029-3
Wang, Y., Li, H., Sun, B., Chen, H., Li, H., and Luo, Y. (2020). Drought impacts on hydropower capacity over the Yangtze River basin and their future projections under 1.5/2° C warming scenarios. Front. Earth Sci. 8, 578132. doi:10.3389/feart.2020.578132
Wu, D., Zhao, X., Liang, S., Zhou, T., Huang, K., Tang, B., et al. (2015). Time-lag effects of global vegetation responses to climate change. Glob. change Biol. 21, 3520–3531. doi:10.1111/gcb.12945
Xin, Z., Xu, J., and Zheng, W. (2008). Spatiotemporal variations of vegetation cover on the Chinese Loess Plateau (1981–2006): impacts of climate changes and human activities. Sci. China Ser. D Earth Sci. 51, 67–78. doi:10.1007/s11430-007-0137-2
Yang, H., Zhong, X., Deng, S., and Nie, S. (2022). Impact of LUCC on landscape pattern in the Yangtze River Basin during 2001–2019. Ecol. Inf. 69, 101631. doi:10.1016/j.ecoinf.2022.101631
Yang, K., He, J., Tang, W., Qin, J., and Cheng, C. C. (2010). On downward shortwave and longwave radiations over high altitude regions: observation and modeling in the Tibetan Plateau. Agric. For. Meteorology 150, 38–46. doi:10.1016/j.agrformet.2009.08.004
Zhang, Y.-X., Wang, Y.-K., Fu, B., Dixit, A. M., Chaudhary, S., and Wang, S. (2020). Impact of climatic factors on vegetation dynamics in the upper Yangtze River basin in China. J. Mt. Sci. 17, 1235–1250. doi:10.1007/s11629-019-5649-7
Keywords: climate change, human activity, gross primary production, leaf area index, remote sensing, Yangtze River Basin
Citation: Guo R, Cai A and Chen X (2023) The quantitative effects of climate change and human activity on the vegetation growth in the Yangtze River Basin. Front. Earth Sci. 11:1168384. doi: 10.3389/feart.2023.1168384
Received: 17 February 2023; Accepted: 26 July 2023;
Published: 01 September 2023.
Edited by:
Ram Kumar Singh, TERI School of Advanced Studies (TERI SAS), IndiaReviewed by:
Kai Zhu, Hubei University, ChinaZhenhua Zou, University of Maryland, College Park, United States
Copyright © 2023 Guo, Cai and Chen. This is an open-access article distributed under the terms of the Creative Commons Attribution License (CC BY). The use, distribution or reproduction in other forums is permitted, provided the original author(s) and the copyright owner(s) are credited and that the original publication in this journal is cited, in accordance with accepted academic practice. No use, distribution or reproduction is permitted which does not comply with these terms.
*Correspondence: Anning Cai, Y2FpYW5uaW5nQG5qeHpjLmVkdS5jbg==