 Giuliana Andrea Díaz-Mendoza1*
 Knut Krämer1
 Gitta Ann von Rönn1Klaus Schwarzer1Christoph Heinrich2Hans-Christian Reimers2Christian Winter1
- 1Institute of Geosciences, Coastal Geology and Sedimentology, Christian-Albrechts-Universität zu Kiel, Kiel, Germany
- 2State Agency for Environment (LfU), Flintbek, Germany
Hydroacoustic observations of shallow marine environments reveal a variety of seafloor structures–both of natural and anthropogenic origin. Natural processes can result in features with circular geometries on the seafloor, such as kettles, sinkholes or iceberg pits, but human activities such as dredging, dumping, or detonating explosives can also cause similar shapes. Explaining the origin of these features is difficult if there are only few observations or if competing natural and anthropogenic processes have acted in the same area. Even though the location of dredging and dumping operations and munition blasting may be well documented in many parts of the global coastal ocean today, little information might be available about human practices in the past. In this study, more than 3,000 circular features were identified in side-scan sonar (SSS) datasets covering 1,549 km2 of shallow waters in the southwestern Baltic Sea. Additional data obtained by multibeam echosounder (MBES), sub-bottom profiler (SBP), and different SSS was considered in the analysis of 205 circular features that were characterized based on their sedimentology, morphology, SSS and SBP acoustic signatures. Characteristic differences between the structures allow their classification into six classes, which provide insight into their formation mechanisms. The obtained parameters (morphology, MBES and SSS acoustic backscatter, SBP characteristics and spatial distribution) allow the classification to be applied to the entire SSS dataset, resulting in the classification of 2,903 features. The mapped circular features have diameters between 6 and 77 m and correspond to pockmarks, dumping spots and explosion craters in water depths ranging from 8 m up to 25 m. Despite this rather multi-methodological approach, the origin of some observed features still cannot be explained with certainty, leaving room for further investigations of natural processes and human impacts on the seafloor.
1 Introduction
Over the last decades, the increased spatial resolution and accurate positioning of hydroacoustic instruments for seafloor measurements, i.e., MBES, SSS and SBP, has led to the discovery of many different characteristics of this rather complex and constantly changing environment. These include the distribution of substrates and habitats, sediment distribution patterns and structures caused by both natural processes (Hovland et al., 2010; Brown et al., 2017; Krämer et al., 2017; Marsh et al., 2018) and human activities (Manso et al., 2010; Bruns et al., 2020; Watson et al., 2022). Despite the availability of ever more high-resolution information on seafloor reflectivity (from MBES or SSS backscatter), and its morphological structural and textural characteristics such as roughness, slope, curvature, bathymetric position index (BPI) (Walbridge et al., 2018), uncertainties may remain, particularly where ground truthing observations are limited by scale or visibility (for optical ground truthing), or are not available at all.
Many typical features observed in bathymetric or SSS images, such as submarine glacial landforms (Batchelor et al., 2018), current-induced bedforms (Ernstsen et al., 2006; Lefebvre et al., 2021), or sorted bedforms (Murray and Thieler, 2004; Diesing et al., 2006) have a characteristic elongated, linear pattern and are easily explained. Linear seafloor features of anthropogenic origin include anchor scars (Watson et al., 2022), pipelines, cables, trawl marks (Krost et al., 1990; Bunke et al., 2019; Bruns et al., 2020) and troughs resulting from sediment extraction (Manso et al., 2010). Circular or elliptical features are also ubiquitous on the seafloor. For their formation, different mechanisms can play a role (Table 1); however, due to their geometrical similarity, the explanation of their origin can be more difficult, especially in areas where both natural processes and anthropogenic activities occur (Bunke et al., 2019). This is of particular concern for ecosystem-based management and environmental assessment strategies, as demanded by several marine directives such as the European Marine Strategy Framework Directive (MSFD) (European Commission, 2008).
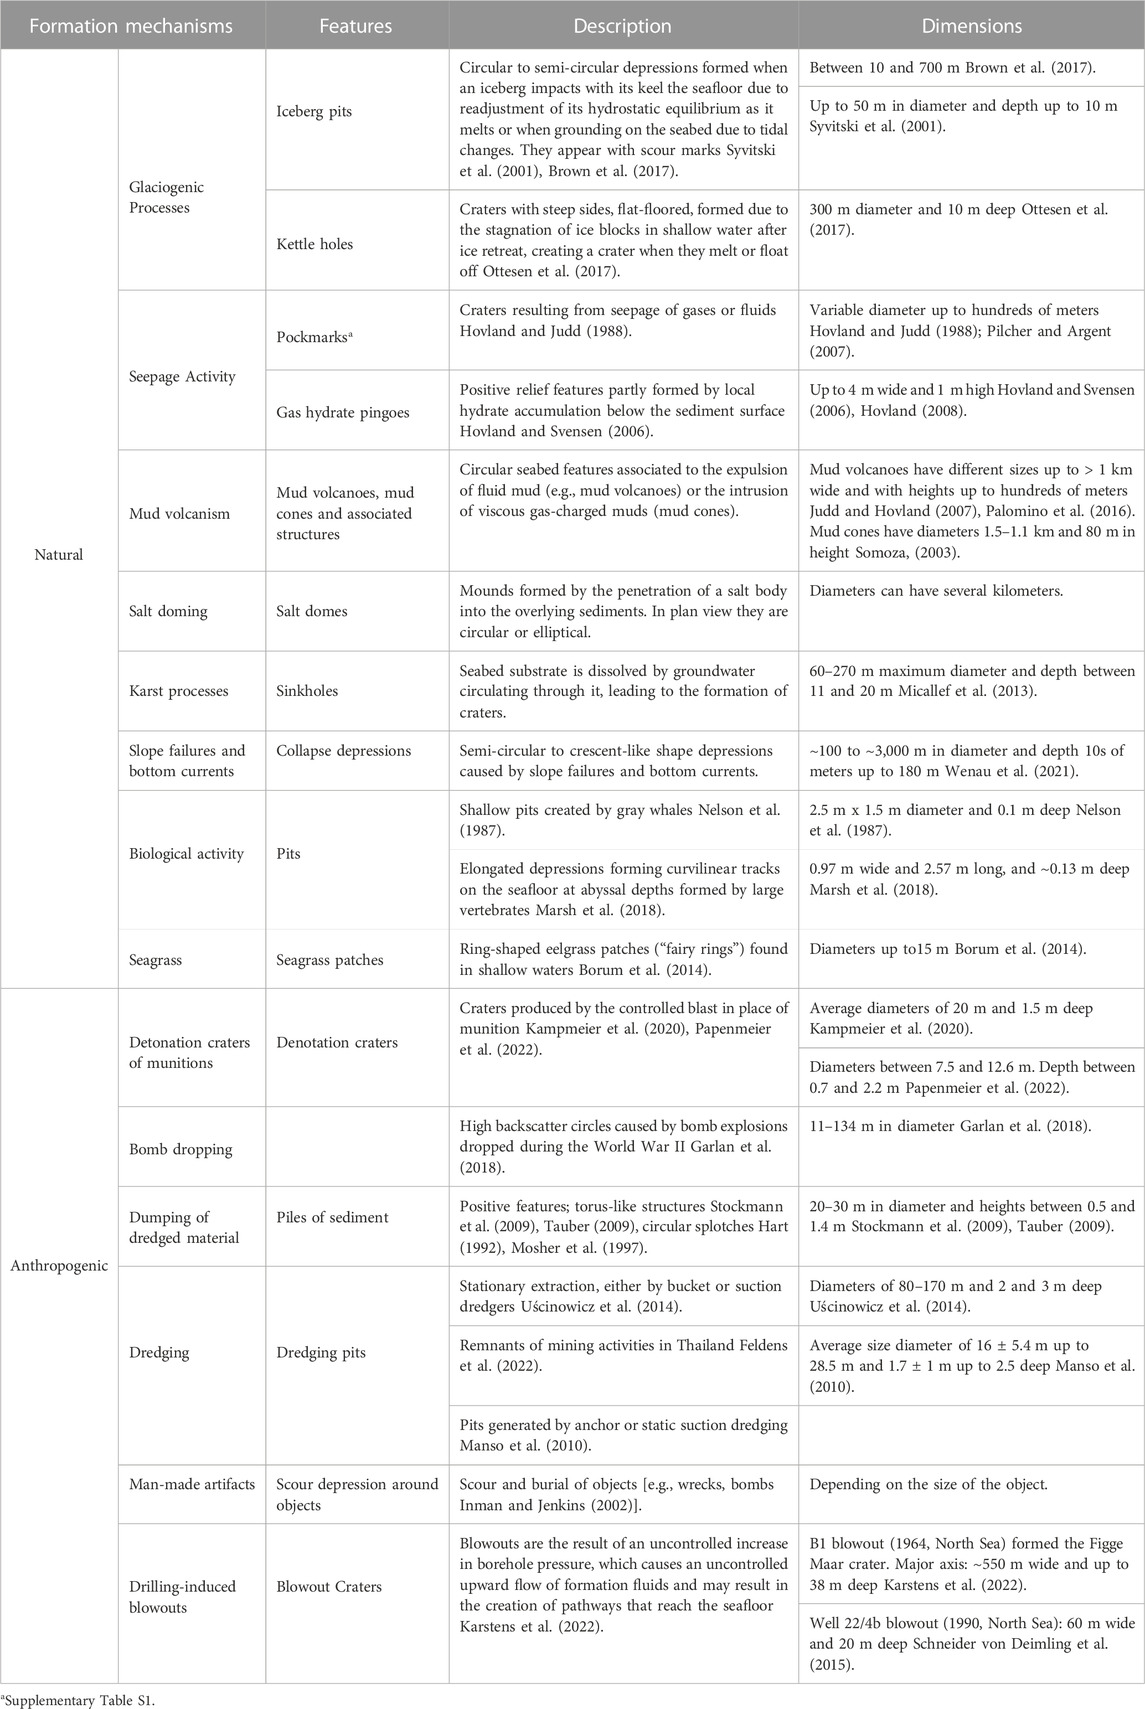
TABLE 1. Examples of circular seafloor features reported in literature.
Pockmarks have recently been of increasing interest to the scientific community and have been studied worldwide (Supplementary Table S1), from deep water environments (Dimitrov and Woodside, 2003; Pilcher and Argent, 2007) to shallow marine settings (Schlüter et al., 2004; Rogers et al., 2006; Hoffmann et al., 2020), as well as in lakes (Wessels et al., 2010; Bussmann et al., 2013; Cojean et al., 2021) and estuaries (Pinet et al., 2008; Brothers et al., 2012). These morphological features, which are recognized in hydroacoustic data primarily as circular to elliptical depressions, are generated by the seepage of gas or fluids (Judd and Hovland, 2007). They are formed by focused fluid or gas expulsion from the seafloor subsurface (King and MacLean, 1970; Hovland and Judd, 1988; Hovland et al., 2002). They have been documented mainly in soft and fine-grained sediments (Hovland and Judd, 1988; Paull et al., 2002; Chand et al., 2012; Rise et al., 2015; Virtasalo et al., 2018; Böttner et al., 2019), but these features are also reported in sandy environments (Szpak et al., 2015; Krämer et al., 2017). They have different morphologies, sizes and arrangements (Hovland et al., 2002) and vary in diameter, ranging from less than 1 m to hundreds of meters (Judd and Hovland, 2007). Arrangements can be in random or non-random distributions (Pilcher and Argent, 2007). Non-random distributions can vary depending on various mechanisms, i.e., faulting (Plaza-Faverola et al., 2015; De Mahiques et al., 2017), glacial scouring, or human activities (Pilcher and Argent, 2007). Active structures or seeps play an essential role in seabed ecology (Hovland and Judd, 1988; Webb et al., 2009), and due to their common association with methane (CH4) release through the water column, pockmark-forming processes may contribute to the global organic carbon cycle (Judd and Hovland, 2007; Schneider von Deimling et al., 2015; Andreassen et al., 2017; Weber et al., 2019; Lohrberg et al., 2020). Therefore, mapping and classification of suspicious seafloor features assist in creating an inventory of pockmarks.
Despite the prominent interest concerning structures associated with seafloor gas and fluid seepage, there is the potential for misinterpretation, as other circular features can have similar characteristics. Other mechanisms can produce circular structures such as iceberg pits (Brown et al., 2017), collapsed pingos, biological features (Borum et al., 2014; Marsh et al., 2018), sinkholes (Micallef et al., 2013), scour hollows around boulders, human-made artifacts (Hovland and Judd, 1988; Judd and Hovland, 2007), and holes from mineral extraction (Zeiler et al., 2008; Manso et al., 2010; Uścinowicz et al., 2014; Feldens et al., 2022) (Table 1). On the other hand, in former times, pockmarks in Eckernförde Bay in the southwestern Baltic Sea (Figure 1) were interpreted as torpedo craters (Edgerton et al., 1966).
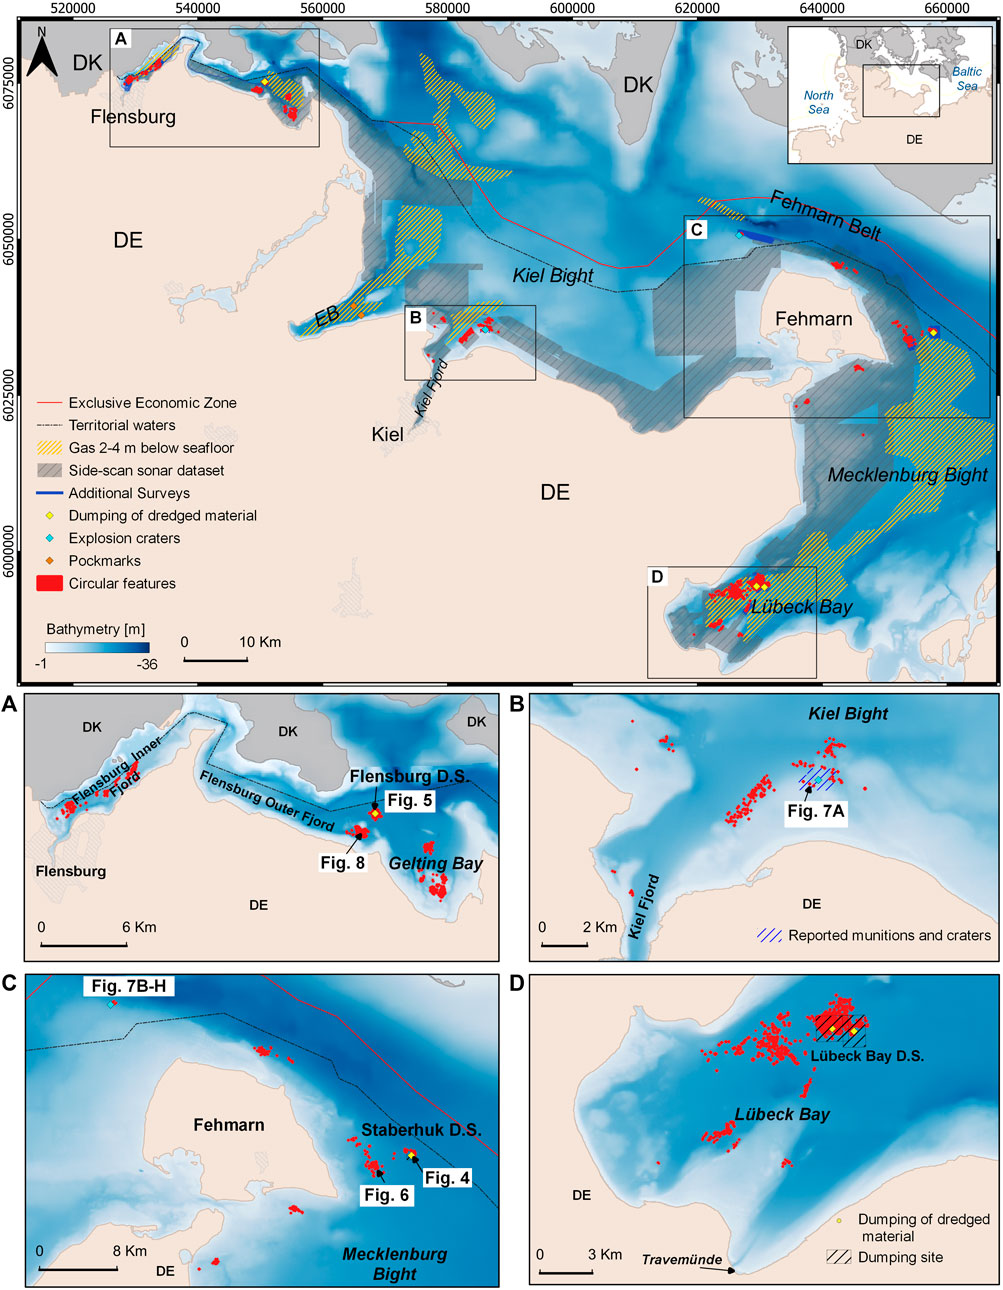
FIGURE 1. Study areas in the SW Baltic Sea: (A) Flensburg Fjord and Gelting Bay, (B) Kiel Bight, (C) Fehmarn Belt and Mecklenburg Bight and (D) Lübeck Bay. The distribution of circular features is observed in the hydroacoustic dataset. Shallow gas areas (2–4 mbsf) (after Laier and Jensen, 2007). Some dumping sites (D.S) of dredged material are indicated in (A,C,D). Reported detonation craters in (B) (Kampmeier et al., 2020) and (C) (Papenmeier et al., 2022). Pockmarks in Eckernförde Bay (EB in the overview figure) (Whiticar and Werner, 1981; Whiticar, 2002; Schlüter et al., 2004; Hoffmann et al., 2020). Bathymetry source: BSH GeoSeaPortal (www.geoseaportal.de, last accessed on 27.05.2019); Seifert et al., 2001.
To distinguish between iceberg pits and pockmarks, some earlier efforts have been made in the North Falklands basin based on diagnostic indicators of fluid flow, stratigraphy and paleoenvironmental context, geometry, size and symmetry of their circular depressions, and the relationship to associated seismic features (Brown et al., 2017). However, when other processes act in the same area, including human activities that leave a circular footprint on the seabed (Table 1), differentiating the genesis of such structures becomes a challenge, especially if the exact location of human activities is not well-known. Nowadays, in many countries, the location of dumping activities should be known to the relevant authorities. However, commonly there is a lack of knowledge on dumping activities in the past, and the explanation of seafloor structures can be difficult—especially if they are interpreted solely from older or incomplete data, e.g., low-resolution SSS images or spatially restricted video footage. It is essential to point out that many coastal areas worldwide cannot be easily mapped due to insufficient instruments or financial limitations. In addition, when only old data are available, they become the primary basis for decision-making and serve to compare and assess the persistence of structures on the seafloor.
In the southwestern Baltic Sea, circular features have been observed in a large data set of SSS images resulting from continuous joint projects carried out between the Institute for Geosciences of the University of Kiel (IfG) and the State Environmental Agency (LfU) since 2008. In this study, we report on the characteristics and distribution of numerous circular features, assuming that only with a multi-method approach it is possible to be sure about the origin of certain structures by analyzing a complete set of indicators resulting from different hydroacoustic methods. Based on this, we aim to describe, classify and discuss the possible origin of circular seafloor features. In this context, we present a regional overview of circular structures and classify them into six classes based on morphological and seismic parameters from information obtained from the combination of MBES, SSS and SBP measurements as well as in-situ observations. The possible genesis of each class of circular features and their temporal and spatial shape stability on the seafloor are discussed. It is pointed out that not all features can be explained despite the large and comprehensive data set. We also provide a classification scheme that helps to differentiate between natural circular features and those resulting from human activities. For this purpose, we set out the following objectives:
a) Develop an inventory and characterization of circular structures based on data from hydroacoustic measurements supported by sediment sampling and in-situ optical observations of the seafloor.
b) Define geophysical, geomorphological and sedimentological parameters to detect, describe and differentiate circular seabed structures systematically and standardized using classification schemes.
c) Discuss whether the origin of the structures is natural or anthropogenic.
2 Regional setting
The study areas are located in Kiel Bight and Mecklenburg Bight in water depths ranging from 4.6 to 36 m in the brackish, micro-tidal southwestern German Baltic Sea (Figure 1). During the Late Weichselian, glaciers covered the present southwestern Baltic Sea area, forming a strong relief and leaving glacial deposits behind (Ehlers et al., 2011; Niedermeyer et al., 2011).
The development of the Baltic Sea underwent different stages in the Late Pleistocene and early Holocene (Björck, 2008), with freshwater, brackish and marine conditions at different times resulting from transgressions and regressions driven by a combination of eustatic sea level change and glacio-isostatic adjustments (Schwarzer et al., 2019). Today, large areas of the seafloor, especially morphological elevations, are built up by glacial deposits (Niedermeyer et al., 2011). Postglacial sediments of lacustrine origin, like gyttja, peat, lake marl (Heinrich et al., 2017a) and fine-grained, organic-rich sediments were formed in local lakes or lagoons and developed on top of the glacial basement. In deeper areas with low sediment transport potential, these sediments are covered by organic-rich mud deposited during and after the Littorina Transgression (Rößler et al., 2011).
Acoustic turbidity is frequently observed in sub-bottom profiler data in Late Pleistocene and Holocene sediments in this region, predominantly due to the presence of subsurface gas stemming from the decomposition of organic matter (Laier and Jensen, 2007) (Figure 1). In Eckernförde Bay, pockmarks have been associated with gas emissions and groundwater discharge (Werner, 1978; Jensen et al., 2002; Whiticar, 2002; Schlüter et al., 2004; Hoffmann et al., 2020).
The southwestern Baltic Sea has been for long time a focal point of coastal ocean exploitation and therefore serves as a prominent example of different types of human impact on the seafloor. Placing pipelines (Bohling et al., 2009) and cables, bottom trawling (Krost et al., 1990; Schönke et al., 2022), anchoring, stone fishing (Bock et al., 2003), dredging (Manso et al., 2010) and dumping (Krost, 1986), have led to changes in morphological conditions, and redistribution of sediments, thus exerting pressures on the marine environment. In addition, large quantities of conventional ammunition were dumped in some regions of the western Baltic Sea at the end and after World War II (Kampmeier et al., 2020; Frey et al., 2021). Most of them remain on the seafloor causing multiple risks to the marine ecosystems.
3 Materials and methods
3.1 Hydroacoustic measurements and post-processing
Coastal waters of the Schleswig-Holstein Baltic Sea have been mapped in order to identify habitat types through different projects over the last 15 years (e.g., Schwarzer et al., 2008; Schwarzer and Feldens, 2010; Schwarzer et al., 2014; Schwarzer and Heinrich, 2016; Schwarzer and Heinrich, 2017; Schwarzer and Díaz-Mendoza, 2020; Schwarzer and Unverricht, 2020; Schwarzer and Unverricht, 2021; Schwarzer et al., 2022), resulting in an extensive dataset of mainly SBP information and SSS data, underwater videos and sedimentological information from grab sampling. The SSS dataset was recorded with a Teledyne Benthos 1624 (100/400 kHz), a C3D from Teledyne Benthos (200 kHz) which has a built-in SBP, an Imagenex Yellowfin (260-330 and 770 kHz), and a StarFish 452F from Tritech (450 kHz) with typical survey speeds between 4.5 and 5 knots. Offsets and layback corrections from the shipborne GNSS were applied to calculate the position of the towed sonar.
Additional research campaigns to chosen sites (Table 2) were conducted to collect high-resolution information on seafloor topography and sedimentology in order to investigate human influences on the seafloor. SSS information was then collected with the Teledyne Benthos 1624 SSS system equipped with an ultra-short baseline (USBL) transponder to obtain a precise position of the towed sonar. Additionally, at some stations, SSS data was collected with the Yellowfin and a StarFish 452F in a pole-mounted configuration and using a GNSS RTK positioning system. The SSS data were recorded and processed using Sonar Wiz 7.3 (Chesapeak Technology, 2018) and exported as 25 cm resolution mosaics. SSS backscatter images provide information about the seafloor structure and composition based on grey levels and textures due to the amount of energy returned from the seafloor and the spatial organization of the elements (Blondel et al., 1998). These parameters allow to distinguish patterns of sediment distribution and morphology. MBES backscatter and bathymetry data were acquired with a NORBIT iWBMS STX MBES. The MBES was operated at a frequency of 400 kHz and positioned with an RTK GNSS system. MBES data were processed using the open-source software MB-System 5.7.8 (MBARI) and the BeamworX 2022.2.1.1 software package. Geotiffs of 25 cm resolution were generated and analyzed with QGIS 3.22.6 software.
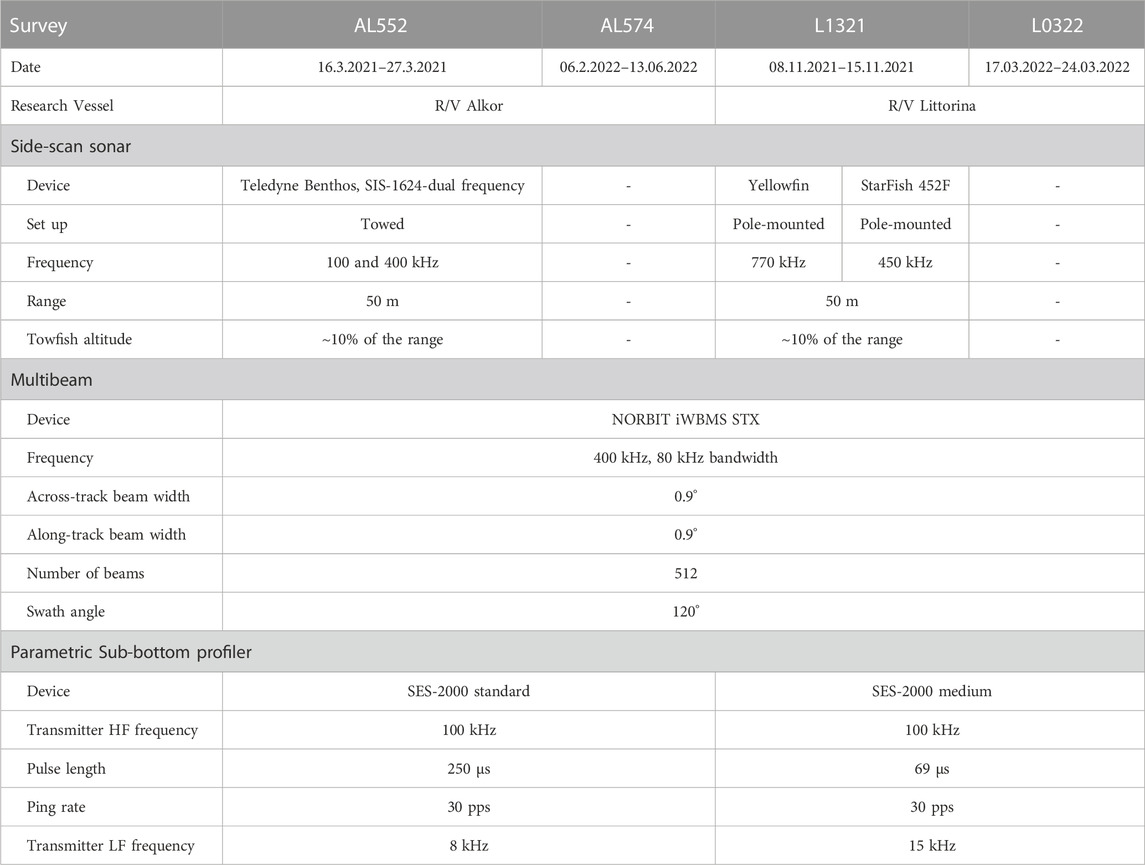
TABLE 2. General device settings during the research surveys AL552 (2021), AL574 (2022), L1321 (2021), and L0322 (2022).
Additionally, parametric sub-bottom profiling (SBP, Innomar SES-2000 standard and medium) was used to image the sub-surface structure of the upper few meters below the seafloor. The systems operate with a primary frequency of about 100 kHz and resulting secondary frequencies between 8 and 15 kHz. Data were processed using the Innomar ISE 2.9.5 post-processing software.
Hydroacoustic data (SPB, SSS, and MBES) were corrected with sound velocity profiles obtained from CTD measurements.
3.2 Ground truthing and analysis
Surface sediment samples (Van Veen and Shipek grab sampler) were collected from circular features and the surrounding areas based on the information from the MBES and SSS data. Accurate positioning was achieved using a USBL combined with a GNSS RTK system. No sediment samples were taken at the ammunition disposal areas and active material dumping sites (Staberhuk and Lübeck Bay dumping sites).
Depending on the characteristics of the sediment, grain size distributions were determined by laser diffraction and/or dry sieving. For mechanical sieving, the samples were first dried at 60°C and then weighed. The fraction <0.063 mm (silt and clay) was discarded by wet sieving. After drying the fraction >0.063 mm at 60°C again, the total amount of finer sediment (silt and clay) was calculated. The material >0.063 mm was sieved according to the ASTM (ASTM E11-09, 2009). For samples with sediment fractions considerably below 2 mm, laser diffraction was performed with a Beckmann Coulter LS 13320. After the analysis, the particle size distributions were classified according to Folk (1954).
In addition, underwater video transects were carried out to observe specific features with a Vivotek IP9191-HT, a GoPro HERO7/8 or a Canon EOS M6 Mk2 camera positioned with a USBL transponder (AL552) and a GNSS RTK positioning system (AL574, L1321, L0322).
3.3 Feature characterization
Within 1,549 km2, more than 3,000 circular features were recognized based on the backscatter intensity and the textural properties of the SSS sonographs. A rectangle was manually digitalized around each feature. Backscatter strength is shown in greyscale, with darker tones indicating high backscatter intensities. This dataset served as the basis for follow-up field campaigns, qualitative analysis, and characterization of the individual features. The latter resulted in the identification of 3,275 circular features, named here as the Initial Feature Dataset (hereafter IFD). This information supported further description and characterization of the features (Figure 2). In areas where information from different high-resolution data was available and where individual features could be better identified visually, a selected feature dataset (hereafter SFD) of 205 structures was created for detailed analysis. This analysis included the definition of morphological parameters (dimensions, shape, relief, slope, roughness and eccentricity) based on bathymetry, as well as MBES and SSS backscatter information, in some cases supported by underwater videos and sediment samples. Seismostratigraphic relationships based on SBP information were also considered.

FIGURE 2. Methodology for feature characterization. IFD, Initial Feature Dataset; SFD, Selected Feature Dataset; and FFD, Final Feature Dataset.
In the hydroacoustic data structures were measured manually in QGIS 3.22.6 along their major (a) and minor (b) radius, and the eccentricity (e) was calculated using
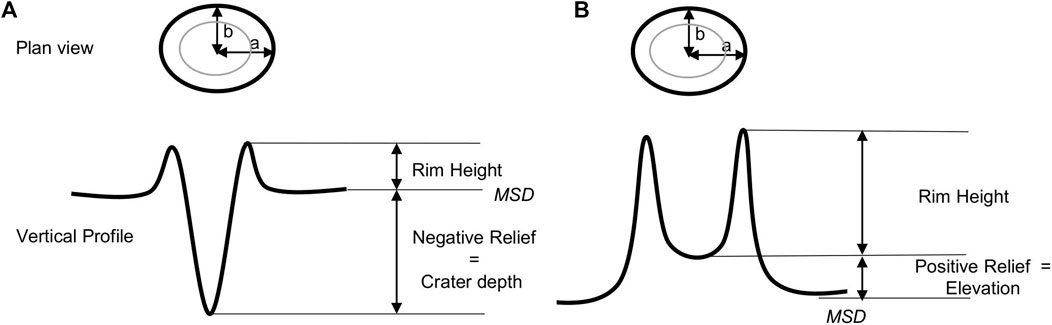
FIGURE 3. Measurement parameters of different types of circular structures. (A) Crater with rims. (B) Ring-shaped feature. MSD: Mean seafloor depth.
Slope and roughness maps were generated using GDAL tools (V. 3.4.1; gdal.org) and were derived from bathymetry DEMs of 25 cm resolution. Within a digitized bounding box for each feature, mean, minimum and maximum values of slope and roughness were calculated using the zonal statistics function in QGIS. Systematic classification of the SFD was performed using qualitative descriptors of morphology, the acoustic backscatter signature, spatial arrangement, and seismic characteristics. The classification was validated using sedimentological information. In areas where individual features could not be recognized in the acoustic images due to overlapping or grouping between them, only the visible and individual structures were considered. Features located at known dumping sites of dredged material and those craters reported as in-situ munition blasting served to establish the classification parameters. To extend the feature classification to IFD structures, the categorization was extrapolated and compiled in a Final Feature Dataset (hereafter FFD) by considering similarities in morphology, acoustic signature, and feature proximity (Figure 2).
4 Results
A total of 3,275 circular structures were observed in the IFD found in water depths ranging from 8 to 25 m (Figure 1) and mainly in soft sediments composed of silt and sand. Six classes were distinguished based on their morphology, acoustic backscatter signature, presence of seismic indicators for fluid flow, and paleo-environmental settings.
4.1 Class 1: positive relief, medium to high backscatter ring-shaped features
High backscatter ring-shaped features, elevated from the seabed and with irregular surfaces, are observed in the deposit site of Staberhuk, east of Fehmarn Island, at about 24 m water depth (DE/54- see Figures 4A, B) and Lübeck Bay. In SSS backscatter data, they exhibit soft to rough textures. The edges of the features show high reflectivities but vary depending on the angle of ensonification. Low backscatter is common in the deeper areas of the individual structures. A total of 42 features were characterized in the dataset, with diameters ranging from 20 to 49 m. They are positive relief features, with a maximum slope of 38° (Figures 9B, D). They sometimes appear as dome-shaped structures and are often grouped and sometimes merged (Figures 4A, B), creating composites up to 3 m in height (Lübeck Bay). This is also observed in the northern part of the dumping ground of Staberhuk, where the backscatter is relatively low (DE/54—Figure 4A).
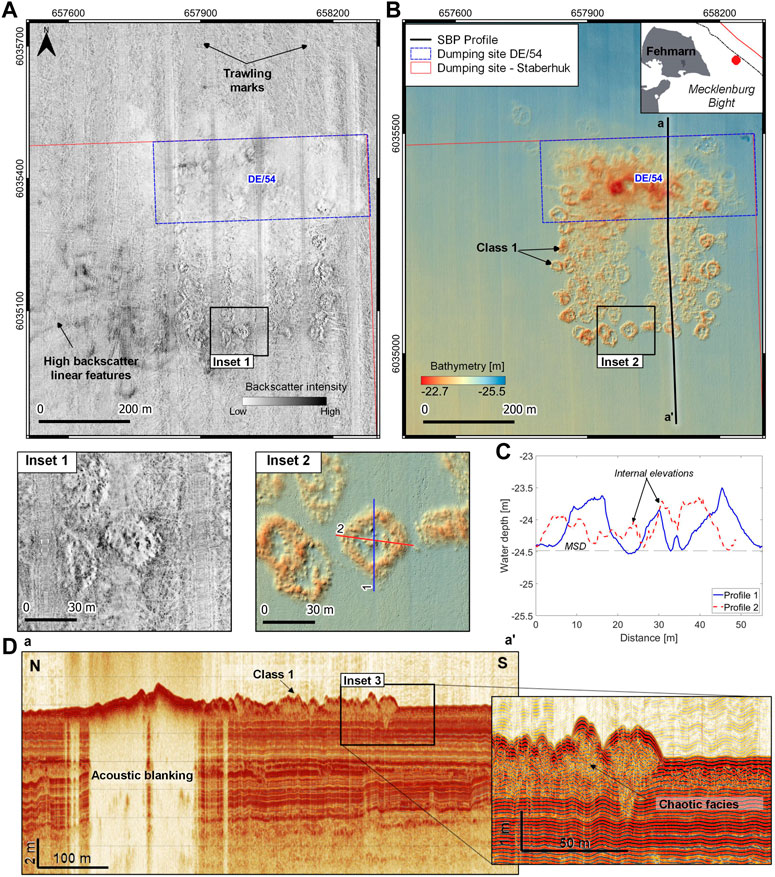
FIGURE 4. Ring-shaped features in the dumping site Staberhuk. (A) Side-scan sonar and (B) bathymetry images with dumping areas indicated (HELCOM, 2019). Insets show the typical torus shape of the structures of Class 1. (C) Vertical bathymetric profile of a unit feature above the mean seafloor depth (MSD) (dashed line). (D) N-S Sub-bottom profile across the deposit site.
The rims differ in height and width and internal elevations in the center are common (Figure 4C). In the SBP profiles, these structures appear as mounded high-amplitude features with chaotic internal acoustic facies, blanking the underlying parallel reflectors (Figure 4D). High backscatter curvilinear features are often observed. Low backscatter linear structures associated with trawling marks are also present, crossing the dumpsite in all directions (Figure 4A).
4.2 Class 2: random high backscatter rounded spots
Other larger, circular structures with high backscatter and smooth to grainy texture have diameters ranging from 30 to 77 m (Figure 5A). Radial halos, aureoles, or linear structures with medium to high backscatter often occur around them. This class corresponds to randomly distributed structures that occur as individual units but also cluster together to form large areas of high backscatter. A total of 13 features of this type were characterized in the SFD at about 22 m water depth. Most of the structures in Class 2 show a positive relief reaching up to 0.8 m and slopes up to 47° (Figure 9B). In Flensburg Fjord and Gelting Bay, those structures are generally composed of silty sand (grab sample L1321-G18–Figure 5D), with some proportions of gravel. In the SBP data, the structures of this class are characterized by chaotic internal reflections and uneven surfaces (Figures 5E– Profile a-a'). Disturbed reflectors appear underneath the features (Figure 5E Inset 3).
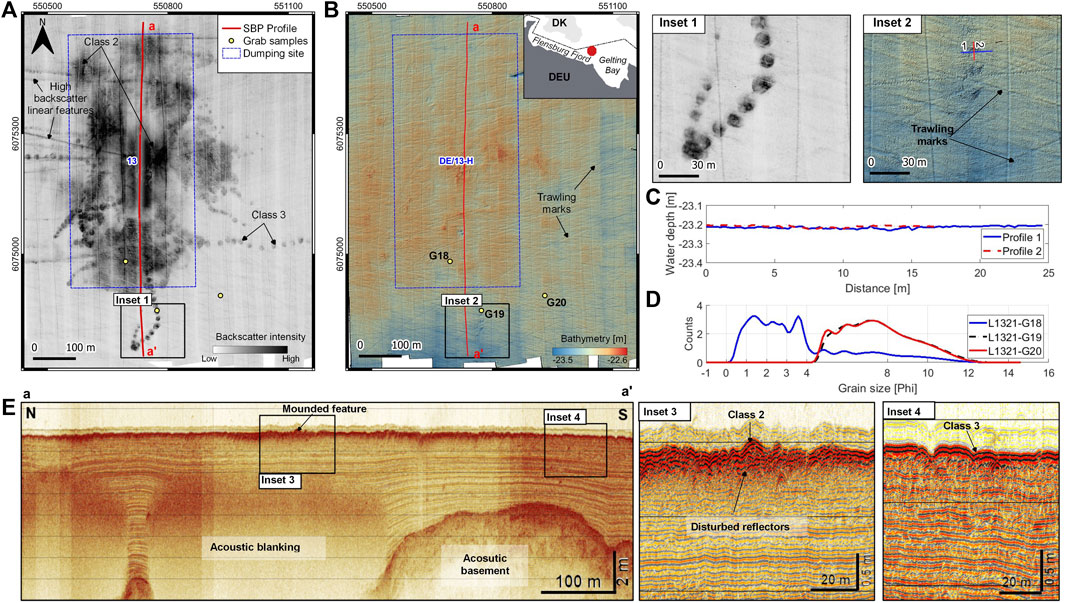
FIGURE 5. (A) Backscatter information and (B) bathymetry of larger high backscatter patches (Class 2) and strings of high backscatter circular features in the old dumpsite DE/13 H (HELCOM, 2019) in the outer Flensburg Fjord. The location of the sub-bottom profile and grab samples (yellow points) are indicated. (C) Vertical bathymetric profile of Class 3 features. (D) Laser particle size distribution of grab samples L1321-G18, G19, and G20. (E) Sub-bottom profile across the dumping site indicates the localization of classes 2 and 3.
While Class 2 structures show a positive relief in Flensburg Fjord, they reveal slightly negative relief of about 0.1 m in Lübeck Bay. Although no macro-benthic organisms were observed in the surface sediment samples, mussels were observed in video profiles in Flensburg Fjord (Supplementary Figure S10).
4.3 Class 3: string of high backscatter rounded spots
A typical structure observed in MBES and SSS backscatter data corresponds to regular linearly arranged rounded features with diameters ranging from 8 to 29 m. They are well-defined circular areas with a homogeneous rough texture and high backscatter signature compared to the surrounding seafloor (Figure 5A). In SSS mosaics, their spatial distribution exhibits a distinctive string-like pattern, whose spacing varies from zero to up to tens of meters between the different spots. Furthermore, these features sometimes overlap (Supplementary Figures 2A, C). A total of 34 individual structures were characterized in the dataset. They are generally found in soft substrates of poorly sorted silt (grab samples L1321-G20–Figure 5D and AL552-120–Supplementary Figure S1F) between 22 and 23 m water depths in Flensburg Fjord, Gelting Bay and Lübeck Bay.
It is noted that these spots are not evident in bathymetric data (Figures 5B, C) or still images obtained from video profiles in Flensburg Fjord; instead, a rather flat seabed is observed. Surface sediment samples indicate that these features consist of silt in Flensburg Fjord (grab sample: L1321-G19 - Figure 5D), very similar to the surrounding seafloor sediment. A SBP profile across such features in a former dumping ground (DE/H13, 2006-2017; Figure 1A; Figure 5E- Profile a-a') in Flensburg Fjord does not show any distinct reflectors linked to the features. However, the ca. 6 m thick Holocene sediment layer shows acoustic turbidity reaching up to a depth of 2 m below the seafloor. No benthic communities were associated with the presence of the features in Flensburg Fjord.
In Lübeck Bay, these features appear both inside and outside the official dumping area. Outside the dumping site, video profiles crossing the circular features also show no difference between the areas of higher backscatter of the circular structures and the lower backscatter associated with the surrounding homogeneous seafloor (Supplementary Figures 1A, D, E). The grain size distribution of one sediment sample indicates that the feature consists of silt at the surface and sandy silt 3 cm below the surface (grab sample: AL552-120–Supplementary Figure S1F). No sediment samples were collected in the Lübeck Bay dumping area, but video profiles obtained in areas of high backscatter showed a non-homogeneous seafloor and a micro-relief in the range of centimeters. In such areas, mussels, algae, and material coarser than the surrounding seafloor were observed in this area (Supplementary Figures S2, 3).
4.4 Class 4: high backscatter ring-shaped features with SBP acoustic anomalies
Ring-shaped features are ubiquitous throughout the entire study area in water depths from 10 to 23 m. These structures feature high backscatter rings with soft to granular textures and diameters between 11 and 35 m. They occur in soft substrates consisting of sandy silt (grab sample: AL552-166 - Figure 6F), mainly observed around the north, east, and south of Fehmarn Island (Figure 6) Lübeck Bay, Kiel Bight and Gelting Bay (Supplementary Figure S4). In total, 34 structures of this kind have been characterized. Their central part often has a negative relief up to 0.7 m, is bordered by raised rims of up to several decimeters (Figure 6E) with slopes up to 44°, and consists of mixtures of muddy sandy gravel, gravelly muddy sand, and silty sand (grab sample AL552-165 - Figure 6F; Supplementary Figure S6). The sediments in the low-backscatter area in the central part consist of sandy silt (grab sample AL552-163 -Figure 6F).
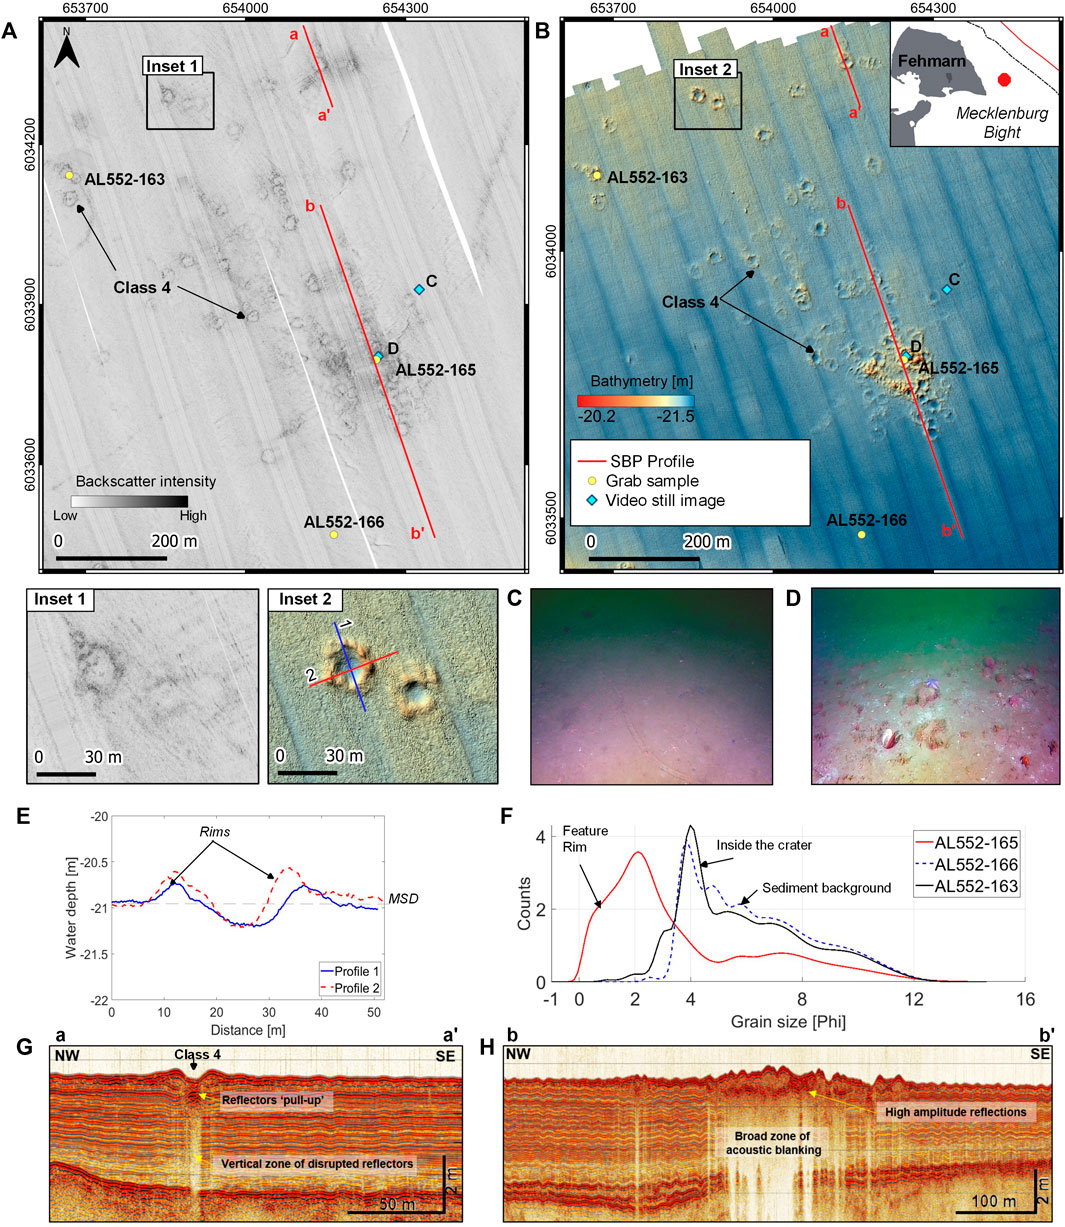
FIGURE 6. Ring-shaped features of Class 4. (A) Side-scan sonar backscatter. (B) Bathymetry data and location of the grab samples, video still images and sub-bottom profiles. (C,D) Underwater video images were obtained in the surrounding sediments and in the area of clustered features of Class 4. (E) Vertical bathymetric profile of Class 4. MSD: Mean Seafloor Depth. (F) Laser grain size analyses of samples AL552-166 (surrounding sediments), AL552-165 (in the rim of the crater) and AL552-163 (in the center of the crater). (G,H) Sub-bottom profiles a-a' and b-b'.
In the shallow and sandy areas of Gelting Bay, the high backscatter rim of these features is flower-shaped in planform view and smaller than similar features found around Fehmarn Island at greater water depths (Supplementary Figure S4). Video profiles did not show any distinctive abiotic features; however, the area appears to be a habitat for macrobenthic communities which were found in high abundance. In the same way, images obtained from underwater videos in the eastern Fehmarn Belt show that the quantity of benthic organisms on these structures is higher than on the surrounding muddy seabed (Figures 6C, D). Although these features are found as single units, they also form large and elevated complexes almost 1 m above the seafloor. In the SBP data taken East of Fehmarn, Class 4 features overly a 4 m thick seismic unit formed by continuous parallel reflectors corresponding to the basin-fill sediments overlying the acoustic basement. Class 4 features have chaotic internal reflectors and high-amplitude reflectors are often observed beneath the features (Figures 6G, H). The SBP data presents acoustic anomalies, such as ‘pull-up’ reflectors and acoustic blanking features in the form of vertical conduits, which are associated with individual features of Class 4 (Figure 6G). When many Class 4 features occur together, forming larger complexes, the acoustic blanking zone is wider and located directly below the high-amplitude reflectors (Figure 6H).
4.5 Class 5: circular craters without elevated rim
A total of 13 craters with diameters between 6 and 24 m and without elevated rims have been observed in hydroacoustic data, mainly in Kiel Bight and Fehmarn Belt, in water depths ranging from 9 to 21 m (Figure 7). The backscatter of MBES and SSS varies depending on the material at the bottom of the crater. The features appear as rounded areas of low backscatter when the sediment is relatively fine or high backscatter when the material is coarser. Also, the crater may appear as white areas (acoustic shadows) due to the local geometry of the ensonification. A profile crossing Class 5 features shows a U-shaped depression with variable depths between 0.3 and 1.7 m and, depending on the substrate, with slope angles up to 62°. The structures observed in Kiel Bight are found in sandy to gravelly substrates with shell fragments included (Supplementary Figures S7, 8). Here, the craters are very shallow, have an average depth of 0.2 m, and are found between 9 and 11 m water depth (Figure 7A and Supplementary Figure S7). The sediment at the bottom of the crater varies and sometimes contains sandy bedforms with shell fragments or fine sediments.
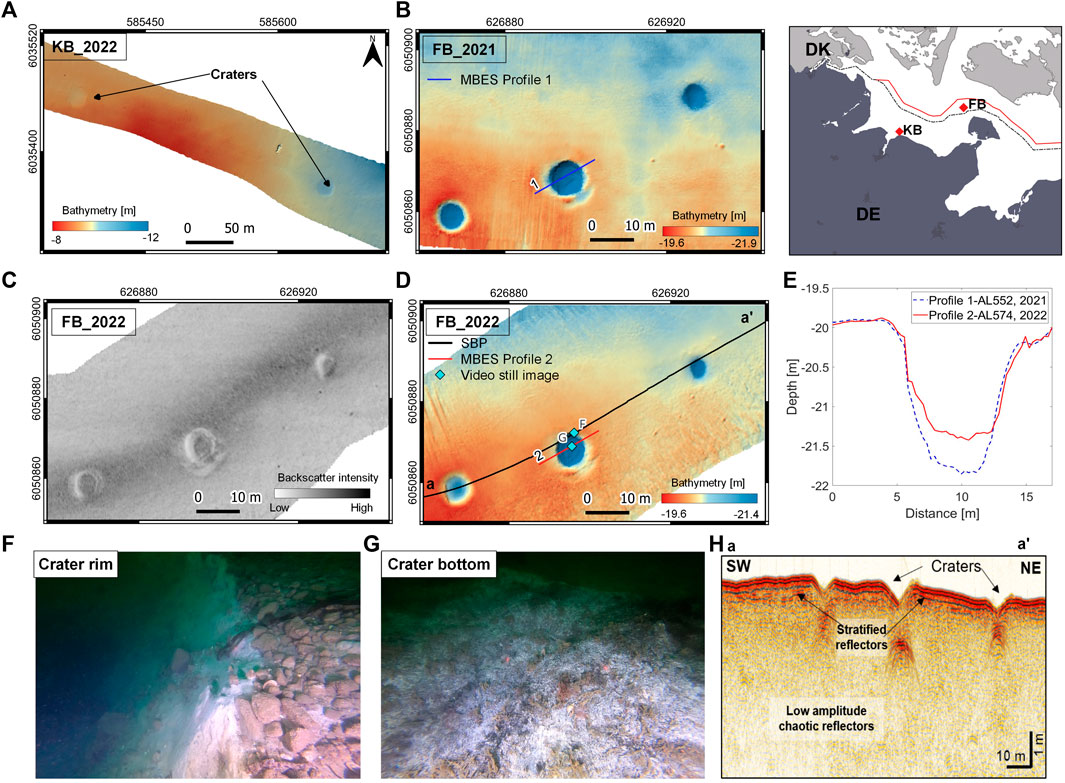
FIGURE 7. Craters in Kiel Bight and in Fehmarn Belt. (A) Bathymetry obtained in 2022 (L0322) in Kiel Bight. (B) Bathymetry obtained in 2021 in Fehmarn Belt (AL552), (C) MBES backscatter image and (D) bathymetry obtained in 2022 (AL574) in Fehmarn Belt. (E) Vertical bathymetric profiles of the crater shown in (B) and (D, F) Video still images showing the rim and slope of the crater and (G) algae found at the bottom of the crater. Distance between the two laser points is 50 cm. (H) V-shaped craters in sub-bottom profile a-a'.
Class 5 structures are found in lag sediments west of the Fehmarn dune field (Feldens et al., 2009), and are generally smaller in diameter but deeper than those found in Kiel Bight (Figures 7B–H). These craters were first surveyed with MBES in 2020 (Papenmeier et al., 2022) and additionally in 2021 and 2022 (this study; Figures 7B–H). There were no significant changes in crater depth between 2020 and 2021. A decrease in the depth of one of the craters of up to about 30 cm was observed between 2021 and 2022 (Figure 7E).
Underwater video images show the steep slope of the crater and the crater rim, which is covered with gravel and boulders (Figure 7F). Metal objects were also observed near the crater rim (Supplementary Figure S9). In addition, algae (Figure 7G), shell fragments and boulders are present on the crater floor. In the area, the SBP profile shows seismically transparent zones and low-amplitude chaotic reflectors, overlaid by a seismic unit of stratified semi-parallel reflectors (Figure 7H) crossed by craters.
4.6 Class 6: craters without elevated rims and with gas-related acoustic anomalies
Class 6 features are circular to elliptical depressions with diameters from 6 to 29 m and average depths of 0.5 m below the surrounding seafloor (Figure 8). Slope angles are up to 54°. Most of these depressions are found in silty sediments (grab sample: L1321- G25 - Figure 8D) of the inner and outer Flensburg Fjord in water depths ranging from 13 to 24 m. However, they have also been found in Lübeck Bay. A total of 69 features of this kind have been observed in the SFD. They appear as homogeneous, circular to elliptical structures with low backscatter intensity and are generally bordered partially or entirely by a ring of high reflectivity. The center of these depressions sometimes also exhibits a backscatter (Figure 8A). Bathymetric cross-sections show a U-shaped geometry, occasionally with terraces inside the structure and an irregular bottom.
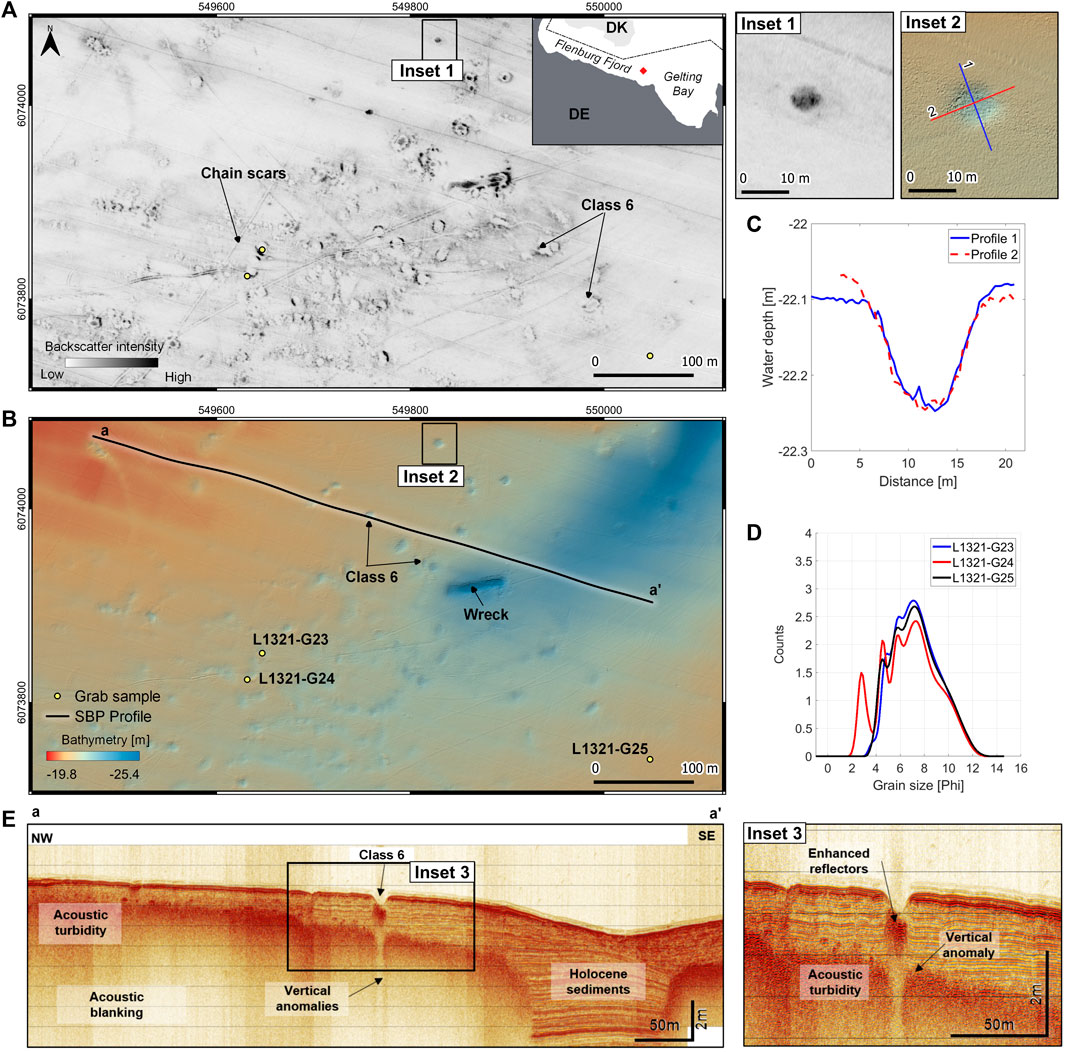
FIGURE 8. (A) Backscatter information and (B) bathymetry of randomly distributed rounded depressions observed in Flensburg Fjord. The location of the sub-bottom profile and grab samples (yellow points) is indicated. (C) Vertical bathymetric profile of Class 6. (D) Laser particle size distribution of samples L1321 G23-G24 and G25. (E) Sub-bottom profile showing U-shaped depressions and vertical acoustic anomalies typical of Class 6 structures.
Grab samples taken from the high backscatter rim reveal sandy silt (grab sample L1321-G24 - Figure 8D), while samples from the central part of the structure are silty (grab sample L1321-G23 - Figure 8D), black in color, and have a strong smell of H2S. The shallow craters are found as random singular features but can also be found clustered together, forming larger complexes. Their distribution is always associated with acoustic turbidity observed in SBP data (Figure 8E). In addition, columnar acoustic anomalies and enhanced or high-amplitude reflectors in the subsurface are characteristic of this type of structure.
4.7 Overview of the circular features and extrapolation of the classification
In total, 205 features of the SFD were classified into six classes. All observed circular structures have a diameter of less than 80 m, with the largest diameters corresponding to classes 1 and 2 found in the deepest areas (Figure 9A). Class 5 features have the deepest negative relief and the highest slope and roughness values (Figures 9B–D). In contrast, classes 2 and 4 correspond to the features with the highest elevation above the seafloor (Figure 9D). Classes 4, 5 and 6 comprise a wide range of water depths and diameters less than 35 m. The different classes generally show no relation to eccentricity, with values ranging from 0 to 0.9 (Figure 9E); however, the shape of Class 5 features tends to approximate a circle with most of the eccentricity values less than 0.65.
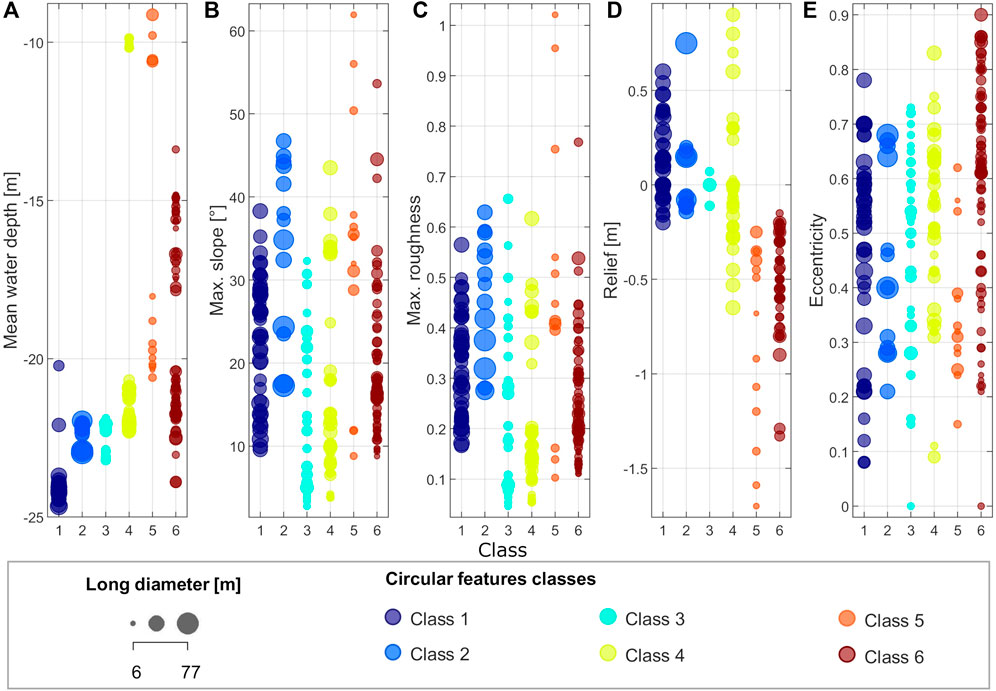
FIGURE 9. Characteristics of circular features of the SFD: (A) Mean water depth, (B) maximum slope, (C) maximum roughness, (D) relief of the middle point of each feature. A positive relief indicates that the central part of the feature is elevated from the seabed. (D) Eccentricity.
These 205 structures (SFD) cover a total area of approximately 0.09 km2 (Figure 10). The extrapolation and application of the SFD classification to the FFD allowed the classified area to be extended to 0.97 km2, corresponding to 0.06% of the total mapped area. This enabled to extend the classification from 205 features (9% of the total area classified- FFD) to 2,560 additional features (91% of the total area classified FFD), corresponding to the total classification of 2,903 features.
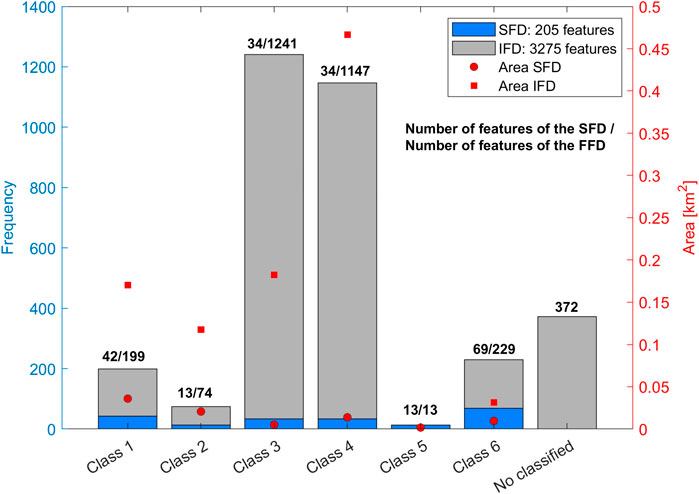
FIGURE 10. Frequency distribution of the SFD (analyzed features) and IFD features and their classification into six main classes. The right Y-axis indicates the total area per feature class of the SFD (circle) and FFD (square).
Figure 11 shows the distribution of the circular features by class in the study area. Most of the features are concentrated in Mecklenburg Bight. Class 3 reaches areal densities of up to 645 per km2 in Lübeck Bay, while class 4 features have densities up to 217 per km2 and are widely distributed in the study area (Figure 11). Classes 1 and 2 and 6 have areal densities of up to 107, 46 and 178 per km2, respectively. However, the areal density values of circular structures might be underestimated since the analysis did not consider all features occurring in local clusters due to their complexity when identifying single structures.
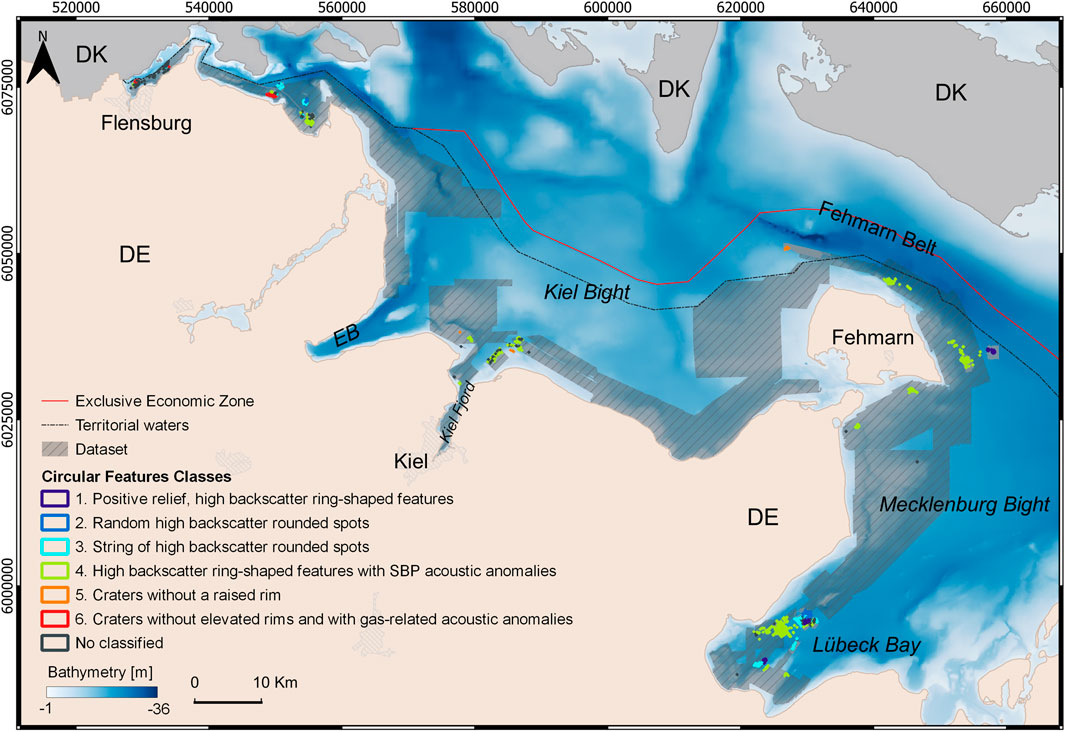
FIGURE 11. Distribution of circular features classes. Bathymetry source: BSH GeoSeaPortal (www.geoseaportal.de, last accessed on 27.05.2019); Seifert et al., 2001.
5 Discussion
5.1 Origin of the circular structures
At first glance, some circular features could be associated with naturally formed geomorphological elements, such as pockmarks. However, anthropogenic activities can also result in circular structures of this scale (Table 1). In the following section, we compare our results with the characteristics of structures of natural and anthropogenic origin.
5.1.1 Class 1–positive relief, high backscatter ring-shaped features: dumping of fine sediment
The morphology and size of these structures resemble “crater-like ring” structures reported in a dumping site of dredged material in the southwestern Baltic Sea (Gru, 2004; Stockmann et al., 2009; Tauber, 2009). Truitt (1988) explained the stages of material discharged from a barge or hopper, which mainly depend on the initial mechanical properties of the sediment. High-density material settles immediately on the seafloor, while very low-density particles sink slowly and generate a sediment plume.
Experimental and numerical investigations have shown that after the dumping, the settled particles are incorporated into a spherical vortex that grows as it descends until it reaches the bottom and collapses, then the particles diffuse to the surrounding regions (Ding et al., 2022). Dumping in deeper water depths leads to a spreading of material, thus larger diameters of the circular structures (Figure 9A). The flow around the cloud of settling material can result in higher concentrations in the outer regions, causing the material to settle in the form of a torus that is imprinted on the seafloor (Tauber, 2009). Tauber (2009) explained the morphological evolution of dumped till and mixed sediments: while till material shows a recognizable crater structure, mixed sediments show diffuse structures because most of the fine material is dispersed by currents before reaching the seafloor.
The amount and regularity of dumping can influence the morphology of circular structures. Between 2017 and 2019, at least 94x103 tons of dredged material consisting of silt and sand was dumped at Staberhuk dumping site “DE/22-DE/83-DE/54” (HELCOM, 2019). More than 50% of the total dredged material deposited in this period has been placed in the northern part of this site. Here the thickness of the deposit is larger than in the surrounding area, and although many of the individual Class 1 structures can be seen, others are covered and have been modified by subsequent dumping events. In the SBP, Class 1 structures mask the visibility of the acoustic signal from the Holocene sediment package (Figure 4D). Acoustic blanking is observed due to the high attenuation from a near-surface reflector which overlies the underlying masked layers.
The high backscatter linear features (Figure 4A) are comparable to those observed at the dumping sites in Flensburg Fjord (Figure 5A), Gelting Bay and Lübeck Bay. Tauber (2009) interpreted similar traces as dumped material lost during ship movements.
5.1.2 Class 2–random high backscatter rounded spots: dumping of material
MBES and SSS backscatter, bathymetry and SBP information assist in identifying Class 2 structures. These features are the largest ones (Figure 9) and are located mainly in dumping sites. At the Flensburg Fjord dumping site (DE/H13, 2007-2015; Figure 5A), sand and silt mixtures from the maintenance dredging of nearby harbors have been dumped (HELCOM, 2019). The higher backscatter character of the features is explained by silty sand (L1321-G18; Figure 5D) deposited on a finer substrate. Similar features have been reported at the Point Gray dumpsite in Canada, where split hull barges rapidly deposit excavation material, leaving large high backscatter “splotches” visible in the SSS mosaic (Mosher et al., 1997; Sullivan et al., 2006). These structures are similar to Class 2 features, generally representing the dumping of larger quantities of sediment in a short time (Figure 5), usually done by hopper dredgers. When large amounts of dense sediment are discharged on a soft substrate, the dumped material may sink slightly into the substrate, leaving almost no relief in the bathymetry.
5.1.3 Class 3–string of high backscatter rounded spots: loss of dumping material during ship movement
The highly reflective strings of circular spots have been reported previously in Lübeck Bay in MBES backscatter (Kampmeier et al., 2018) and SSS data (Díaz-Mendoza and Schwarzer, 2019). The relatively high reflective character of these structures and the string-like pattern observed in SSS and MBES backscatter data are the most significant parameters for detecting Class 3 features (Figure 5; Supplementary Figures S1, 2). On the seafloor of Grande Rade de Toulon, France, Garlan et al. (2018) reported 661 high backscatter circles, with absence of relief and diameters ranging from 11 to 134 m (Table 1). They are found on heterogeneous substrates (clay to gravel), and no correlation with the in-situ sediment type was found in that study. The authors interpreted those circular structures on the seafloor in the Toulon region as originating from bomb explosions dropped during World War II (Garlan et al., 2018). However, there is not enough evidence to confirm this origin. Furthermore, the high backscatter rounded spots of Class 3 mostly appear near or within areas where dumping occurred. In the outer Flensburg Fjord, about 8,700 tons of dredged material consisting of sand, mud and silt were deposited between 2007 and 2015 (HELCOM, 2019) (Figure 5). In Lübeck Bay, dumping activities of dredged material from the river Trave (Figure 1) and nearby waterways have occurred over the years. Also, high concentrations of heavy metals and other pollutants have been documented at a historical dumpsite in Lübeck Bay, where dumping occurred in the late 1950s and early 1960s (Leipe et al., 1998; 2005).
As the material sinks through the water column, some of the finer material is transported away as a sediment plume, while the remaining part sinks to the seabed and is likely to collapse and spread radially at the bottom of the seafloor (Truitt, 1988). Repetitive dumping of coarser material likely determines the string pattern. Similar linear arrangements of irregular high reflectivity patches have been observed in SSS images at the Point Gray dumpsite in Canada (Hart, 1992; Mosher et al., 1997; Sullivan et al., 2006) and in southeastern Sicily (Budillon et al., 2022). They are linear or curvilinear successions of high backscatter patches caused by dumping material on fine-grained seafloor from a mobile barge. The spacing between discrete patches is very consistent, indicating intermittent release of loss material from the mobile barge close to the disposal site, which likely occurs due to sediment losses through the weir boxes. Also, as a result of the ship moving forward or drifting, “string of pearls"-like features form on the seafloor (Mosher et al., 1997; Blondel, 2009). The seafloor relief character of these structures may be influenced by the speed of ship movement, the amount and type of material dumped, and post-depositional dispersion processes (Budillon et al., 2022).
Local variations in backscatter strength thus may be caused by the effect of the dumped material being coarser or harder than the surrounding seabed and by centimeter-scale bathymetric differences (Supplementary Figures S2, 3). However, outside the Lübeck Bay dumping site and in the Flensburg Fjord dumping site, the structures do not show significant substrate differences between the surface sediment of the high backscatter string of patches and the surrounding sediment (Figure 5; Supplementary Figure S1).
The high backscatter of the circular features in Lübeck Bay can be explained by the presence of mussels and coarser material than on the surrounding seabed (Supplementary Figures S2, 3). The presence of benthic organisms has been reported to alter seabed roughness and heterogeneity on a centimeter-scale, and, hence, the amplitude of acoustic signals scattered from the seabed (Briggs et al., 2002; Heinrich et al., 2017b). In contrast, in Flensburg Fjord and outside the dumping site in Lübeck Bay, the grab samples did not show any trace of organisms affecting the small-scale roughness of the seafloor, thus explaining the backscatter signature of the features (Figure 2; Supplementary Figure S1).
In addition, the MBES data show that the features of Class 3 are nearly flat. It is possible that part of the dumped material was dispersed, and a thin layer of natural sediment covered the resulting dumping structures (Liehr et al., 2013; Virtasalo et al., 2018). That could explain the poor differences in granulometry between the patches and the surrounding seafloor (Supplementary Figure S1F).
Based on this assessment, we suggest that the Class 3 circular structures resulted from underway loss of material from moving platforms. Depending on the properties of the deposited material, it locally alters the seafloor sedimentology and provides a variety that serves as a settling ground for benthic organisms (Supplementary Figures S3F, G, I, K). However, additional information, including ground truthing and models, is needed to verify whether these structures are associated with the loss of material from a moving platform and to better understand their formation mechanism.
5.1.4 Class 4—high backscatter ring-shaped features with SBP acoustic anomalies: Ambiguous
Class 4 structures overlie Holocene sediments in areas where acoustic blanking is present (Laier and Jensen, 2007) (Figure 1). The plan view and dimensions of the features observed in Gelting Bay are comparable to elliptical depressions found in the Helgoland Reef pockmarks (Krämer et al., 2017). In the SBP data, columnar anomalies, areas of acoustic blanking, and high amplitude reflections suggest the presence of gas (Figure 6H). However, areas of acoustic blanking found directly beneath the structures may also indicate signal attenuation due to denser material overlying them. In addition, “pull-up reflectors” (Figure 6G) indicate a low seismic velocity anomaly in the overlying sediments (Micallef et al., 2022). This suggests that the sediments composing Class 4 structures have higher acoustic impedance and, therefore, higher seismic velocities. Where these structures appear, an enrichment of benthic communities is observed in the video profiles (Figure 6D), which could be explained by the preference of species like mussels, colonizing on hard material, which reinforces the high backscatter signature of the torus (ring) features (Tauber, 2009).
In the SSS imagery, these features look similar to Class 1 features and the dumping structures reported in Mecklenburg Bight (Leipe et al., 2005; Stockmann et al., 2009). However, MBES cross sections showed that the bottom of the craters is mostly below the local mean seafloor depth (Figures 6E, 9D). The deposition of dumped material would generate a morphology representing accumulation of material rather than deepening. Moreover, according to HELCOM (2019) dumping activities of dredged material were not reported in this area between 2006 and 2019. As there is no consistent evidence of gas or dumping of dredged material, the mechanism responsible for the formation of these structures is still ambiguous.
5.1.5 Class 5–craters without a raised rim: Explosion craters
In Kiel Bight, Class 5 features correspond to the circular depressions reported at Kolberger Heide ammunition dumpsite (Kampmeier et al., 2020) (Figure 7A). Those features occur on fine to medium sand and mixed sediments and have an average diameter of 20 m and an average depth of 1.5 m. Numerous objects associated with munitions were also observed. Following Kampmeier et al. (2020), we associate the Class 5 features as resulting from in-place blasting of munitions.
The craters observed northwest of Fehmarn Island correspond to mine-blasting craters (Papenmeier et al., 2022) related to NATO maneuvers to clear 42 British mines in August 2019 (Siebert et al., 2022). The blasting affected the geological basement and the layers on top (Figure 7H), which correspond to lag deposits overlying glacial till (Feldens et al., 2015; Papenmeier et al., 2022). These deposits can also be seen in the video profiles, where they are evident on the walls and around the crater rim. Boulders were also observed on the rim and around the craters in video profiles (Figure 7F), as well as in bathymetric data (Papenmeier et al., 2022). None of the Class 5 craters show significantly elevated rims in any of the surveys. Although the circular geometry of craters found in Kiel Bight and Fehmarn Belt is similar, the depths, diameters and slopes differ. Craters in Fehmarn Belt are deeper but smaller, and have steeper slopes. This might be due to the properties of the substrate, seafloor regeneration rates and the type and charge of the explosive.
The sedimentology of the crater floor is conditioned by substrate type, crater depth, water depth and currents. For example, the shallow crater in Kiel Bight has sandy beds with shells, while a deeper crater in the same area in slightly deeper waters has fine sediments on the crater floor. In areas where sediment is regularly transported, shallow craters may regenerate faster than deeper pits (Diesing and Schwarzer, 2006).
5.1.6 Class 6–pockmarks
The observed craters without elevated rims and with vertical seismic anomalies always occur on top of horizontally stratified reflectors that correspond to Holocene deposits (Atzler, 1995). The evidence of gas observed in the SBP, together with the environmental setting, suggests that the craters were likely formed by seepage activity. These manifestations include acoustic blanking (Jaśniewicz et al., 2019; Micallef et al., 2022), vertical acoustic anomalies or pipes (Cartwright et al., 2007), acoustic turbidity (Jaśniewicz et al., 2019) and high amplitude reflectors (Micallef et al., 2022). Nonetheless, no flares were observed in the water column during our investigations.
In Flensburg Fjord, black-colored sediments taken from those structures had a strong H2S smell, suggesting sulfate reduction by micro-organisms. Following formation of the pockmark crater due to the ascension and release of gases or liquids, fine sediment is dispersed and transported away by currents while coarser material remains in the central part of the depression. This results in a higher backscatter signature and the so-called “eyed-pockmarks” (Hovland et al., 2002) (Figure 8, inset 1).
Numerous similar circular depressions in the seabed are also observed in Lübeck Bay. Some of them have seismic and morphological characteristics similar to those in Flensburg Fjord, and acoustic turbidity in the seismic data indicates that shallow gas is present in the subsurface (Laier and Jensen, 2007). Structures showing these characteristics were classified as pockmarks.
5.2 Discriminating between the origin of circular features: natural or anthropogenic?
Classification of the circular structures involves setting a number of descriptors for their definition; including morphology, backscatter, and seismic information (Figure 12). These parameters can be related to possible formation mechanisms, which allow to distinguish between natural and anthropogenic origins.
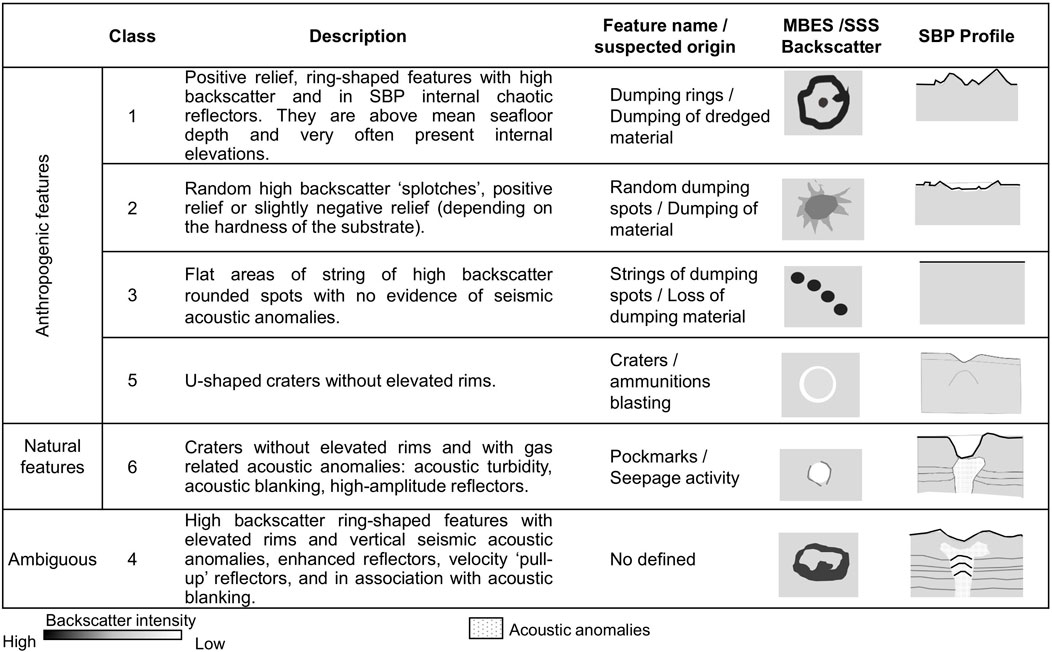
FIGURE 12. Classification of circular features and schematic representation showing main feature classes observed in the hydroacoustic data.
In this study, we propose a standardized approach to discriminate between different circular structures. This is especially useful when the circular structures of a given research area are not located in areas where known human activities have been carried out (e.g., location of dumping sites on nautical charts). This approach integrates backscatter data from MBES, SSS, bathymetry, morphology, seismic parameters and additional optical information (Figure 13). Through observing and identifying a series of certain attributes, the origin of a circular structure can be approximated.
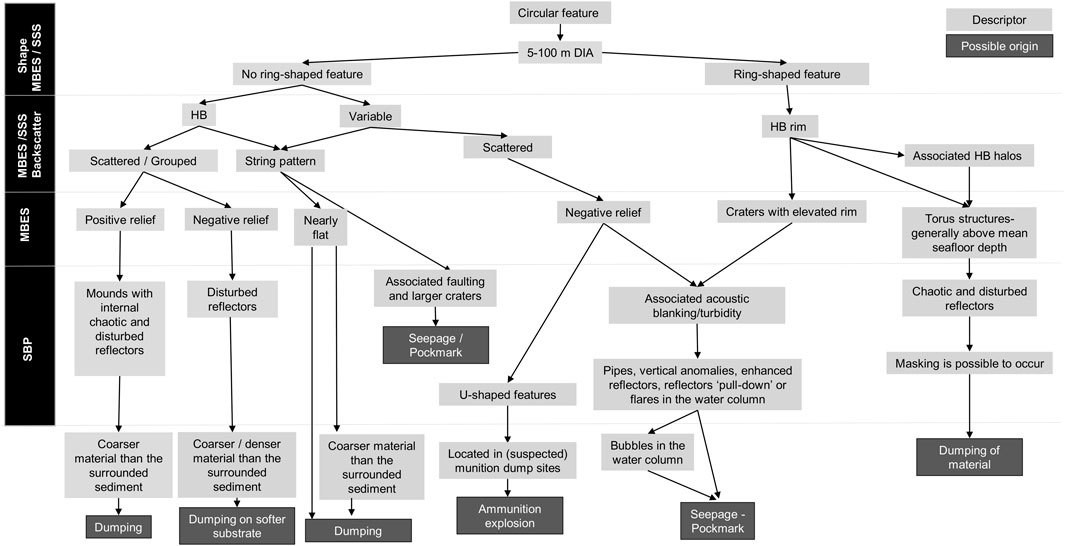
FIGURE 13. Approach for the systematic characterization of circular structures on the seafloor. HB, High backscatter.
Out of 3,275 features, 1,527 of them are suspected to be of anthropogenic origin (47% of the IFD), while 229 features (7%) are of natural origin, and 1,519 structures remain ambiguous or unclassified (46%). Only Class 3 features (pockmarks) are formed by natural processes. Other structures were related to anthropogenic processes, including dumping material (classes 1, 2 and 3), and craters created by munitions blasting (Class 5). Furthermore, while similarities are observed between Classes 4 and 1 features, the origin of Class 4 features remains unclear.
Unclassified circular features could not be analyzed in detail due to insufficient data (e.g., absence of high-resolution MBES data), remoteness, and dissimilarity with other classified features. These factors meant that no extrapolation or application of the classification could be performed. Some other features were also defined as unclassified due to the difficulty in separating the different formation processes occurring in the same area. This was particularly an issue in Lübeck Bay, where the origin of the various circular structures is not clearly evident (Supplementary Figure S5) because the features could be masked by one or more different processes. A large amount of dumped munition material has been reported here (Frey et al., 2021), and the dumping of dredged material has also been a common practice.
Our results show that a multi-methodological approach is needed to identify the origins of circular features. Hydroacoustic methods such as SSS, MBES and SBP are essential tools to better characterize the seafloor and subsurface physical properties. However, they are insufficient when used alone and without a multimethod approach, it is challenging to accurately interpret the acoustic data and classify seabed features. Furthermore, in-situ observations, including sedimentological analyses, are essential to further understand and validate the origin of circular structures.
5.3 Temporal and spatial stability of seafloor circular structures
Post-formation changes should also be considered for all seafloor features. Although the morphology of circular structures and the backscatter character have been preserved for decades in some areas (e.g., Supplementary Figure S11), sediment re-mobilization induced by natural conditions like wave-induced currents and/or human activities may influence the structures on the seafloor. Bottom trawling, for instance, occurs in various parts of the Baltic Sea (Krost et al., 1990; Bunke et al., 2019; Schönke et al., 2022). Fishing gear can create furrows on the seafloor (Figures 4, 8; Supplementary Figure S11) with penetration depths exceeding 25 cm (Schönke et al., 2022). This leads to sediment suspension into the water column (Bradshaw et al., 2021) and redistribution of the upper centimeters of the seafloor sediments (Oberle et al., 2018). As a result, the initial structural characteristics of the circular features may be altered (Supplementary Figure S11).
Creating an inventory of anthropogenic structures and their temporal and spatial stability is essential for assessing seabed integrity in the context of marine ecosystem management. The Marine Strategy Framework Directive (MFSD) aims to achieve a “Good Environmental Status” (GES) (European Commission, 2008). The criteria D6C1 and D6C2 in the directive focus on evaluating the spatial extent and distribution of physical loss or disturbance of the seabed (European Commission, 2017).
According to the European Commission (2017), a physical loss is a “permanent change to the seabed which has lasted or is expected to last for a period of two reporting cycles or more (12 years)”, and a physical disturbance or damage is defined as “a change in the seabed that can be restored if the activity causing the disturbing pressure ceases” (Korpinen et al., 2018). Dumping material could lead to physical loss because it alters the physical properties of the seabed for more than a decade. When the type of material dumped differs from the in-situ substrate, there is physical loss. Especially if the material is contaminated (e.g., dumping of industrial waste material in the past; Leipe et al., 2005) and not buried by natural sedimentation (e.g., Class 2 and probably Class 3 in Lübeck Bay; Supplementary Figure S2, 3). On the other hand, when no contaminated material is dumped; as we assume for the recent dumping sites, and the site has the potential to be an artificial reef where macro-zoobenthic communities can colonize, the new substrate can be considered as having ‘potential ecological value’ (Korpinen et al., 2018; Virtasalo et al., 2018). This study has shown how the structures resulting from the dumping of dredged material at the Flensburg Fjord dumping site represent a substrate for the colonization of benthic communities (Supplementary Figures S10A, B).
In the case of ammunition crater blasting, the blasting affects not only the top of the seabed, but also the underlying till deposits (Figure 7H). This implies that the substrate that is exposed is not always the same as that which was removed by the blasting (physical loss). Hydroacoustic data show how the craters are partially filled after 2 years, indicating a partial restoration of the seafloor morphology. Although the back-filled material differs from the original, new species could establish on the modified “new habitat”. Nonetheless, the remnants probably left by the blasting constitute adverse effects for the biotic component.
6 Conclusion
Hydroacoustic data reveal circular seafloor features up to tens of meters in diameter in water depths between 8 and 25 m in the southwestern Baltic Sea. They are mainly found in silty sediments.
This study uses a multi-method approach employing hydroacoustic data from SSS, MBES, SBP as well as seabed sediment samples and ground truthing. Examination of the size, morphology and hydroacoustic signatures of the circular structures allows to distinguish between six classes resulting in a classification decision tree as a tool for differentiating between natural and anthropogenic origins of the circular structures. Because features of known different origin appear similar in individual data and derived parameters, this study demonstrates that such a multi-method approach is essential to distinguish between different circular structures on the seafloor and to identify their natural or anthropogenic generation mechanisms.
Based on data analysis and comparisons with relevant literature, only one of the six classes (Class 6–Pockmarks) is related to natural processes, four to anthropogenic activities, and one class remains undetermined. Furthermore, because human activities have been registered in the study area, the traces left on the seafloor can be explained. Classes 1, 2, 3, and 5 represent examples of the result of anthropogenic activities-seafloor interactions, where the dumping of material or sediments and the detonation of munitions has left circular scars on the seabed.
Our findings contribute to a better understanding of the different traces formed by anthropogenic and natural processes on the seafloor and provide a basis for future exploration of circular features on the seafloor. This research is also relevant for marine ecosystem management in terms of identifying human pressures that impact upon seafloor integrity in accordance with directives such as the MSFD (European Commission, 2008).
Data availability statement
The datasets presented in this article are not readily available because the information regarding the raw data of the IFD, was gathered from collaborative projects involving the State Agency for Environment (LfU) of Schleswig-Holstein and the University of Kiel. Currently, we do not possess the necessary permissions to release the raw data publicly. However, individuals interested in accessing the GeoTIFFs shown in the figures can do so by contacting the corresponding author. The data (GeoTIFF and shapefile) shown in the figures regarding the SFD will be available. Requests to access the datasets should be directed to Z2l1bGlhbmEuZGlhekBpZmcudW5pLWtpZWwuZGU=.
Author contributions
CW and H-CR acquired the project funding. CW conceived the concept and development of this research. CW, KS, GAvR, and CH provided further input to the conceptual design. GD-M wrote the manuscript, conducted the sediment analysis, processed and interpreted the hydroacoustic and ground truthing data. GAvR helped during the conceptualization of and participated in the L1321 research campaign. KK collected the hydroacoustic measurements during AL552, AL574, and L0322 campaigns and guided during the processing and analysis of the MBES data. All authors contributed to the article and approved the submitted version.
Funding
The study was carried out in the framework of the project “Human Impacts on the seabed of the Southwestern Baltic Sea” funded by the State Agency for Environment (LfU) of Schleswig-Holstein (Germany). We acknowledge financial support by Land Schleswig-Holstein within the funding program Open Access Publikationsfonds.
Acknowledgments
We thank Gianna Persichini and Gabriel Herbst for all their support and work during the research surveys. We would also like to thank the crew of the research vessels ALKOR and LITTORINA for their work during the field campaigns. We appreciate the support given by the Coastal Geology and Sedimentology working group at the University of Kiel, especially Tanita Averes. We also want to acknowledge the support of Daniel Koch, Kai Weiper and Jannis Markowitsch. We thank Rachel Barrett for proofreading and language correction. We want to thank collaborators of the projects conducted on the framework of the mapping habitat types and the State Agency for Environment (LfU) of Schleswig-Holstein in Germany for financial support. We thank the reviewers Jens Greinert, Thierry Garlan, Verner Brandbyge Ernstsen for their constructive comments.
Conflict of interest
The authors declare that the research was conducted in the absence of any commercial or financial relationships that could be construed as a potential conflict of interest.
The reviewer JG declared a shared affiliation with the authors GD-M, KK, GAvR, KS, CW to the handling editor at the time of review.
Publisher’s note
All claims expressed in this article are solely those of the authors and do not necessarily represent those of their affiliated organizations, or those of the publisher, the editors and the reviewers. Any product that may be evaluated in this article, or claim that may be made by its manufacturer, is not guaranteed or endorsed by the publisher.
Supplementary material
The Supplementary Material for this article can be found online at: https://www.frontiersin.org/articles/10.3389/feart.2023.1170787/full#supplementary-material
References
Andreassen, K., Hubbard, A., Winsborrow, M., Patton, H., Vadakkepuliyambatta, S., Plaza-Faverola, A., et al. (2017). Massive blow-out craters formed by hydrate-controlled methane expulsion from the Arctic seafloor. Science 356, 948–953. doi:10.1126/science.aal4500
ASTM E11-09 (2009). Standard Specification for wire cloth and sieves for testing purposes. West Conshohocken PA USA: ASTM International.
Atzler, R. (1995). Der pleistozäne Untergrund der Kieler Bucht und angrenzender Gebiete nach reflexionsseismischen Messungen Kiel: Geologisch-Paläontologisches Institut und Museum, Christian-Albrechts-Universität. doi:10.2312/REPORTS-GPI.1995.70
Batchelor, C. L., Dowdeswell, J. A., and Ottesen, D. (2018). “Submarine glacial landforms,” in Submarine geomorphology. Springer Geology. Editors A. Micallef, S. Krastel, and A. Savini (Cham: Springer International Publishing), 207–234. doi:10.1007/978-3-319-57852-1_12
Björck, S. (2008). “The late Quaternary development of the Baltic Sea basin,” in Assessment of climate change for the Baltic Sea basin, 398–407.
Blondel, Ph., Parson, L. M., and Robigou, V. (1998). “TexAn: Textural analysis of sidescan sonar imagery and generic seafloor characterisation,” in IEEE Oceanic Engineering Society. OCEANS’98. Conference Proceedings (Cat. No.98CH36259) (Nice, France: IEEE), 419–423. doi:10.1109/OCEANS.1998.725780
Bock, G., Thiermann, F., Rumohr, H., and Karez, R. (2003). Ausmaß der Steinfischerei an der schleswig-holsteinischen Ostseeküste. Jahresber, Jahresbericht Landesamt für Natur und Umwelt des Landes Schleswig-Holstein 2003. 111–116.
Bohling, B., May, H., Mosch, T., and Schwarzer, K. (2009). Regeneration of submarine hard-bottom substrate by natural abrasion in the Western Baltic Sea. Marbg. Geogr. Schriften 145, 66–79.
Borum, J., Raun, A. L., Hasler-Sheetal, H., Pedersen, M. Ø., Pedersen, O., and Holmer, M. (2014). Eelgrass fairy rings: Sulfide as inhibiting agent. Mar. Biol. 161, 351–358. doi:10.1007/s00227-013-2340-3
Böttner, C., Berndt, C., Reinardy, B. T. I., Geersen, J., Karstens, J., Bull, J. M., et al. (2019). Pockmarks in the witch ground basin, central north sea. Geochem. Geophys. Geosyst. 20, 1698–1719. doi:10.1029/2018GC008068
Bradshaw, C., Jakobsson, M., Brüchert, V., Bonaglia, S., Mörth, C.-M., Muchowski, J., et al. (2021). Physical disturbance by bottom trawling suspends particulate matter and alters biogeochemical processes on and near the seafloor. Front. Mar. Sci. 8, 683331. doi:10.3389/fmars.2021.683331
Briggs, K. B., Williams, K. L., Jackson, D. R., Jones, C. D., Ivakin, A. N., and Orsi, T. H. (2002). Fine-scale sedimentary structure: Implications for acoustic remote sensing. Mar. Geol. 182, 141–159. doi:10.1016/S0025-3227(01)00232-8
Brothers, L. L., Kelley, J. T., Belknap, D. F., Barnhardt, W. A., Andrews, B. D., Legere, C., et al. (2012). Shallow stratigraphic control on pockmark distribution in north temperate estuaries. Mar. Geol. 329–331, 34–45. doi:10.1016/j.margeo.2012.09.006
Brown, C. S., Newton, A. M. W., Huuse, M., and Buckley, F. (2017). Iceberg scours, pits, and pockmarks in the North falkland basin. Mar. Geol. 386, 140–152. doi:10.1016/j.margeo.2017.03.001
Bruns, I., Holler, P., Capperucci, R. M., Papenmeier, S., and Bartholomä, A. (2020). Identifying trawl marks in north sea sediments. Geosciences 10, 422. doi:10.3390/geosciences10110422
Budillon, F., Firetto Carlino, M., Innangi, S., Passaro, S., Tonielli, R., Trincardi, F., et al. (2022). The anthropogenic footprint of physical harm on the seabed of augusta Bay (western ionian sea); A geophysical investigation. J. Mar. Sci. Eng. 10, 1737. doi:10.3390/jmse10111737
Bunke, D., Leipe, T., Moros, M., Morys, C., Tauber, F., Virtasalo, J. J., et al. (2019). Natural and anthropogenic sediment mixing processes in the south-western Baltic Sea. Front. Mar. Sci. 6, 677. doi:10.3389/fmars.2019.00677
Bussmann, I., Damm, E., Schlüter, M., and Wessels, M. (2013). Fate of methane bubbles released by pockmarks in Lake Constance. Biogeochemistry 112, 613–623. doi:10.1007/s10533-012-9752-x
Cartwright, J., Huuse, M., and Aplin, A. (2007). Seal bypass systems. AAPG Bull. 91, 1141–1166. doi:10.1306/04090705181
Chand, S., Thorsnes, T., Rise, L., Brunstad, H., Stoddart, D., Bøe, R., et al. (2012). Multiple episodes of fluid flow in the SW Barents Sea (Loppa High) evidenced by gas flares, pockmarks and gas hydrate accumulation. Earth Planet. Sci. Lett. 331–332, 305–314. doi:10.1016/j.epsl.2012.03.021
Chesapeak Technology (2018). SonarWiz 7.3 user guide. Available at: www.cheasapeaketech.com/index.htm (Accessed August 20, 2019).
Cojean, A. N. Y., Kremer, K., Bartosiewicz, M., Fabbri, S. C., Lehmann, M. F., and Wirth, S. B. (2021). Morphology, formation, and activity of three different pockmark systems in peri-alpine lake thun, Switzerland. Front. Water 3, 666641. doi:10.3389/frwa.2021.666641
De Mahiques, M. M., Schattner, U., Lazar, M., Sumida, P. Y. G., and Souza, L. A. P. D. (2017). An extensive pockmark field on the upper atlantic margin of southeast Brazil: Spatial analysis and its relationship with salt diapirism. Heliyon 3, e00257. doi:10.1016/j.heliyon.2017.e00257
Díaz-Mendoza, G., and Schwarzer, K. (2019). “Seabed features in Mecklenburg Bight based on side-scan sonar imagery,” in Marine and River Dune Dynamics Conference, Bremen, Germany, 77–82. Available at: https://www.marum.de/Binaries/Binary18516/MARIDVI-Diaz-Giuliana.pdf.
Diesing, M., and Schwarzer, K. (2006). “Identification of submarine hard-bottom substrates in the German North Sea and Baltic Sea EEZ with high-resolution acoustic seafloor imaging,” in Progress in marine conservation in europe (Springer), 111–125.
Diesing, M., Kubicki, A., Winter, C., and Schwarzer, K. (2006). Decadal scale stability of sorted bedforms, German Bight, southeastern North Sea. Cont. Shelf Res. 26, 902–916. doi:10.1016/j.csr.2006.02.009
Dimitrov, L., and Woodside, J. (2003). Deep sea pockmark environments in the eastern Mediterranean. Mar. Geol. 195, 263–276. doi:10.1016/S0025-3227(02)00692-8
Ding, W., Lu, C., Xie, Q., Luo, X., and Zhang, G. (2022). Understanding the settling processes of dredged sediment disposed in open waters through experimental tests and numerical simulations. J. Mar. Sci. Eng. 10, 220. doi:10.3390/jmse10020220
Edgerton, H. E., Seibold, E., Vollprecht, K., and Werner, F. (1966). Morphologische untersuchungen am mittelgrund (eckernförder bucht, westliche ostsee). MEYNIANA, 14. doi:10.2312/MEYNIANA.1966.16.37
Ehlers, J., Grube, A., Stephan, H.-J., and Wansa, S. (2011). “Pleistocene glaciations of north Germany—new results,” in Developments in quaternary sciences (Elsevier), 149–162. doi:10.1016/B978-0-444-53447-7.00013-1
Ernstsen, V. B., Noormets, R., Winter, C., Hebbeln, D., Bartholomä, A., Flemming, B. W., et al. (2006). Quantification of dune dynamics during a tidal cycle in an inlet channel of the Danish Wadden Sea. Geo-Mar. Lett. 26, 151–163. doi:10.1007/s00367-006-0026-2
European Commission (2008). Directive 2008/56/EC of the European Parliament and of the Council of 17 June 2008 establishing a framework for community action in the field of marine environment policy (Marine Strategy Framework Directive). Off. J. Eur. Union 164, 19–40. Available at: https://eur-lex.europa.eu/legal-content/EN/TXT/PDF/?uri=CELEX:32008L0056&from=EN.
European Commission (2017). Commission decision (EU) 2017/848 of 17 may 2017 laying down criteria and methodological standards on good environmental Status of marine waters and specifications and standardised methods for monitoring and assessment, and repealing decision 2010/477/EU. Off. J. Eur. Union 125, 43–74. Available at: https://mcc.jrc.ec.europa.eu/documents/ComDec/Com_dec_GES_2017_848_EU.pdf.
Feldens, P., Schwarzer, K., and Diesing, C. H. M. (2009). “Genesis and sediment dynamics of a subaqueous dune field in Fehmarn Belt (south-Western Baltic Sea),” in Ergebnisse aktueller Küstenforschung, 80.
Feldens, P., Diesing, M., Schwarzer, K., Heinrich, C., and Schlenz, B. (2015). Occurrence of flow parallel and flow transverse bedforms in Fehmarn Belt (SW Baltic Sea) related to the local palaeomorphology. Geomorphology 231, 53–62. doi:10.1016/j.geomorph.2014.11.021
Feldens, P., Schwarzer, K., Sakuna-Schwartz, D., and Khokiattiwong, S. (2022). Geomorphological evolution of the andaman sea offshore phang nga province (Thailand) during the Holocene: An example for a sediment starving shelf. Coasts 2, 1–16. doi:10.3390/coasts2010001
Folk, R. L. (1954). The distinction between grain size and mineral composition in sedimentary-rock nomenclature. J. Geol. 62, 344–359. doi:10.1086/626171
Frey, T., Kampmeier, M., and Seidel, M. (2021). Uncovering the secrets of German marine munitions dumpsites. Hydro International. Available at: https://www.hydro-international.com/content/article/uncovering-the-secrets-of-german-marine-munition-dumpsites (Accessed July 29, 2022).
Gafeira, J., Long, D., and Diaz-Doce, D. (2012). Semi-automated characterisation of seabed pockmarks in the central North Sea. Surf. Geophys. 10, 301–312. doi:10.3997/1873-0604.2012018
Garlan, T., Mathias, X., Brenon, E., Favretto-Cristini, N., Deschamps, A., Beucler, E., et al. (2018). Circular sedimentary figures of anthropic origin in a sediment stability context. J. Coast. Res. 85, 411–415. doi:10.2112/SI85-083.1
Gru, G. (2004). Untersuchungen der Veränderungen der Bathymetrie einer experimentellen Verklappungsstelle mittels Fächerecholotmessungen. GKSS-Forschungszentrum Geesthacht GmbH.
Hart, B. S. (1992). Side-scan sonar observations of Point Grey dump site. Strait of Georgia, British Columbia. doi:10.4095/132787
Heinrich, C., Anders, S., and Schwarzer, K. (2017a). Late Pleistocene and early Holocene drainage events in the eastern Fehmarn Belt and Mecklenburg Bight, SW Baltic Sea. Boreas 47, 754–767. doi:10.1111/bor.12298
Heinrich, C., Feldens, P., and Schwarzer, K. (2017b). Highly dynamic biological seabed alterations revealed by side scan sonar tracking of Lanice conchilega beds offshore the island of Sylt (German Bight). Geo-Mar. Lett. 37, 289–303. doi:10.1007/s00367-016-0477-z
HELCOM (2019). Dredging and depositing of dredged material. Map Data Serv. Available at: https://maps.helcom.fi/website/mapservice/.
Hoffmann, J. J. L., Schneider von Deimling, J., Schröder, J. F., Schmidt, M., Held, P., Crutchley, G. J., et al. (2020). Complex eyed pockmarks and submarine groundwater discharge revealed by acoustic data and sediment cores in Eckernförde Bay, SW Baltic Sea. Geochem. Geophys. Geosystems 21. doi:10.1029/2019GC008825
Hovland, M., and Judd, A. G. (1988). Seabed pockmarks and seepages: Impact on geology, biology and the marine environment. Graham & Trotman. doi:10.13140/RG.2.1.1414.1286
Hovland, M., and Svensen, H. (2006). Submarine pingoes: Indicators of shallow gas hydrates in a pockmark at Nyegga, Norwegian Sea. Mar. Geol. 228, 15–23. doi:10.1016/j.margeo.2005.12.005
Hovland, M. (2008). Deep-water coral reefs: Unique biodiversity hot-spots. Springer Science & Business Media
Hovland, M., Gardner, J. V., and Judd, A. G. (2002). The significance of pockmarks to understanding fluid flow processes and geohazards. Geofluids 2, 127–136. doi:10.1046/j.1468-8123.2002.00028.x
Hovland, M., Heggland, R., De Vries, M. H., and Tjelta, T. I. (2010). Unit-pockmarks and their potential significance for predicting fluid flow. Mar. Pet. Geol. 27, 1190–1199. doi:10.1016/j.marpetgeo.2010.02.005
Jaśniewicz, D., Klusek, Z., Brodecka-Goluch, A., and Bolałek, J. (2019). Acoustic investigations of shallow gas in the southern Baltic Sea (polish exclusive economic zone): A review. Geo-Mar. Lett. 39, 1–17. doi:10.1007/s00367-018-0555-5
Jensen, J. B., Kuijpers, A., Bennike, O., Laier, T., and Werner, F. (2002). New geological aspects for freshwater seepage and formation in Eckernförde Bay, Western Baltic. Cont. Shelf Res. 22, 2159–2173. doi:10.1016/S0278-4343(02)00076-6
Judd, A., and Hovland, M. (2007). Seabed fluid flow: The impact on geology, biology and the marine environment. 1st ed. Cambridge University Press. doi:10.1017/CBO9780511535918
Kampmeier, M., Greinert, J., Strehse, J., Beck, A., Wichert, U., Diller, N., et al. (2018). RV poseidon POS530 cruise report „MineMoni 2018 “mine monitoring in the German Baltic Sea 2018; environmental baseline study testing UDEMM best practices, 01rst–21rst october 2018, kiel (Germany)–Kiel (Germany).
Kampmeier, M., van der Lee, E. M., Wichert, U., and Greinert, J. (2020). Exploration of the munition dumpsite Kolberger Heide in Kiel Bay, Germany: Example for a standardised hydroacoustic and optic monitoring approach. Cont. Shelf Res. 198, 104108. doi:10.1016/j.csr.2020.104108
Karstens, J., Schneider Von Deimling, J., Berndt, C., Böttner, C., Kühn, M., Reinardy, B. T. I., et al. (2022). formation of the figge maar seafloor crater during the 1964 B1 blowout in the German north sea. Earth Sci. Syst. Soc. 2, 10053. doi:10.3389/esss.2022.10053
King, L. H., and MacLean, B. (1970). Pockmarks on the scotian shelf. Geol. Soc. Am. Bull. 81, 3141. doi:10.1130/0016-7606(1970)81[3141:POTSS]2.0.CO;2
Korpinen, S., Zweifel, U. L., Bastardie, F., van Denderen, D., Hoppe, K., Jonsson, P., et al. (2018). Estimating physical disturbance on seabed. Balt. Sea Environ. Proc. 164, 33. Available at: https://helcom.fi/wp-content/uploads/2019/08/BSEP164.pdf.
Krämer, K., Holler, P., Herbst, G., Bratek, A., Ahmerkamp, S., Neumann, A., et al. (2017). Abrupt emergence of a large pockmark field in the German Bight, southeastern North Sea. Sci. Rep. 7, 5150. doi:10.1038/s41598-017-05536-1
Krost, P., Bernhard, M., Hukriede, W., and Werner, F. (1990). Otter trawl tracks in Kiel Bay (Western Baltic) mapped by side-scan sonar. Meeresforschung, 10. doi:10.2312/MEERESFORSCHUNG_32_344-353
Krost, P. (1986). “Wird Ostseebenthos durch Baggergutverklappung gestört,” in Baggern verklappen im küstenbereich-auswirkungen auf makrozoobenthos (BfG-Mitt), 69–72.
Laier, T., and Jensen, J. B. (2007). Shallow gas depth-contour map of the Skagerrak-Western Baltic Sea region. Geo-Mar. Lett. 27, 127–141. doi:10.1007/s00367-007-0066-2
Lefebvre, A., Herrling, G., Becker, M., Zorndt, A., Krämer, K., and Winter, C. (2021). Morphology of estuarine bedforms, weser estuary, Germany. Earth Surf. Process. Landf. 47, 242–256. doi:10.1002/esp.5243
Leipe, T., Tauber, F., Brügmann, L., Irion, G., and Hennings, U. (1998). Schwermetallverteilung in Oberflächensedimenten der westlichen Ostsee (Arkonabecken, Mecklenburger/Lübecker Bucht und Kieler Bucht). Meyniana 50, 137–154.
Leipe, T., Kersten, M., Heise, S., Pohl, C., Witt, G., Liehr, G., et al. (2005). Ecotoxicity assessment of natural attenuation effects at a historical dumping site in the Western Baltic Sea. Mar. Pollut. Bull. 50, 446–459. doi:10.1016/j.marpolbul.2004.11.049
Liehr, G. A., Heise, S., Ahlf, W., Offermann, K., and Witt, G. (2013). Assessing the risk of a 50-year-old dump site in the Baltic Sea by combining chemical analysis, bioaccumulation, and ecotoxicity. J. Soils Sediments 13, 1270–1283. doi:10.1007/s11368-013-0721-3
Lohrberg, A., Schmale, O., Ostrovsky, I., Niemann, H., Held, P., and Schneider von Deimling, J. (2020). Discovery and quantification of a widespread methane ebullition event in a coastal inlet (Baltic Sea) using a novel sonar strategy. Sci. Rep. 10, 4393. doi:10.1038/s41598-020-60283-0
Manso, F., Radzevicius, R., Blažauskas, N., Ballay, A., and Schwarzer, K. (2010). Nearshore dredging in the Baltic Sea: Condition after cessation of activities and assessment of regeneration. J. Coast. Res., 187–194.
Marsh, L., Huvenne, V. A. I., and Jones, D. O. B. (2018). Geomorphological evidence of large vertebrates interacting with the seafloor at abyssal depths in a region designated for deep-sea mining. R. Soc. Open Sci. 5, 180286. doi:10.1098/rsos.180286
Micallef, A., Foglini, F., Le Bas, T., Angeletti, L., Maselli, V., Pasuto, A., et al. (2013). The submerged paleolandscape of the Maltese Islands: Morphology, evolution and relation to Quaternary environmental change. Mar. Geol. 335, 129–147. doi:10.1016/j.margeo.2012.10.017
Micallef, A., Averes, T., Hoffmann, J., Crutchley, G., Mountjoy, J. J., Person, M., et al. (2022). Multiple drivers and controls of pockmark formation across the Canterbury Margin, New Zealand. Basin Res. 12663, 1374–1399. doi:10.1111/bre.12663
Mosher, D. C., Currie, R. G., and Sullivan, D. (1997). Monitoring of ocean disposal using side–scan mosaicing. Lead. Edge 16, 1667–1670. doi:10.1190/1.1437553
Murray, A. B., and Thieler, E. R. (2004). A new hypothesis and exploratory model for the formation of large-scale inner-shelf sediment sorting and “rippled scour depressions”. Cont. Shelf Res. 24, 295–315. doi:10.1016/j.csr.2003.11.001
Nelson, C. H., Johnson, K. R., and Barber, J. H. (1987). Gray whale and walrus feeding excavation on the bering shelf, Alaska. Sediment. Petrol. 57, 419–430. doi:10.1306/212F8B4D-2B24-11D7-8648000102C1865D
Niedermeyer, R.-O., Lampe, R., Jahnke, W., Schwarzer, K., Duphorn, K., Kliewe, H., et al. (2011). Die deutsche Ostseeküste. 2. völlig neu bearbeitete Auflage.
Oberle, F. K. J., Puig, P., and Martín, J. (2018). “Fishing activities,” in Submarine geomorphology. Springer Geology. Editors A. Micallef, S. Krastel, and A. Savini (Cham: Springer International Publishing), 503–534. doi:10.1007/978-3-319-57852-1_25
Ottesen, D., Dowdeswell, J. A., Bellec, V. K., and Bjarnadóttir, L. R. (2017). The geomorphic imprint of glacier surges into open-marine waters: Examples from eastern Svalbard. Mar. Geol. 392, 1–29. doi:10.1016/j.margeo.2017.08.007
Palomino, D., López-González, N., Vázquez, J.-T., Fernández-Salas, L.-M., Rueda, J.-L., Sánchez-Leal, R., et al. (2016). Multidisciplinary study of mud volcanoes and diapirs and their relationship to seepages and bottom currents in the Gulf of Cádiz continental slope (northeastern sector). Mar. Geol. 378, 196–212. doi:10.1016/j.margeo.2015.10.001
Papenmeier, S., Darr, A., and Feldens, P. (2022). Geomorphological data from detonation craters in the Fehmarn Belt, German Baltic Sea. Data 7, 63. doi:10.3390/data7050063
Paull, C., Ussler, W., Maher, N., Greene, H. G., Rehder, G., Lorenson, T., et al. (2002). Pockmarks off big sur, California. Mar. Geol. 181, 323–335. doi:10.1016/S0025-3227(01)00247-X
Pilcher, R., and Argent, J. (2007). Mega-pockmarks and linear pockmark trains on the West African continental margin. Mar. Geol. 244, 15–32. doi:10.1016/j.margeo.2007.05.002
Pinet, N., Duchesne, M., Lavoie, D., Bolduc, A., and Long, B. (2008). Surface and subsurface signatures of gas seepage in the St. Lawrence Estuary (Canada): Significance to hydrocarbon exploration. Mar. Pet. Geol. 25, 271–288. doi:10.1016/j.marpetgeo.2007.07.011
Plaza-Faverola, A., Bünz, S., Johnson, J. E., Chand, S., Knies, J., Mienert, J., et al. (2015). Role of tectonic stress in seepage evolution along the gas hydrate-charged Vestnesa Ridge, Fram Strait: Arctic seepage modulated by tectonics. Geophys. Res. Lett. 42, 733–742. doi:10.1002/2014GL062474
Rise, L., Bellec, V. K., Chand, S., and Bøe, R. (2015). Pockmarks in the southwestern barents sea and finnmark fjords. Nor. J. Geol. 94, 263–282. Available at: https://njg.geologi.no/images/NJG_articles/NJG4_Vol94_4_Rise_Scr.pdf. doi:10.17850/njg94-4-02
Rogers, J. N., Kelley, J. T., Belknap, D. F., Gontz, A., and Barnhardt, W. A. (2006). Shallow-water pockmark formation in temperate estuaries: A consideration of origins in the Western gulf of Maine with special focus on belfast Bay. Mar. Geol. 225, 45–62. doi:10.1016/j.margeo.2005.07.011
Rößler, D., Moros, M., and Lemke, W. (2011). The Littorina transgression in the southwestern Baltic Sea: New insights based on proxy methods and radiocarbon dating of sediment cores: The Littorina transgression in the south-Western Baltic Sea. Boreas 40, 231–241. doi:10.1111/j.1502-3885.2010.00180.x
Schlüter, M., Sauter, E. J., Andersen, C. E., Dahlgaard, H., and Dando, P. R. (2004). Spatial distribution and budget for submarine groundwater discharge in Eckernförde Bay (western Baltic Sea). Limnol. Oceanogr. 49, 157–167. doi:10.4319/lo.2004.49.1.0157
Schneider von Deimling, J., Linke, P., Schmidt, M., and Rehder, G. (2015). Ongoing methane discharge at well site 22/4b (North Sea) and discovery of a spiral vortex bubble plume motion. Mar. Pet. Geol. 68, 718–730. doi:10.1016/j.marpetgeo.2015.07.026
Schönke, M., Clemens, D., and Feldens, P. (2022). Quantifying the physical impact of bottom trawling based on high-resolution bathymetric data. Remote Sens. 14, 2782. doi:10.3390/rs14122782
Schwarzer, K., and Díaz-Mendoza, G. (2020). Lebensraumtypen ostsee synthese - abschlussbericht (unveröff.) Kiel: Institut für Geowissenschaften, Christian-Albrechts-Universität zu Kiel.
Schwarzer, K., and Feldens, P. (2010). Seitensichtsonar-Kartierung der Abrasionsplattform seewärts des Brodtener Ufers (Lübecker Bucht). Kiel: Institut für Geowissenschaften, Christian-Albrechts-Universität zu Kiel.
Schwarzer, K., and Heinrich, C. (2016). Lebensraumtypen IV -kartierung der Flensburger förde - abschlussbericht (unveröff.) Kiel: Institut für Geowissenschaften, Christian-Albrechts-Universität zu Kiel.
Schwarzer, K., and Heinrich, C. (2017). Identifikation mariner Lebensraumtypen vor Schleimünde (Lebensraumtypen IV)-Abschlussbericht. Kiel: Institut für Geowissenschaften, Christian-Albrechts-Universität zu Kiel.
Schwarzer, K., and Unverricht, D. (2020). Lebensraumtypen VI – kartierung Fehmarn ost - abschlussbericht (unveröff.) Kiel: Institut für Geowissenschaften, Christian-Albrechts-Universität zu Kiel.
Schwarzer, K., and Unverricht, D. (2021). FFH – LRT-Kartierung im Bereich Fehmarn Süd. Kiel: Institut für Geowissenschaften, Christian-Albrechts-Universität zu Kiel.
Schwarzer, K., Themann, S., and Krause, R. (2008). Zusammenstellung der marinen Lebensraumtypen nach FFH. S. (unveröff.), 22. Küsten: Abschlussbericht Univ Kiel Inst F Geowiss Sedimentol. Schelfgeologie. doi:10.13140/2.1.3342.4164
Schwarzer, K., Heinrich, C., and Papenmeier, S. (2014). Identifikation mariner lebensraumtypen in der Mecklenburger bucht (kartierung der Sagasbank)- abschlussbericht (unveröff.) Kiel: Institut für Geowissenschaften, Christian-Albrechts-Universität zu Kiel.
Schwarzer, K., Ricklefs, K., Lohrberg, A., and Valerius, J. (2019). Die geologische entwicklung von Nord-und ostsee. Küste 87, 343–376.
Schwarzer, K., Heinrich, C., Unverricht, D., and Reimers, H.-C. (2022). Habitat mapping in coastal waters of the Baltic Sea -A 14-years’ experience from schleswig-holstein. Adv. Oceanogr. Mar. Biol. doi:10.33552/AOMB.2022.03.000561
Seifert, T., Tauber, F., and Kayser, B. (2001). A high resolution spherical grid topography of the Baltic Sea–. 2nd edition, 25–29.
Siebert, U., Stürznickel, J., Schaffeld, T., Oheim, R., Rolvien, T., Prenger-Berninghoff, E., et al. (2022). Blast injury on harbour porpoises (Phocoena phocoena) from the Baltic Sea after explosions of deposits of World War II ammunition. Environ. Int. 159, 107014. doi:10.1016/j.envint.2021.107014
Somoza, L. (2003). Seabed morphology and hydrocarbon seepage in the Gulf of Cádiz mud volcano area: Acoustic imagery, multibeam and ultra-high resolution seismic data. Mar. Geol. 195, 153–176. doi:10.1016/S0025-3227(02)00686-2
Stockmann, K., Riethmüller, R., Heineke, M., and Gayer, G. (2009). On the morphological long-term development of dumped material in a low-energetic environment close to the German Baltic coast. J. Mar. Syst. 75, 409–420. doi:10.1016/j.jmarsys.2007.04.010
Sullivan, D., Staples, S., Wilkinson, J., Brady, C., and Waters, M. (2006). Disposal at sea activities summary 2002: Pacific and Yukon region. Environment Canada. Available at: https://publications.gc.ca/collections/collection_2019/eccc/en40-240/En40-240-06-05-eng.pdf.
Syvitski, J. P. M., Stein, A. B., Andrews, J. T., and Milliman, J. D. (2001). Icebergs and the sea floor of the east Greenland (kangerlussuaq) continental margin. Arct. Antarct. Alp. Res. 33, 52–61. doi:10.1080/15230430.2001.12003404
Szpak, M. T., Monteys, X., O’Reilly, S. S., Lilley, M. K. S., Scott, G. A., Hart, K. M., et al. (2015). Occurrence, characteristics and formation mechanisms of methane generated micro-pockmarks in Dunmanus Bay, Ireland. Cont. Shelf Res. 103, 45–59. doi:10.1016/j.csr.2015.04.023
Tauber, F. (2009). Sidescan sonar survey of a dumping site in the Mecklenburg Bight (south-Western Baltic Sea). J. Mar. Syst. 75, 421–429. doi:10.1016/j.jmarsys.2008.04.006
Truitt, C. L. (1988). Dredged material behavior during open-water disposal. J. Coast. Res. 4, 489–497. Available at: http://www.jstor.org/stable/4297441.
Uścinowicz, S., Jegliński, W., Miotk-Szpiganowicz, G., Nowak, J., Pączek, U., Przezdziecki, P., et al. (2014). Impact of sand extraction from the bottom of the southern Baltic Sea on the relief and sediments of the seabed. Oceanologia 56, 857–880. doi:10.5697/oc.56-4.857
Virtasalo, J. J., Korpinen, S., and Kotilainen, A. T. (2018). Assessment of the influence of dredge spoil dumping on the seafloor geological integrity. Front. Mar. Sci. 5, 131. doi:10.3389/fmars.2018.00131
Walbridge, S., Slocum, N., Pobuda, M., and Wright, D. (2018). Unified geomorphological analysis workflows with benthic terrain modeler. Geosciences 8, 94. doi:10.3390/geosciences8030094
Watson, S. J., Ribó, M., Seabrook, S., Strachan, L. J., Hale, R., and Lamarche, G. (2022). The footprint of ship anchoring on the seafloor. Sci. Rep. 12, 7500. doi:10.1038/s41598-022-11627-5
Webb, K. E., Barnes, D. K. A., and Plankea, S. (2009). Pockmarks: Refuges for marine benthic biodiversity. Limnol. Oceanogr. 54, 1776–1788. doi:10.4319/lo.2009.54.5.1776
Weber, T., Wiseman, N. A., and Kock, A. (2019). Global ocean methane emissions dominated by shallow coastal waters. Nat. Commun. 10, 4584. doi:10.1038/s41467-019-12541-7
Wenau, S., Spiess, V., and Zabel, M. (2021). Giant seafloor depressions caused by slope failures and bottom currents on the Namibia continental margin. Geochem. Geophys. Geosystems 22. doi:10.1029/2020GC009548
Werner, F. (1978). Depressions in mud sediments (Eckernfoerde Bay, Baltic Sea), related to sub-bottom and currents. Meyniana 30, 99–104.
Wessels, M., Bussmann, I., Schloemer, S., ter, M. S., and dere, V. B. (2010). Distribution, morphology, and formation of pockmarks in Lake Constance, Germany. Limnol. Oceanogr. 55, 2623–2633. doi:10.4319/lo.2010.55.6.2623
Whiticar, M. J., and Werner, F. (1981). Pockmarks: Submarine vents of natural gas or freshwater seeps? Geo-Mar. Lett. 1, 193–199. doi:10.1007/BF02462433
Whiticar, M. J. (2002). Diagenetic relationships of methanogenesis, nutrients, acoustic turbidity, pockmarks and freshwater seepages in Eckernförde Bay. Mar. Geol. 182, 29–53. doi:10.1016/S0025-3227(01)00227-4
Keywords: anthropogenic footprint, seafloor morphology, multibeam echosounder, pockmarks, hydroacoustics, Baltic Sea, seafloor circular features
Citation: Díaz-Mendoza GA, Krämer K, von Rönn GA, Schwarzer K, Heinrich C, Reimers H-C and Winter C (2023) Circular structures on the seabed: differentiating between natural and anthropogenic origins—Examples from the Southwestern Baltic Sea. Front. Earth Sci. 11:1170787. doi: 10.3389/feart.2023.1170787
Received: 21 February 2023; Accepted: 06 June 2023;
Published: 26 June 2023.
Edited by:
Peter Townsend Harris, Grid-Arendal, NorwayReviewed by:
Thierry Garlan, Service Hydrographique et Océanographique de la Marine (SHOM), FranceVerner Brandbyge Ernstsen, Geological Survey of Denmark and Greenland, Denmark
Jens Greinert, GEOMAR Helmholtz Center for Ocean Research Kiel, Germany
Copyright © 2023 Díaz-Mendoza, Krämer, von Rönn, Schwarzer, Heinrich, Reimers and Winter. This is an open-access article distributed under the terms of the Creative Commons Attribution License (CC BY). The use, distribution or reproduction in other forums is permitted, provided the original author(s) and the copyright owner(s) are credited and that the original publication in this journal is cited, in accordance with accepted academic practice. No use, distribution or reproduction is permitted which does not comply with these terms.
*Correspondence: Giuliana Andrea Díaz-Mendoza, Z2l1bGlhbmEuZGlhekBpZmcudW5pLWtpZWwuZGU=