 Zhaolong Liu1*
 Dong Chen2Zhiyong Gao1Yongping Wu2Yongzhong Zhang1Kunyu Fan2Baohua Chang1Peng Zhou2Weigang Huang1Chunlei Hu2
- 1PetroChina Research Institute of Petroleum Exploration and Development, Beijing, China
- 2Tarim Oilfield Company, Korla, China
The fractured reservoir is one of the significant petroleum reservoir types in China, representing over one-third of total reserves. The Kuqa Depression in the Tarim Basin is dominated by fractured low-porosity sandstone gas reservoirs with characteristic tight matrix, developed fractures, and edge and bottom water. However, the continued development of these reservoirs has led to various problems, including strong reservoir heterogeneity, low well control, complex gas-water relationships, and early water invasion. Addressing these issues requires a detailed understanding of the reservoir’s geological characteristics. One method for achieving a fine reservoir description is through the use of 3D geological modeling. This high-level, comprehensive characterization technique is widely used throughout the entire life cycle of oil and gas field development. A 3D geological model can accurately predict the actual underground reservoir characteristics and provide a geological basis for later numerical simulation work. Based on a study of the geological characteristics of the Kuqa Depression in the Tarim Basin, a 3D geological modeling technique was developed, which includes structural modeling, facies modeling, petrophysical modeling, and fracture modeling. This technology has been successfully applied to many deep gas reservoirs in the Kuqa Depression of the Tarim Basin, leading to enhanced gas recovery.
1 Introduction
The concept of 3D geological modeling was proposed in the late 1980s. After 4 decades of development, significant progress has been made in modeling methods, algorithms, and software. Nowadays, it is moving toward big data analysis, deep learning, and artificial intelligence (Høyer et al., 2015; Li et al., 2016; Varga and Wellmann, 2016; Snyder et al., 2018; Liu et al., 2021a; Zhou et al., 2021; Shi and Wang, 2022). 3D geological modeling is an interdisciplinary field that integrates geology, mathematics, and computer science. This method comprehensively utilizes seismic, geology, well logging, well testing, and reservoir engineering data to establish a 3D digital quantitative geological model by quantitatively characterizing the structure, sedimentation, reservoir properties, and fluid properties (Jia et al., 2007; Wu and Li, 2007; Calcagno et al., 2012; Jørgensen, 2015; Schneeberger et al., 2017; Ursegov et al., 2018a; Grose et al., 2019; Chen et al., 2021; Yuan et al., 2022; Zhan et al., 2022). Numerous studies have been conducted on 3D geological modeling in recent years. For example, Qiu and Jia (2000) summarized the technology development of geological modeling in the past decade in China and accurately proposed the development direction of the fine outcrop study, stochastic modeling method, high-resolution sequence stratigraphy, and well-to-seismic ties. By using the modeling method of “multi-phase constraint, hierarchical facies control, and multi-step modeling”, Guo et al. (2015) solved the problem of poor application of traditional modeling methods in braided fluvial tight sandstone gas reservoir of the Sulige gas field, and it improved the accuracy and reliability of the prediction model. Hu et al. (2014) built an accurate model highly consistent with the oilfield production performance by applying the “multi-stage, multi-condition” constraint modeling method of seismic inversion. Ursegov et al. (2018b) proposed a new adaptive approach to create full-field geological and hydrodynamic models of unconventional carbonate reservoirs with heavy oil, and the adaptive hydrodynamic models were history-matched. Irakarama et al. (2021) proposed a new method for implicit structural modeling that extended the inherent properties of the classic one-dimensional discrete second derivative operator to higher dimensions, and the results were robust and numerically efficient.
The Kuqa Depression development of the Tarim Oilfield currently faces the challenge of maintaining stable production and expediting production initiation. One crucial issue that needs to be addressed is the determination of an optimal well count and gas production rate within the Kuqa Depression. However, due to the limited availability of data, it becomes imperative to establish a refined 3D geological model that accurately represents the subsurface characteristics during this development period. 3D geological modeling is an essential technique for the characterization of reservoirs and is widely used in all stages of oil and gas field development. The geological model provides the basis for the reservoir development plan, such as the prediction of the development index, the deployment of well locations, and the design of well trajectories. However, due to the unique reservoir characteristics of deep burial (6000–8000 m), strong heterogeneity (sand ratio of 15%–90%), low matrix porosity (4%–12%), and fracture development (0.1–0.8 numbers per meter) in the Kuqa Depression of the Tarim Basin, there are several challenges in 3D geological modeling. Firstly, due to the buried depth of the Kuqa reservoir being generally more than 7,000 m, the poor seismic data limits the accuracy of the underground structure characterization. Secondly, the “small number of wells and fast production construction” development plan only allows for 1–3 wells at the early development stage, making it difficult to predict reservoir properties at the edge accurately. Thirdly, with a low well pattern density of 8–12 wells per square kilometer and a large well spacing of 2–5 km, it is challenging to predict inter-well characteristics accurately. Finally, the widespread development of fractures in the Kuqa reservoir presents difficulties in describing fracture parameters such as shape, length, and aperture and predicting fracture distribution through 3D geological modeling.
2 Geological setting
The Kuqa Depression of the Tarim Basin is mainly a fractured gas reservoir with abundant resources. The proven reserves of the Kuqa reservoir are 1476.7 billion cubic meters, which accounts for 68% of the proven gas reserves and 72% of the gas production in the Tarim Oilfield. It is the main block responsible for increasing reserves and production in the Tarim Oilfield (Figure 1). Keshen 8, Keshen 24, Dabei 102, Dabei 201, Bozi 1, Bozi 3, and other gas fields are the primary reservoirs, and they generally have characteristics of ultra-deep, high temperature, high pressure, low porosity, low permeability, and developed fractures. The reservoir depth ranges between 6,000 and 8,000 m, while the reservoir pressure and temperature range between 100 and 130 MPa and 140°C–190°C, respectively. Additionally, the reservoir thickness ranges between 260 and 350 m, while the effective matrix porosity and permeability are 4%–12% and 0.05–0.15×10 –3μm2, respectively. Currently, the total number of gas wells in this area is 232, with 182 wells in production (78.4% of the total). The average well production is 374,000 m3/day, and the gas recovery rate ranges between 2% and 3%.
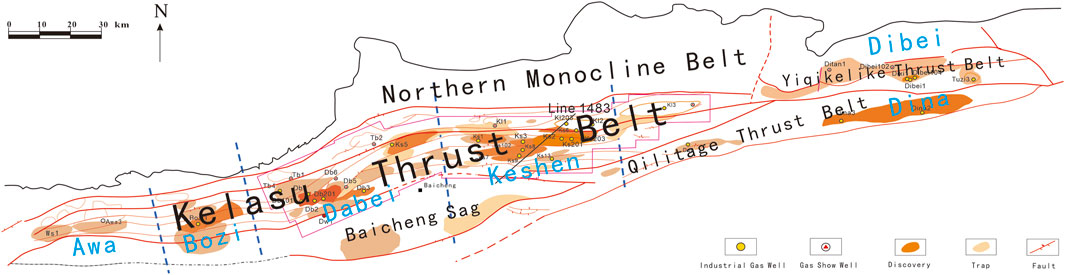
FIGURE 1. Gas reservoir distribution of the Kuqa Depression in the Tarim Basin (modified from the Tarim Oil Field Company report).
3 Materials and methods
The Kuqa Depression in the Tarim Basin is a sedimentary system that includes alluvial fan, fan delta or braided river delta, and shore-shallow lake (Gu et al., 2001; Zhang et al., 2008; Pan et al., 2013; Lai et al., 2018; Liu et al., 2019; Liu et al., 2021b; Chen et al., 2021; Liu et al., 2022; Liu et al., 2022). The subfacies are mainly subaqueous distributary channels and mouth bars of the fan delta or braided river delta. The provenance is mainly from the South Tianshan debris, and the paleocurrent flow direction is from north to south. The sandbody is relatively stable, and the lithofacies are mainly sandstone and mudstone. The main sandbody of the Kuqa reservoir is formed by multi-stage channels that overlay and connect with each other. Outcrop studies show that the thickness of the mud interlayer is less than 4 m, the length of the mud interlayer is 10–600 m, and the density of the mud interlayer is 0.1–0.4 m per meter. Logging analysis shows that the mud interlayer thickness is 1–5 m, the mud interlayer frequency is 0.1–0.3 numbers per meter, and the mud interlayer density is 0.1–0.8 m per meter (Figure 2). The interlayer is primarily distributed among sandbodies, while its continuity is deficient, leading to a lack of sealing effect on the reservoir. This study indicates that the reservoir exhibits robust connectivity.
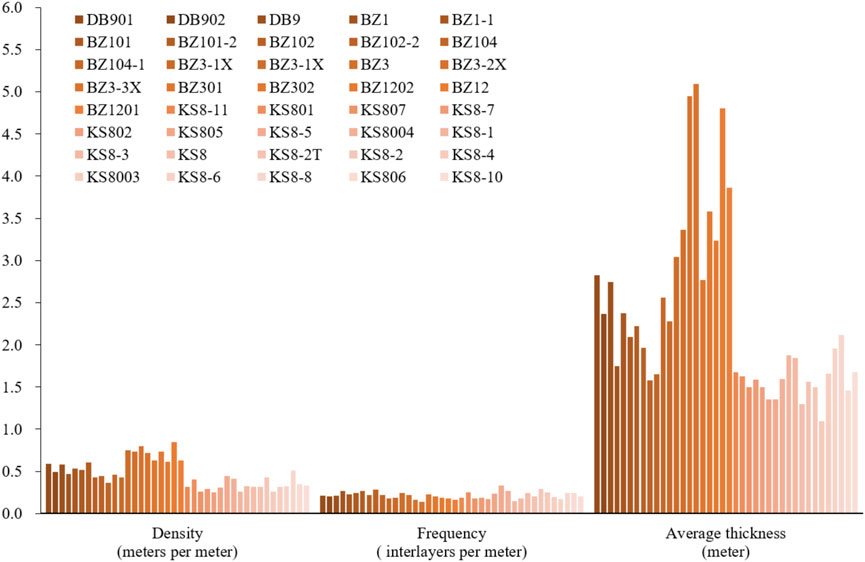
FIGURE 2. Mud interlayer statics of typical gas wells in the Kuqa Depression.
Under the multi-stage tectonic movement during Yanshanian and Himalayan periods, the fault system demonstrates substantial development. Within the designated study area, a comprehensive analysis reveals the existence of 41 secondary and tertiary faults, exhibiting varying lengths ranging from 440 to 29,054 m. These faults primarily exhibit a predominant trend oriented in the NEE direction. Fractures are generally developed in the Kuqa reservoir. The fractures are typically high-angle or vertical structural fractures, with a density ranging from 1 to 5 fractures per meter (Figure 3). These fractures are primarily semi-filled or unfilled, and the fillings are predominantly composed of calcite and gypsum. The aperture of the fractures ranges from 0.1 to 0.6 mm, and the fracture effectiveness is generally good (Figure 4). Fractures can be classified into three types based on their genetic mechanisms, geometric scales, and penetrability: large-scale, medium-scale, and small-scale. Large-scale fractures possess the ability to penetrate multiple sets of compound sandbodies, with lengths that can extend up to hundreds of meters, heights reaching tens of meters, and apertures measuring several millimeters. They primarily control inter-well and inter-layer seepage flow. Medium-scale and small-scale fractures, on the other hand, tend to be relatively limited in scale, predominantly developing within the sandbody and exhibiting lengths generally less than 100 m. These types of fractures mainly exert influence over inner-layer seepage flow (Table 1).
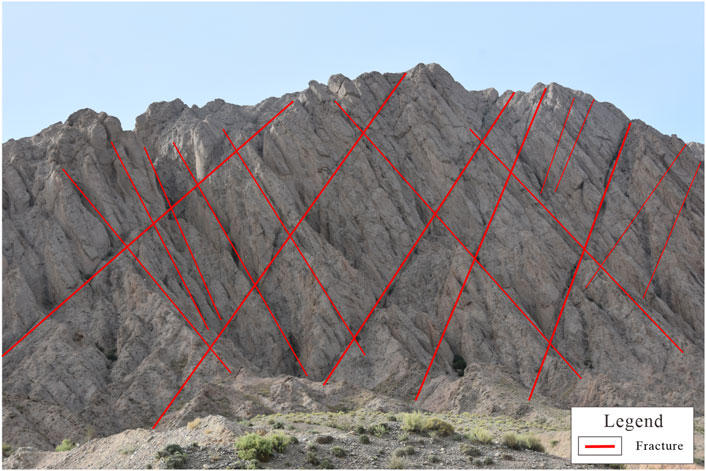
FIGURE 3. Fracture characterization of the Kuqa River outcrop.
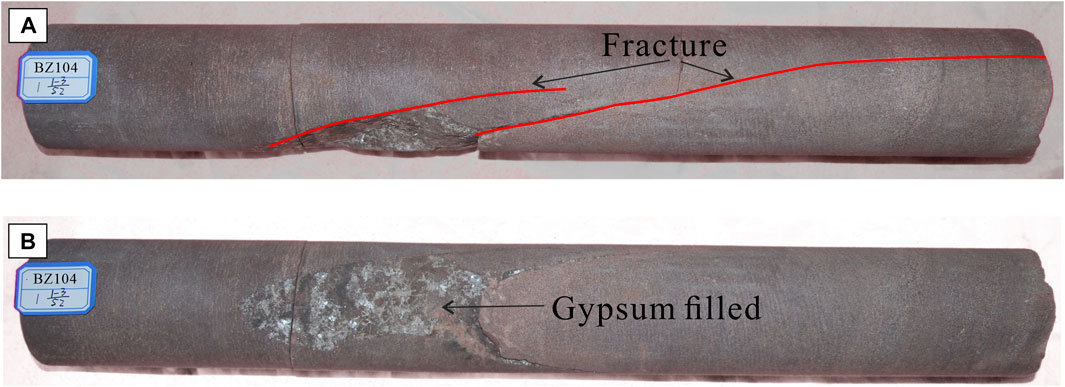
FIGURE 4. Fracture and filling characterization of well BZ104 coring. (A) High-angle structural fracture developed; (B) Gypsum is filled in the fracture.
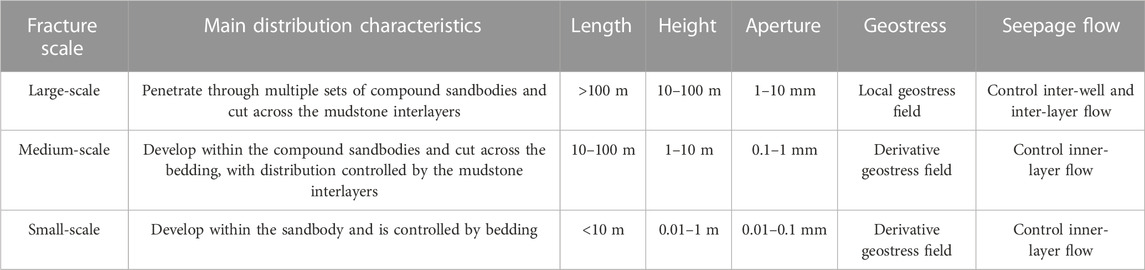
TABLE 1. Fracture classification standard in the study area.
Aiming to address the primary challenges of 3D geological modeling of deep fractured low porosity sandstone gas reservoirs, a 3D geological modeling technique has been developed for the Kuqa Depression of the Tarim Basin, building upon existing 3D geological modeling methods and geological data. This technique includes structural modeling using well top and seismic data, facies modeling using lithology data, petrophysical modeling using matrix property data, and fracture modeling using imaging logging data. During the modeling process, performance data such as initial production and well-testing data are fully utilized, resulting in building a multi-scale fracture-matrix-performance 3D geological model (Figure 5). The 3D geological modeling technique comprises four key techniques: 1) Structural modeling under well-to-seismic ties, 2) facies modeling under the stochastic object, 3) reservoir petrophysical modeling under facies constraint, and 4) fracture modeling under multi-condition constraint and static-performance data combined.
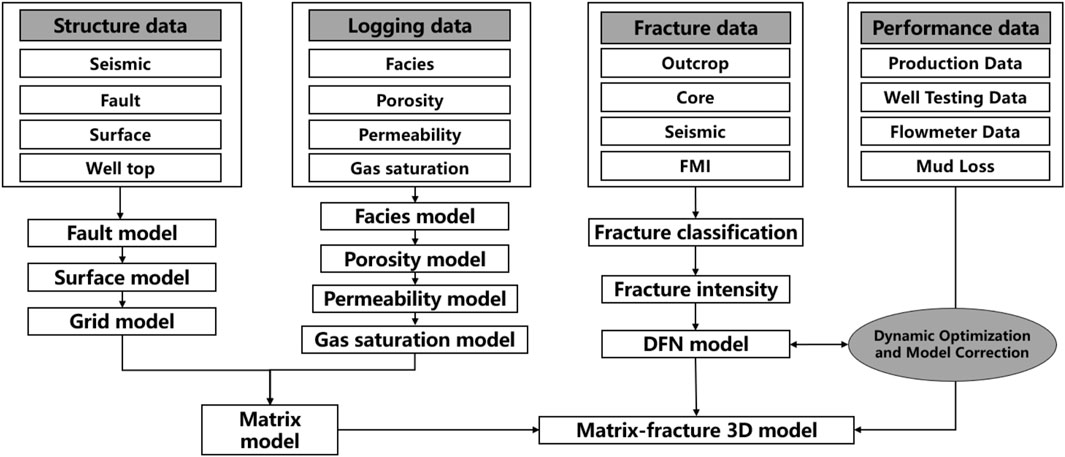
FIGURE 5. Flow chart of multi-scale fracture-matrix-performance 3D geological modeling.
The research area encompasses two geological components, namely, matrix and fractures. Initially, a comprehensive grid model is constructed by integrating seismic, fault, surface, and well topographical data, employing the “structural modeling under well-to-seismic ties” within structural modeling. This grid model incorporates fault and surface models, providing a solid foundation for subsequent modeling stages. Subsequently, leveraging the grid model, the lithofacies model is established through the application of “facies modeling under stochastic object,” taking into consideration logging data related to lithofacies, porosity, permeability, and gas saturation. Furthermore, the “reservoir petrophysical modeling under facies constraint” is employed to build models for porosity, permeability, and gas saturation. Lastly, employing field outcrop, core, seismic, and imaging logging data, an innovative approach “fracture modeling under multi-condition constraint and static-performance data combined” is employed in fracture modeling. By incorporating dynamic data such as production data, well-test data, flow meter data, and mud loss data, the fracture modeling process is effectively constrained, leading to the establishment of a 3D geological model that accurately reflects the actual geological conditions.
4 Results
4.1 Structural modeling under well-to-seismic ties
Aiming to address the poor quality of seismic data in the Kuqa Depression, the wide-azimuth seismic technique has been utilized to enhance the signal-to-noise ratio and resolution of the seismic data. Wide-azimuth seismic is employed to enhance the azimuth angle of seismic sampling, consequently augmenting the aspect ratio of the azimuth observation acquisition system from 0.22 to 0.45. In comparison to conventional 3D seismic data, the seismic data obtained through this high-density wide-azimuth seismic technology encompasses a more comprehensive seismic wave field, facilitating richer amplitude imaging and azimuthal anisotropy information. This expanded dataset serves as a foundation for subsequent seismic data processing and interpretation, offering a more precise and detailed basis for the accuracy demands of 3D structural modeling. The method of well-to-seismic ties has been applied to interpret the target structure, resulting in a significant reduction in the error of target depth to within 25 m. Additionally, over the past 5 years, the well drilling success rate has been 100%.
Structural modeling is the first and most critical step in 3D geological modeling, providing the framework for facies and petrophysical modeling. The accuracy of the structural model is essential for ensuring high-quality modeling results (Wu et al., 2005; Marquer et al., 2006; Calcagno et al., 2008; Pakyuz-Charrier et al., 2018b; Zhong, 2019; Almedallah et al., 2021; Hillier et al., 2021; Lan et al., 2021). Structural modeling involves the development of both fault and surface models, with the well-to-seismic ties method employed to create the structural framework based on fine structural interpretation.
Based on the contour map derived from seismic interpretation, the faults are imported into the modeling software. Then, the faults from different surfaces are classified, which are used to analyze the vertical extension length and dip angle. After building the initial fault model, the model is repeatedly modified according to the fault relationships using a 3D visual interactive window. This is done to ensure that the fault model is consistent with the seismic surface and that the distribution of faults in three-dimensional space is reasonable.
The first step in building the surface model is pillar gridding, which divides the structure into thousands of grids to reflect the structure’s elevation. Considering the complex anticline structural reservoir and computing speed, a plane grid size of 50 m × 50 m is adopted. Typically, well tops and structural maps are used to constrain surface modeling. However, some Kuqa reservoirs modeled by this traditional method have issues such as formation pinch-out and formation crossing, which differ from the actual underground formation. Due to the stable sedimentary environment, the Kuqa reservoir has relatively uniform formation thickness, and the poor seismic data makes it difficult to match the well tops exactly with the structure. Therefore, a comprehensive dataset of top structure, bottom structure, and well tops is used to build the surface model. The structural model created using this method is more consistent with the actual structural characteristics (Figure 6).
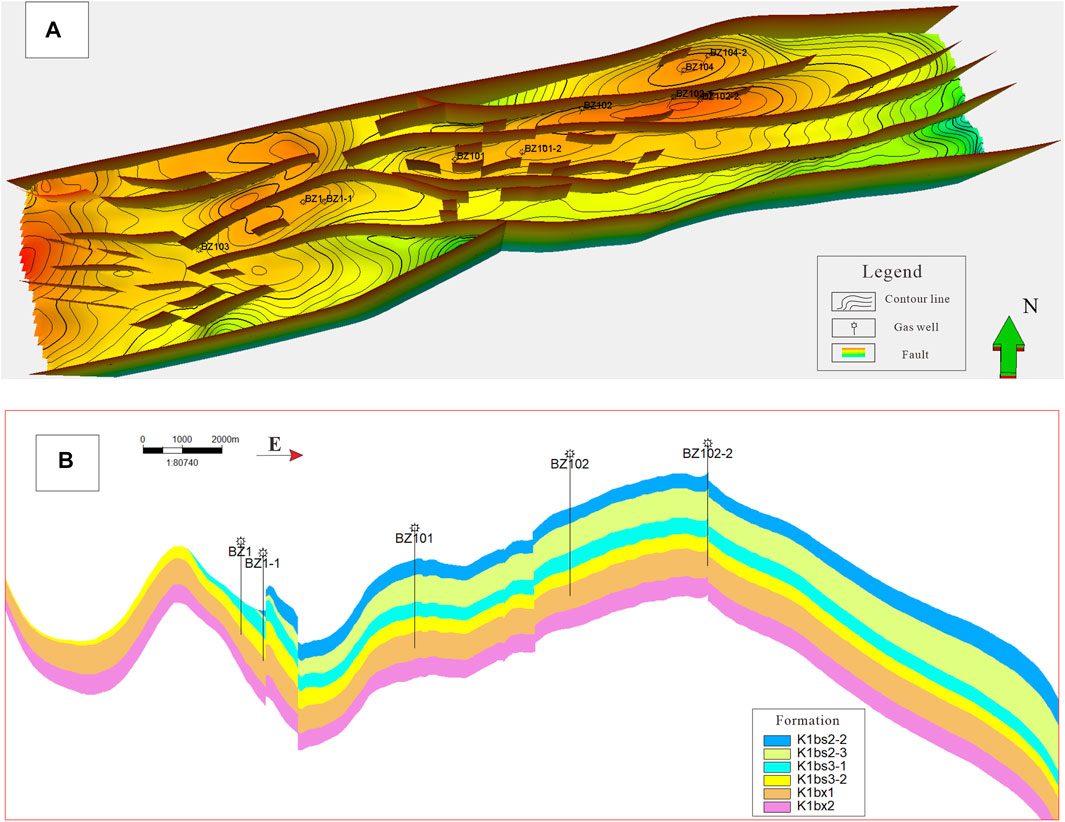
FIGURE 6. 3D structural model of the study area. (A) Surface and faults model; (B) Intersection of the 3D structural model.
4.2 Facies modeling under the stochastic object
Facies modeling involves two main methods: deterministic modeling and stochastic modeling. Common methods used in facies modeling include object modeling, truncated Gaussian simulation, sequential indicator simulation, multipoint simulation, and indicator Kriging simulation. Each of these methods has its own advantages and applicable conditions, and the optimal method should be selected based on the geological conditions of the gas reservoir being studied (Falivene et al., 2006; Correia et al., 2014; Wellmann et al., 2014; 2018; Pakyuz-Charrier et al., 2018a; 2019; Wellmann and Caumon, 2018; Ferrer et al., 2021; Laudadio et al., 2022).
Because of the challenges posed by the strong heterogeneity, low well control degree, and limited wells in the Kuqa reservoir, the stochastic object modeling method is adopted to build a facies model based on the geological characteristics of the study area. This method involves stochastically simulating the facies model using object parameters such as shape, length, width, thickness, and direction to reflect the statistical probability and trend distribution of the geological object. Based on the lithology and sedimentation analysis, sandstone is used as the background and mudstone as the object during the stochastic simulation. The mudstone content is derived from well logging analysis, and geological parameters, such as direction, length, length-width ratio, and thickness, are primarily based on outcrop and single-well statistical research. Furthermore, the mudstone distribution is used as a trend to constrain the facies modeling and accurately predict the facies distribution between wells. The Kuqa facies model obtained using this method accurately shows the sandbody distribution, and the geometric characteristics of the subaqueous distributary channel, mouth bar, and interdistributary bay are consistent with the previous geological research (Figure 7). Influenced by the provenance from the north, the formation of the braided river delta front sedimentary system occurs in a north-to-south direction. The model exhibits a sand ratio of 69.1%. Regarding the spatial distribution, the central and western regions display a greater thickness of sandstone in the horizontal plane. In the vertical direction, as depth increases, there is a gradual increase in the content of mudstone, accompanied by a gradual decrease in the sand ratio.
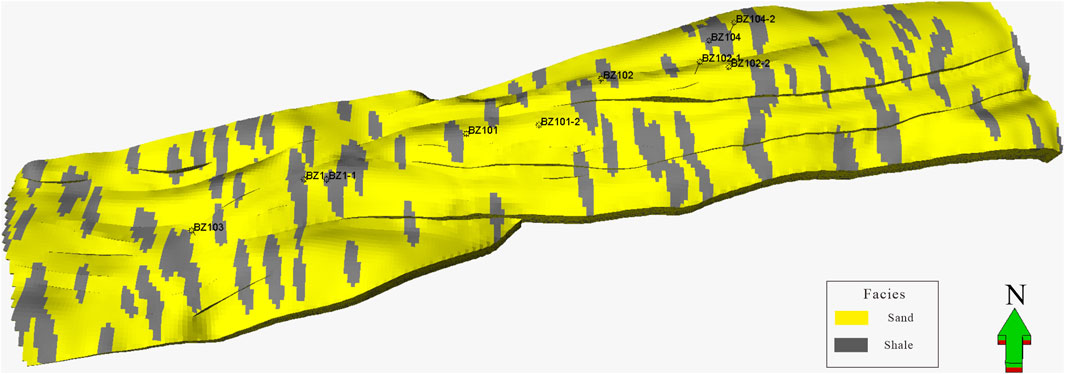
FIGURE 7. 3D facies model of the study area.
4.3 Reservoir petrophysical modeling under facies constraint
Similar to the facies modeling simulation methods, petrophysical modeling of the reservoir involves techniques such as sequential Gaussian simulation, Gaussian random function simulation, Kriging simulation, and moving average simulation (Linsel et al., 2020; Yong et al., 2020; Giraud et al., 2021; Ursegov et al., 2021). In line with the geological features of the study area, sequential Gaussian simulation is utilized to stochastically model the reservoir properties, including porosity, permeability, and gas saturation under facies constraints.
Due to the nappe-thrust tectonic movement in the study area, each block exhibits morphological features with a long axis in the east-west direction and a short axis in the north-south direction, where the long axis is perpendicular to the provenance direction. With a large well spacing, the variogram analysis of various petrophysical data must consider the structural and sedimentary characteristics to determine key parameters such as major range, minor range, and vertical range. Failure to consider these characteristics during variogram analysis can lead to the mistaken assumption that the main major range is in the east-west direction, which is inconsistent with the actual provenance direction of the north-south direction. This contradiction between the petrophysical model and actual reservoir characteristics can be avoided by considering the structural and sedimentary characteristics during variogram analysis.
Using facies constraints during sequential Gaussian simulation can help predict properties in different facies and reduce uncertainty between wells (Liu et al., 2022; Liu et al., 2023). The lithologies of the Kuqa reservoir are predominantly sandstone and mudstone. Range parameters from variogram analysis are used in sandstone petrophysical modeling, while a minimum value (porosity is 1%, permeability is 0.001 × 10⁻³ μm2, gas saturation is 1%) is directly assigned for the mudstone petrophysical modeling. The model is set with a major range of 1480.3, a minor range of 876.9, and a vertical range of 4.3. By conducting statistical probability analysis on the acoustic impedance and lithofacies types (sandstone and mudstone) at the well locations, the relationship between different lithofacies and corresponding acoustic impedance is established. Additionally, the probability of porosity occurrence in mudstone for different acoustic impedance is determined through correlation analysis. The research findings indicate a positive correlation between permeability and porosity in the study area. To enhance the accuracy and reliability of the permeability model, we integrate porosity as a co-Kriging parameter. This integration allows us to control the permeability model based on the corresponding porosity, and we improve the accuracy and reliability of the permeability model in the study area. This study leverages single well logging interpretation to establish the gas saturation data, which serves as the foundational input for simulating the static distribution relationship between gas and water within the reservoir using a random simulation algorithm. The resulting porosity, permeability, and gas saturation models contain geological characteristics of sedimentation and petrophysical distribution, which are more consistent with the actual geological characteristics (Figure 8). The model exhibits a porosity range of 3.5%–8.2%, with an average porosity of 4.5%. The permeability ranges from 0.06 to 4.7 × 10⁻³ μm2, with an average permeability of 0.068 × 10⁻³ μm2. The gas saturation ranges from 50% to 81%, with an average of 63%. In terms of spatial distribution, the middle reservoir demonstrates favorable properties overall on the horizontal plane. However, as the burial depth increases in the vertical direction, the reservoir properties gradually deteriorate.
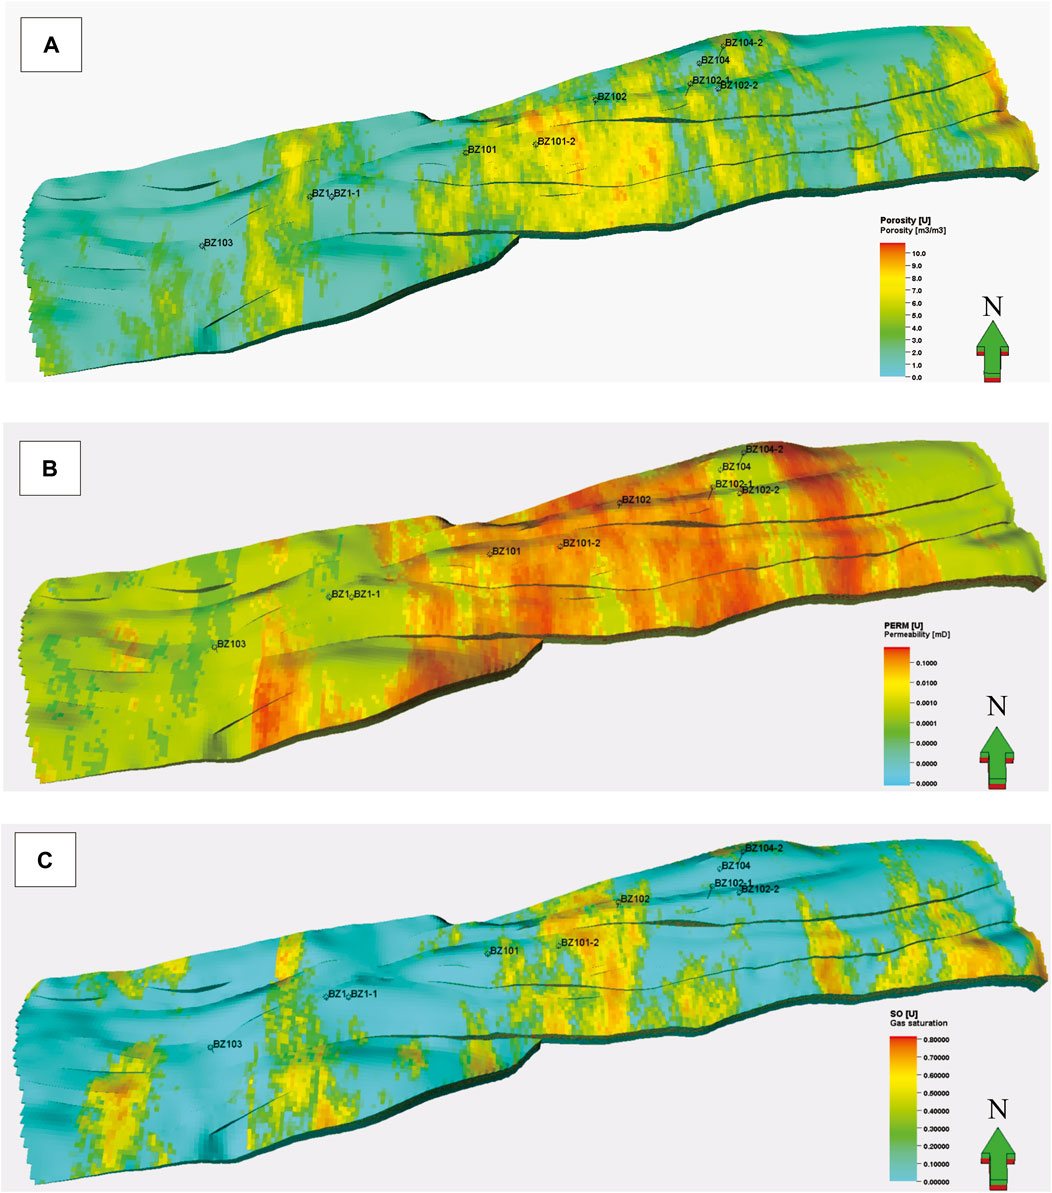
FIGURE 8. 3D reservoir petrophysical model of the study area. (A) Porosity model; (B) Permeability model; (C) Gas saturation model.
4.4 Fracture modeling under multi-condition constraint and static-performance data combined
Fracture modeling using seismic attributes, such as the ant-tracking technique, cannot accurately identify fractures in the Kuqa Depression of the Tarim Basin due to poor seismic data quality. Therefore, in fracture modeling, it is necessary to consider various influential factors such as geostress, faults, and structural position that affect the development of fractures. Through comprehensive analysis involving field outcrops, core observations, experimental analysis, and other methodologies, a comprehensive examination of various factors influencing the extent of fracture development has been conducted. Genesis analysis indicates that fractures are primarily controlled by factors such as faulting, folding, structural location, and lithology. These factors play significant roles in shaping the development and distribution of fractures. We assume that these fractures are further constrained by curvature, geostress, distance from the anticline axis, and distance from the fault. Fracture development is concentrated near faults and folds where geostress is concentrated, with the 200–300-m area around these structures being the primary fracture development zone. Different lithologies have different rock mechanics parameters, leading to varying numbers of fractures formed under the same geostress. The Kuqa reservoir has a tight matrix, and the fractures developed around the wells are the primary channels for fluid flow into the wellbore. Initial production data can effectively reflect the fracture development around the wells.
Based on the analysis of fracture azimuth, the fractures in the Kuqa Depression have been divided into two groups with nearly north-south and nearly east-west directions, respectively. By coupling the characteristics of the paleostress field, three main periods of fracture formation have been determined. It is considered that the Himalayan period is the primary formation period, during which the fractures have a low filling and good effectiveness under compressive geostress.
With the rapid development of fracture research and computer technology in recent years, fracture prediction has evolved from conventional interpolation methods to space subdivision methods, such as discrete fracture network modeling (Benedetto et al., 2014; Pellerin, 2014; Hyman et al., 2015; Azim, 2021; Ceccato et al., 2021; Wang et al., 2021; Berrone and Raeli, 2022; Lopes et al., 2022; Yan et al., 2022). Stress-intensity factors are relative to fracture pressure, fracture height, and layer stress (Li et al., 2022). Equilibrium fracture height can be calculated based on the relationships between the stress-intensity factors at the tips and the fracture toughness in the layers (Weng et al., 2011; Li and Wu, 2022).
Where
In accordance with the fracture characteristics of the study area, fractures of different groups and periods are simulated during discrete fracture network modeling. Based on outcrop data, the deterministic modeling of the structural trace method under fault constraint is used to predict large-scale fractures. Using the constraints of curvature, geostress, distance from the anticline axis, and distance from the fault, medium and small-scale discrete fracture network models are built based on fracture development properties and large-scale fracture models. Performance constraint properties are established by integrating several performance data, including initial production, well test permeability, and drilling fluid loss. The modeling process utilizes the co-kriging method to effectively incorporate performance constraint properties into the fracture distribution prediction. By coupling fractures of different periods and scales, a multi-scale fracture model under multiple constraints is built (Figure 9). The fractures exhibit a distribution with two main sets of fractures oriented in EW and NS directions. These fractures display an inclination angle ranging from 52° to 89°, with an average angle of 72°. Fracture development is notably pronounced in the elevated regions of the structure and close proximity to the fault zone. These areas exhibit a higher fracture density, indicating a greater abundance of fractures, and demonstrate favorable effectiveness in terms of their connectivity and fluid flow properties.

FIGURE 9. Discrete fracture network model of the study area.
Based on the 3D geological modeling technique, the DFN fracture model can be used to predict the early water invasion of the fractured reservoirs in the Kuqa Depression. Particular focus is given to the fracture zone that connects the edge water and the gas well, and the numerical simulation research based on the DFN model is conducted. This approach enables accurate anticipation of the distribution characteristics of the remaining gas and facilitates analysis of the dynamic interplay between the gas and water phases. By adopting this comprehensive methodology, a deeper understanding of the gas reservoir behavior is achieved, resulting in precise predictions of gas and water distribution. Ultimately, this enhanced reservoir management approach ensures effective decision-making and resource optimization.
4.5 Model quality control
Ensuring the accuracy of a geological model requires quality control measures at every step of the modeling process. For instance, in the grid model, geometrical properties such as grid height and volume are made to eliminate negative grids. The structural model must be checked repeatedly to confirm consistency in the distribution trend between surfaces, faults, and raw structural data. In property models (facies, porosity, permeability, and gas saturation), consistency is confirmed by comparing the distribution trends of logging data, upscaling data, and model data, as well as creating property distribution maps and reservoir profiles. Due to limited wells and rapid development, validation through wells decimation is generally not feasible. Instead, the model is primarily checked and corrected by drilling new development wells at later stages. The fracture model can be validated with performance data during the modeling process and tested with newly monitored performance data. Upon importing the 3D geological model into the numerical model, the model’s accuracy is evaluated through the first history matching rate analysis. The first history matching rate refers to the coincidence rate obtained from the history matching of well pressure, gas production, and other parameters without adjusting any performance and model parameters. If the first history matching rate reaches 60% or more, the geological model is typically considered accurate.
The 3D geological model built in this study includes no negative grids, and the distribution trends of logging data, upscaling data, and model data are consistent overall. The distribution characteristics of model properties also align with previous geological understanding. With a first-history matching rate of 75% for well pressure and 100% for gas production, the established 3D geological model is confirmed to be both accurate and credible.
5 Discussion
The application of the 3D geological modeling technique has been successful in many deep fractured low porosity sandstone gas reservoirs in the Kuqa Depression of Tarim Basin, including Keshen 2, Keshen 8, Dabei201, Dabei 9, Bozi 1, and Bozi 3. Four key techniques were used to address the challenges in modeling the structure, facies, reservoir petrophysics, and fractures. When considering the reservoir attributes surrounding a well, inter-well prediction necessitates the creation of numerous well-connected correlation profiles. However, this process is both time-consuming and labor-intensive, and inter-well reservoir attribute prediction is often considered subjective. Although seismic data can provide valuable insights into the distribution of sandbodies and gas-bearing characteristics in the study area, its resolution typically exceeds 50 m, making it insufficient for a detailed reservoir description. In contrast, 3D geological modeling integrates logging, seismic, and other data, offering significant advantages over traditional reservoir characterization methods. It allows for reservoir characterization accuracy at sub-meter levels, enabling precise reservoir description. Additionally, random mathematical methods can be employed to predict cross-well attributes, guided by geostatistical statistical outcomes and geological understanding. This approach offers distinct advantages, including high accuracy, reduced human influence factors, and efficient processing speed. 3D geological models are consistent with the actual structural characteristics, which provide the model basis for enhancing gas recovery.
By using the four key techniques, a favorable development area was predicted, and it supported the deployment of more than 60 wells. The favorable development formation was evaluated, and it supported the perforation and fracturing designs. Based on the structural model, facies model, reservoir petrophysical model, and fracture model, numerical simulation was used to predict and optimize the reasonable development index. Factors such as well production allocation, gas recovery rate, and well numbers directly affect gas recovery. According to the production performance, well-controlled dynamic reserves, and numerical simulation results, it is suggested that the reasonable gas recovery rate of the Kuqa reservoir should be controlled below 2%, and the reasonable well production allocation should be 10–50 × 104 cubic meters per day. The application of this technique has enhanced the gas recovery by 6%–15% over a 30-year development period, demonstrating the significant potential for wider implementation across other reservoirs.
6 Conclusion
Aiming to address the challenges posed by the tight matrix, developed fracture, and strong reservoir heterogeneity of the Kuqa reservoir, a 3D geological modeling approach for deep fractured low porosity sandstone gas reservoirs was developed, utilizing geological and performance data. Compared with the traditional geological modeling method, this method requires fewer data and provides better systematicness and strong pertinence. As a result, it is highly effective at addressing modeling challenges associated with limited well numbers and poor-quality seismic data. This method includes four key techniques: 1) Structural modeling using well-to-seismic ties, 2) facies modeling utilizing stochastic objects, 3) reservoir petrophysical modeling under facies constraints, and 4) fracture modeling under multiple-condition constraints and static-performance data combination.
“Structural modeling under well-to-seismic ties” is used to address the issue of inaccurate structural models caused by deep burial and poor seismic data. “Facies modeling under stochastic objects” is used to address the challenge of strong reservoir heterogeneity, a small number of wells, and complex sedimentary geometry. “Reservoir petrophysical modeling under facies constraints” is employed to resolve the petrophysical problem arising from large well spacing and the need for accurate prediction between wells. Finally, “Fracture modeling under multi-condition constraints and static-performance data combined” is applied to tackle the challenge of predicting fractures accurately despite poor seismic data.
The application of 3D geological modeling has proven to be effective in the Kuqa Depression of the Tarim Basin. The built models support the adjustment of the reservoir development index and are expected to enhance the gas recovery by 6%–15% at the end of the development period. This technique has a strong theoretical basis and systematic approach, which effectively addresses the challenge of modeling deep-fractured low-porosity sandstone gas reservoirs. Moreover, this technique is user-friendly and can provide guidance and support for modeling work. As such, it has the potential to be widely adopted in other gas reservoirs.
Data availability statement
The original contributions presented in the study are included in the article/supplementary material, further inquiries can be directed to the corresponding author.
Author contributions
All authors listed have made a substantial, direct, and intellectual contribution to the work and approved it for publication.
Funding
This research was funded by the Technology and Engineering Project of PetroChina Company Limited, “Research on Efficient Development Technology for Deep or Ultra-deep Gas Reservoir (2022KT0704)”, and “Pilot Test for Safe and Efficient Development of Ultra-deep Fractured Sandstone Gas Reservoir (2022KT0702)”. The funder was not involved in the study design, collection, analysis, interpretation of data, the writing of this article or the decision to submit it for publication.
Conflict of interest
The authors ZL, ZG, YZ, BC and WH were employed by PetroChina Research Institute of Petroleum Exploration and Development. Authors DC, YW, KF, PZ, and CH were employed by Tarim Oilfield Company.
Publisher’s note
All claims expressed in this article are solely those of the authors and do not necessarily represent those of their affiliated organizations, or those of the publisher, the editors and the reviewers. Any product that may be evaluated in this article, or claim that may be made by its manufacturer, is not guaranteed or endorsed by the publisher.
References
Almedallah, M. K., Al Mudhafar, A. A., Clark, S., and Walsh, S. D. C. (2021). Vector-based three-dimensional (3D) well-path optimization assisted by geological modelling and borehole-log extraction. Upstream Oil Gas Technol. 7, 100053–100114. doi:10.1016/j.upstre.2021.100053
Azim, R. A. (2021). Estimation of fracture network properties from FMI and conventional well logs data using artificial neural network. Upstream Oil Gas Technol. 7, 100044–100116. doi:10.1016/j.upstre.2021.100044
Benedetto, M. F., Berrone, S., Pieraccini, S., and Scialò, S. (2014). The virtual element method for discrete fracture network simulations. Comput. Methods Appl. Mech. Eng. 280, 135–156. doi:10.1016/j.cma.2014.07.016
Berrone, S., and Raeli, A. (2022). Efficient partitioning of conforming virtual element discretizations for large scale discrete fracture network flow parallel solvers. Eng. Geol. 306, 106747–106816. doi:10.1016/j.enggeo.2022.106747
Calcagno, P., Bouchot, V., Thinon, I., and Bourgine, B. (2012). A new 3D fault model of the bouillante geothermal province combining onshore and offshore structural knowledge (French west indies). Tectonophysics 529, 185–195. doi:10.1016/j.tecto.2011.08.012
Calcagno, P., Chilès, J. P., Courrioux, G., and Guillen, A. (2008). Geological modelling from field data and geological knowledge. Phys. Earth Planet. Interiors 171, 147–157. doi:10.1016/j.pepi.2008.06.013
Ceccato, A., Viola, G., Antonellini, M., Tartaglia, G., and Ryan, E. J. (2021). Constraints upon fault zone properties by combined structural analysis of virtual outcrop models and discrete fracture network modelling. J. Struct. Geol. 152, 104444–104518. doi:10.1016/j.jsg.2021.104444
Chen, G. B., Li, T., Yang, L., Zhang, G. H., Li, J. W., and Dong, H. J. (2021). Mechanical properties and failure mechanism of combined bodies with different coal-rock ratios and combinations. J. Min. Strata Control Eng. 3, 023522. doi:10.13532/j.jmsce.cn10-1638/td.20210108.001
Chen, Z., Li, Q., Liu, M., Song, B., Cao, M., and Wang, M. (2021). Uranium mineralization formed through multi-stage superposition: Case of the Qianjiadian deposit in Songliao Basin, China. Energy Geosci. 2, 32–40. doi:10.1016/j.engeos.2020.07.004
Correia, M. G., Maschio, C., Schiozer, D. J., and Santosdos, M. S. (2014). Upscaling approach for meso-scale heterogeneities in naturally fractured carbonate reservoirs. J. Petroleum Sci. Eng. 115, 90–101. doi:10.1016/j.petrol.2014.01.008
Falivene, O., Arbués, P., Howell, J., Muñoz, J. A., Fernández, O., and Marzo, M. (2006). Hierarchical geocellular facies modelling of a turbidite reservoir analogue from the eocene of the ainsa basin, NE Spain. Mar. Petroleum Geol. 23, 679–701. doi:10.1016/j.marpetgeo.2006.05.004
Ferrer, R., Emery, X., Maleki, M., and Navarro, F. (2021). Modeling the uncertainty in the layout of geological units by implicit boundary simulation accounting for a preexisting interpretive geological model. Nat. Resour. Res. 30, 4123–4145. doi:10.1007/s11053-021-09964-9
Giraud, J., Ogarko, V., Martin, R., Jessell, M., and Lindsay, M. (2021). Structural, petrophysical, and geological constraints in potential field inversion using the tomofast-x v1.0 open-source code. Geosci. Model Dev. 14, 6681–6709. doi:10.5194/gmd-14-6681-2021
Grose, L., Ailleres, L., and Laurent, G. (2019). Integrating Fault kinematics into implicit 3D modelling of fault networks. ASEG Ext. Abstr. 2019, 1–3. doi:10.1080/22020586.2019.12072997
Gu, J., Fang, H., and Jia, J. (2001). Diagenesis and reservoir characteristics of cretaceous braided delta sandbody in Kuqa depression, Tarim Basin. Acta Sedimentol. Sin. 19, 517–523. doi:10.3969/j.issn.1000-0550.2001.04.007
Guo, Z., Sun, L., Jia, A., and Lu, T. (2015). 3-D geological modeling for tight sand gas reservoir of braided river facies. Petroleum Explor. Dev. 42, 83–91. doi:10.1016/s1876-3804(15)60009-x
Hillier, M., Wellmann, F., Brodaric, B., de Kemp, E., and Schetselaar, E. (2021). Three-dimensional structural geological modeling using graph neural networks. Math. Geosci. 53, 1725–1749. doi:10.1007/s11004-021-09945-x
Høyer, A.-S., Jørgensen, F., Foged, N., He, X., and Christiansen, A. V. (2015). Three-dimensional geological modelling of aem resistivity data - a comparison of three methods. J. Appl. Geophys. 115, 65–78. doi:10.1016/j.jappgeo.2015.02.005
Hu, Y., Yu, X., Li, S., Chen, G., Zhou, Y., and Gao, Z. (2014). Improving the accuracy of geological model by using seismic forward and inversion techniques. Petroleum Explor. Dev. 41, 190–197. doi:10.11698/PED.2014.02.08
Hyman, J. D., Karra, S., Makedonska, N., Gable, C. W., Painter, S. L., and Viswanathan, H. S. (2015). DFNWorks: A discrete fracture network framework for modeling subsurface flow and transport. Comput. Geosciences 84, 10–19. doi:10.1016/j.cageo.2015.08.001
Irakarama, M., Laurent, G., Renaudeau, J., and Caumon, G. (2021). Finite difference implicit structural modeling of geological structures. Math. Geosci. 53, 785–808. doi:10.1007/s11004-020-09887-w
Jia, A., Guo, J., and He, D. (2007). Perspective of development in detailed reservoir description. Petroleum Explor. Dev. 34, 691–695. doi:10.3321/j.issn:1000-0747.2007.06.010
Jørgensen, F., Høyer, A. S., Sandersen, P. B., He, X., and Foged, N. (2015). Combining 3D geological modelling techniques to address variations in geology, data type and density - an example from southern Denmark. Comput. Geosciences 81, 53–63. doi:10.1016/j.cageo.2015.04.010
Lai, J., Han, N., Jia, Y., Ji, Y., Wanf, G., Pang, X., et al. (2018). Detailed description of the sedimentary reservoir of a braided delta based on well logs. Geol. China 45, 304–318. doi:10.12029/gc20180207
Lan, S. R., Song, D. Z., Li, Z. L., and Liu, Y. (2021). Experimental study on acoustic emission characteristics of fault slip process based on damage factor. J. Min. Strata Control Eng. 3, 033024. doi:10.13532/j.jmsce.cn10-1638/td.20210510.002
Laudadio, A. B., Schetselaar, E. M., Mungall, J. E., and Houlé, M. G. (2022). 3D modeling of the esker intrusive complex, ring of fire intrusive suite, mcfaulds lake greenstone belt, superior province: Implications for mineral exploration. Ore Geol. Rev. 145, 104886–104923. doi:10.1016/j.oregeorev.2022.104886
Li, J., Liu, Y., and Wu, K. (2022). A new higher order displacement discontinuity method based on the joint element for analysis of close-spacing planar fractures. SPE J. 27, 1123–1139. doi:10.2118/208614-PA
Li, J., and Wu, K. (2022). An efficient model for hydraulic fracture height growth considering the effect of bedding layers in unconventional shale formations. SPE J. 27, 3740–3756. doi:10.2118/210572-PA
Li, Q., Zhang, L., Cao, D., Dong, Q., Cui, Y., and Chen, C. (2016). Usage, status, problems, trends and suggestions of 3D geological modeling. Geol. Prospect. 52, 759–767. doi:10.13712/j.cnki.dzykt.2016.04.018
Linsel, A., Wiesler, S., Haas, J., Bär, K., and Hinderer, M. (2020). Accounting for local geological variability in sequential simulations-concept and application. IJGI 9, 409–423. doi:10.3390/ijgi9060409
Liu, J., Mei, L., Ding, W., Xu, K., Yang, H., and Liu, Y. (2023). Asymmetric propagation mechanism of hydraulic fracture networks in continental reservoirs. GSA Bull. 135, 678–688. doi:10.1130/B36358.1
Liu, J., Yang, H., Xu, K., Wang, Z., Liu, X., Cui, L., et al. (2022). Genetic mechanism of transfer zones in rift basins: Insights from geomechanical models. GSA Bull. 134, 2436–2452. doi:10.1130/B36151.1
Liu, Y., Xia, H., Sun, Q., Lin, C., Zhao, H., Li, H., et al. (2019). Sequence stratigraphy and depositional evolution of the bashijiqike formation in the western tabei uplift, Tarim Basin. Nat. Gas. Geosci. 30, 62–73. doi:10.11764/j.issn.1672-1926.2018.10.003
Liu, Y., Zhang, W., Duan, T., Lian, P., Li, M., and Zhao, H. (2021a). Progress of deep learning in oil and gas reservoir geological modeling. Bull. Geol. Sci. Technol. 40, 235–241. doi:10.19509/j.cnki.dzkq.2021.0417
Liu, Z., Zhang, Y., Liu, H., Lv, Z., and Huang, W. (2021b). Analysis of gas well classifications and productivity influencing factors in kela-2 gas field. CT&F - Cienc. Tecnol. Futuro 11, 63–70. doi:10.29047/01225383.382
Liu, Z., Zhang, Y., Zhang, Y., Zhao, L., Peng, P., Liu, H., et al. (2022). Influencing factor analysis on the fractured tight sandstone gas reservoir characteristics: A case study of Bozi 3 gas reservoir in the Tarim Basin. Front. Earth Sci. 10. doi:10.3389/feart.2022.881934
Lopes, J. A. G., Medeiros, W. E., La Bruna, V., de Lima, A., Bezerra, F. H. R., and Schiozer, D. J. (2022). Advancements towards DFKN modelling: Incorporating fracture enlargement resulting from karstic dissolution in discrete fracture networks. J. Petroleum Sci. Eng. 209, 109944–110018. doi:10.1016/j.petrol.2021.109944
Marquer, D., Calcagno, P., Barfety, J.-C., and Baudin, T. (2006). 3D modeling and kinematics of the external zone of the French western alps (belledonne and grand châtelard massifs, maurienne valley, savoie). Eclogae Geol. Helv. 99, 211–222. doi:10.1007/s00015-006-1183-z
Pakyuz-Charrier, E., Giraud, J., Lindsay, M., and Jessell, M. (2018a). Common uncertainty research explorer uncertainty estimation in geological 3D modelling. ASEG Ext. Abstr. 2018, 1–6. doi:10.1071/ASEG2018abW10_2D
Pakyuz-Charrier, E., Jessell, M., Giraud, J., Lindsay, M., and Ogarko, V. (2019). Topological analysis in Monte Carlo simulation for uncertainty estimation. Solid earth. 10, 1663–1684. doi:10.5194/se-2019-78
Pakyuz-Charrier, E., Lindsay, M., Ogarko, V., Giraud, J., and Jessell, M. (2018b). Monte Carlo simulation for uncertainty estimation on structural data in implicit 3-D geological modeling, a guide for disturbance distribution selection and parameterization. Solid earth. 9, 385–402. doi:10.5194/se-9-385-2018
Pan, R., Zhu, X., Liu, F., Li, Y., Ma, Y., Di, H., et al. (2013). Sedimentary characteristics of braided delta and relationship to reservoirs in the cretaceous of kelasu tectonic zone in Kuqa depression, xinjiang. J. Palaeogeogr. 15, 707–716. doi:10.7605/gdlxb.2013.05.058
Pellerin, J., Lévy, B., Caumon, G., and Botella, A. (2014). Automatic surface remeshing of 3D structural models at specified resolution: A method based on voronoi diagrams. Comput. Geosciences 62, 103–116. doi:10.1016/j.cageo.2013.09.008
Qiu, Y., and Jia, A. (2000). Development of geological reservoir modeling in past decade. Acta Pet. Sin. 21, 101–104. doi:10.3321/j.issn:0253-2697.2000.04.019
Schneeberger, R., de La Varga, M., Egli, D., Berger, A., Kober, F., Wellmann, F., et al. (2017). Methods and uncertainty estimations of 3-D structural modelling in crystalline rocks: A case study. Solid earth. 8, 987–1002. doi:10.5194/se-8-987-2017
Shi, C., and Wang, Y. (2022). Data-driven construction of three-dimensional subsurface geological models from limited site-specific boreholes and prior geological knowledge for underground digital twin. Tunn. Undergr. Space Technol. 126, 104493–104516. doi:10.1016/j.tust.2022.104493
Snyder, D. B., Schetselaar, E., Pilkington, M., and Schaeffer, A. J. (2018). Resolution and uncertainty in lithospheric 3-D geological models. Min. Pet. 112, 133–147. doi:10.1007/s00710-018-0619-2
Ursegov, S. O., Zakharian, A. Z., and Serkova, V. I. (2021). Adaptive geological modelling and its application for petroleum reservoir conditions. Earth Sci. 666, 022065–022067. doi:10.1088/1755-1315/666/2/022065
Ursegov, S., Zakharian, A., and Serkova, V. (2018a). Geological modeling of reservoir systems-an adaptive concept. Netherlands: European Association of Geoscientists and Engineers, 1–9. doi:10.3997/2214-4609.201802191
Ursegov, S., Zakharian, A., and Taraskin, E. (2018b). Full field unconventional carbonate reservoir modelling using adaptive simulation technique. Netherlands: European Association of Geoscientists and Engineers, 1–5. doi:10.3997/2214-4609.201800837
Varga, M. de la, and Wellmann, J. F. (2016). Structural geologic modeling as an inference problem: A bayesian perspective. Interpretation 4, SM1–SM16. SM1–SM16. doi:10.1190/INT-2015-0188.1
Wang, D., Hao, B., and Liang, X. (2021). Slurry diffusion of single fracture based on fluid-solid coupling. J. Min. Strata Control Eng. 3, 013038. doi:10.13532/j.jmsce.cn10-1638/td.20200429.001
Wellmann, F., and Caumon, G. (2018). “3-D structural geological models: Concepts, methods, and uncertainties,” in Advances in geophysics. Editor C. Schmelzbach (Berlin, Germany: Elsevier), 1–121. doi:10.1016/bs.agph.2018.09.001
Wellmann, J. F., de la Varga, M., Murdie, R. E., Gessner, K., and Jessell, M. (2018). Uncertainty estimation for a geological model of the sandstone greenstone belt, western Australia - insights from integrated geological and geophysical inversion in a bayesian inference framework. Geol. Soc. Lond. Spec. Publ. 453, 41–56. doi:10.1144/SP453.12
Wellmann, J. F., Lindsay, M., Poh, J., and Jessell, M. (2014). Validating 3-D structural models with geological knowledge for improved uncertainty evaluations. Energy Procedia 59, 374–381. doi:10.1016/j.egypro.2014.10.391
Weng, X., Kresse, O., Cohen, C., Wu, R., and Gu, H. (2011). Modeling of hydraulic-fracture-network propagation in a naturally fractured formation. SPE Prod. Operations 26, 368–380. doi:10.2118/140253-PA
Wu, Q., Xu, H., and Zou, X. (2005). An effective method for 3D geological modeling with multi-source data integration. Comput. Geosciences 31, 35–43. doi:10.1016/j.cageo.2004.09.005
Wu, S., and Li, Y. (2007). Reservoir modeling: Current situation and development prospect. Mar. Orig. Pet. Geol. 12, 53–60. doi:10.3969/j.issn.1672-9854.2007.03.009
Yan, L., Liu, Q., and Liu, X. (2022). Research on 3D geological modeling of fractured-vuggy carbonate reservoirs. Energy Rep. 8, 491–500. doi:10.1016/j.egyr.2022.03.052
Yong, H., Wenxiang, H., and Bincheng, G. (2020). Combining sedimentary forward modeling with sequential gauss simulation for fine prediction of tight sandstone reservoir. Mar. Petroleum Geol. 112, 104044–104115. doi:10.1016/j.marpetgeo.2019.104044
Yuan, H., Yin, S., Dong, L., and Tan, C. (2022). Restoration of the pre-jurassic paleogeomorphology and its control on hydrocarbon distribution in western ordos basin. Energy Geosci. 3, 485–494. doi:10.1016/j.engeos.2021.06.007
Zhan, X., Lu, C., and Hu, G. (2022). A formal representation of the semantics of structural geological models. Sci. Program. 2022, 1–18. doi:10.1155/2022/5553774
Zhang, R., Zhang, H., Shou, J., Shen, Y., and Li, C. (2008). Geological analysis on reservoir mechanism of the lower cretaceous bashijiqike formation in Dabei area of the Kuqa depression. Chin. J. Geol. 43, 507–517. doi:10.3321/j.issn:0563-5020.2008.03.006
Zhong, D., Wang, L. g., Bi, L., and Jia, M. t. (2019). Implicit modeling of complex orebody with constraints of geological rules. Trans. Nonferrous Mater. Soc. China 29, 2392–2399. doi:10.1016/S1003-6326(19)65145-9
Zhou, Y., Zuo, R., Liu, G., Yuan, F., Mao, X., Guo, Y., et al. (2021). The great-leap-forward development of mathematical geoscience during 2010-2019: Big data and artificial intelligence algorithm are changing mathematical geoscience. Bull. Mineralogy, Petrology Geochem. 40, 556–573. doi:10.19658/j.issn.1007-2802.2021.40.038
Keywords: fractured gas reservoir, 3D geological modeling, fracture modeling, Tarim Basin, Kuqa Depression
Citation: Liu Z, Chen D, Gao Z, Wu Y, Zhang Y, Fan K, Chang B, Zhou P, Huang W and Hu C (2023) 3D geological modeling of deep fractured low porosity sandstone gas reservoir in the Kuqa Depression, Tarim Basin. Front. Earth Sci. 11:1171050. doi: 10.3389/feart.2023.1171050
Received: 21 February 2023; Accepted: 06 June 2023;
Published: 20 June 2023.
Edited by:
Shuai Yin, Xi’an Shiyou University, ChinaReviewed by:
Zhenwei Guo, Central South University, ChinaJianwei Feng, China University of Petroleum (East China), China
Jingshou Liu, China University of Geosciences Wuhan, China
Jiawei Li, Texas A&M University, United States
Copyright © 2023 Liu, Chen, Gao, Wu, Zhang, Fan, Chang, Zhou, Huang and Hu. This is an open-access article distributed under the terms of the Creative Commons Attribution License (CC BY). The use, distribution or reproduction in other forums is permitted, provided the original author(s) and the copyright owner(s) are credited and that the original publication in this journal is cited, in accordance with accepted academic practice. No use, distribution or reproduction is permitted which does not comply with these terms.
*Correspondence: Zhaolong Liu, bGl1emhhb2w2OUBwZXRyb2NoaW5hLmNvbS5jbg==