 Xiancheng Mao1,2
 Miao Tang
- 1Key Laboratory of Metallogenic Prediction of Nonferrous Metals and Geological Environment Monitoring, Ministry of Education, School of Geosciences and Info-Physics, Central South University, Changsha, China
- 2Hunan Key Laboratory of Nonferrous Resources and Geological Hazards Detection, Changsha, China
- 3School of Municipal and Geomatics Engineering, Hunan City University, Yiyang, China
Mesozoic orogenic gold deposits in the Jiaojia goldfield, Eastern China show the features of regular mineralization spatial distribution and have long been captivated the attention of geologists. This study integrates 3D modeling, model space analysis, and association rule analysis to extract the relationship between structural deformation and gold mineralization. The Apriori algorithm with spatial constraints is used to quantify the favorable mineralization sites in the Jiaojia gold field using different combinations of ore-controlling indicators. The first favorable mineralization site has a 44% probability of mineralization and is primarily located in segments of the fault footwall within 25 m of the fault buffer where the transition from steep to gentle occurs (∼1–24). Its uniform distribution indicates that the ore-bearing space near the main fault plane is relatively wide, and hydrothermal diffusion is relatively uniform. Site No. 2 has a 45% probability of mineralization and is located in convex segments (6–35 m) between 25 and 55 m of the fault footwall. The equidistant zonal distribution in this area indicates that secondary faults and fractures have facilitated the migration of hydrothermal fluids, resulting in the formation of extensive ore-bearing spaces. Site No. 3 sited in convex segments (∼0–6 m) distal to the fault footwall (∼55–515 m) of the fault buffer where the dip is gentle (∼30°–35°). The binary structure of differing dips formed by the intersection of steeply dipping orebodies and the slowly dipping orebodies in the central and southern parts of the Nanlü-Xinmu deposit exhibit the complex channel away from the main fault. In this study, the correlation between ore-controlling factors and mineralization in Jiaojia fold field is quantitatively expressed as favorable mineralization sites in the form of association rules, it would contribute to a deeper understanding of the underlying mechanisms governing the formation of structure-controlled orogenic gold deposits in the Jiaojia goldfield.
Introduction
The Jiaodong Peninsula with >5,000 tons gold is the largest gold province in China, with world-class goldfields such as Jiaojia goldfield and Linglong goldfield (Yang et al., 2014; Li et al., 2017). Several fundamental issues about ore formation have investigated that ore-bearing hydrothermal fluids were interprecipitated from depth along the regional tectonics (Richard et al., 2014; Li et al., 2015; Song et al., 2015; Li et al., 2017; Sun et al., 2022). However, these qualitative empirical models cannot quantitatively express the controlling effect of mineralization structures on mineral body form and spatial distribution. This limitation hinders a deeper understanding of the Jiaodong-type orogenic gold deposit. Therefore, a method is needed to quantitatively analyze and express the spatial linkage between metallogenic information and mineralization and to upgrade the understanding from a qualitative to a quantitative degree.
Three-dimensional spatial analysis can effectively identify useful spatial information associated with mineralization (Li et al., 2016; Hu et al., 2018; Qin and Liu, 2018; Zhang et al., 2019), such as distance and morphological features. However, with the expansion of spatial geological features—distance, morphological features, geophysical features and geochemical features—the spatial correlation between them and mineralization becomes increasingly complex (Lindsay et al., 2012; Jessell et al., 2014; Liu et al., 2016; Xiao and Wangm, 2017; Xiao et al., 2018). We need to use methods such as association rule analysis to analyze these complex spatial relationships.
The Apriori algorithm is a classic association rule analysis method widely used in data mining, which can discover the dependencies or connections between different things hidden behind the data (Agrawal and Srikant, 1994; Agrawal and Shafer, 1996; Bayardo and Agrawal, 1999). It has many advantages (Yu et al., 2008), including not requiring prior knowledge, being easy to implement and use, and quickly processing large amounts of data. Chang et al. (2018) analyzed the relationship between associated minerals and intrusive rocks in hydrothermal gold deposits by adding the closest different types of minerals as attributes of the gold deposit. Liu et al. (2019) only considered whether they were located in the same administrative division when extracting the relationship between the symbiosis and mineral association in some areas of western China. However, they ignored lots of spatial distribution characteristics, which may lead to results that are inconsistent with the actual geological situation. Therefore, integrating geological background constraints into the Apriori algorithm is necessary to improve the reliability and accuracy of the analysis.
In this study, we used a multi-constraint explicit modeling approach (Mao et al., 2020a) to integrate multi-source data and construct a 3D geological model of the Jiaojia fault and mineralization in the study area. Based on the mineralization conceptual model, various spatial analyses were used to quantitatively extract structural features related to mineralization (Mao et al., 2019; Mao et al., 2020b; Chen et al., 2020). Subsequently, the association rule analysis method with spatial constraints was used to mine the association relationship between ore-controlling indicators and mineralized enrichment areas. By using regional metallogenic consensus and prior knowledge of mineralization distribution as spatial constraints, this approach effectively filtered the analysis results of the Apriori algorithm and revealed favorable mineralization sites that quantitatively express the geological structure’s ore-controlling effect in the Jiaojia goldfield. This work contributes to our understanding of geological structure’s controlling effect on the shape and spatial distribution of ore bodies in the Jiaojia goldfield and provides valuable data support for inducing and summarizing the metallogenic patterns and metallogenic theories of Jiaodong-type orogenic gold deposit.
Geological background
Regional geology
The northwestern Jiaodong peninsula is located at the southeast edge of the North China Craton (Figure 1). The three regional detachment faults in the area—the Sanshandao fault, the Jiaojia fault, and the Zhaoping fault—are the main pathways for ore-forming hydrothermal fluid migration, and also control the spatial location, shape, and scale of orebodies (Zeng et al., 2001; Goldfarb and Santosh, 2014). They control more than 80% of the gold reserves in the Jiaodong peninsula (Wang et al., 2019), and the change of fault occurrence has a direct impact on the enrichment of gold mineralization (Ding et al., 2015; Lv et al., 2017).
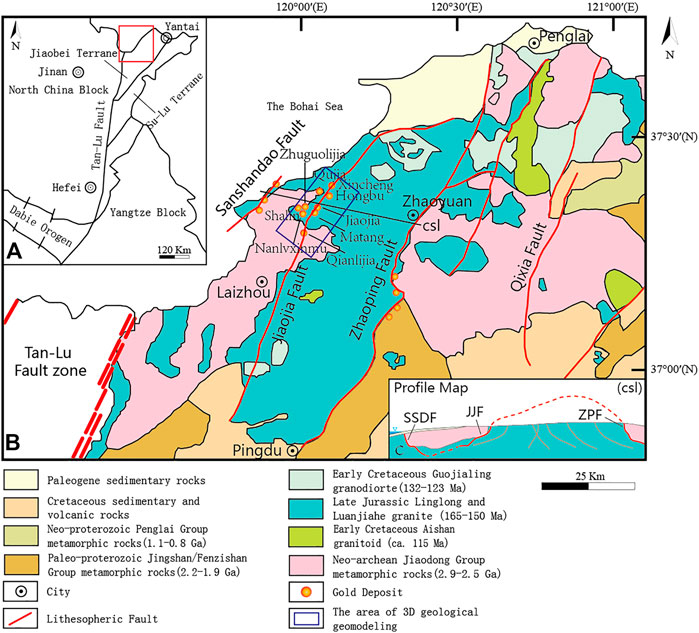
FIGURE 1. Geological background map of Jiaojia goldfield. (A) Schematic map showing the position of the Northwestern Jiaodong Peninsula; (B) Simplified geologic map of the Northwestern Jiaodong Peninsula; (C) CSL profile (Song et al., 2015; Yang et al., 2016).
The geological background of gold mineralization in the northwestern Jiaodong Peninsula is composed of a metamorphic basement, mesozoic multi-phase magmatic-hydrothermal activity, and NE-NNE-oriented regional fracture tectonic pattern (Yin, 2020). This region has experienced multiple phases of tectonic movements, characterized by the development of fracture tectonics. And the formation of gold ore in the region is highly related to tectonic thermal events. Fracture tectonic has a controlling effect on the migration, aggregation, and precipitation of mineral-bearing hydrothermal fluids, and also influences the physical and chemical conditions during mineralization, which is an important influencing factor of the gold mineralization process in the area (Deng, 1992).
The Jiaojia fault is located in the middle of the northwestern Jiaodong Peninsula. It strikes NE and dips to NW with a dip angle of 30°–50°, and is curved in an “S” shape. The different sections of the Jiaojia fault have different outcropping widths. The southern section is developed in the contact zone between the Linglong pluton and the Jiaodong Group, and the northern section is developed in the contact zone between the Guojialing pluton and the Linglong pluton. The Jiaojia fault is marked by fault gouge and distributed along the middle of the fracture zone. The alteration zone is composed of pyrite-sericite rock and pyrite-sericite cataclastic rock.
Metallogenic model
The Jiaodong-type orogenic gold deposit is a typical deposit type in the northwestern Jiaodong Peninsula, mainly distributed in the Sanshandao goldfield, the Jiaojia goldfield, and the Dayingezhuang goldfield. These sorts of gold deposits were controlled by regional fault structures, and the main orebodies were often found along the main fault’s footwall. The ore types mainly include disseminated pyrite sericite, veinlet disseminated pyrite-seritized granitic cataclasite and veinlet disseminated pyrite-seritized granite.
The detailed regularity of gold mineralization in the Jiaojia goldfield has been summarized as follows:
(1) Gold mineralization zones are controlled by the Jiaojia fault, and the main orebodies were distributed along the main fracture surface of the Jiaojia fault, which is trapped by continuous and stable fault gouge.
(2) The shape of the orebody is associated with the fault and its shape characteristics, and the greatest thickness and grade parts are often found in the areas where the dip angle of the fault changes gently.
(3) Veinlet- and disseminated-style gold mineralization, network vein type gold mineralization and quartz vein type gold mineralization can all exist in the same deposit, they are controlled by the same extensional structure in different tectonic positions.
Datasets
The Shandong Institute of Geological Survey, located in China, contributed the majority of the comprehensive geological data used in this study. These data included a 1:10,000 scale surface geological map, several other scale surface geological maps, 364 1:500, 1:1,000, or 1:2,000 cross-sections, 249 drill holes with a maximum depth of −2000 m, 41 CSAMT sections, and 11 structural superimposed halo research sections. They also covered several significant gold deposits in the Jiaojia goldfield. The study focused primarily on the known areas between 200 m above sea level and 1500 m below sea level, where there is sufficient knowledge of geological features to refer to, while geophysical techniques were employed to explore the deep unknown region below 1500 m.
Materials and methods
Geological investigations of the Jiaojia goldfield provided a fact-based foundation for the development of a gold mineralization model. Empirical models identified the primary exploration criteria (the Jiaojia fault and known orebodies) and their mineralization characteristics in three-dimensional space (Mao et al., 2009; Chen et al., 2012; Yuan et al., 2014). These ore-controlling factors were quantitatively extracted by spatial analysis and combined with the gold mineralization model to produce a 3D geological model, which was subjected to association rule analysis with spatial constraints to quantitatively extract favorable mineralization sites.
The favorable mineralization sites analysis of the Jiaojia goldfield includes three major steps (Figure 2): 1) Data collection and 3D geological modeling were performed to obtain a TIN model of the Jiaojia fault and a 3D blcok model incorporating mineralization indicators, namely, Au and AuMet. 2) 3D spatial analysis was utilized to quantify the ore-controlling factors with diverse characteristics and obtain precise ore-controlling indicators. 3) Association rule analysis was employed to extract the relationship between ore-controlling indicators and mineralization indicators, thereby generating quantitatively favorable mineralization sites.
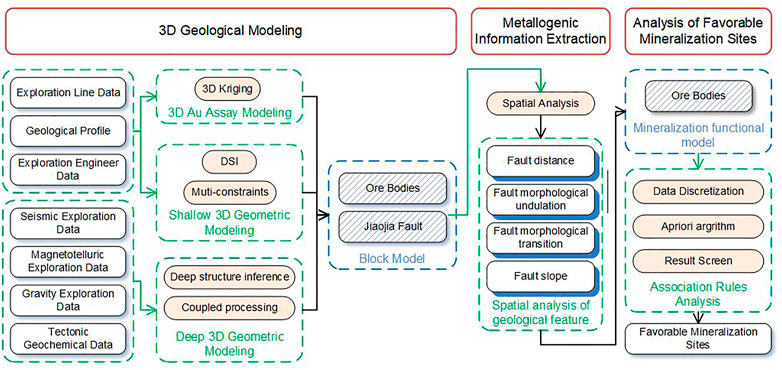
FIGURE 2. Workflow for favorable mineralization sites analysis of the Jiaojia goldfield.
3D geological modeling
Three-dimensional geological modeling was the basis for metallogenic information extraction and association rule analysis. Its quality depends heavily on the complexity of geological features, geological interpretation, and exploration data density (Liu et al., 2013; Stoch et al., 2018; Xiao et al., 2021). The 3D geological modeling methods are either implicit or explicit (Li et al., 2019). Explicit modeling can use rich geological interpretation information to constrain the model and thus make it more accurate, while implicit modeling does not need to utilize this information and has much less processing time. Thus explicit modeling is suitable for deposits with abundant geological data, while implicit modeling is more appropriate for areas with sparse geological data and insufficient geological understanding (Li et al., 2018; Li et al., 2019; Mao et al., 2020b). Since the Jiaojia goldfield has an extensive geological database containing comprehensive geological data and many academic geological interpretations, it is clearly more appropriate to use a data- and knowledge-driven explicit modeling approach.
The 3D geological models were built by the SKUA-GOCADTM software program (Version 2018; Emerson Paradigm Holding LLC, MO, United States), consisting of orebodies and the Jiaojia fault (Figure 3).
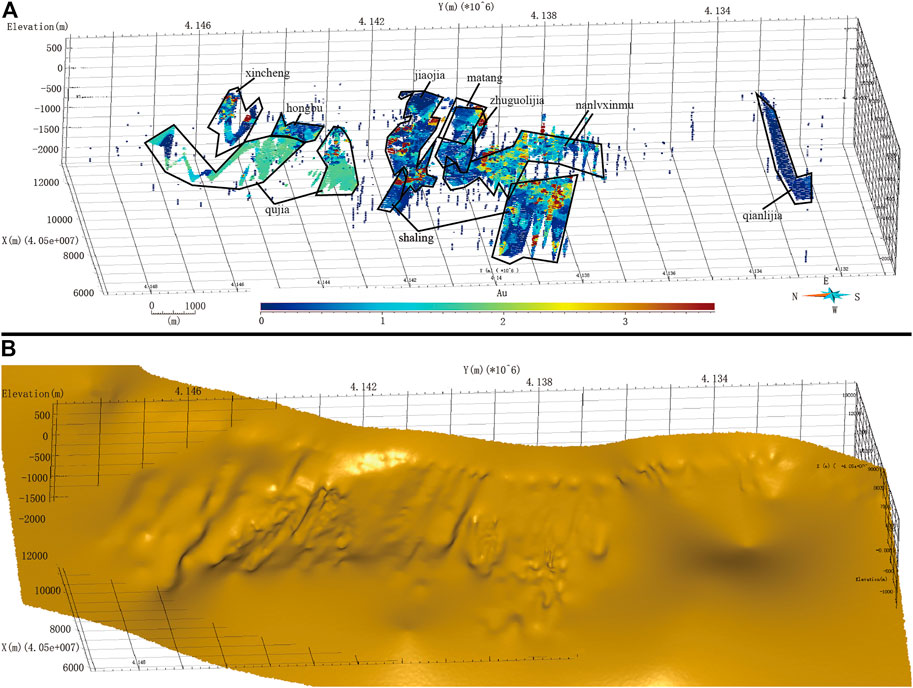
FIGURE 3. 3D geological model of the Jiaojia goldfield. (A) voxel model of orebodies; (B) TIN model of the Jiaojia fault.
Metallogenic information extraction
The shape and distribution of geological objects have matching and controlling effects on deposits or orebodies (Pei, 1998; Zhai, 2002; Zhao et al., 2002; Ma et al., 2004; Pei et al., 2011; Mao et al., 2011; Lebrun et al., 2017; Xiao et al., 2020a). Therefore, the morphological characteristics of geological bodies and geological structures are often used as ore-controlling factors (Xiao et al., 2014; Xiao et al., 2020b; Xiang et al., 2020).
In this study, we delve into the mineralization distribution within the Jiaojia goldfield using a 3D geological model. Based on the most related existing geological data and relevant geological knowledge, two- and three-dimensional spatial analysis was used to quantitatively extract and express ore-controlling factors (Mao et al., 2012; Mao et al., 2016). This transformation provides the necessary data support for the analysis of favorable mineralization sites.
Numerous studies of the Jiaodong-type orogenic gold deposits in the Jiaojia goldfield have revealed the significant impact of the Jiaojia fault on their distribution and morphological characteristics (Li et al., 2015; Song et al., 2015; Li et al., 2017; Lv et al., 2017; Hao, 2021). Table 1 presents a summary of the ore-controlling indexes in the Jiaojia goldfield.
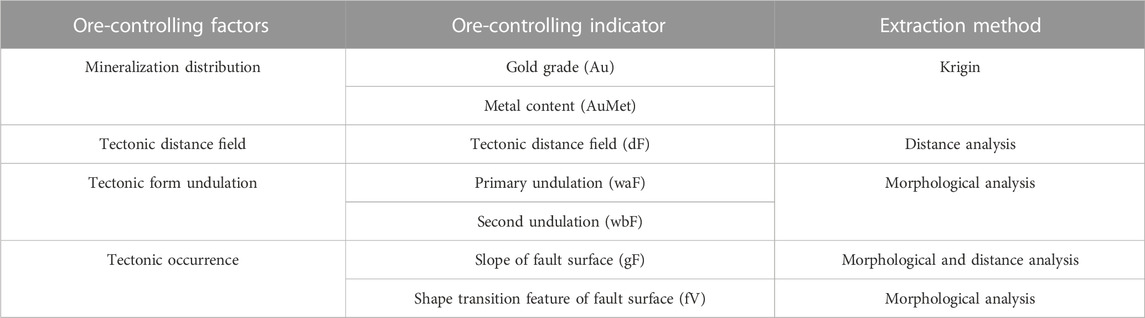
TABLE 1. Ore-controlling indexes.
Tectonic distance field
The Jiaodong-type orogenic gold deposit is characterized as a fault-controlled occurrence, with the main regional fracture zone and its accompanying secondary fractures and fissures serving as pathways for the migration of melts and hydrothermal fluids (Richard et al., 2014). The migration of hydrothermal fluids is impacted by the fracture stress field, the generation of fracture surfaces, and gravity, exhibiting a correlation between orebodies and their to the Jiaojia fault. To precisely depict this spatial relationship, the tectonic distance field (dF)—representing the minimum Euclidean distance from the voxel to the Jiaojia main fracture surface—is employed as the ore-controlling factor (Mao et al., 2019). A voxel with a dF value greater than 0 is located in the hanging wall of the fracture, while a voxel with a dF value less than 0 is situated in the footwall.
Primary and second undulation
The main morphology of the geological body tends to influence the spatial distribution of mineralization to some extent. In many cases, local morphology plays a decisive role in the accumulation and intensification of mineralization. The uplift and depression on continuous surfaces facilitate the aggregation of ore-bearing hydrothermal fluids, and the superposition of mineralization, and thus control the distribution of mineralization in space. To reveal the influence of fracture surface undulations, a quantitative representation of the degree of fracture surface undulations was required. The primary and secondary morphological filters were applied to the original TIN model of the Jiaojia fault, corresponding to the primary undulation (waF) and secondary undulation (wbF). The interpolation search range radii for the primary undulation and secondary undulation were 180 and 360 m, respectively (Chen et al., 2020). The results of this analysis can provide insights into the effect of topographical variations on mineralization patterns and provide a more comprehensive understanding of the mineralization process.
Slope
The three-dimensional morphology of the ore-controlling fracture affects the specific spatial positioning of the ore body, and the slope is one of the factors that is closely related to the spatial location of the ore body. The slope reflects the local occurrence changes of the fault. These variations reflect the stresses that caused the morphological changes and the microenvironment provided to the ore-forming process. In this study, a TIN model was constructed for the Jiaojia fault. The slope refers to the angle between the triangle and the horizontal plane in the model.
Shape transition feature
The local changes in the occurrence of the main fracture are likely to lead to abnormal migration of ore-forming fluids, which may react with the surrounding rocks to unload Au in the hydrothermal fluid. It reflected that the shape transition of the main fracture has a significant effect on mineralization. Therefore, we extract all the shape transition points in the approximate trend direction of the exploration line, calculate the intensity, and construct the geological field of the shape transition part of the Jiaojia fault to reflect this effect.
Association rules analysis
In the realm of data mining, association rules analysis is a regularly employed technique. It describes the process of identifying recurring patterns and associated relationships among elements or items in a collection (Moshkov et al., 2022). The frequent and trusted associated relationships are called association rules. An association rule is considered to be that if a dataset meets a condition
A classic approach for mining association rules between various attributes in an item set is the Apriori algorithm. As was previously said, only regular and reliable associations can be referred to as association rules. In the Apriori algorithm, support and confidence were defined to evaluate the effectiveness of association rules. Support is the frequency of a rule in the given dataset, while confidence is the frequency of items meeting the objective condition
Consider condition O (voxels' Au>1 g/t, AuMet>0 g/t) to be objective condition C1, and the combination of ore-controlling indexes (such as C={df ∈[xxx. xx, xxx. xx], waf ∈[xxx. xx, xxx. xx]}) to be presumptive condition C2. The support (
Support
The process of Apriori analysis is depicted in Figure 4 and is as follows: 1) Candidate itemset extraction and support/confidence calculation. 2) Pruning of candidate 1-itemset based on minimum support and confidence, eliminating items with values below the set threshold. 3) Generation of candidate two-itemset by combining 1-itemset pairs and calculation of their support and confidence. 4) Pruning of candidate two-item set based on minimum support and confidence, eliminating items with values below the set threshold. 5) Repeat steps 3 and 4, connecting and pruning itemsets iteratively, until the frequent K + 1 itemset cannot be found. The result of the algorithm is a set of frequent K-itemset.
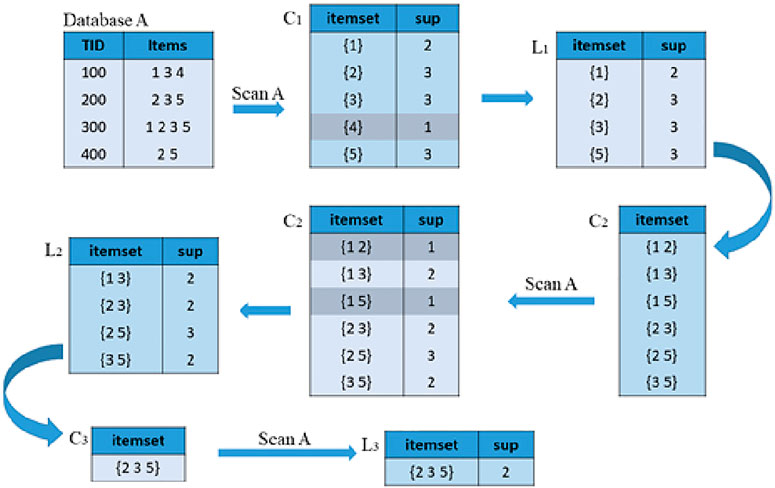
FIGURE 4. The workflow of the Apriori algorithm (Yue, 2004).
Results and discussion
Association among mineralization and structure features
The results of the mineralization information extraction indicate an imbalanced distribution of Average Au and AuMet within the study area. Significant mineralization enrichment intervals were identified for each ore-controlling index, with the majority of metal output in the study area being governed by these intervals. Notably, the mineralized intervals of dF and fV exhibit higher average Au values.
The aggregation of Au and each ore-controlling index in specific areas reflects a nonlinear relationship, which is expressed by the nonlinear Eqs 6.
OCI means ore-controlling index and OCI0 represents the corrected value of the ore-controlling index. When each ore-controlling index is applied to Eq. 6, the results (Table 2) show that the correction variables of ore-controlling index
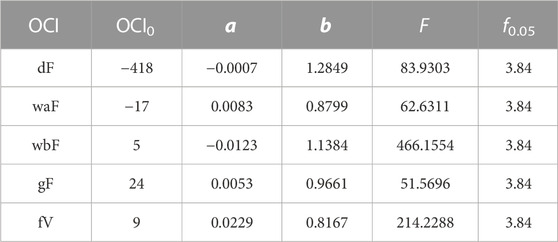
TABLE 2. Analysis results for au and ore-controlling indexes.
The main orebodies of the Jiaojia goldfield are concentrated in the dF (15 −100 m) interval (Figure 5A, B). This represents that the orebodies are primarily hosted in the pyrite-sericite cataclastic rock zone and the pyritic-sericite granitic cataclastic rock zone (Song et al., 2012), situated in close proximity to the fault’s footwall. It also shows that over 90% of the AuMet is enriched in this area, with an average Au content slightly higher than other intervals. The distribution of the orebodies highlights a strong spatial relationship between the mineralization and the main regional structure. The structure acts as a channel for the migration of ore-forming fluids (Yao et al., 1990; Yang et al., 2016). The fault gouge developed along the Jiaojia fault serves as a good impermeable layer, leading to the accumulation of mineralizing materials and the concentration of gold orebodies in the footwall of the Jiaojia fault. The dF (−400, −100 m) reveals the presence of small-scale, discontinuous orebodies located far from the footwall of the Jiaojia fault, which mainly occur in the pyritic-sericite granitic cataclastic rock zone and the pyritic-sericite granitic rock zone.
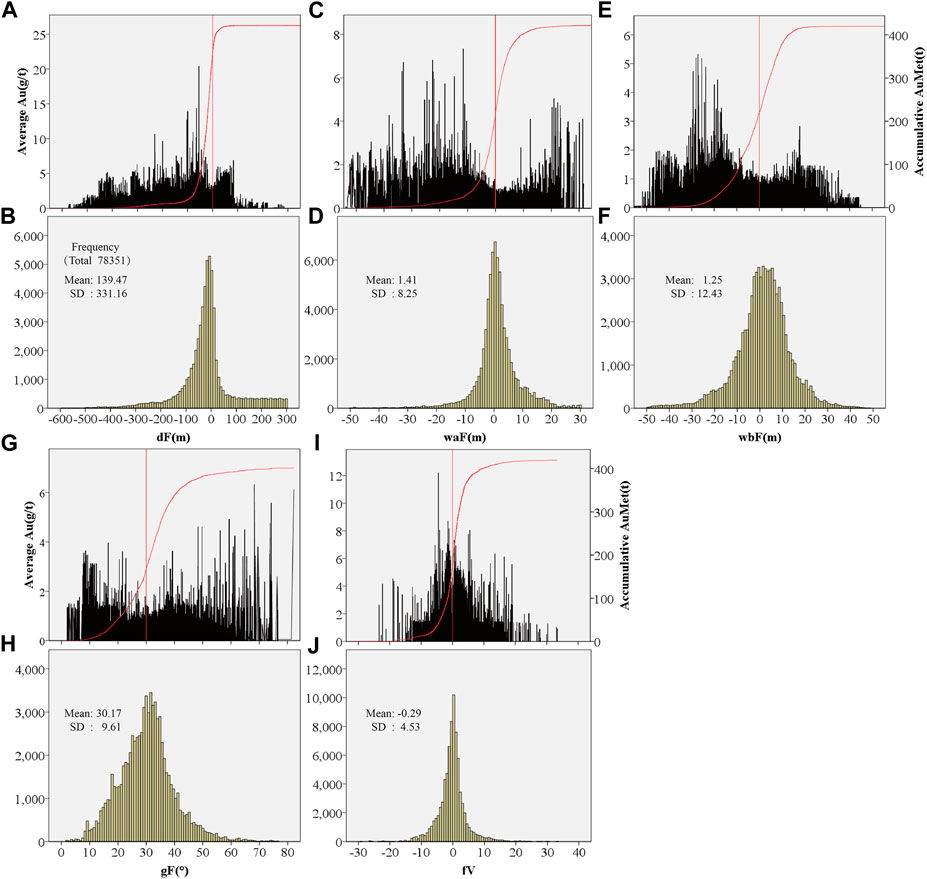
FIGURE 5. Bar charts of geological features and mineralization indexes and histogram of geological features. (A) dF vs. Average Au and AuMet; (B) histogram of dF; (C) waF vs. Average Au and AuMet; (D) histogram of waF; (E) wbF vs. Average Au and AuMet; (F) histogram of wbF; (G) gF vs. Average Au and AuMet; (H) histogram of gF; (I) fV vs. Average Au and AuMet; (J) histogram of fV; Average Au stands for the Average gold grade of all ore voxels in the same factor value, and AuMet is the gold resource summation of all ore voxels below the factor value.
The undulation characteristics of mineralization within the Jiaojia fault, obtained through analysis of different buffer sizes (waF, wbF), have been found to exhibit normal distributions with peaks at 0 m (Figures 5C–F). Results reveal that the mineralization output, controlled by the fault surface’s uplift and depression, is consistent throughout the fault zone, with mineralization occurring primarily in relatively continuous regions. While there are similarities in the distributions of waF and wbF, specific differences do exist, such as a more concentrated and compact distribution of waF in the (−10, 10) interval compared to wbF in the (−20, 20) interval. The average value of Au in the mineralized enrichment intervals of both distributions is relatively stable. Additionally, isolated voxels with high Au values were observed in the protruding parts of the uplift and depression on the fracture surface. However, these sporadic occurrences do not significantly impact the overall distribution of regional mineralization, as the number of voxels and AuMet are low.
The concentration of gF is observed in the range of (5°–60°) with a prominent peak at ∼30° (Figure 5G). A notable phenomenon is observed in the interval around 10°, where a higher distribution of Au and AuMet values is seen (Figure 5H). This interval encompasses deep ore bodies in the Jiaojia deposit below −1000 m, southern ore bodies in the Qujia deposit, and southern ore bodies in the Shaling deposit. The Jiaojia fault exhibits a slowing inclination angle and increasing top pressure in this interval, creating ideal conditions for sedimentation and mineralization. The migration of ore-forming fluid from deep within the Earth is diverted from a vertical to a lateral direction, resulting in a decreased speed that facilitates mineralization (Song, 2012).
The frequency analysis of fV reveals a normal distribution with a peak value of 0 (Figures 5I, J). The majority of orebodies are observed to form within the interval of fV (−10, 10), suggesting that the area with small shape transition is favorable for ore concentration.
Association rules analysis with spatial constraints
The association rule analysis procedure consists of three parts: 1) Data discretization, 2) Apriori operation approach, and 3) Rules filtering with spatial constraints. In this study, the apriori operation approach was not modified. On the other hand, the rule filtering under data discretization and spatial constraints is tailored according to the characteristics of the data items.
Data discretization
The Apriori algorithm can effectively extract the association relationships between Boolean data, but it is not suitable for numerical data (Takeshi et al., 1999). Since the ore-controlling indicators and mineralization indicators in the mineralization functional model database are numerical data, we divide the data set of each attribute into several subsets containing the same amount of data and replace the numerical value with subset name.
There are a total of 78,351 voxels in the mineralization functional model, of which the number of voxels satisfying mineralization condition O (later called mineralized voxels) is 17,526, with a proportion of about 22.36%. There are five ore-controlling indexes (dF, waF, wbF, gF, and fV) and two mineralization indexes (Au and AuMet) in the voxels’ properties. In this study, we focus on the correlation between the distribution of ore-bearing voxels and mineralization indexes as we study the favorable site of mineralization. When discretizing the data, only the distribution range of mineralized voxels is considered, and any data beyond this range is set to null and does not participate in the subsequent calculation process.
If an association rule involves N (1 ≤ N ≤ 5) ore-controlling indexes, then the expected support of the rule is obtained according to Eqs 4 and the related definition in the Bayesian formula:
Where P(O) is the probability of satisfying the ore-bearing condition, and P(C|O) is the ratio of the probability of satisfying the ore-controlling indexes condition C to the probability of the ore-bearing condition O, as calculated in Eqs 6–8.
Statistical analysis of the attributes of the voxels in the 3D geological model shows that P(O) is 22.36%. P(C|O) varies according to the choice of the discretization method. And it would become smaller as the number of ore-controlling indexes contained in the ore-controlling indexes condition C increases. Assume that all voxels in the 3D geological model database are uniformly distributed for each ore-controlling index. And the number of intervals set by discretization is M, and the number of voxels in each ore-controlling index interval is 1/M. Based on the equal-frequency discretization method, it can be deduced that:
Where n is the number of ore control indexes contained in condition C, and M is the number of intervals in which each ore control index is discretized. For example, for condition C = {df1, waf1}, n is two. According to this assumption,
The number of voxels in the association rule analysis results cannot be too many or too few. A large number of voxels would not reflect the stage differences of the ore-controlling factors, and conversely, the accuracy of the results is too low to be considered as a general pattern in the study area. After several experiments and comparative analyses, the mineral control indexes were finally separated and scattered into four levels. The boundary values of the interval of the fourth-grade dispersion of the ore controlling indicators are shown in Table 3.
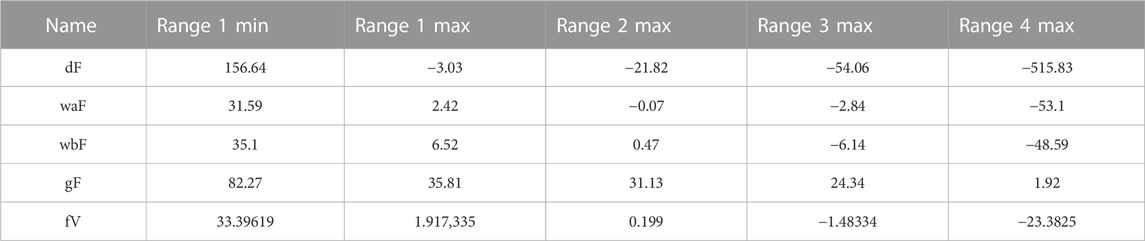
TABLE 3. Ore-controlling indexes discrete boundary value.
Rules filtering with spatial constraints
Association rule analysis was utilized to identify the relationships between various attributes within a dataset. However, random influences may influence the relationships between attributes, leading to underlying uncertainty of the association rules. To ameliorate this, the Apriori algorithm enables researchers to set their own minimum support and minimum confidence for screening the results.
The ore bodies exhibit distinctive spatial properties, yet conventional association rule analysis disregards the specificity of spatial attributes. To achieve a more realistic analysis outcome, this study proposes combining association rule analysis with spatial constraints to account for both association and spatial relationships. In the final step of association rule analysis, the results are filtered using minimum confidence and minimum support to identify high-confidence and high-support association rules. To further refine the association rules to fit the actual situation, spatial constraints are added to the screening process. By integrating the fundamental knowledge of mineralization distribution and regional mineralization patterns through the Apriori algorithm and Bayesian formula, this study proposes three filtering conditions to achieve this goal.
1 The minimum confidence level is established through statistical analysis. In order to ensure that the geological structure area associated with the filtered association rules does not exhibit a low proportion of mineralization, the minimum confidence is established as twice the proportion of mineralization present in the database.
2 The determination of the minimum support is a dynamic process in the association rule analysis. It is computed as 0.2236/4^n, where n represents the number of attributes incorporated in the association rule. This computation is based on the discretized equipartition intervals, the support formula, the confidence formula, and the Bayesian formula.
3 The association rules obtained through the Apriori algorithm are validated by a posteriori test using human-computer interaction. This process ensures the accuracy and reliability of the association rules, as well as provides a more comprehensive understanding of the spatial relationships between mineralization and other factors. Voxels are extracted from the database and analyzed with GOCAD software while considering two primary spatial constraints. 1) Geological structures and orebodies are not randomly distributed in small, disconnected areas in three-dimensional space. Thus, it is crucial to prioritize selecting rules that demonstrate specific spatial distribution patterns after being visualized using software. 2) Geological experts have reached a consensus on the geological structure and mineralization pattern of the study area, which effectively reflects the laws of geological structure mineralization. To obtain quantitative expressions of geological tectonic metallogenic laws, association rules that align with this consensus were selected. As experts’ consensus (Yang et al., 2014; Li et al., 2015; Li et al., 2017; Mao et al., 2019; Song et al., 2020), different types gold mineralization can all exist in the same deposit. To distinguish the levels of mineralization at different distances from the main fault, To distinguish the levels of mineralization at different distances from the main fault, we chose one association rule within each dF discrete interval that had the highest confidence and satisfied the first spatial constraint in terms of spatial distribution.
Mineralization favorable sites
Using association rule analysis, three favorable mineralization sites were identified and depicted using a combination of ore-controlling indexes intervals, as presented in Table 4.
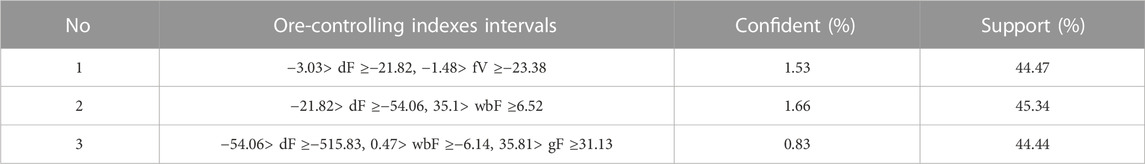
TABLE 4. Association rules with confident and support.
Site No. 1 (Figure 6), covering 42.334 million cubic meters, is the first favorable mineralization site located between 3.03 and 21.82 m below the main fault (Figure 7A). This zone contains 2,703 voxels, including 1,202 ore-bearing voxels, with a confidence level of 44.47% and a support level of 1.53%. The ore-controlling indexes waF, wbF, and gF are evenly distributed, concentrated between −5 and 10 m (Figure 7B), −20 and 20 m (Figure 7C), and 15° and 40°(Figure 7D), respectively, exhibiting approximate normality. The fV values are mainly concentrated between −1.48 and −10, with a denser distribution near −1.48 (Figure 7E), while Au is bimodally distributed at 0 g/t and 1.3 g/t (Figure 7F).
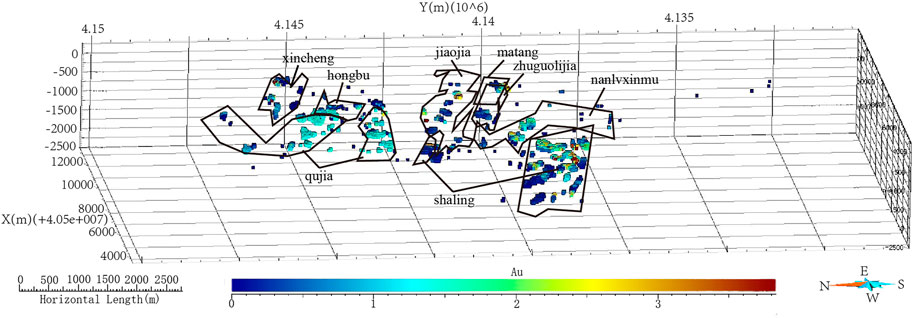
FIGURE 6. Voxels of the first favorable mineralization site.
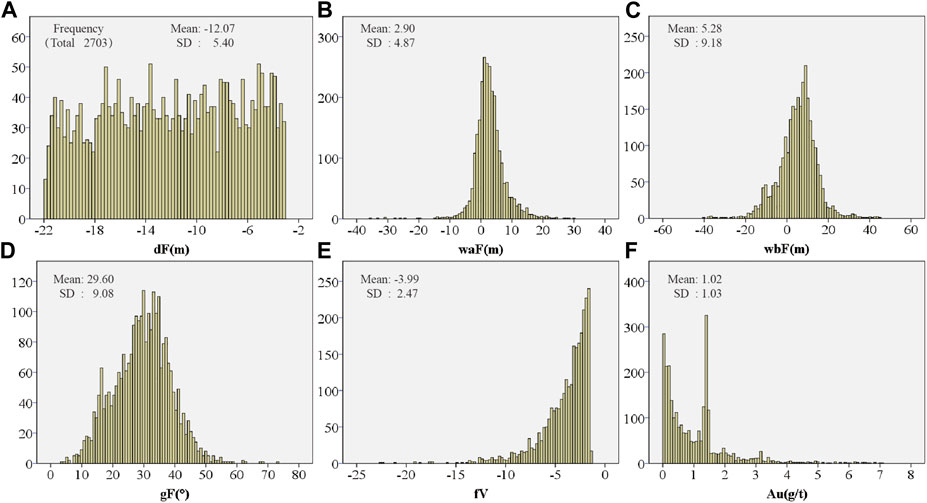
FIGURE 7. Histogram of geological features. (A) dF; (B) waF; (C) wbF; (D) gF; (E) fV; (F) Au.
The No. 1 site is arranged in strata that are largely parallel to the main fault surface. The dF (−3.03, −21.82 m) indicates that the orebodies at this location occur in the pyrite-sericized cataclazed rock belt in the footw all of the fault (Song et al., 2012). These orebodies are found in a relatively even distribution across several deposits, including Hongbu, Matang, Jiaojia, Nanluxinmu, Qujia, Shaling, and Zhuguolijia. Site No. 1 is closest to the Jiaojia fault, and the rocks are influenced by the strong activity of the fracture tectonics, with stronger alteration fragmentation (Song et al., 2008), promoting the formation of intrusive fracture zone alteration rock-type ores (Song et al., 2012; Zhang et al., 2015; Guo et al., 2017). The homogeneous and irregular distribution suggests a relatively uniform diffusion of mineralizing fluids near the fracture surface. The Jiaojia fault, as the dominant ore-controlling structure and fluid conduit in the study area, offers a pathway for the migration of mineralizing hydrothermal fluids and a favorable environment for mineralization (Guo et al., 2017). WaF (−5, 10 m) and wbF (−20, 20 m) suggest that the fracture has a slightly elevated area with a higher potential for mineralization. On the other hand, fV (−10, −1.48) predicts an increased likelihood of mineralization in areas where the fracture transitions from steep to gentle.
Site No. 2 (Figure 8), covering 44.891 million cubic meters, is the second favorable mineralization site located between 21.82 and 54.06 m below the main fault. This zone contains 2,873 voxels, including 1,303 ore-bearing voxels, with a confidence level of 45.34% and a support level of 1.66%. Analysis of the ore-controlling indexes showed an even distribution of df values between −54.06 and −21.82 m (Figure 9A), and a concentration of waF values between −5 and 10 m (Figure 9B). The gF values were primarily found between 5° and 45° and had a normal distribution (Figure 9D), while the fV values were mainly concentrated between −7 and 5 (Figure 9E). The wbF values were primarily found between 6.52 and 25 m, with denser distributions closer to 6.52 m (Figure 9C), and the Au values were bimodally distributed at 0 g/t and 1.4 g/t (Figure 9F).
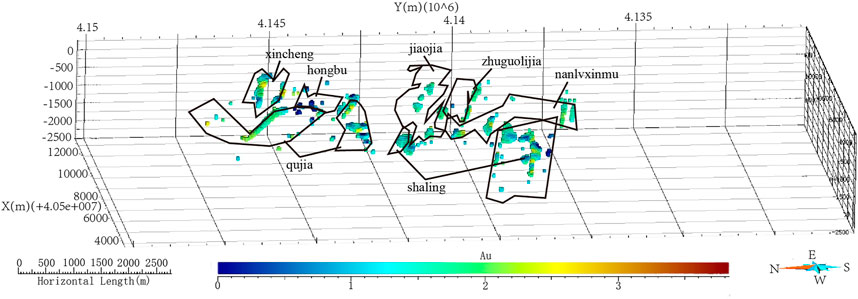
FIGURE 8. Voxels of the second favorable mineralization site.
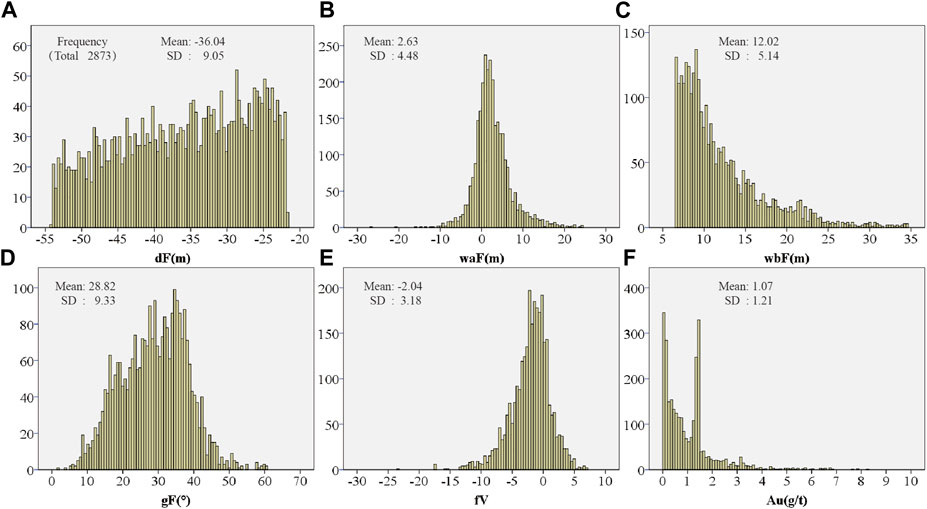
FIGURE 9. Histogram of geological features. (A) dF; (B) waF; (C) wbF; (D) gF; (E) fV. (F) Au.
Site No. 2 encompasses an area of approximately 44.891 million cubic meters and is distributed in equidistant and subparallel belts with a similar inclination to the fault surface and an east-west orientation. Analysis of dF (−3.03, −21.82 m) reveals that the orebodies located at this site are present in pyrite-sericized granitic fragmentation zones and pyrite-sericized granite belts. These orebodies can be found in several deposits, including Xincheng, Hongbu, Jiaojia, Nanlü-Xinmu, Qujia, Shaling, and Zhuguolijia mining areas. Site No. 2 is situated beneath the No. 2 site and showcases a lesser degree of rock fragmentation, fracture development, and a thinly spread concentration of ore bodies, which are arranged in equidistant subparallel bands (Song et al., 2012; Zhang et al., 2015). This site highlights the expansive mineralized areas resulting from the convergence of the main and secondary fractures, indicating a higher likelihood of precipitation mineralization for the mineralizing hydrothermal fluids in these areas. The secondary undulating outcrop of the fracture surface, as indicated by wbF (6.14, 25 m), provides concentrated mineralized zones, further reinforcing the site’s mineralization potential. The intersection of main and secondary fractures often results in extensive ore-hosting spaces. As the fluid migrates away from the main fracture surface, it first permeates and fills the spaces at the fracture junctions. During this progression, the fluid’s migration rate decreases and its temperature and pressure drop, leading to the formation of ore bodies along equidistant subparallel zones.
Site No. 3 (Figure 10) is the third favorable mineralization site located between 54.06 and 515.83 m below the main fault, covering an area of about 22.718 million cubic meters. This zone contains 1,454 voxels, including 646 ore-bearing voxels, with a confidence level of 44.44% and a support level of 0.83%.The ore-controlling indexes in these voxels reveals bimodal peaks in the df values at −75 and −250 m (Figure 11A), respectively. The waF values exhibit a normal distribution between −8 and 5 m (Figure 11B), while the wbF values exhibit a smooth normal distribution centered at −1 (Figure 11C). The distribution of the gF values is more scattered with no obvious pattern (Figure 11D). The fv values exhibit a normal distribution between −3 and 3 (Figure 11E), and gold grades show a single peak at 0.8 g/t beyond 0 g/t (Figure 11F).

FIGURE 10. Voxels of the third favorable mineralization site.
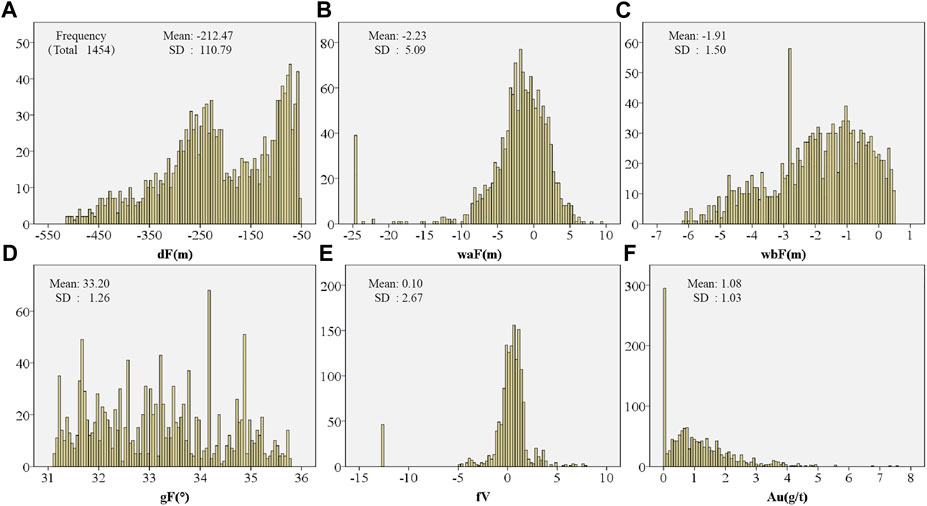
FIGURE 11. Histogram of geological features. (A) dF; (B) waF; (C) wbF; (D) gF; (E) fV. (F) Au.
Site No. 3 is located in the pyritic sericitized granitic fractured rock zone and pyritic sericitized granite zone, mainly in the south-central part of the Nanlü-Xinmu deposit with a obvious spatial aggregation. The production of orebodies consist of gently dipping orebodies parallel to the main fault and steeply dipping orebodies that cross the main fault obliquely. The mineralization type is dominated by vein and reticulated pyrite mineralization, followed by stellate and agglomerate pyrite mineralization (Guo and Zhu, 2019). Site No. 3, the farthest from the Jiaojia fault, experiences a gradual weakening of tectonic stress. As a result, the temperature and pressure decrease, leading to a reduction in the degree of rock fragmentation, and fissure development. The fluids transported along the edge of the linglong rock within the tensional fissure precipitate and form a steeply dipping ore body, which intersects the main structure obliquely. The formation of this steeply dipping ore body in conjunction with a slowly dipping ore body creates a binary structure of differing dips. In Shaling deposit, anomalous values observed in waF, wbF, and fV deviate from the broader distribution trend. Despite harboring substantial concentrations of Au and AuMet, the low volume-to-content ratio of small ore bodies in this area does not significantly alter the regional trend.
The results of the association rules analysis with spatial constraints have revealed three favorable mineralization sites. These sites have demonstrated high confidence and support, indicating not only a high proportion of mineralization but also a substantial extent of mineralization in the study area. The No. 1 and No. 2 sites are widely distributed and span multiple deposits, highlighting the generalized mineral control and mineralization patterns in the Jiaojia golefield. Meanwhile, the No. 3 site displays a high degree of spatial aggregation and is predominantly located in the Nanlü-Xinmu deposit, demonstrating the capability of identifying specific mineralization patterns within the region.
Conclusion
The 3D mineralization functional modeling for the Jiaojia goldfield quantitatively determines the spatial association between orebodies and geological features, and can aid in developing and enhancing mineral exploration strategies for the Jiaodong-type orogenic gold deposits.
The association rule analysis can effectively extract the correlation between the combination of ore-controlling indexes and mineralization indexes. The association rule with high confidence and support can effectively express the spatial location of the high proportion of mineralization in the study area, which has a positive effect on the in-depth understanding of the mineralization pattern of Jiaodong-type orogenic gold deposits.
The mineralization favorable area analysis quantifies the mineralization favorable space of the Jiaojia goldfield by using the combination of ore-controlling index intervals, which upgrades the expression method of mineralization favorable area from conceptual qualitative study to numerical quantitative study.
Data availability statement
The data analyzed in this study is subject to the following licenses/restrictions: the raw data in our study was obtained from a publicly listed mining company and is subject to a data confidentiality agreement between us and the company. As such, we are unable to provide the raw data for publication. Requests to access these datasets should be directed to XM, eGMubWFvQHFxLmNvbQ==.
Author contributions
XM and HD conceived of the presented idea. ZL, JC, and JW did the field investigation and data collection. MT, JC, and JW conducted all the experiments. MT wrote the original draft. XM and ZL reviewed and edited the draft. All authors contributed to the article and approved the submitted version.
Funding
This study was jointly funded by the National Natural Science Foundation of China (Nos. 42030809, 41972309, 42072325, and 42172328), the National Key R&D Program of China (No. 2017YFC0601503) and the Project supported by the Research Foundation of Education Bureau of Hunan Province, China (No. 20C0372).
Acknowledgments
The authors would like to thank the insightful and critical reviews from Prof. Huan Li and two reviewers. Qi Wang, Longjiao Li, and Guanghuan Chen are appreciated for their efforts in 3D modeling and geology investigation.
Conflict of Interest
The authors declare that the research was conducted in the absence of any commercial or financial relationships that could be construed as a potential conflict of interest.
Publisher’s note
All claims expressed in this article are solely those of the authors and do not necessarily represent those of their affiliated organizations, or those of the publisher, the editors and the reviewers. Any product that may be evaluated in this article, or claim that may be made by its manufacturer, is not guaranteed or endorsed by the publisher.
References
Agrawal, R., and Shafer, J. (1996). Parallel mining of association rules. IEEE Trans. Knowl. Data Eng. 8 (6), 962–969. doi:10.1109/69.553164
Agrawal, R., and Srikant, R. (1994). “Fast algorithm for mining association rules[J],” in Proceedings of 20th Int. Conf. Very Large Data Bases (VLDB), (San Mateo, CA: Morgan Kaufman Press), 487–499.
Bayardo, R., and Agrawal, R. (1999). “Mining the most interesting rules[J],” in Proceedings of the ACM SIGKDD Conf. on Knowledge Discovery and Data Mining, San Diego, California, August 1999 (ACM), 145–154. doi:10.1145/312129.312219
Chang, L. H., Zhu, Y. Q., Zhang, G. Y., Zhang, X., and Hu, B. R. (2018). Spatial correlation analysis of mineral resources information. Acta Petrol. Sin. 34 (2), 314–318.
Chen, J. P., Shi, R., Chen, Z. P., Wang, L. M., and Sun, Y. (2012). 3D positional and quantitative prediction of the Xiaoqinling goldorebelt in Tongguan, Shaanxi, China. AcataGeol. Sin-Engl. 86, 653–660. doi:10.1111/j.1755-6724.2012.00693.x
Chen, J., Mao, X. C., Liu, Z. K., and Deng, H. (2020). Three dimensional metallogenic prediction of Dayingezhuang gold deposit based on stochastic forest algorithm. Geotect. Metallogenia 44 (2), 231–241. doi:10.16539/j.ddgzyckx.2020.02.007
Deng, J. (1992). On the structural systems and its controllability over gold-ore distribution in the northwest Jiaodong, China. Beijing, China: Chinese academy of geological sciences.
Ding, Z. J., Sun, F. Y., Liu, F. L., Liu, J. H., Peng, Q. M., and Ji, P. (2015). Mesozoic geodynamic evolution and metallogenic series of major metal deposits in Jiaodong Peninsula, China. Acta Petrol. Sin. 31 (10), 3045–3080.
Goldfarb, R. J., and Santosh, M. (2014). The dilemma of the Jiaodong gold deposits: Are they unique? Geosci. Front. 5 (02), 139–153. doi:10.1016/j.gsf.2013.11.001
Guo, X. .,L., and Zhu, X. .,L. (2019). Geological characteristics and deep exploration prospecting of the Nanlv-Xinmu gold deposit in northwest Jiaodong area. Mineral. Resour. 3, 39–41.
Guo, L. N., Goldfarb, R. J., Wang, Z. L., Li, R. H., Chen, B. H., and Li, J. L. (2017). A comparison of Jiaojia- and linglong-type gold deposit ore-forming fluids: Do they differ? Ore Geol. Rev. 88, 511–533. doi:10.1016/j.oregeorev.2016.12.003
Hao, D. W. (2021). Analysis of ore-controlling structure deposit and 3D modeling of Jiaojia gold. China University of Geosciences, Beijing.
Hu, X. Y., Yuan, F., Li, X. H., Jowitt, S. M., Jia, C., Zhang, M. M., et al. (2018). 3D characteristic analysis-based targeting of concealed Kiruna-type Fe oxide-apatite mineralization within the Yangzhuang deposit of the Zhonggu orefield, southern Ningwu volcanic basin, middle-lower Yangtze River metallogenic belt, China. Ore Geol. Rev. 92, 240–256. doi:10.1016/j.oregeorev.2017.11.019
Jessell, M., Aillères, L., Kemp, E. D., Lindsay, M., Wellmann, F., and Hillier, M. (2014). Next generation three-dimensional geologic modeling and inversion. Seg. Spec. Publ. 18, 261–272.
Lebrun, E., Miller, J., Thébaud, N., Ulrich, S., and McCuaig, T. C. (2017). Structural controls on an orogenic gold system: The world-class siguiri gold district, siguiri basin, Guinea, west africa. Econ. Geol. 112 (1), 73–98. doi:10.2113/econgeo.112.1.73
Li, L., Santosh, M., and Li, S. R. (2015). The ‘Jiaodong type’ gold deposits: Characteristics, origin, and prospecting. Ore Geol. Rev. 65, 589–611. doi:10.1016/j.oregeorev.2014.06.021
Li, N., Bagas, L., Li, X. H., Xiao, K. Y., Li, Y., Ying, L. J., et al. (2016). An improved buffer analysis technique for model-based 3D mineral potential mapping and its application. Ore Geol. Rev. 76, 94–107. doi:10.1016/j.oregeorev.2015.12.002
Li, H. K., Yu, X. F., Zhou, C. Y., Liang, T. T., Geng, K., and Li, D. P. (2017). Metallogenic system of Jiaodong gold deposit in Shandong province. Shandong Land Resour. 33 (7), 1–6. doi:10.3969/j.issn.1672-6979.2017.07.001
Li, N., Song, X., Xiao, K., Li, S., Li, C., and Wang, K. (2018). Part II: A demonstration of integrating multiple-scale 3D modelling into GIS-based prospectivity analysis: A case study of the huayuan-malichang district, China. Ore Geol. Rev. 95, 292–305. doi:10.1016/j.oregeorev.2018.02.034
Li, X., Yuan, F., Zhang, M., Jowitt, S. M., Ord, A., Zhou, T., et al. (2019). 3D computational simulation-based mineral prospectivity modeling for exploration for concealed Fe–Cu skarn-type mineralization within the Yueshan orefield, Anqing district, Anhui Province, China. Ore Geol. Rev. 105, 1–17. doi:10.1016/j.oregeorev.2018.12.003
Lindsay, M. D., Aillères, L., Jessell, M. W., Kemp, E. A., and Betts, P. G. (2012). Locating and quantifying geological uncertainty in three-dimensional models: Analysis of the gippsland basin, southeastern Australia. Tectonophysics 546–547, 10–27. doi:10.1016/j.tecto.2012.04.007
Liu, Y. C., Li, Z. X., Laukamp, C., Laukamp, C., West, G., and Gardoll, S. (2013). Quantified spatial relationships between gold mineralisation and key ore Genesis controlling factors, and predictive mineralisation mapping, St Ives Goldfield, Western Australia. Ore Geol. Rev. 54, 157–166. doi:10.1016/j.oregeorev.2013.03.007
Liu, L. M., Li, J. F., Zhou, R. C., and Sun, T. (2016). 3D modeling of the porphyry-related dawangding gold deposit in south China: Implications for ore Genesis and resources evaluation. Geochem. Explor. 164, 164–185. doi:10.1016/j.gexplo.2015.11.002
Liu, G., Wang, Y. .,Z., Xue, T., Wu, C. Y., Xue, B., and Tang, T. T. (2019). Mineral resource spatial association analysis and prediction:A case study in western China. Geoscience 33 (04), 751–754. doi:10.1364/OL.44.000751
Lv, G. X., Huo, Q. L., Yuan, Y. L., Xu, Y. Q., Fan, X., and Fu, C. W. (2017). Mineralization of tectonic-magmatic upheaval-hydrothermal alteration in the detachment zone, Jiaodong Peninsula. Earth Sci. Front. 24 (2), 095–103. doi:10.13745/j.esf.yx.2016-12-20
Ma, D. Y., Gao, Z. M., Tao, Y., and Zhang, H. (2004). The characteristics of ore-controlling structures of the interbedded cassiterite-sulfide deposit, gaosong ore field, gejiu, Yunnan. Acta Mineral. Sin. 24 (2), 153–156. doi:10.3321/j.issn:1000-4734.2004.02.010
Mao, X. C., Dai, T. G., Wu, X. B., and Zou, Y. H. (2009). The stereoscopic quantitative prediction of concealed orebodies in the deep and marginal parts of crisis mines: A case study of the dachang tin polymetallic ore deposit in guangxi. Geol. China. 36, 424–435. doi:10.1002/9780470611807.ch2
Mao, X. C., Hu, C., Zhou, S. G., Zhang, B. Y., Wang, F. Y., and Zeng, W. B. (2011). Field analysis of metallogenic information and its application. Cent. S. Univ. Technol. 18, 196–207. doi:10.1007/s11771-011-0680-z
Mao, X. C., Tang, Y. H., and Deng, H. (2012). Threedimensional morphological analysis method for geologic bodies and its application. J. Central South Univ. Sci. Technol. 43 (2), 588–595.
Mao, X. C., Zhang, B., Deng, H., Zou, Y. H., and Chen, J. (2016). Three-dimensional morphological analysis method for geologic bodies and its parallel implementation. Comput. Geosci. 96, 11–22. doi:10.1016/j.cageo.2016.07.004
Mao, X. C., Ren, J., Liu, Z. K., Chen, J., Tang, L., Deng, H., et al. (2019). Three-dimensional prospectivity modeling of the jiaojia-type gold deposit, Jiaodong peninsula, eastern China: A case study of the Dayingezhuang deposit. J. Geochem. Explor. 203, 27–44. doi:10.1016/j.gexplo.2019.04.002
Mao, X. C., Wang, Q., Chen, J., Deng, H., Liu, Z. K., and Wang, J. L. (2020a). Three-dimensional modeling of deep metallogenic structure in northwestern Jiaodong peninsula and its gold prospecting significance. Acta Geosci. Sin. 41 (2), 166–178. doi:10.3975/cagsb.2020.020702
Mao, X. C., Zhang, W., Liu, Z., Ren, J., Bayless, R. C., and Deng, H. (2020b). 3D mineral prospectivity modeling for the low-sulfidation epithermal gold deposit: A case study of the axi gold deposit, western tianshan, NW China. Minerals 10, 233. doi:10.3390/min10030233
Moshkov, M., Zielosko, B., and Tetteg, E. T. (2022). Common association rules for dispersed Information systems. Procedia Comput. Sci. 207, 4613–4620. doi:10.1016/j.procs.2022.09.525
Pei, R. F., Wen, L. J., Wang, Y. L., and Wang, H. L. (2011). Metallogeny of the tectonomagmatic emplacing contact structural system of the metallogenic belt in middle and lower reaches of Yangtze. Geol. Resour. 20 (06), 401–412. doi:10.3969/j.issn.1671-1947.2011.06.001
Pei, R. F. (1998). The ore-forming and anomalous metallogenic tectonic consolidation of China’s extra-large deposits. Beijing: Geological Publishing House.
Qin, Y. Z., and Liu, L. M. (2018). Quantitative 3D association of geological factors and geophysical fields with mineralization and its significance for ore prediction: An example from anqing orefield, China. Minerals 8, 300–323. doi:10.3390/min8070300
Richard, J. G., and Santosh, M. (2014). The dilemma of the Jiaodong gold deposits: Are they unique? Geosci. Front. 5 (2), 139–153. doi:10.1016/j.gsf.2013.11.001
Song, M. C., Cui, S. X., Yang, Z. L., Jiang, H. L., Yang, C. H., and Jiao, X. M. (2008). Great progress and far-reaching significance of deep exploration in the Jiaojia metallogenic belt, Shandong province. Geol. Prospect. 44, 1–8.
Song, M. C., Yi, P. H., Xu, J. X., Cui, S. X., Shen, K., Jiang, H. L., et al. (2012). A step metallogenetic model for gold deposits in the northwestern Shandong Peninsula, China. Sci. China Earth Sci. 55, 940–948. doi:10.1007/s11430-012-4366-7
Song, M. C., Li, S. Z., Santosh, M., Zhao, S. J., Yu, S., Yi, P. H., et al. (2015). Types, characteristics, and metallogenesis of gold deposits in the Jiaodong peninsula, eastern North China Craton. Ore Geol. Rev. 65, 612–625. doi:10.1016/j.oregeorev.2014.06.019
Song, M. C., Lin, S. Y., Yang, L. Q., Song, Y. X., Ding, Z. J., and Li, J. (2020). Metallogenic model of Jiaodong Peninsula gold deposits. Mineral. deposits 39 (2), 215–236. doi:10.16111/j.0258-7106.2020.02.002
Stoch, B., Anthonissen, C. J., McCall, M. J., Basson, I. J., Deacon, J., Cloete, E., et al. (2018). 3D implicit modeling of the sishen mine: New resolution of the geometry and origin of Fe mineralization. Mineral. Deposita. 53, 835–853. doi:10.1007/s00126-017-0784-y
Sun, H. S., Wu, P., Li, H., Wang, Y., Danisik, M., Li, Z. K., et al. (2022). Comparison of the exhumed history and magnitude between Jiaojia and Linglong goldfields in the Jiaodong gold Province, North China: Constraints from zircon and apatite (U-Th)/He data. Ore Geol. Rev. 144, 104857. doi:10.1016/j.oregeorev.2022.104857
Takeshi, F., Yasuhiko, M., Shinichi, M., and Takeshi, T. (1999). Mining optimized association rules for numeric attributes. J. Comput. Syst. Sci. 58, 1–12. doi:10.1006/jcss.1998.1595
Wang, S. R., Yang, L. Q., Wang, J. G., Wang, E. J., and Xu, Y. L. (2019). Geostatistical determination of ore shoot plunge and structural control of the Sizhuang world-class epizonal orogenic gold deposit, Jiaodong peninsula, China. Minerals 9 (4), 214–229. doi:10.3390/min9040214
Xiang, J., Xiao, K. Y., Chen, J. P., and Li, S. (2020). 3D metallogenic prediction based on metallogenic system analysis: A case study in the lala copper mine of sichuan province. Acta Geosci. Sin. 41 (2), 135–143. doi:10.3975/cagsb.2020.011301
Xiao, F., and Wangm, Z. H. (2017). Geological interpretation of Bouguer gravity and aeromagnetic data from the Gobi-desert covered area, Eastern Tianshan, China: Implications for porphyry Cu-Mo polymetallic deposits exploration. Ore Geol. Rev. 80, 1042–1055. doi:10.1016/j.oregeorev.2016.08.034
Xiao, K. Y., Sun, L., Yin, J. N., Ding, J. H., Niu, C. Y., and Chen, J. P. (2014). The prediction and assessment of important mineral resources in China. Acta Geosci. Sin. 35 (05), 543–551. doi:10.3975/cagsb.2014.05.03
Xiao, F., Chen, J. G., Hou, W. S., Wang, Z. H., Zhou, Y. Z., and Erten, O. (2018). A spatially weighted singularity mapping method applied to identify epithermal Ag and Pb-Zn polymetallic mineralization associated geochemical anomaly in Northwest Zhejiang, China. J. Geochem. Explor. 189, 122–137. doi:10.1016/j.gexplo.2017.03.017
Xiao, F., Wang, K. Q., Hou, W. S., Wang, Z. H., and Zhou, Y. Z. (2020a). Prospectivity mapping for porphyry Cu-Mo mineralization in the eastern Tianshan, Xinjiang, northwestern China. Nat. Resour. Res. 29 (1), 89–113. doi:10.1007/s11053-019-09486-5
Xiao, F., Wang, K. Q., and Zhou, Y. Z. (2020b). Identifying geochemical anomaly through spatially anisotropic singularity mapping: A case study from silver-gold deposit in pangxidong district, se China. J. Geochem. Explor. 210, 2041–2064. doi:10.1016/j.gexplo.2019.106453
Xiao, F., Chen, W. L., Wang, J., and Oktay, E. (2021). A hybrid logistic regression: Gene expression programming model and its application to mineral prospectivity mapping. Nat. Resour. Res. 31, 2041–2064. doi:10.1007/s11053-021-09918-1
Yang, L. Q., Deng, J., and Wang, Z. L. (2014). “Ore-controlling structural pattern of Jiaodong gold deposits: Geological-geophysical integration constraints,” in The deep-seated structures of earth in China, 1006–1030.
Yang, L. Q., Deng, J., Wang, Z. L., Guo, L. N., Li, R. H., Groves, D. I., et al. (2016). Relationships between gold and pyrite at the Xincheng gold deposit, Jiaodong peninsula, China: Implications for gold source and deposition in a brittle epizonal environment. Econ. Geol. 111, 105–126. doi:10.2113/econgeo.111.1.105
Yao, F. L., Liu, L. D., and Kong, Q. C. (1990). Vein gold deposits in the northwest of Jiaodong peninsula. Changchun: Jilin Sceince and Technology Press.
Yin, Y. C. (2020). Gold mineralization and metallogenic model of the Jiaoxibei gold deposit concentrated area. Jilin, China: Jilin University.
Yu, W. J., Wang, X. C., and Wang, F. Y. (2008). “The research of improved Apriori algorithm for mining association rules[J],” in International conference on communication Technology proceedings, 513–516.
Yuan, F., Li, X. H., Zhang, M. M., Jowitt, S., Jia, C., and Zheng, T. K. (2014). Three-dimensional weights of evidence-based prospectivity modeling: A case study of baixiangshan mining area, ningwu basin, middle and lower yangze metallogenic belt, China. Geochem. Explor. 145, 82–97. doi:10.1016/j.gexplo.2014.05.012
Yue, Y. H. (2004). The research of Association Rules mining Method that contain time and space. Harbing, China: Harbin Engineering University.
Zeng, Q. D., Liu, T. B., and Shen, Y. C. (2001). The Tanlu fault zone and gold ore metallogenesis in eastern China. Int. Geol. Rev. 43 (2), 176–190. doi:10.1080/00206810109465006
Zhai, Y. S. (2002). Review and prospect of ore-forming tectonic research. Geol. Rev. 48 (2), 140–146.
Zhang, X. F., Wu, R. Z., Shi, Q., Niu, S. Y., Sun, A. Q., and Zhang, F. X. (2015). Comparative study on ore-forming and ore-controlling structures at linglong gold mine and Jiaojia gold mine in Jiaodong region. Gold Sci. Technol. 23 (5), 14–19. doi:10.11872/j.issn.1005-2518.2015.05.014
Zhang, M. M., Zhou, G. Y., Shen, L., Zhao, W. G., Liao, B. S., Yuan, F., et al. (2019). Comparison of 3D prospectivity modeling methods for Fe–Cu skarn deposits: A case study of the zhuchong Fe–Cu deposit in the yueshan orefield (anhui), eastern China. Ore Geol. Rev. 114, 103126–126. doi:10.1016/j.oregeorev.2019.103126
Keywords: Jiaojia goldfield, metallogenic information extraction, association rules analysis, favorable mineralization site, spatial constraints
Citation: Mao X, Tang M, Deng H, Chen J, Liu Z and Wang J (2023) Using association rules analysis to determine favorable mineralization sites in the Jiaojia gold belt, Jiaodong Peninsula, East China. Front. Earth Sci. 11:1174017. doi: 10.3389/feart.2023.1174017
Received: 25 February 2023; Accepted: 02 May 2023;
Published: 11 May 2023.
Edited by:
Jillian Aira Gabo-Ratio, University of the Philippines Diliman, PhilippinesReviewed by:
Xiaohui Li, Hefei University of Technology, ChinaFan Xiao, Sun Yat-sen University, China
Copyright © 2023 Mao, Tang, Deng, Chen, Liu and Wang. This is an open-access article distributed under the terms of the Creative Commons Attribution License (CC BY). The use, distribution or reproduction in other forums is permitted, provided the original author(s) and the copyright owner(s) are credited and that the original publication in this journal is cited, in accordance with accepted academic practice. No use, distribution or reproduction is permitted which does not comply with these terms.
*Correspondence: Miao Tang, ZHVhbmZlbmdoYW5Ac29odS5jb20=