- State Key Laboratory of Geohazard Prevention and Environment Protection, Chengdu University of Technology, Chengdu, China
Rock failure generally leads to serious consequences, and it is significant to obtain the precursor information prior to failure using associated techniques. Acoustic emission (AE) is one of the indispensable methods for disaster warning of hard and brittle rock. Acoustic emission detection technology can effectively monitor real-time information about changes in the rock interior and predict the process of rock damage failure. To probe the relationship among the AE precursor information of red sandstone under different intermediate principal stresses, an experimental study was conducted by us to examine the alterations in AE parameters during the failure of red sandstone under both loading and unloading circumstances. The study shows that the ringing count rate and absolute energy versus time curves are divided into four stages, namely, quiet, frequent, sudden increase and decline periods. The cumulative count curve is also divided into four phases: pre-unloading period, post-unloading period, sharp increase period, and decrease period. With the rise of the intermediate principal stress, the ringing count rate and energy exhibited during the frequent period of AE demonstrate a consistent increase, with a larger increase in the maximum value and a smaller increase in the average value. In addition, the peak value of AE signals during failure also increases accordingly. The occurrence moment and clarity of the frequent period determine the reliability and priority of the information related to the rock’s failure precursor; moreover, the reliability and priority of the AE precursor information will increase with the increase of the intermediate principal stress. After comparison, it is found that the AE precursor information occurs prior to the thermal infrared precursor information.
1 Introduction
Acoustic emission (AE) is a transient elastic wave within a material due to the rapid release of local strain energy. The generation and development of internal fractures in brittle rocks during failure is a good AE signal source, and since there are no obvious anomalies on the surface of hard brittle rocks before instability failure, it is often challenging to predict the occurrence of such type of failures. Therefore, as a concomitant phenomenon, AE produced during the rock failure process can provide effective information for predicting rock instability failure and provide significant evidence for predicting rock failure (Fortin et al., 2009; Brantut et al., 2011; Zhang et al., 2019; Chen et al., 2020), thus better ensuring the safety of people’s lives and property.
During rock failure, a large amount of elastic strain energy could be released, and monitoring changes in AE parameters has become a new direction in the study of rock failure. Through analysis of variations in AE parameters during rock failure, the alterations in the internal structural condition of the rock mass can be identified, thereby allowing for inference of the mechanism underlying rock mass failure. It has been proposed that the b-value of AE in rock failure exhibits a tendency to decrease as stress increases prior to failure and experiences a marked decrease at the moment of failure (Lei, 2006; Dong et al., 2022). The acoustic response and fractal dimension can reflect the evolution and expansion of fractures during loading, and the acoustic fractal values can be used to study the precursor information of rock failure (Kong et al., 2016; Xu et al., 2017). Furthermore, the spatial correlation length of acoustic emissions can be regarded as a precursor parameter for rock failure, which generally increases during the failure process (Tyupkin and Giovambattista, 2005; Li et al., 2010). The spatial AE localization technique enables the analysis of the internal fracture evolution of rock specimens over the loading process (Yang et al., 2012; Wang et al., 2022). The sharp increase in various parameters of AE is closely associated with the occurrence of rock fractures (Zhao et al., 2015; Moradian et al., 2016).
True triaxial stress paths can accurately reflect the deformation and failure patterns of rock masses caused by different excavation methods in engineering and can better simulate the mechanical response and deformation and failure characteristics of rock masses after excavation. Mogi (1971) successfully developed the world’s first true triaxial test machine for rocks, proving the existence of intermediate principal stress effects on rocks. The effect of intermediate principal stresses on the strength characteristics of rocks has been confirmed by many scholars (Haimson and Chang, 2012; Ma et al., 2017). In addition, many studies based on true triaxial tests have shown that intermediate principal stresses have significant influence on the mechanical properties, failure mechanisms, and underground engineering stability of rocks (Ma et al., 2014; Feng et al., 2016; Vachaparampil and Ghassemi, 2017; Gao et al., 2018; Zhang et al., 2021; Zhao et al., 2022a; b; Xu et al., 2022).
In this study, the variation of AE parameters of red sandstone under different intermediate principal stresses are investigated, the similarities and differences among the acoustic emissions under different intermediate principal stresses are compared, and finally the AE precursor information before rock failure through true triaxial tests under unloading conditions are analyzed. The temporal relationships among the various precursors were identified, for the purpose of better predicting and preventing excavation and unloading-induced rock instability failure.
2 Test methods
2.1 Test conditions and test equipment
The red sandstone specimens used are dense and tight, with a good integrity. The specimens are rectangular in shape and its dimensions are 100 mm × 100 mm × 200 mm with a flatness error of ± 0.05 on the end face and a verticality error of ± 0.25°C. The minimum principal stress in the true triaxial loading test is 5 MPa, and a total of 4 different intermediate principal stress conditions were set up. In each condition 3 specimens were tested, and a total of 12 specimens were used.
The true triaxial test was carried out using the new high-pressure servo-dynamic true triaxial rigidity tester TAW1-5000/3000 (Figure 1) (Su et al., 2017). The development, extension and penetration of fractures on the rock surface were captured using a high speed digital camera developed by SVSI, United States. The AE monitoring was conducted using the Micro-II Digital AE System from PAC company, United States. The FLIRSC305 infrared thermal imaging camera was also used to monitor the changes in the thermal image of the specimen’s free face.
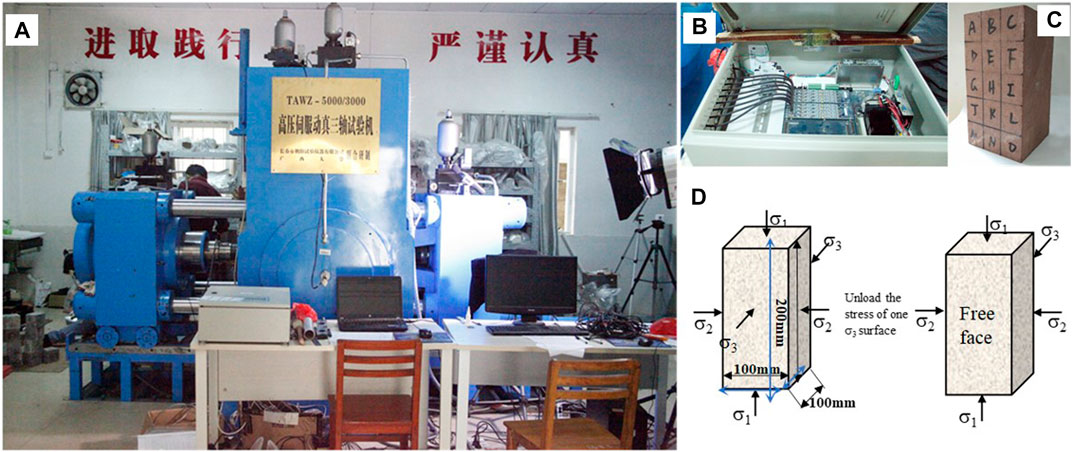
FIGURE 1. Diagram of test equipment, specimen and stress state. (A) High pressure servo-motion true triaxial tester. (B) Micro-II Digital AE System. (C) Red sandstone specimens. (D) Schematic diagram of the true triaxial loading and unloading stress state.
2.2 True triaxial loading and unloading test scheme
The initial ground stress is set before the test, where σ1 represents the maximum principal stress, σ2 represents the intermediate principal stress and σ3 denotes the minimum principal stress, the direction of the minimum principal stress is the free face.
Test scheme: first, the stress of 0.5 MPa was applied to σ1 using the displacement control method in order to connect the specimen end face with the face of the transfer column. Then, the load control method was employed to reach the design value σ1 at a loading rate of 0.2 MPa/s. After that, using the same method, keep σ1 unchanged and load σ2 to the design value; keep σ2 unchanged and load σ3 to the design value and maintain this stress state for 10 s. After the initial stress loading was completed, one side was quickly unloaded, while the opposite side was adjusted to displacement control. Then, σ1 was increased at a loading rate of 2 kN/s until the instability failure of the specimen. The stress state is shown in Figure 1D, and the stress path is the same as the true triaxial loading path. During this process, AE, high-speed camera and infrared thermal imaging camera collected data simultaneously. The true triaxial stress levels for this study were listed as follows: σ1 was set at 60 MPa. σ2 was set as 10 MPa, 20 MPa, 40 MPa, and 60 MPa, respectively; σ3 was set as 5 MPa. The test details are shown in Table 1.
3 Experimental results and analysis
3.1 Characteristics of AE precursor information
The AE characteristics of rocks in true triaxial loading tests and the corresponding precursor information have been extensively studied in previous studies. On this basis, the AE signals in real triaxial loading and unloading tests were investigated to decode their characteristics under this stress path and the precursor information before rock failure. In particular, analyzing the AE characteristics under different intermediate principal stresses and comparing the similarities and differences.
Figure 2 shows the curves of each AE parameter versus time under the intermediate principal stress of 10 MPa. Which I is quiet period, II is frequent period, III is sudden increase period, IV is decrease period, A is pre-unloading period, B is post-unloading period, C is sudden increase period and D is decrease period. Figures 2A, B show the ringing count rate and absolute energy, respectively, and Figures 2C, D display the corresponding cumulative count curves. According to Figures 2A, B, the quiet period is the longest in the whole process. In general, the ring count rate remains in a low level but increases significantly when the specimen is disturbed during unloading. The frequent period accounts for about 7% of the whole process, and the overall level of ringing count rate and energy level is increased, and microcracks inside the specimen are pervasively developed. The sudden increase period is the shortest due to the specimen failure that makes the ringing count rate and energy rise steeply and then fall back in a short time. It is prominent that the rock failure process is extremely short. After the ringing count rate and energy fall back, they enter into the decrease period, during which the number of AE specimens gradually decreases. Based on the characteristics of the changes in AE ringing count rate and energy, it can be inferred that before the failure of the specimen, the levels and numbers of AE events will significantly increase. This indicates that internal micro-cracks have developed extensively and interconnected within the specimen, implying that the rock specimen is about to fail.
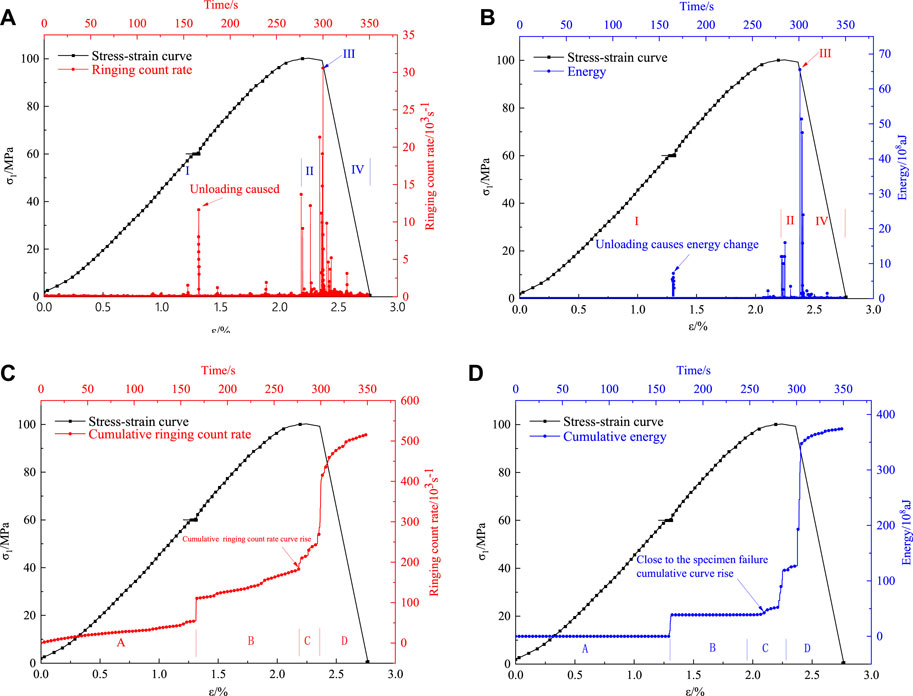
FIGURE 2. Relationship between AE parameters and time at 10 MPa. (A) Ringing count rate curve. (B) Absolute energy curve. (C) Cumulative ringing count rate curve. (D) Accumulated absolute energy curve.
Figures 2C, D show the cumulative counting curves of AE ringing count rate and energy versus time. The cumulative curves are divided into four periods A, B, C, and D, which are named as pre-unloading period, post-unloading period, sharp increase period, and decrease period, respectively. Notably, there is a sudden jump in the cumulative curve of the ringing count rate, and the slope of the curve increases after the jump. 25 s before the steep increase, the curve enters the sudden increase period. During this period, the curve rises obviously, this information can serve as a precursor for rock failure. The cumulative curve increases sharply and steeply when the specimen is damaged and then returns to flat. The cumulative energy curve has only slight change in slope before and after unloading and enters the sudden increase period 36 s before specimen failure. In this period, the AE energy increases multiple times, resulting in a stair-stepping pattern.
Figure 3 shows the curves of each AE parameter versus time under an intermediate principal stress of 20 MPa. As shown in Figures 3A, B, the overall characteristics of the ringing count rate and energy curves are similar. In the quiet period, the overall AE signal level is low, and the signal appears to rise significantly during the unloading period. Around 44 s before the specimen failure, the AE enters a frequent period, during which the number of AE specimens and the signal level increase significantly, with abundant microcrack development inside the specimen. Then, specimen failure occurs. The AE signal increases steeply and then falls back, and finally declines gradually. The changing characteristics of ringing count rate and energy show that at the early stage of loading, there are no internal microcracks and the AE signal is less. During the unloading process, the rock specimen is disturbed both inside and outside, and the acoustic signal increases significantly. The quiet period accounts for the largest proportion of the entire process, reaching about 78%, and the frequent period accounts for 8%–9%, which can effectively warn the rock failure. Additionally, the rapid rock failure leads to a short period of sudden increase, accounting for only about 1% of the whole process.
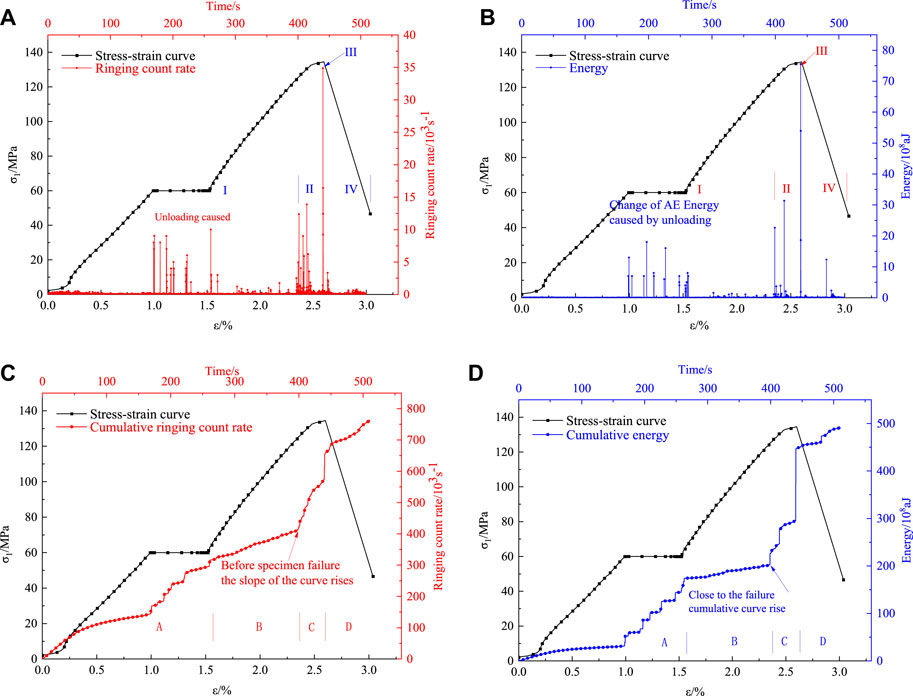
FIGURE 3. Relationship between AE parameters and time at 20 MPa. (A) Ringing count rate curve. (B) Absolute energy curve. (C) Cumulative ringing count rate curve. (D) Accumulated absolute energy curve.
The cumulative counting curve is clearly segmented, showing multiple periods. The slope of the curve after unloading is higher than that before unloading, and the curve rises faster during the unloading period, exhibiting a stair-stepping pattern. The curve enters the sudden increase period when 45 s before the specimen failure (Figures 3C, D).
Figure 4 shows the curves of each parameter of AE versus time under an intermediate principal stress of 40 MPa. As shown in Figures 4A, B, the overall level of both AE ringing count rate and energy increases as the intermediate principal stress increases, and the number of AE events during the unloading period increases significantly. The duration of the frequent period of AE increases by 51 s, and the number of AE events during this period fluctuates drastically. The overall change in AE ringing count rate and energy is similar, showing an abrupt increase at the unloading, pre-failure, and failure moments.
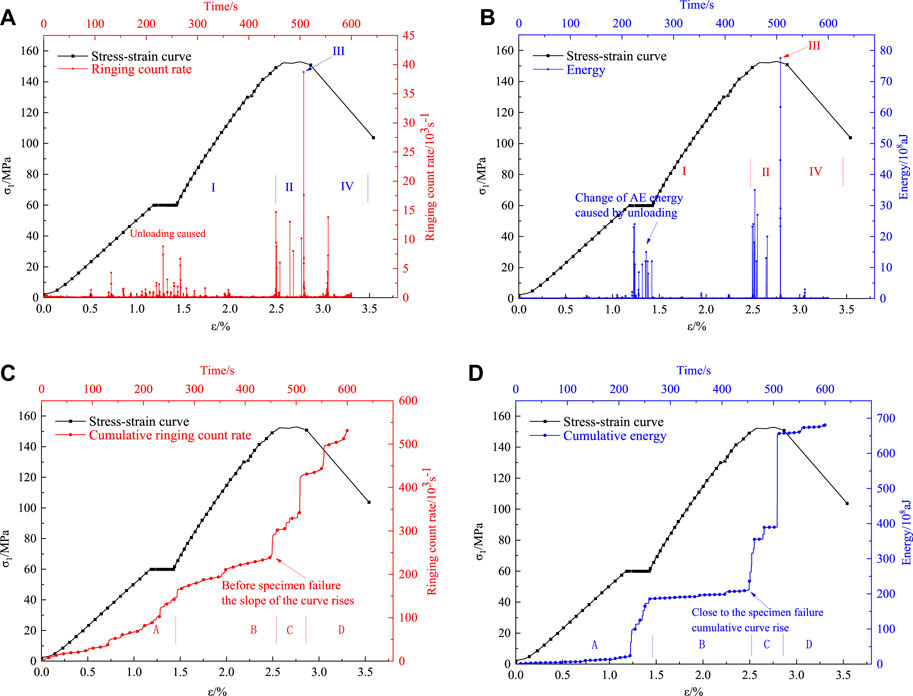
FIGURE 4. Relationship between AE parameters and time at 40 MPa. (A) Ringing count rate curve. (B) Absolute energy curve. (C) Cumulative ringing count rate curve. (D) Accumulated absolute energy curve.
According to Figures 4C, D, the cumulative curve rises faster and the slope is relatively steeper during the unloading period. Furthermore, the slope of the post-unloading cumulative curve is larger than that before unloading. Stage C marks the sudden increase period of the cumulative curve, which corresponds to the period of frequent AE the fluctuate AE characteristic in the frequent period, when manifested in the cumulative curve, shows a stair-stepping pattern. When the specimen is damaged, the cumulative curve rises steeply in a short time and then becomes approximately horizontal.
Similar to the above figures, Figure 5 shows the curves at an intermediate principal stress of 60 MPa. As shown in Figures 5A, B, the AE grows prominently during the unloading frequent periods. The first half of the frequent period is characterized by numerous increasing acoustic signals, indicating that the microcracks inside the rock specimen are highly developed. By comparison, the signals are sparse in the second half, which demonstrates that most of the internal microcracks are interconnected. This indicates that most of the micro-cracks inside the rock specimen have interconnected, and a large number of cracks hinder the propagation of acoustic signals within the rock, resulting in a decrease in AE signals. The starting point of the frequent period of the ringing count rate is 74 s away from the steep increase point, and the starting point of the frequent period of energy is 85 s away from the sudden increase point.
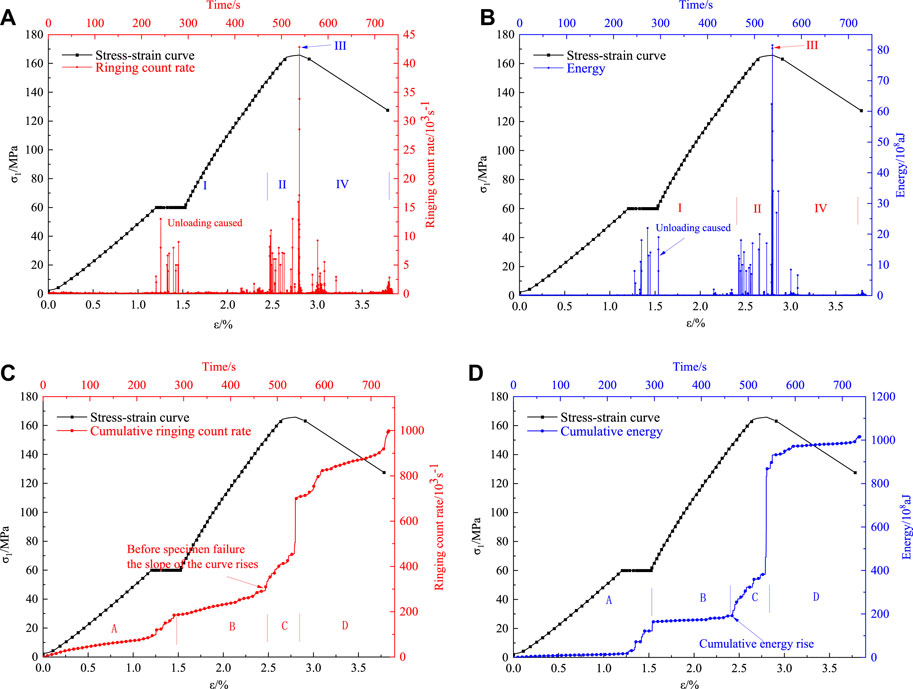
FIGURE 5. Relationship between AE parameters and time at 60 MPa. (A) Ringing count rate curve. (B) Absolute energy curve. (C) Cumulative ringing cumulative count rate curve. (D) Accumulated absolute energy curve.
As shown in Figures 5C, D, in the period before unloading, the cumulative curve is approximately horizontal, with a slow increase in the AE signal. However, unloading leads to a sudden increase in the AE signal, and the curve shows a stair-stepping-shape increase. Then, the signal remains generally stable. About 76 s before the specimen failure, the curve again rises in steps, followed by a steep and sudden increase. There are similarities and differences between the ringing count rate and energy curves. For the similarities, there are two stair-stepping-shape increase in the curve, and the post-unloading curve slope is higher than that before unloading. For the differences, first, the sudden increase period of energy is 2 s less than that of the ringing count rate. In addition, the energy grows more significantly than the ringing count rate when the cumulative curve rises steeply. Comparatively, the cumulative curves of ringing count rate and energy are similar in overall changing characteristics and rising patterns.
After comparison, this can be seen that the cumulative AE curve is more obviously segmented, which can better reflect the growth of AE signal at each period. The ringing count rate and absolute energy reflect the actual acoustic signal changes during the loading process as well as the development of microcracks within the rock at each moment. Both the two forms of AE have precursor information. Specifically, the ringing count rate and absolute energy focus on full process monitoring, while the cumulative counting approach focuses on the segmentation of the AE. By presenting the AE ringing count rate and energy as cumulative forms, the curves not only show segmented, but also emphasize AE anomalies at each period.
3.2 Comparative analysis of AE precursor information under different intermediate principal stresses
The characteristics of the AE during true triaxial loading and unloading of rock specimens under different intermediate principal stresses are analyzed in the above context. It is clear that the quiet, frequent and decrease periods of the ringing count rate and energy increase with the increase of intermediate principal stress, similar to the sudden increase and decrease periods in the cumulative counting curve.
Table 2 shows the comparative analysis of AE at various duration time periods under different intermediate principal stresses. This can be seen that the duration of the frequent periods of the AE ringing count rate and absolute energy both increase with the increase of the intermediate principal stress, and the duration of the sudden increase period of the cumulative count curve also increases with the increase of the intermediate principal stress. The detailed manifestations can be summarized as follows: the duration of the frequent periods of the ringing count rate is 24 s, 44 s, 51 s, 74 s, respectively, and that of the absolute energy is 23 s, 45 s, 51 s, 85 s, respectively. The duration of the sudden increase period of the cumulative ringing count curve is 25 s, 45 s, 52 s, 78 s, respectively, and that of the energy accumulation curve is 36 s, 44 s, 52 s, 76 s, respectively. Such regular variations in the AE frequency period and sudden increase period is due to the strength increase of the specimen associated with the increase of the intermediate principal stress. However, the stress threshold for the appearance of cracks within the specimen is unchanged; thus, the appearance time of the frequency period appears earlier with the increase of the intermediate principal stress. The sudden increase period in the cumulative count rate and cumulative energy curves corresponds to the AE frequency period, so that the earlier appearance of the sudden increase period is also observed with increasing intermediate principal stress. As the precursor information of rock failure, the occurrence of frequency period and sudden increase period become earlier with increasing intermediate principal stress.
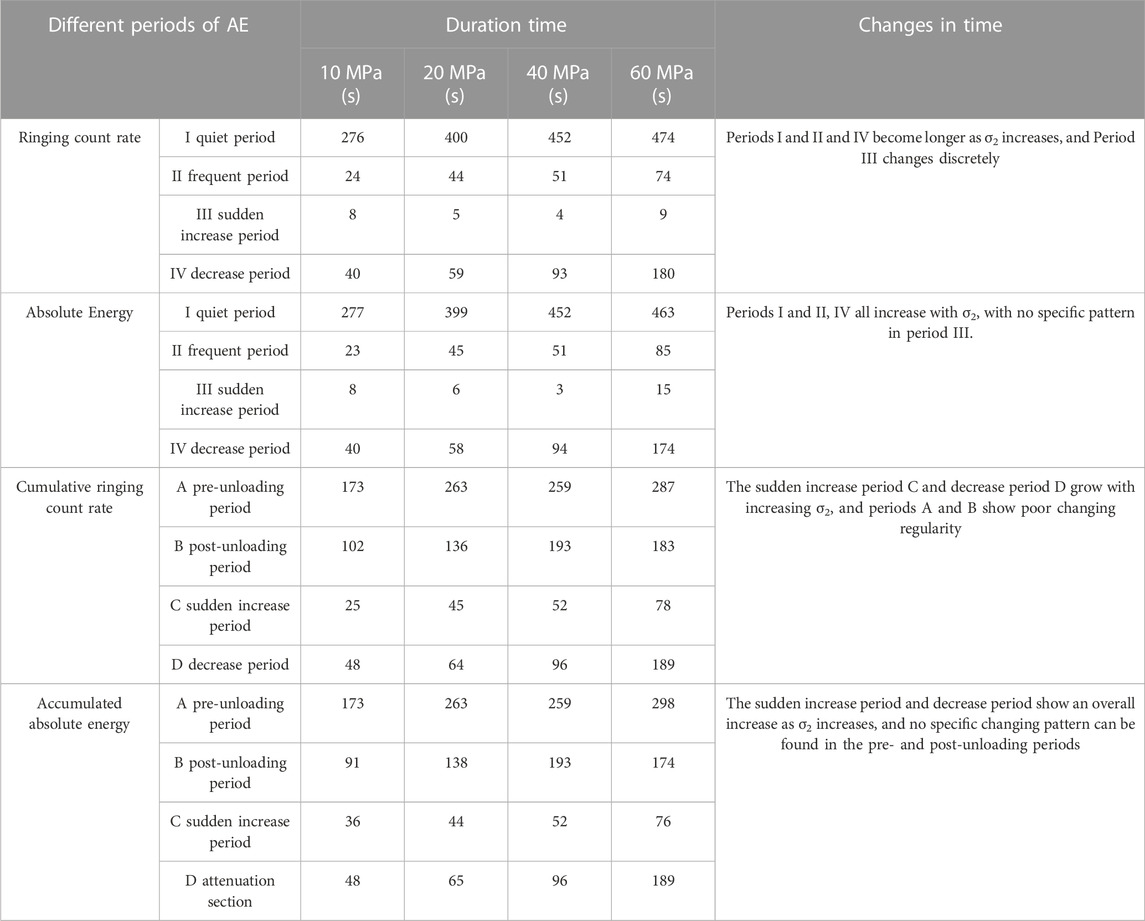
TABLE 2. Comparative analysis of the duration time of each period of AE at different intermediate principal stresses.
Due to the fact that the quiet, frequent, and decrease periods of the ringing count rate become longer as σ2 increases, the following equation was finally obtained by fitting the AE ringing count rate versus time curve (Figure 6):
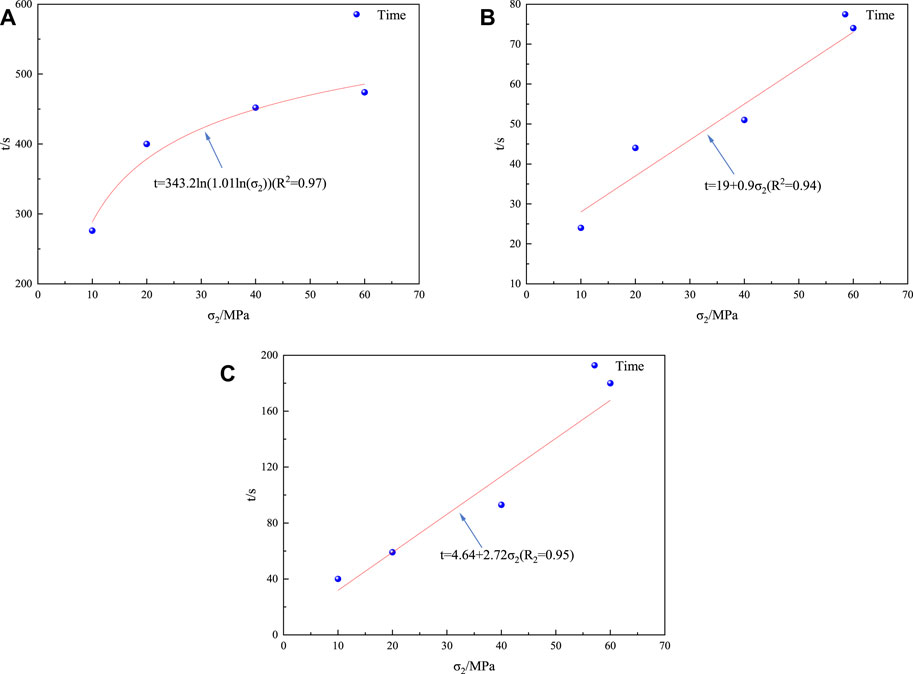
FIGURE 6. Fitted curve of σ2 versus time for each period of the ringing count rate. (A) Fitted curve of quiet period. (B) Fitted curve of frequent period. (C) Fitting curve of decrease period.
Likewise, since the quiet, frequent, and decrease periods of absolute energy become longer as σ2 increases, the absolute energy of AE versus time curve was fitted and the following equations were acquired (Figure 7):
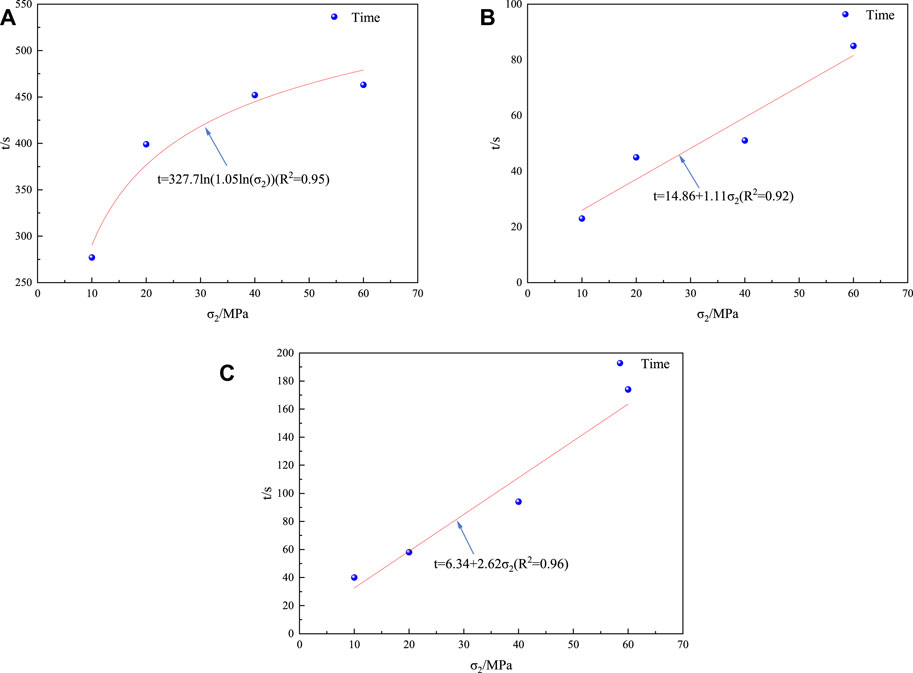
FIGURE 7. Fitted curve of σ2 versus time for each period of the absolute AE energy. (A) Fitted curve of quiet period. (B) Fitted curve of frequent period. (C) Fitted curve of decrease period.
In the similar fashion, the following equation was obtained by fitting the cumulative count rate of AE ringing versus time curve (Figure 8):
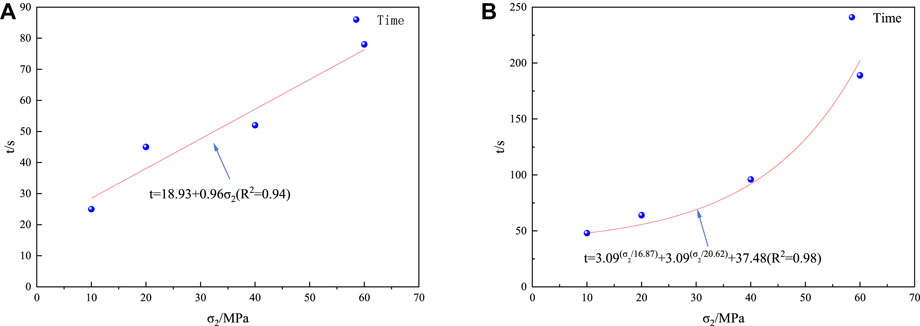
FIGURE 8. Fitted curve of σ2 versus time for each period of the cumulative ringing count rate. (A) Fitted curve of sudden increase period. (B) Fitted curve of decrease period.
Similarly, the following equation was obtained by fitting the cumulative ringing count rate versus time curve (Figure 9):
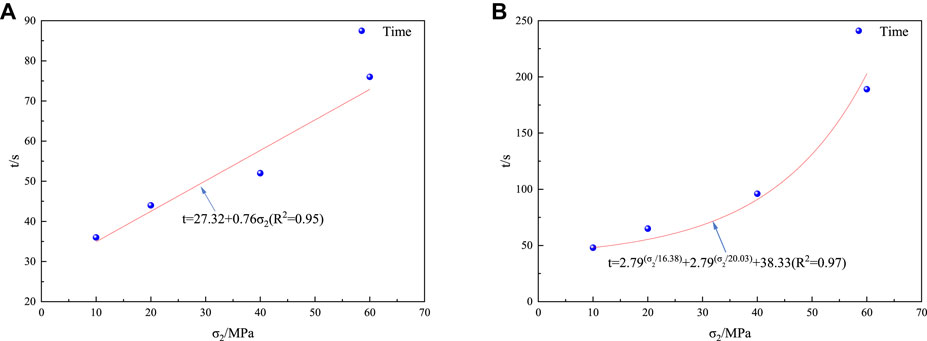
FIGURE 9. Fitted curve of σ2 versus time for each period of cumulative AE energy. (A) Fitted curve of the sudden increase. (B) Fitted curve of decrease period.
Based on the result that the duration of the frequent and sudden increase periods of AE increases with increasing intermediate principal stress, a comparative study of the changes in the mean and maximum values of the corresponding signals was carried out to probe how they are affected by changes in intermediate principal stress and to compare the magnitude of the signal values during the sudden increase period.
Figure 10 shows the comparative analysis of the AE signals during the frequent and sudden increase periods at different intermediate principal stresses, and the following conclusions can be drawn: 1) As the intermediate principal stress increases, the ringing count rate and energy during the frequent period continue to increase, with a larger increase in the maximum value and a smaller increase in the average value. 2) As the intermediate principal stress increases, the peak value of the AE signal also increases when the rock specimen is damaged. These characteristics of the AE signal associated with the change in intermediate principal stress can be attributed to the following reasons. First, the increase in intermediate principal stress increases the compressive strength of the rock, thereby further increasing the acoustic signal threshold during the development of cracks and leading to the increase in the AE signal value. In addition, as the intermediate principal stress increases, the strength of the rock specimen also increases. This leads to higher peak stress during specimen failure and a more vigorous failure process, resulting in a higher AE signal value.
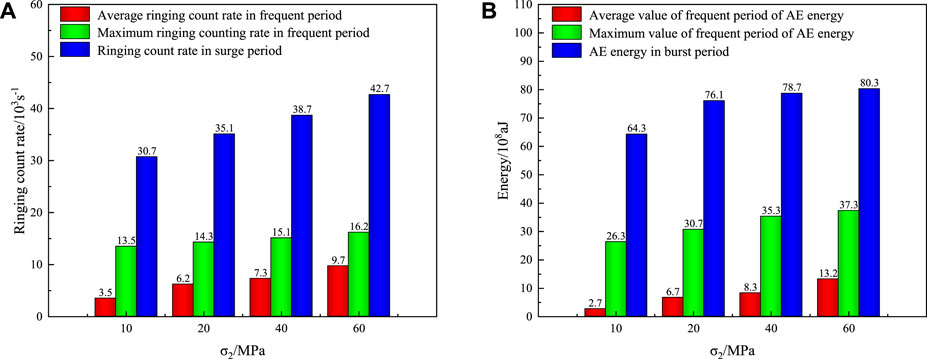
FIGURE 10. Comparison of signal values between frequent and sudden increase periods under different intermediate principal stresses. (A) Ringing count rate. (B) Absolute energy.
The occurrence moment and clarity of the frequent period control the reliability and priority of the precursor information. The above analysis of AE periods shows that the duration of frequency period is influenced by the magnitude of the intermediate principal stress. The higher the intermediate principal stress, the longer the AE frequency period, indicating that the first occurrence of the AE frequency period is longer from the moment of specimen failure. When the intermediate principal stress increases, both the average and maximum values of the AE signal during the frequency period increase, which greatly enhance the recognition effectiveness of AE precursor information. This shows that the reliability and priority of the AE precursor information increases with increasing intermediate principal stresses.
4 Discussion
The sudden increase in AE indicates that the rock specimen failure approaches, and the precursor information is obtained from the change in acoustic signal inside the rock. According to the theory of the thermoelastic effect, when an object is subjected to tensile stress, the object will release energy and its temperature will decrease. On the contrary, when it is subjected to compressive stress, the object will absorb energy with a temperature increase. Thermal infrared remote sensing technology can record thermal infrared information of specimens, which is utilized to explore and capture the characteristics of precursor information (Lou and He, 2018; Ma and Sun, 2018; Yin et al., 2021; Li et al., 2022). AE obtains precursor information from the interior of the rock, while thermal infrared imaging collects the information mainly from the rock surface. Therefore, this study investigates the precursor information of rock failure using both approaches.
Specifically, the AE monitoring of the true triaxial test was conducted and the FLIRSC305 infrared thermal imaging camera was also used to monitor the thermal image changes throughout the whole process. With these supports, the AE characteristics and thermal image anomaly evolution of the specimen failure process under different intermediate principal stress conditions were analyzed. The representative analysis results of red sandstone under 60 MPa are shown in Figure 11.
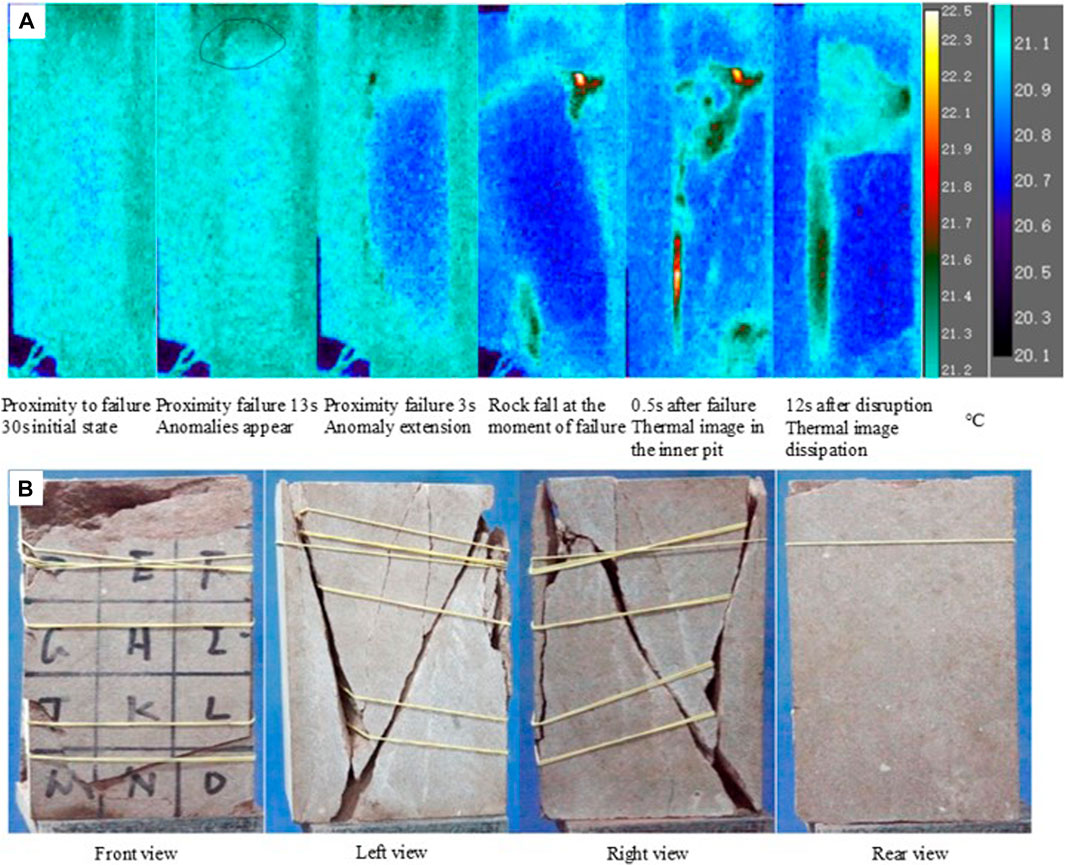
FIGURE 11. Morphological characteristics of rock fracture and the evolution of thermal infrared thermography of rock failure. (A) Thermal infrared image evolution under the unloading test on rock specimen. (B) Rock fracture morphology.
Figure 11A shows the evolution of the thermal infrared image on the unloading specimen free face when the intermediate principal stress is 60 MPa. It is clear that the first thermal abnormality that covers an area of 1.8 cm2 appears 13 s before the specimen failure, and then gradually expands to a maximum of about 45 cm2 before failure. Compared to the bright high temperature patches appeared under the previous smaller intermediate principal stress condition, the area under 60 MPa stress is larger and longer, with a broader development area. Figure 11B shows the fracture morphology of the rock at an intermediate principal stress of 60 MPa. The whole of the free face is ejected, forming a rupture surface of comparable size to the free face. The shear fracture zones on the left and right sides of the rock specimen are mainly “V” shaped and diagonally penetrated, with feather cracks in the diagonally penetrated shear zone, which are distributed around the shear zone and are secondary to the extrusive friction that occurs in the shear zone. The integrity of the back of the specimen is good after failure.
The results show that as the intermediate principal stress increases, the thermal abnormality appears earlier, the pre-failure maximum thermal abnormality area increases, and the recognition effectiveness of the thermal image precursor information also increases accordingly. During the thermal abnormality expansion process, the thermal image abnormality spans a large area, indicating that the main factor leading to the differential change of the thermal image precursor information is the change of the intermediate principal stress, while the unloading is less dominant in the process.
Table 3 shows the comparative analysis of the occurrence time of the AE and thermal infrared precursors under different intermediate principal stresses. It is notable that the thermal infrared image precursors appear the latest and are the closest to the moment of specimen failure. By comparison, the AE precursors appear the earliest and are the first response to rock failure. Overall, AE precursors appear prior to the thermal infrared precursors. The energy and ringing count rates of AE are similar, without showing a clear order of occurrence time. The above time difference can be attributed to the following reasons: 1) Thermal infrared image anomalies are caused by temperature changes on rock surface, and only when the temperature change amount reaches the threshold will it result in visibly anomalous changes in the thermal image 2) The frequent period of AE is caused by the sudden increase of the acoustic signal inside the rock, suggesting that a large number of microcracks have already developed inside the rock. Compared with the thermal infrared precursors, the AE ones are closer to the moment of rock failure. 3) Due to the unloading-triggered disturbance, the occurrence time of the frequent periods of AE ring count rate and energy shows no clear regularity. Furthermore, the duration of the two frequent periods is highly similar under low intermediate principal stress conditions, while the duration of the energy frequent period is slightly earlier when the intermediate principal stress increases.

TABLE 3. Occurrence time analysis of AE precursors compared with thermal infrared precursors under different intermediate principal stresses.
During the true triaxial loading and unloading test, the thermal imaging camera was used to monitor the temperature change-induced thermal abnormality on the unloading surface in order to warn rock failure. Meanwhile, AE instruments monitor the acoustic signal changes inside the rock to warn rock failure.
By fitting both AE and thermal infrared precursor information to the red sandstone at different intermediate principal stresses, linear relationships of time advanced and intermediate principal stresses for thermal infrared images, AE ringing count rate, and AE energy were obtained, and the final fitted equations were written as (Figure 12):
where t is the time advanced and σ2 denotes the intermediate principal stress.
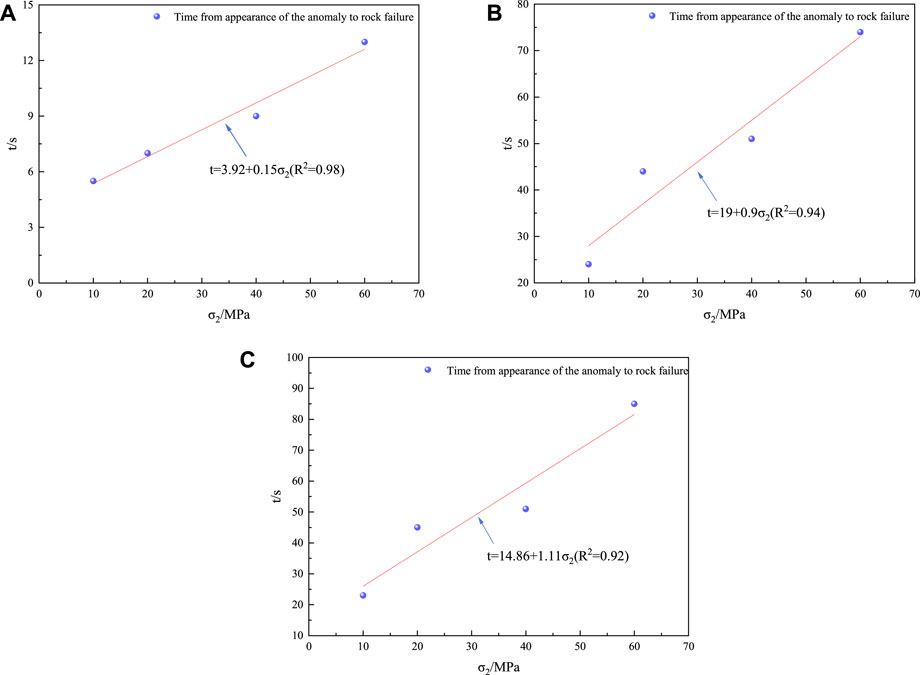
FIGURE 12. Fitting of AE and thermal infrared precursors for different intermediate principal stresses. (A) Thermal infrared imaging. (B) AE ringing count rate. (C) AE energy.
5 Conclusion
In this study, true triaxial unloading tests were conducted on red sandstone specimens under different intermediate principal stresses to analyze their AE characteristics, focusing on deciphering the corresponding relationship between failure precursors and different AE signals during the failure process. Furthermore, the AE precursor information are compared with the thermal infrared precursor information, and the following conclusions were obtained.
The characteristic curve of AE parameters has obvious phased characteristics. Both AE ringing count rate and energy versus time curves show four periods (i.e., quiet, frequent, sudden increase and decline periods). In addition, the cumulative count curve is divided into four periods, that is, pre-unloading period, post-unloading period, sharp increase period and the final decrease period.
The AE precursor information is mainly manifested by the frequent period and the sharp increase period in the cumulative counting process. Notably, as the intermediate principal stress increases, the frequent period of AE appears earlier with increased AE signal values. The sharp increase period also occurs earlier with increasing intermediate principal stress.
As the intermediate principal stress increases, the area of the anomalous patches of thermal infrared image increases, the first occurrence time of thermal infrared image becomes earlier, and the pre-failure maximum anomalous area of the specimen also increases. By comparing the thermal infrared and AE precursor information, it is prominent that the latter occurs prior to the former.
Data availability statement
The original contributions presented in the study are included in the article/supplementary material, further inquiries can be directed to the corresponding author.
Author contributions
All authors listed have made a substantial, direct, and intellectual contribution to the work and approved it for publication.
Funding
This study is supported by the National Natural Science Foundation of China (Grant Nos 41972284 and 42107211). This study is also supported by the Natural Science Foundation of Sichuan Province (Grant Nos 2022NSFSC1063 and 2022NSFSC1112) and State Key Laboratory of Geohazard Prevention and Geoenvironment Protection Independent Research Project (No. SKLGP 2020Z005). The authors would also like to thank the journal editor and anonymous reviewers for their valuable suggestions.
Conflict of interest
The authors declare that the research was conducted in the absence of any commercial or financial relationships that could be construed as a potential conflict of interest.
Publisher’s note
All claims expressed in this article are solely those of the authors and do not necessarily represent those of their affiliated organizations, or those of the publisher, the editors and the reviewers. Any product that may be evaluated in this article, or claim that may be made by its manufacturer, is not guaranteed or endorsed by the publisher.
References
Brantut, N., Schubnel, A., and Guéguen, Y. (2011). Damage and rupture dynamics at the brittle-ductile transition: The case of gypsum. J. Geophys. Res. Solid Earth 116 (B1), B01404. doi:10.1029/2010jb007675
Chang, C., and Haimson, B. (2012). “A failure criterion for rocks based on true triaxial testing,” in The ISRM suggested methods for rock characterization, testing and monitoring: 2007-2014 (Singaore, Singapore: Springer,Cham), 259–262.
Chen, G.-Q., Sun, X., Wang, J.-C., Wang, D., and Zhu, Z.-F. (2020). Detection of cracking behaviors in granite with open precut cracks by acoustic emission frequency spectrum analysis. Arab. J. Geosci. 13 (6), 258. doi:10.1007/s12517-020-5253-8
Dong, L., Zhang, L., Liu, H., Du, K., and Liu, X. (2022). Acoustic emission b value characteristics of granite under true triaxial stress. Mathematics 10 (3), 451. doi:10.3390/math10030451
Feng, X. -T., Zhang, X., Kong, R., and Wang, G. (2016). A novel Mogi type true triaxial testing apparatus and its use to obtain complete stress–strain curves of hard rocks. Rock Mech. Rock Eng. 49 (5), 1649–1662. doi:10.1007/s00603-015-0875-y
Fortin, J., Stanchits, S., Dresen, G., and Gueguen, Y. (2009). Acoustic emissions monitoring during inelastic deformation of porous sandstone: Comparison of three modes of deformation. Pure Appl. Geophys. 166 (5), 823–841. doi:10.1007/s00024-009-0479-0
Gao, Y.-H., Feng, X.-T., Zhang, X.-W., Feng, G.-L., Jiang, Q., and Qiu, S.-L. (2018). Characteristic stress levels and brittle fracturing of hard rocks subjected to true triaxial compression with low minimum principal stress. Rock Mech. Rock Eng. 51 (12), 3681–3697. doi:10.1007/s00603-018-1548-4
Kong, X., Wang, E., Hu, S., Shen, R., Li, X., and Zhan, T. (2016). Fractal characteristics and acoustic emission of coal containing methane in triaxial compression failure. J. Appl. Geophys. 124, 139–147. doi:10.1016/j.jappgeo.2015.11.018
Lei, X.-L. (2006). Typical phases of pre-failure damage in granitic rocks under differential compression. Geol. Soc. Lond. Spec. Publ. 261 (1), 11–29. doi:10.1144/gsl.sp.2006.261.01.02
Li, S., Hu, J., Amann, F., Li, L., Liu, H., Shi, S., et al. (2022). A multifunctional rock testing system for rock failure analysis under different stress states: Development and application. J. Rock Mech. Geotechnical Eng. 14, 1531–1544. doi:10.1016/j.jrmge.2021.12.017
Li, Y.-H., Liu, J.-P., Zhao, X.-D., and Yang, Y.-J. (2010). Experimental studies of the change of spatial correlation length of acoustic emission events during rock fracture process. Int. J. Rock Mech. Min. Sci. 47 (8), 1254–1262. doi:10.1016/j.ijrmms.2010.08.002
Lou, Q., and He, X. (2018). Experimental study on infrared radiation temperature field of concrete under uniaxial compression. Infrared Phys. Technol. 90, 20–30. doi:10.1016/j.infrared.2018.01.033
Ma, L., and Sun, H. (2018). Spatial-temporal infrared radiation precursors of coal failure under uniaxial compressive loading. Infrared Phys. Technol. 93, 144–153. doi:10.1016/j.infrared.2018.07.034
Ma, X., Rudnicki, J. W., and Haimson, B. C. (2017). The application of a Matsuoka-Nakai-Lade-Duncan failure criterion to two porous sandstones. Int. J. Rock Mech. Min. Sci. 92, 9–18. doi:10.1016/j.ijrmms.2016.12.004
Ma, Z. -Y., Liao, H. -J., and Dang, F. -N. (2014). Effect of intermediate principal stress on strength of soft rock under complex stress states. J. Central South Univ. 21 (4), 1583–1593. doi:10.1007/s11771-014-2099-9
Mogi, K. (1971). Fracture and flow of rocks under high triaxial compression. J. Geophys. Res. 76 (5), 1255–1269. doi:10.1029/jb076i005p01255
Moradian, Z., Einstein, H. H., and Ballivy, G. (2016). Detection of cracking levels in brittle rocks by parametric analysis of the acoustic emission signals. Rock Mech. Rock Eng. 49 (3), 785–800. doi:10.1007/s00603-015-0775-1
Su, G. -S., Jiang, Q., Zhai, S. -B., and Zhang, G. L. (2017). Influence of tunnel axis stress on strainburst: An experimental study. Rock Mech. Rock Eng. 50, 1551–1567. doi:10.1007/s00603-017-1181-7
Tyupkin, Y. S., and Di Giovambattista, R. (2005). Correlation length as an indicator of critical point behavior prior to a large earthquake. Earth Planet. Sci. Lett. 230 (1-2), 85–96. doi:10.1016/j.epsl.2004.10.037
Vachaparampil, A., and Ghassemi, A. (2017). Failure characteristics of three shales under true-triaxial compression. Int. J. Rock Mech. Min. Sci. 100, 151–159. doi:10.1016/j.ijrmms.2017.10.018
Wang, Z., Wu, Z., Chu, Z., Weng, L., Liu, Y., and Liu, Q. (2022). Study on mesoscopic failure mechanism of grout-infilled sandstone under uniaxial compression using an improved AE localization technique. Int. J. Rock Mech. Min. Sci. 160, 105275. doi:10.1016/j.ijrmms.2022.105275
Xu, D.-P., Liu, X.-Y., Jiang, Q., Li, S.-J., Zhou, Y.-Y., Qiu, S.-L., et al. (2022). A local homogenization approach for simulating the reinforcement effect of the fully grouted bolt in deep underground openings. Int. J. Min. Sci. Technol. 32 (2), 247–259. doi:10.1016/j.ijmst.2022.01.003
Xu, J., Jiang, J., Zuo, L., and Gao, Y. (2017). Acoustic emission monitoring and failure precursors of sandstone samples under various loading and unloading paths. Shock Vib. 2017, 1–11. doi:10.1155/2017/9760940
Yang, S.-Q., Jing, H.-W., and Wang, S.-Y. (2012). Experimental investigation on the strength, deformability, failure behavior and acoustic emission locations of red sandstone under triaxial compression. Rock Mech. rock Eng. 45 (4), 583–606. doi:10.1007/s00603-011-0208-8
Yin, S., Li, Z., Song, D., He, X., Qiu, L., Lou, Q., et al. (2021). Experimental study on the infrared precursor characteristics of gas-bearing coal failure under loading. Int. J. Min. Sci. Technol. 31 (5), 901–912. doi:10.1016/j.ijmst.2021.07.003
Zhang, Y., Feng, X.-T., Yang, C.-X., Han, Q., Wang, Z.-F., and Kong, R. (2021). Evaluation method of rock brittleness under true triaxial stress states based on pre-peak deformation characteristic and post-peak energy evolution. Rock Mech. Rock Eng. 54 (1), 1277–1291. doi:10.1007/s00603-020-02330-w
Zhang, Y., Feng, X.-T., Yang, C.-X., Zhang, X.-W., Sharifzadeh, M., and Wang, Z.-F. (2019). Fracturing evolution analysis of Beishan granite under true triaxial compression based on acoustic emission and strain energy. Int. J. Rock Mech. Min. Sci. 117, 150–161. doi:10.1016/j.ijrmms.2019.03.029
Zhao, J.-S., Chen, B.-R., Jiang, Q., Lu, J.-F., Hao, X. J., Pei, S.-F., et al. (2022a). Microseismic monitoring of rock mass fracture response to blasting excavation of large underground caverns under high geo-stress. Rock Mech. Rock Eng. 55, 733–750. doi:10.1007/s00603-021-02709-3
Zhao, J.-S., Jiang, Q., Lu, J.-F., Chen, B.-R., Pei, S.-F., and Wang, Z.-L. (2022b). Rock fracturing observation based on microseismic monitoring and borehole imaging: In situ investigation in a large underground cavern under high geo-stress. Tunn. Undergr. Space Technol. 126, 104549. doi:10.1016/j.tust.2022.104549
Keywords: loading and unloading, true triaxial test, acoustic emission, thermal infrared precursor information, failure
Citation: Liu S, Zheng H, Chen G, Hu Y and Meng K (2023) Acoustic emission precursor information of rock failure under true triaxial loading and unloading conditions. Front. Earth Sci. 11:1182413. doi: 10.3389/feart.2023.1182413
Received: 08 March 2023; Accepted: 21 April 2023;
Published: 09 May 2023.
Edited by:
Guangjin Wang, Kunming University of Science and Technology, ChinaReviewed by:
Gengshuo Zhang, The University of Queensland, AustraliaXiang Fan, Chang’an University, China
Copyright © 2023 Liu, Zheng, Chen, Hu and Meng. This is an open-access article distributed under the terms of the Creative Commons Attribution License (CC BY). The use, distribution or reproduction in other forums is permitted, provided the original author(s) and the copyright owner(s) are credited and that the original publication in this journal is cited, in accordance with accepted academic practice. No use, distribution or reproduction is permitted which does not comply with these terms.
*Correspondence: Haijun Zheng, emhhbmd5YW4yMDIwQGNkdXQuZWR1LmNu
 Sijie Liu
 Guoqing Chen