 Miaocong Cao
 Zhongyuan Gu*
- School of Investigation and Surveying Engineering, Changchun Institute of Technology, Changchun, China
Changbai jade is a type of jade ore with good economic value that is found in the tuff of the Upper Triassic Changbai Formation of the Mesozoic period in Jilin Province, China. However, the mineral composition of the kaolinite group in Changbai Jade has not been definitively identified, and there has been a lack of systematic mineralogical and spectral analysis. To analyze the mineralogical and spectroscopic characteristics of Changbai jade, this study utilized several modern testing methods, including X-ray fluorescence spectrometry (XRF), X-ray diffraction (XRD), scanning electron microscopy (SEM), energy dispersive spectrometry (EDS), Fourier transform infrared absorption spectroscopy (FTIR), Raman spectrum test (Raman), and Ultraviolet visible (UV-vis). Mineralogical and spectroscopic analyses were conducted on Changbai jade ore samples CB21 and CB22. The results indicated that the main metamorphic minerals of the two samples are dickite and the color-causing factor of the yellow part is pyrite. This research provides basic theoretical research data for jade processing technology and the geological origin of Changbai jade.
1 Introduction
Changbai jade, also known as Malu jade, is a type of seal stone that is produced in the village of Malugou in Changbai Mountain Korean Autonomous County in the Changbai Mountain Range in northeast China. It is known for its delicate and dense texture, and it comes in a range of colors including green, yellow, blue, dark brown, purple red, and gray white. It is often slightly transparent to translucent, and a few pieces are transparent. In recent years, as the market for collecting seal stones has grown, some artisans and craftsmen in Jilin Province have made trips to the mines to collect Changbai jade and create works of art with it. Changbai jade is highly prized for its beautiful color and texture, and it is often used to create crafts, sculptures, and other decorative items. It is also popular as a material for jewelry due to its hard texture, wear resistance, and ability to maintain its color over time. In addition to its use in decorative and jewelry applications, Changbai jade is also prized for its cultural and historical significance in China.
Changbai jade is produced in the Triassic Changbai Formation and is laminated and lenticular in shape. The production of the orebody is basically the same as the tuff layer and is strictly controlled by the light-colored volcanic clastic layer of the early Mesozoic era. It has a transitional relationship with surrounding rocks and a close spatial relationship with volcaniclastic rocks. The presence of gray-black tuffaceous sandstones and mudstones with micro-layering above and below the orebody indicates that the paleogeographic environment of the orebody is a semi-enclosed terrestrial water basin. The deposit is of the volcanic sedimentary-hydrothermal alteration type, and the orebody and ore-bearing layer were formed at the same time in the early Mesozoic. The volcanic tuff was subjected to late hydrothermal alteration to form the Changbai jade deposit.
In the past, the mineral composition of Changbai jade has been thought to be similar to that of Shoushan stone and Qingtian stone, primarily consisting of pyrophyllite and alum stone, with some scholars suggesting that it is mainly composed of kaolinite with a small amount of ground stone minerals (Liu et al., 2022). Chemical analysis has also revealed that Changbai jade has a high SiO2 composition and exhibits characteristics of kaolinite (Zhao et al., 2019). However, due to limited research and a traditional focus on resources and gemstones, there has been a lack of comprehensive and systematic studies on the mineralogy and spectra of Changbai jade.
The study of mineralogical characteristics of Changbai jade has guiding significance for mineral processing. Therefore, the mineralogical and spectral characteristics of Changbai jade samples were thoroughly analyzed using modern testing methods (Yang et al., 2007; Kurap et al., 2010; Chen et al., 2020; Zheng et al., 2020; Khan et al., 2022; Liu et al., 2022; Uddin et al., 2022) such as mineral identification, X-ray fluorescence spectrometry (XRF), X-ray diffraction (XRD), scanning electron microscopy (SEM), energy dispersive spectrometry (EDS), Fourier transform infrared absorption spectroscopy (FTIR), and Ultraviolet visible (UV-vis) in order to examine the mineral composition.
2 Materials and methods
2.1 Geology and materials
Typical samples of Changbai jade were taken from Changbai County, Jilin Province, China (Figure 1A). Changbai jade is found within the Upper Triassic Changbai Formation, located in Changbai County, Jilin Province. The Changbai Formation is primarily comprised of andesite, andesitic tuff, altered rhyolite, and altered rhyolite tuff. It is important to note that the formation’s lithology plays a significant role in the formation and distribution of Changbai jade. Therefore, a thorough understanding of the geological processes that led to the formation of the Changbai Formation is essential in understanding the origin and characteristics of Changbai jade.
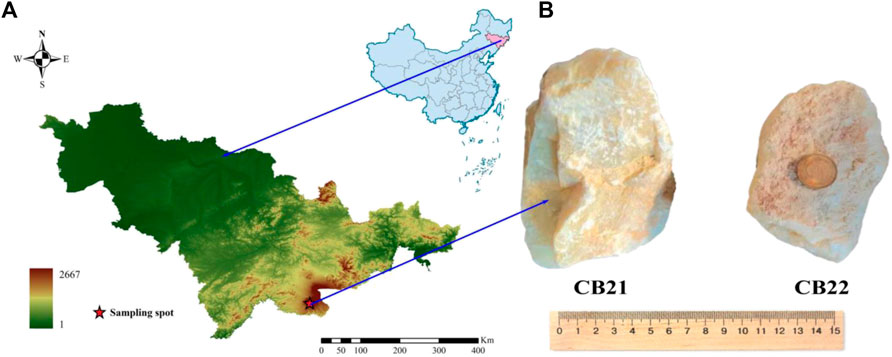
FIGURE 1. Geology and materials (A) Sampling area; (B) test sample.
The test samples, numbered CB21 and CB22 (Figure 1B), were obtained from the Malugou kaolinite deposit, which is located within the Changbai Formation. The ore body has a NW strike and a dip angle ranging from 10° to 20°. It is characterized as a stratiform and lentil-like deposit, with a total length of 1100 m, a width of 50 m, and a thickness ranging from 5 m to 30 m, with an average thickness of 13.69 m. The test samples were light gray and had a light-yellow scale, volcanic structure, cryptic structure, and massive structure, as well as a conch fracture and a grease luster. The refractive index of the samples is 1.58 and 1.56, the Mohs hardness is 2.5°, the fracture is shell-like, and the relative density is about 2.6 and 2.8.
2.2 Methods
The conventional gemological characteristics and spectral analysis methods and instruments (Figure 2) are as follows: Mineral characteristics of thin slices prepared from changbai jade were analyzed using a ZEISS analytical polarizing microscope; Panaco’s AXIOSmAX X-ray fluorescence spectrometer was used to analyze the chemical composition of the Changbai jade sample powder (Prandel et al., 2014). A German Broker AXS D8-Focus X-ray powder crystal diffractometer was used for phase analysis of Changbai jade powder samples (Geisler et al., 2016). The Ya-0019 environmental scanning electron microscope and energy spectrum were used for the test. The fresh port of the Changbai jade sample was used for the test after gold spraying, and the voltage was set to 20 kV. A Fourier Transform infrared spectrometer of German BRUKER VERTEX type 80 was used, with an instrument resolution of 4 cm−1, 32 scanning times, a scanning range of 400 cm−1–4000 cm−1, and potassium bromide pressing method was used (Onoue and Tsuji, 2013). The Ren-ishaw M2000 Raman spectrometer was used for Raman spectrum test, and the test range was 100–4000 cm−1 (Yang et al., 2022). This test instrument is Shimazu 37000DUV UV-Visible-near-infrared spectrophotometer. The surface of the sample was polished smooth and the reflection method was used for testing.
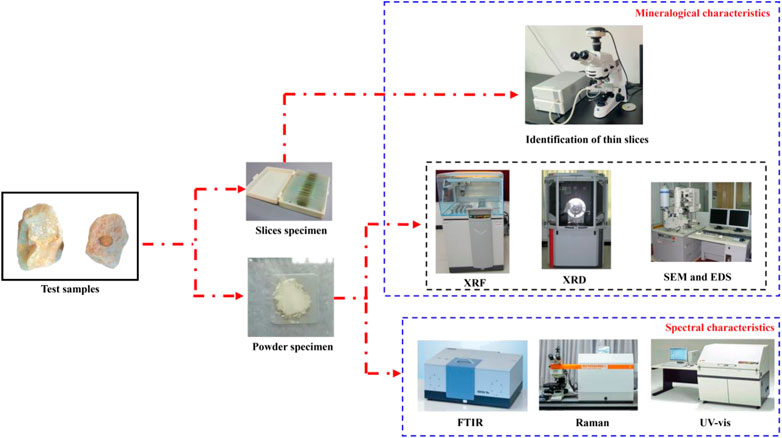
FIGURE 2. Test specimens and test equipment.
3 Result and discussions
3.1 Mineral composition and structural characteristics of Changbai jade
3.1.1 Identification of thin slices
The mineral characteristics of thin slices of Changbai jade were analyzed using a polarizing microscope (Figure 3).
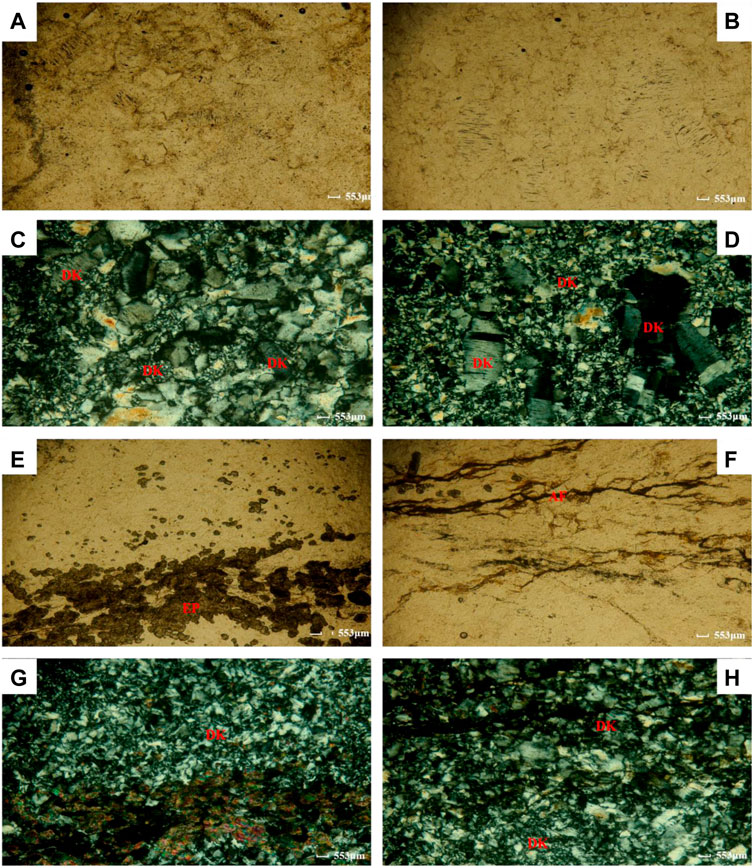
FIGURE 3. Thin section micrograph (A, B) Single polarizing image of sample CB21; (C, D) Orthogonal polarizing image of sample CB21; (E, F) Single polarizing image of sample CB22; (G, H) Orthogonal polarizing image of sample CB22; Ep-epidote, DK- dickite, AF- argillo ferruginous (Zhang et al., 2023)].
The samples of CB21 are primarily composed of columnar granular metamorphic dickite with a particle size of ≤0.5 mm and a minor amount of cryptocrystalline argillaceous material (Figure 3A; Figure 3B). The dickite is granular, with a few short columnar structures and low positive protrusions. It exhibits a first-order gray interference color (similar to quartz) and biaxial positive light under crystal (distinct from quartz) (Figure 3C; Figure 3D). The cryptocrystalline argillaceous material is distributed along the surface of some of the quarries and the rocks have a columnar granular metamorphic structure and a non-directional structure, indicating regional metamorphism. The metamorphic mineral is dickite, with the protolith being clay rock and the metamorphic facies being low greenschist.
The samples of CB22 are primarily composed of granular metamorphic dickite with a particle size of ≤ 0.1 mm, as well as epidote and a small amount of cryptocrystalline ferric argillaceous material (Figure 3E; Figure 3F). The dickite is granular in shape, with low positive protrusions and a gray interference color (similar to quartz). It exhibits biaxial positive light under crystal (distinct from quartz) and displays a mosaic pattern when viewed together. Epidote has high protrusions and a bright interference color, with most particles exhibiting a relatively fringe pattern locally (Figure 3G; Figure 3H). The cryptocrystalline ferric argillaceous deposits are relatively linear in a local area and the rocks have a granular and non-oriented structure, indicating regional metamorphism. The metamorphic mineral association consists of dickite and epidote, with the protolith being claystone and the metamorphic facies being low greenschist.
3.1.2 SEM-EDS
Based on SEM characterization (Figure 4), it can be observed that sample CB21 exhibits a cryptocrystalline structure with a lamellar shape and small particle size. When magnified to 500 times (Figure 4A), the particles present a semi-euhedral lamellar accumulation and pseudohexagonal lamellar crystals with crystal particles ranging from 5 to 50 μm in size. The overall crystallinity is high, and the crystal arrangement is dense. At a magnification of 2000 times (Figure 4B), complete particles with a fine grain size of 3–5 μm can be seen. In contrast, sample CB22 shows microscopic cryptocrystalline flakes and granules at 500 times magnification (Figure 4C), with a variety of grain sizes, disordered arrangement, and loose structure. At 2000 times magnification (Figure 4D), crystal scales can be seen stacked together, with various impurities distributed in different forms. Pseudohexagonal flakes, believed to belong to the kaolinite group minerals, are also present in the samples (Theiss et al., 2015; Ye et al., 2021).
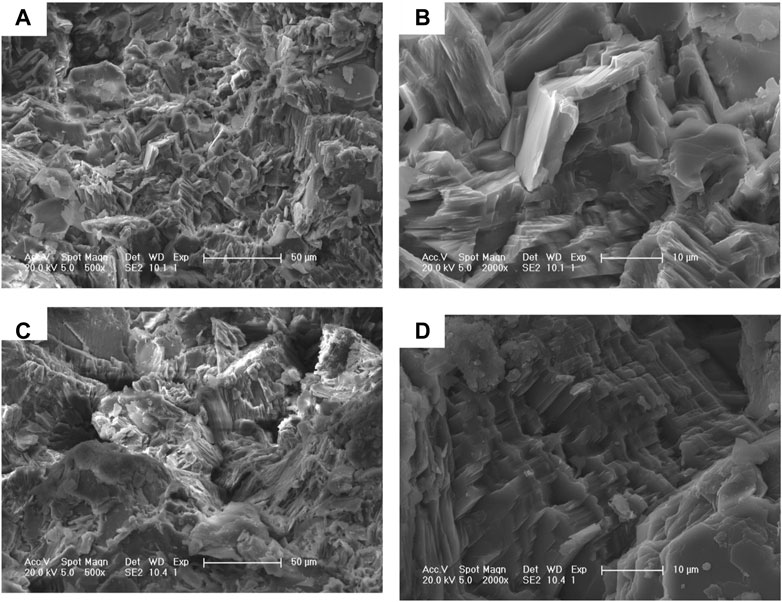
FIGURE 4. SEM (A) CB21(500x); (B) CB21(2000x); (C) CB22(500x); (D) CB22(2000x).
Given the structural similarities between CB21 and CB22 under SEM, only CB21 sections were selected for local microregional component analysis using EDS (Figure 5A). The SEM images of the sections reveal the presence of distinctive pseudohexagonal mineral particles in sample CB21. EDS microregional component analysis reveals that the main components of the uniform mineral area are Al, Si, and O (Figure 5B; Figure 5C). The presence of Au element can be attributed to the gold coating of the sample prior to testing, which is consistent with the composition characteristics of the kaolinite mineral group (Hazra et al., 2016).
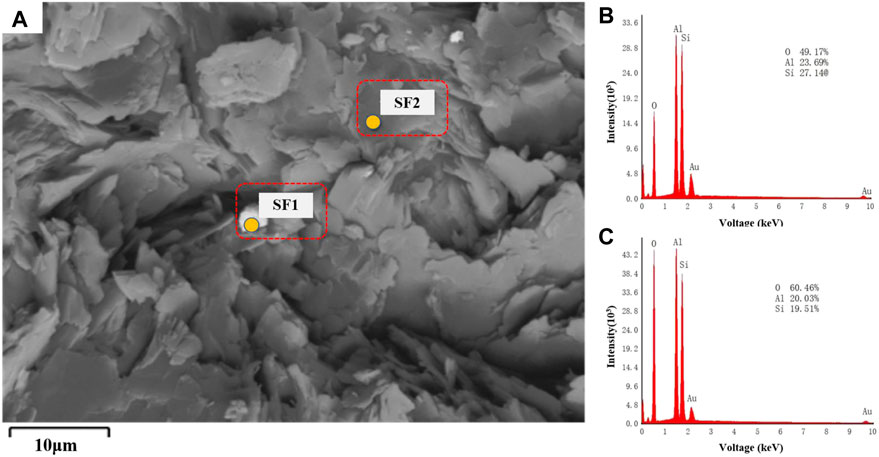
FIGURE 5. EDS (A) Backscattered electron image; (B) Energy spectrum of SF1; (C) Energy spectrum of SF2.
3.1.3 XRF
Spectrometry was used to analyze the chemical composition of samples CB21 and CB22, as shown in Table 1. Based on the results of thin section analysis, the main mineral composition of both samples is dickite, whose mineral chemical formula is Al4 [Si4O10](OH)8 (Yuan et al., 2022) and the theoretical chemical composition of it is w (Al2O3) = 38.1%–39.8%, w (SiO2) = 45.5%–46.1%, and w (H2O) = 13.5% (Zhao et al., 2023), where H2O represents both adsorbed and structural water. The main components of the tested samples are SiO2 and Al2O3, with SiO2 content at 43.23% and 45.70%, and Al2O3 content at 41.59% and 39.29% for samples CB21 and CB22, respectively, which are consistent with the theoretical values.

TABLE 1. Major element test.
Impurity components such as Na2O (CB21: 0.013%, CB22: 0.000%), K2O(CB21: 0.041%, CB22: 0.036%), TiO2 (CB21: 0.099%, CB22: 0.026%), TFe2O3 (CB21: 0.041%, CB22: 0.036%), MnO (CB21: 0.001%, CB22: 0.002%), MgO(CB21: 0.000%, CB22: 0.000%), P2O5(CB21: 0.224%, CB22: 0.118%), and CaO (CB21: 0.070%, CB22: 0.080%), which can affect the whiteness, sintering temperature, structural order, and crystallinity of the clay, only account for 0.4%–4%. This suggests that samples CB21 and CB22 have a high degree of order. Based on the analysis of mineral and rock chemical compositions, the mineral chemical compositions of samples CB21 and CB22 are consistent with dickite.
The genesis of the Changbai jade is mainly in the Triassic acidic clastic rocks and tuffs, and the Changbai Mountain area in Jilin was in a trough activity area during the Triassic period, where intense volcanic activity and tectonic movements led to multiple volcanic eruptions in eastern Jilin. The eruption and intrusion of acidic volcanic magma caused inevitable alteration of the surrounding rocks, which, together with the erosion and leaching of acidic hydrothermal fluids, caused elements such as K, Na, Ca, Fe, and Mg to be carried out of the rocks, leaving elements such as Al and Si that could not be easily carried away, forming dickite.
3.1.4 XRD
XRD is a useful technique for identifying the composition of layered silicates [23]. The XRD results of samples CB21 (Figure 6A) and CB22 (Figure 6B) show that there are four strongest peaks when 2θ ranges from 12° to 25°. The d = 7.2Å peak for CB21 is located at 2θ = 12.238°, with a secondary peak of d = 3.5 Å at 2θ = 24.851°. The diffraction peaks for layer spacing d = 4.4Å and 4.14Å are located at 2θ = 20.17° and 20.45°, respectively. Similarly, the d = 7.2Å peak for CB22 is located at 2θ = 12.229°, with a secondary peak of d = 3.5 Å at 2θ = 24.847°. The diffraction peaks for layer spacing d = 4.4 Å and 4.14 Å are located at 2θ = 20.16° and 20.42°, respectively. Based on the XRD results, it appears that the strong diffraction peaks between 2θ = 35°–40° for samples CB21 and CB22 are distinct from the two “mountain”-shaped peaks of kaolinite and the three combined diffraction peaks of pearly ceramite (Cuadros et al., 2014). This indicates that the major mineral composition of the samples is likely to be dickite.
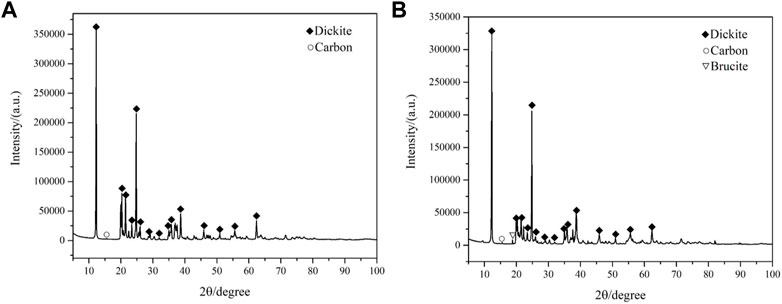
FIGURE 6. XRD (A) Test result of sample CB21; (B) Test result of sample CB22).
Based on the XRD results, it appears that both samples CB21 and CB22 contain the signature weak peak of C. If C exists in the form of a carbonate ([CO3]2-), the oxygen content would be insufficient to support the distribution of dicarboreal minerals and carbonates. Therefore, it is likely that C exists in the form of a single substance. In addition, the XRD results of sample CB22 show the presence of a signature weak peak for Mg(OH)2, which may be due to the regional geological characteristics of the sampling area, where brucite is typically found.
To confirm the results of the X-ray diffraction (XRD) analysis and identify the impurity polytypes present in the samples, the cell parameters of the minerals in the samples were examined using the Rietveld method. The results indicate that the cell parameters of samples CB21 and CB22 have a ≠ b ≠ c, with α = γ = 90° and β ≠ 90° (Table 2). This indicates that the dickite crystal system of the samples belongs to the monoclinic class and has a Cc(9) space group, suggesting that the samples have a similar degree of orderliness.
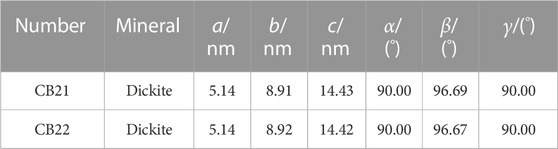
TABLE 2. Cell parameter test results.
3.2 Spectral characteristics of changbai jade
3.2.1 FTIR analysis
FTIR is particularly useful for the analysis of minerals, as it can provide information about the functional groups present in the sample, as well as the crystal structure and chemical composition (Bao et al., 2018).
FTIR can detect the presence of kaolinite group minerals and determine their chemical composition in Changbai jade (Lai et al., 2019). By analyzing the infrared spectra of samples CB21 and CB22, it is possible to identify the specific functional groups present in the samples and to compare them to known standards in order to determine the types of kaolinite minerals present. Additionally, the infrared spectra of the samples can provide information about isotropic substitution and stacking mode, which are important factors that can affect the physical and chemical properties of the minerals (Robinson et al., 2007). This information can be used to better understand the properties of Changbai jade and to inform future research on this material.
The infrared spectra of the fingerprint region (Figure 7A) show that the absorption peaks at 1 103 cm−1, 1 034 cm−1, 1 006 cm−1, 795 cm−1 are caused by Si-O stretching vibrations, the Si-O tetrahedral sheet has low effective symmetry, and the simplification and release of the splitting bands at 1034 cm−1, 1 006 cm−1. The absorption peaks at 914 cm−1 are caused by Al-O-H bending vibration, which is the result of Al and internal OH vibration; the absorption peaks at 755 cm−1, 698 cm−1, 541 cm−1 are attributed to Si-O-Al stretching vibration. The absorption peaks at 755 cm−1, 698 cm−1, and 541 cm−1 are attributed to Si-O backbone bending vibration; the absorption peaks at 471 cm−1 and 430 cm−1 are attributed to Si-O backbone bending vibration (Johnston et al., 2008).
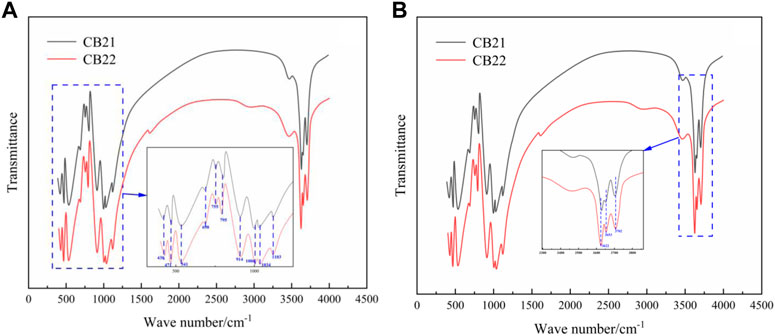
FIGURE 7. Infrared spectroscopy test (A) fingerprint region; (B) Functional region).
Infrared spectra in functional region were obtained for CB21 and CB22 samples, as shown in Figure 7B. There are four non-equivalent hydroxyl groups (OH) in the crystal structure of kaolinitic group minerals. Among them, OH1 is internal hydroxyl, while OH2, OH3, and OH4 are internal surface hydroxyl (Cuadros et al., 2015). The infrared spectra of the three polymorphic variants of dickite, pearly ceramite, and standard kaolinite are similar in the fingerprint region, with only slight deviations in peak position. In the high frequency region, however, there are significant differences in the infrared absorption peaks caused by the vibrations of the four unequal hydroxyl groups. For example, standard kaolinite exhibits four decreasing absorption peaks between 3550 cm−1 and 3750 cm−1 due to OH group vibrations. In contrast, the infrared spectrum of dickite features two merged peaks at 3672 cm−1 and 3622 cm−1, resulting in three distinct absorption peaks that are a defining characteristic of dickite. The number, position, and intensity of peaks can be used to distinguish dickite and other kaolinite minerals (Zhong et al., 2018). These spectra show that both samples exhibit three bands at 3622 cm−1, 3653 cm−1, and 3702 cm−1, with the peak intensity decreasing towards higher frequencies and clear splitting.
The absorption peaks at 3702 cm−1, 3653 cm−1 and 3622 cm−1 represent characteristic absorption peaks of dickite, due to the stretching vibration of the hydroxyl groups. The absorption peak at 3622cm−1 was caused by the stretching vibration of the inner hydroxyl group OH1. The length of the hydrogen bond formed by OH2 and OH4 on the inner surface is very close, and the absorption peak at 3653 cm−1 is caused by the stretching vibration (Wang et al., 2013). The absorption peak of 3702 cm−1 was caused by stretching vibration of OH3. When the three absorption peaks are arranged in a stepped pattern, that is, the vibration peak intensity at 3702 cm−1 is weak and the vibration peak intensity at 3622 cm−1 is high, the higher the degree of order is. On the whole, CB21 and CB22 both show the infrared spectral characteristics of ordered dickite.
3.2.2 Raman
The yellow and white parts of samples CB21 and CB22 were tested by Raman spectroscopy, and the yellow parts of samples CB21 and CB22 were tested by Raman spectroscopy as shown in Figure 8A and Figure 8D, and the obtained spectral peaks are multi-mineral mixed peaks due to the fine minerals. Among them, the Raman shifts at 302 cm−1 and 384 cm−1 are pyrite. The 558 cm−1 broad peak is the epidote characteristic Raman peak; 1078 cm−1 is the typical Raman peak of calcite, and 1370 cm−1 and 1530 cm−1 Raman peaks of graphite can also be seen in the samples.
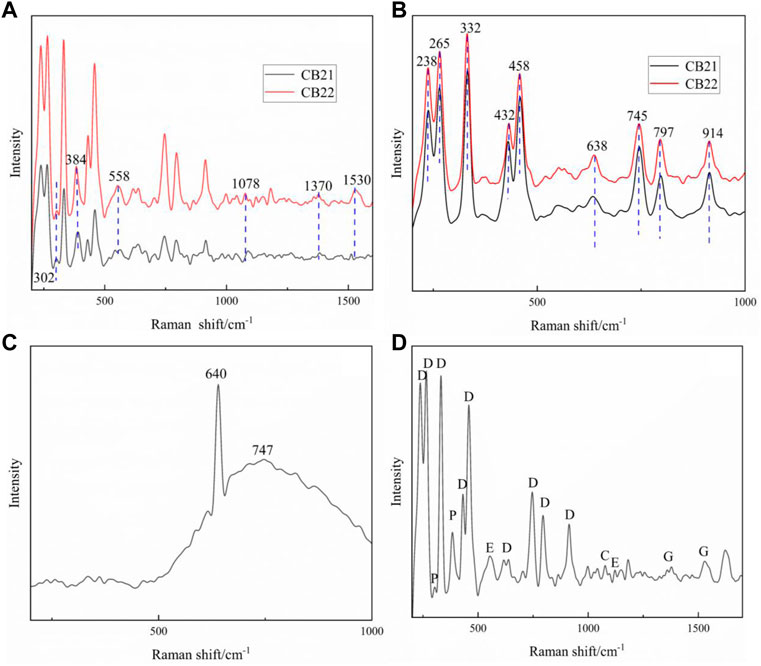
FIGURE 8. Raman spectra of samples (A) Raman spectral analysis of white part of the sample; (B) Raman spectral analysis of yellow part of the sample; (C) Raman spectral analysis of weathering layer CB22; (D) Multi-mineral mixing peak of CB22, D:dickite, E: epidote, P: pyrite, C: calcite, G: graphite).
The white part of CB21 and CB22 is the pure dickite (Figure 8B), and the characteristic base spectral peak is 238 cm−1, 265 cm−1, 332 cm−1, 432 cm−1, 458 cm−1, 638 cm−1, 745 cm−1, 797 cm−1, 914 cm−1. The 600–900 cm−1 spectral peak is generated by OH vibration, and 638 cm−1 is attributed to the stretching vibration of hydroxyl group in (AlAl)O-OH group. 745 cm−1, 797 cm−1 and 914 cm−1 are attributed to the bending vibration of the hydroxyl group in the (SiSi)O-OH, (SiAl)O-OH and (AlAl)O-OH groups, respectively. The fundamental frequency peaks of 432 cm−1 and 458 cm−1 are attributed to the flexion vibration of Si-O, while 238 cm−1 and 265 cm−1 are attributed to the translational vibration of hydroxyl group (OH) (Luo et al., 2022).
In addition, a strong and sharp Raman peak of 640 cm−1 and a wide peak of 747 cm−1 were detected on the weathered surface of sample CB22 (Figure 8C), which should be superorganic clay minerals corresponding to the iron mud identified in the thin section of sample CB22 and attributed to the stretching vibration of [AlO6] group (Arslanlar et al., 2011; Wang et al., 2015; Ma et al., 2022).
3.2.3 UV-vis
The UV-Vis spectra (Figure 9) of the white and yellow parts of the samples show strong absorption peaks at 651 nm, 944 nm, 985 nm, a broad absorption band centered at 650 nm, several weak absorption peaks in the 600–800 nm region and weak absorption at 432 nm. The UV-vis spectra of samples CB21 and CB22 are basically the same, and it is presumed that the absorption peaks at 428 nm, 588 nm and 660 nm are related to Fe. Although the absorption peaks of the samples from the white flesh part and the yellow flesh part of the Changbai jade are basically the same, the reflectance of the yellow flesh part is significantly higher than that of the white flesh part in the red region, and the absorption in the blue region is stronger than that of the white flesh part, leading to the color difference (Zhao et al., 2014; Zhang and Shi, 2022). The UV-Vis and Raman spectroscopy test results and the previous test results were analyzed together, and the main color-causing factor of the yellow part of the sample was the impurity mineral pyrite color-causing.
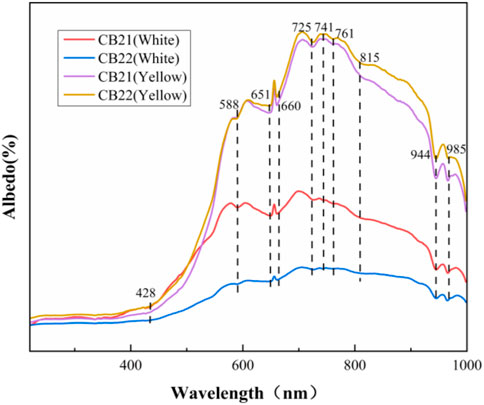
FIGURE 9. Ultraviolet spectrum analysis.
4 Conclusion
This paper examines the mineral composition and spectral characteristics of Changbai jade samples, and successfully identified the mineralogical characteristics of Changbai jade, providing a theoretical foundation for the scientific identification and quality evaluation of hard long white jade in the future. Furthermore, this study has the potential to enhance people’s understanding, development, and utilization of Changbai jade. It is important to note that the findings of this research can contribute to the development of effective mining and processing techniques, as well as the promotion of sustainable utilization of this valuable mineral resource. The main conclusions are as follows.
(1) A polarizing microscope was used to analyze the mineral characteristics of a thin section of long white jade, and the mineral composition of the dickite was clearly observed. The microscopic characteristics of the minerals in the long white jade sample were analyzed using SEM and EDS. The SEM images showed distinct characteristics of kaolinite group minerals. The EDS results indicated that the main components of the uniform mineral area were Al, Si, and O, which are consistent with the composition characteristics of the kaolinite mineral group.
(2) The chemical composition of powder samples of long white jade was analyzed using XRF. The SiO2 content in the long white jade samples was found to be 43.23% and 45.70%, while the Al2O3 content was mainly 41.59% and 39.29%. These results are consistent with the theoretical chemical composition of dickite. And the X-ray diffraction (XRD) results for the two long white jade samples show that (as shown in Figure 5), the XRD patterns of samples CB21 and CB22 have four strongest peaks within a 2θ range of 12°–25°. This further confirms that the main mineral composition of Changbai jade samples CB21 and CB22 is dickite.
(3) FTIR results in the fingerprint region show that the characteristic base spectral peak is 238 cm−1, 265 cm−1, 332 cm−1, 432 cm−1, 458 cm−1, 638 cm−1, 745 cm−1, 797 cm−1, 914 cm−1 and three bands at 3628 cm−1, 3655 cm−1, and 3710 cm−1 in functional region, which are consistent with the characteristic peaks of ordered dickite. Based on these results, it was determined that the kaolinite group minerals in Changbai jade are dickite.
(4) Raman spectrum analysis of the sample was carried out. the white part of CB21 and CB22 is the pure dickite, and the characteristic base spectral peak is 238 cm−1, 265 cm−1, 332 cm−1, 432 cm−1, 458 cm−1, 638 cm−1, 745 cm−1, 797 cm−1, 914 cm−1. The yellow parts of samples CB21 and CB22 were tested by Raman spectroscopy obtained spectral peaks are multi-mineral mixed peaks due to the fine minerals, the Raman shifts at 302 cm−1 and 384 cm−1 are pyrite. The 558 cm−1 broad peak is the epidote characteristic Raman peak; 1078 cm−1 is the typical Raman peak of calcite, and 1370 cm−1 and 1530 cm−1 Raman peaks of graphite can also be seen in the samples.
(5) The UV-Vis spectra of the white and yellow parts of the samples show strong absorption peaks at 651 nm, 944 nm, 985 nm, a broad absorption band centered at 650 nm, several weak absorption peaks in the 600–800 nm region and weak absorption at 432 nm. It can be considered that the color factor of the yellow part of the sample is pyrite.
Data availability statement
The datasets presented in this study can be found in online repositories. The names of the repository/repositories and accession number(s) can be found in the article/Supplementary Material.
Author contributions
MC: Investigation, Data Curation, Methodology, Writing-Original Draft, Funding acquisition. ZG: Conceptualization, Investigation, Data Curation, Writing-Review and Editing, Funding acquisition.
Funding
This work was supported by the Jilin Province Educational Department Scientific Research Planning Project (Grant Nos JJKH20210669KJ and JJKH20230723KJ), and Changchun Institute of Technology Science and Technology Foundation Project (320210001).
Conflict of interest
The authors declare that the research was conducted in the absence of any commercial or financial relationships that could be construed as a potential conflict of interest.
Publisher’s note
All claims expressed in this article are solely those of the authors and do not necessarily represent those of their affiliated organizations, or those of the publisher, the editors and the reviewers. Any product that may be evaluated in this article, or claim that may be made by its manufacturer, is not guaranteed or endorsed by the publisher.
References
Arslanlar, Y. T., Garcia-Guinea, J., Kibar, R., Cetin, A., Ayvacikli, M., and Can, N. (2011). Luminescence behavior and Raman characterization of jade from Turkey. Appl. Radiat. Isotopes 69 (9), 1299–1306. doi:10.1016/j.apradiso.2011.05.011
Bao, Y., Zhao, C. H., Li, Y. S., and Yun, X. M. (2018). A method of determining heated ancient nephrite jades in China. Sci. Rep. 8, 13523. doi:10.1038/s41598-018-30564-w
Chen, Q., Chen, T., Yan, X. J., Wang, C. W., Zheng, J. Y., and Li, M. Y. (2020). Mineralogical and spectroscopic study on the similar species of chicken-blood stone. Spectrosc. Spectr. Analysis 40 (10), 3179–3184. doi:10.3964/j.issn.1000-0593(2020)10-3179-06
Cuadros, J., Vega, R., Toscano, A., and Arroyo, X. (2014). Kaolinite transformation into dickite during burial diagenesis. Am. Mineralogist 99 (4), 681–695. doi:10.2138/am.2014.4614
Cuadros, J., Vega, R., and Toscano, A. (2015). Mid-infrared features of kaolinite-dickite. Clays Clay Minerals 63 (1-2), 73–84. doi:10.1346/ccmn.2015.0630201
Geisler, T., Popa, K., and Konings, R. J. M. (2016). Evidence for lattice strain and non-ideal behavior in the (La1-xEux)PO4 solid solution from xray diffraction and vibrational spectroscopy. Front. Earth Sci. 4, 12. doi:10.3389/feart.2016.00064
Hazra, B., Varma, A. K., Bandopadhyay, A. K., Chakravarty, S., Buragohain, J., Samad, S. K., et al. (2016). FTIR, XRF, XRD and SEM characteristics of Permian shales, India. J. Nat. Gas Sci. Eng. 32, 239–255. doi:10.1016/j.jngse.2016.03.098
Johnston, C. T., Kogel, J. E., Bish, D. L., Kogure, T., and Murray, H. H. (2008). Low-temperature FTIR study of kaolin-group minerals. Clays Clay Minerals 56 (4), 470–485. doi:10.1346/ccmn.2008.0560408
Khan, R. A., Anwar-Ul-Haq, M., Qasim, M., Afgan, M. S., Haq, S. U., and Hussain, S. Z. (2022). Spectroscopic and crystallographic analysis of nephrite jade gemstone using laser induced breakdown spectroscopy, Raman spectroscopy, and X-ray diffraction. Heliyon 8 (11), e11493. doi:10.1016/j.heliyon.2022.e11493
Kurap, G., Akyuz, S., Akyuz, T., Basaran, S., and Cakan, B. (2010). FT-IR spectroscopic study of terra-cotta sarcophagi recently excavated in Ainos (Enez) Turkey. J. Mol. Struct. 976 (1-3), 161–167. doi:10.1016/j.molstruc.2010.04.009
Lai, M., Liao, Z. T., Zhou, Z. Y., Kao, C. S., Li, Y. B., and Wang, H. (2019). Uses of near-infrared transmission spectra for the identification of hydrothermal kaolinite, dickite and kaolinite-dickite. Spectrochimica Acta Part a-Molecular Biomol. Spectrosc. 208, 179–184. doi:10.1016/j.saa.2018.09.063
Liu, X. Y., Yang, J. C., and Chen, Q. L. (2022). Study on spectral characteristics and color origin of scheelite from xuebaoding, pingwu county, sichuan Province, PR China. Minerals 12 (11), 1344. doi:10.3390/min12111344
Luo, J., Yue, S. W., Guo, H. Y., and Liu, J. J. (2022). Spectroscopic characteristics and coloring mechanism of smithsonite jade. Spectrosc. Spectr. Analysis 42 (6), 1886–1890. doi:10.3964/j.issn.1000-0593(2022)06-1886-05
Ma, P., Shen, A. H., Zhong, Y., and Luo, H. (2022). Study on UV-vis absorption spectra of jadeite from different origins. Spectrosc. Spectr. Analysis 42 (6), 1827–1831. doi:10.3964/j.issn.1000-0593(2022)06-1827-05
Onoue, F., and Tsuji, K. (2013). X-ray elemental imaging in depth by combination of FE-SEM-EDS and glow discharge sputtering. Isij Int. 53 (11), 1939–1942. doi:10.2355/isijinternational.53.1939
Prandel, L. V., Saab, S. C., Brinatti, A. M., Giarola, N. F. B., Leite, W. C., and Cassaro, F. a. M. (2014). Mineralogical analysis of clays in hardsetting soil horizons, by X-ray fluorescence and X-ray diffraction using Rietveld method. Radiat. Phys. Chem. 95, 65–68. doi:10.1016/j.radphyschem.2012.12.017
Robinson, T. L., Michalkova, A., Gorb, L., and Leszczynski, J. (2007). Hydrogen bonding of thymine and uracil with surface of dickite: An ab initio study. J. Mol. Struct. 844, 48–58. doi:10.1016/j.molstruc.2007.03.002
Theiss, F. L., Lopez, A., Scholz, R., and Frost, R. L. (2015). A SEM, EDS and vibrational spectroscopic study of the clay mineral fraipontite. Spectrochimica Acta Part a-Molecular Biomol. Spectrosc. 147, 230–234. doi:10.1016/j.saa.2015.03.088
Uddin, M. R., Khandaker, M. U., Akter, N., Ahmed, M. F., Hossain, S. M. M., Gafur, A., et al. (2022). Identification and economic potentiality of mineral sands resources of hatiya island, Bangladesh. Minerals 12 (11), 1436. doi:10.3390/min12111436
Wang, K., Dong, J. Q., Zhao, H. X., Gan, F. X., Hu, Y. Q., and Fan, W. Q. (2015). The non-destructive analysis of some ancient jade artifacts unearthed from henan Province by a variety of optical techniques. Spectrosc. Spectr. Analysis 35 (9), 2492–2499. doi:10.3964/j.issn.1000-0593(2015)09-2492-08
Wang, Y. Y., Gan, F. X., and Zhao, H. X. (2013). Inclusions of black-green serpentine jade determined by Raman spectroscopy. Vib. Spectrosc. 66, 19–23. doi:10.1016/j.vibspec.2013.01.008
Yang, J., Qiu, Z. L., Sun, B., Gu, X. Z., Zhang, Y. F., Gao, M. K., et al. (2022). Enhanced development of sweat latent fingerprints based on Ag-loaded CMCS/PVA composite hydrogel film by electron beam radiation. Spectrosc. Spectr. Analysis 42 (2), 446–453. doi:10.3390/gels8070446
Yang, L., Mashkovtsev, R., Botis, S., and Pan, Y. M. (2007). Multi-spectroscopic study of green quartzite (guizhou jade) from the qinglong antimony deposit, guizhou Province, China. J. China Univ. Geosciences 18, 327–329.
Ye, X. M., Bai, F., Li, M. Y., and Sun, H. (2021). Gemology, mineralogy, and spectroscopy of an attractive tremolitized diopside anorthosite gem material from the Philippines: A new type of material with similarities to dushan jade. Minerals 11 (2), 152. doi:10.3390/min11020152
Yuan, P. Y., Zhao, Y., Xu, B., and Shen, J. Q. (2022). A study on the mineralogy and volatile fraction of scapolite from mogok, Myanmar. Crystals 12 (12), 1779. doi:10.3390/cryst12121779
Zhang, C., Yang, F., Yu, X. Y., Liu, J. H., Carranza, E. J. M., Chi, J., et al. (2023). A nomogram model to predict the acute venous thromboembolism risk after surgery in patients with glioma. Front. Earth Sci. 11, 21–31. doi:10.1016/j.thromres.2023.02.002
Zhang, Y., and Shi, G. H. (2022). Origin of blue-water jadeite jades from Myanmar and Guatemala: Differentiation by non-destructive spectroscopic techniques. Crystals 12 (10), 1448. doi:10.3390/cryst12101448
Zhao, H. X., Li, Q. H., Liu, S., Hu, Y. Q., and Gan, F. X. (2014). Nondestructive analysis of jade artifacts from the Cemetery of the Ying State in Henan Province, China using confocal Raman microspectroscopy and portable X-ray fluorescence spectroscopy. J. Raman Spectrosc. 45 (2), 173–178. doi:10.1002/jrs.4435
Zhao, J. J., Liu, Q. B., Ma, J., Zhou, X. Y., Wang, Z. G., and Zhao, B. F. (2019). The Changbai Mountain god temple site of the jin dynasty in antu county, Jilin. Chin. Archaeol. 19 (1), 52–63. doi:10.1515/char-2019-0004
Zhao, Z. Y., Lin, Y. T., Zhao, Y., and Xu, B. (2023). Mineralogical characteristics study of calcite from the fujian Province, China. Crystals 13 (1), 51. doi:10.3390/cryst13010051
Zheng, J. Y., Chen, T., Chen, Q., Li, M. Y., and Yao, C. M. (2020). Mineralogical and spectroscopic characteristics of "ivory jade" from tibet. Spectrosc. Spectr. Analysis 40 (9), 2908–2912. doi:10.3964/j.issn.1000-0593(2020)09-2908-05
Keywords: Changbai jade, chromogenic mechanism, modern test method, spectroscopic, mineralogical
Citation: Cao M and Gu Z (2023) Mineralogical and spectral characteristics of Changbai jade, Jilin province, Northeast China. Front. Earth Sci. 11:1183522. doi: 10.3389/feart.2023.1183522
Received: 10 March 2023; Accepted: 20 April 2023;
Published: 09 May 2023.
Edited by:
Ali Abedini, Urmia University, IranCopyright © 2023 Cao and Gu. This is an open-access article distributed under the terms of the Creative Commons Attribution License (CC BY). The use, distribution or reproduction in other forums is permitted, provided the original author(s) and the copyright owner(s) are credited and that the original publication in this journal is cited, in accordance with accepted academic practice. No use, distribution or reproduction is permitted which does not comply with these terms.
*Correspondence: Zhongyuan Gu, Z3V6aG9uZ3l1YW5AY2NpdC5lZHUuY24=