 Simon Lloyd1*
 Andy Biggin1
 Mimi Hill1
 Lennart De Groot2
 Neil Suttie3
 Joseph Morris1
 Harald Boehnel4John Shaw1
- 1Department of Earth, Ocean and Ecological Sciences, University of Liverpool, Liverpool, United Kingdom
- 2Palaeomagnetic Laboratory, Department of Earth Sciences, Utrecht University, Utrecht, Netherlands
- 3Department of Geology, Lund University, Lund, Sweden
- 4UNAM Queretaro, Queretaro, Mexico
The Microwave Palaeointensity System at the University of Liverpool has developed, over 30 years, into the current third generation version; a combined 14 GHz microwave resonant cavity and superconducting quantum interference device magnetometer integrated microwave system. The use of microwave energy minimises the bulk temperatures required to demagnetise and remagnetise palaeomagnetic material, thereby limiting the significant problem of thermo-chemical alteration of magnetic minerals. Here we review the microwave palaeointensity approach, including its development, technical details, modern usage and results. We have carried out a comprehensive analysis of 20 palaeointensity studies, published between 2008 and 2022, where data collected using the microwave system may be compared with various other methods at the site level. An assessment of microwave results revealed no statistical bias compared to thermal, and known field data. We also present results from a new controlled experiment which tests the ability of the microwave to accurately recover weak, ancient palaeointensities when strongly overprinted. We conclude that the microwave system can be used for the primary method of determining accurate absolute palaeointensities or as part of a multi-method approach, and is well suited to a wide range of material from archaeomagnetic samples to ancient rocks.
1 Introduction
The Earth’s magnetic field and its dynamic behaviour gives an insight in to the deep Earth and its evolution. Obtaining records of past geomagnetic field behaviour and deciphering patterns and characteristics on the whole range of timescales has been a challenge for palaeomagnetists for decades. Numerical dynamo and geomagnetic field models are becoming more sophisticated (e.g., Aubert, 2019; Panovska et al., 2021), but are limited by real data which provide inputs to the latter and tests for the former. A far larger data set exists for the directional variations of the geomagnetic field compared to variations in palaeointensity. This is due in part to additional complications in obtaining the latter. The usefulness of full vector data has produced a drive in palaeointensity research over the last few decades and an emphasis on the robustness of the measurements (Bono et al., 2022).
Absolute palaeomagnetic field strength (palaeointensity) is generally determined by comparing a natural thermal remanent magnetisation (NRM) with a laboratory induced thermal remanent magnetisation (TRMLAB; e.g., Dunlop, 2011). To impart a TRMLAB, the sample must be heated then cooled in a known magnetic field through the blocking temperature of the remanence-bearing magnetic minerals. Unfortunately, the experimental procedure is greatly complicated by thermo-chemical alteration, which often occurs during the heating process, changing the remanence-carrying properties of a sample and invalidating any results. This is a substantial problem to overcome, particularly for ancient rocks, which tend to have much lower success rates whilst simultaneously being less abundant. It is, therefore, a fundamental requirement of any palaeointensity method to be able to detect or, preferably, limit the amount of alteration that occurs during an experiment. If a portion of remanence is affected by alteration, it should be identified and either excluded from any analysis or corrected for.
The most commonly employed method by far is the Thellier method (Thellier, 1938; Thellier and Thellier, 1959) referred to explicitly as the thermal Thellier method here. It consists of a series of stepwise heating and cooling steps so that the total remanence is split into a series of partial thermal remanent magnetisations (pTRMs). Various protocols have been developed, (e.g., Aitken, Coe and IZZI (Coe, 1967; Aitken et al., 1988; Tauxe and Staudigel, 2004), which are distinct in the order and type of in-field and zero-field steps. Common checks that are incorporated include pTRM checks and pTRM tail checks to determine if the remanence carriers are stable (resisting alteration) and behaving in an ideal manner during an experiment. These are time consuming experiments and are limited by alteration caused by repeated high-temperature steps. All protocols only allow the portion of the remanence remaining after removal of any overprint and before alteration occurs to be used in the palaeointensity determination.
Minimising the alteration that can occur during the palaeointensity experiment is highly desirable in all palaeointensity experiments; efforts to achieve this include using a single, full heating (Shaw method) or limited heatings (multi-specimen methods) rather than multiple repeated heatings to high temperature. Nevertheless, this does not eliminate the problem since a sample must still be heated to high temperature, and such methods introduce their own unique complications. It is sometimes possible to select materials less prone to alteration, e.g., single plagioclase crystals (Tarduno et al., 2006), or glassy flow tops (Cromwell et al., 2018); however, this approach is limited to a tiny proportion of suitable rocks.
The Microwave Palaeointensity System (MWS) was developed with the aim of substantially reducing alteration by substituting conventional heating with the application of high-frequency microwaves. Each application of microwave power takes seconds rather than tens of minutes; in addition, the energy should, in theory, be applied directly to the magnetic grains rather than the sample matrix, limiting the heating of the bulk sample. Due to the different mechanisms involved, we make a distinction between a thermal remanent magnetisation (TRM) and a thermal (microwave) remanent magnetisation (TMRM).
It has been 30 years since the first publication from the Liverpool group on the use of microwaves in palaeomagnetism (Walton et al., 1992). Since then, three systems have been developed and operated at Liverpool. The first of these operated at 8.2 GHz while the latter two (nicknamed Betty and Tristan) operated at ∼14 GHz. Only Tristan remains operational. There have been at least 80 papers published and 16 PhD theses that contained a significant component of microwave methodology development or results (Supplementary Table S1). The types of studies that have used the microwave method for palaeointensity vary from theoretical and technical, methodological comparisons, and palaeointensity research on a wide range of material (Figure 1).
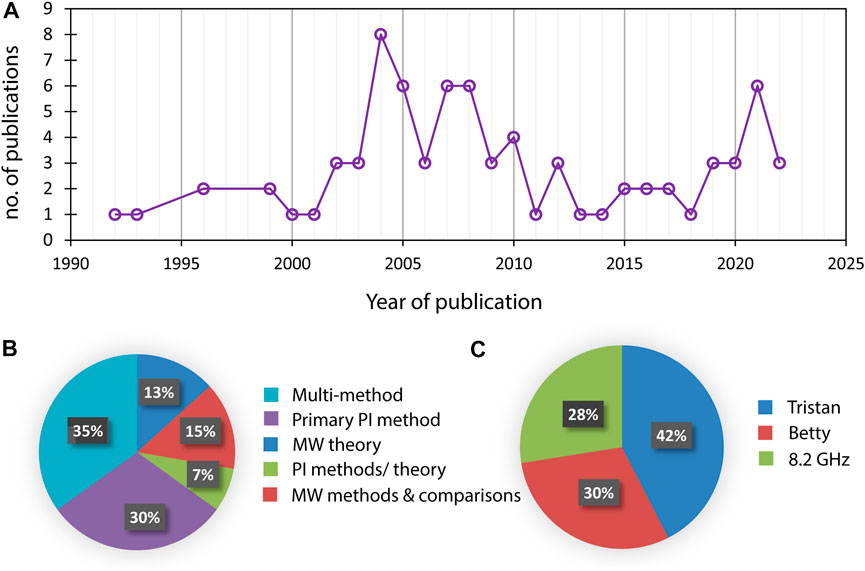
FIGURE 1. Summary of microwave demagnetisation, palaeointensity and theoretical research to 2022. (A) Number of papers published per year. (B) Breakdown of all published papers related to MWS by the type of study. (C) Breakdown of demagnetisation and palaeointensity research papers according to the MWS system used.
Here we review the development of the MWS, the methodologies used and discuss how the microwave method has progressed to its present status as a relatively mature palaeointensity method. We discuss microwave experimental procedures and perform a detailed comparison of modern microwave palaeointensity data with that of multiple other methods. We carried out a series of microwave palaeointensity experiments performed on samples that had first been given laboratory thermoremanences. This enables us to explore the effects of applying very different laboratory fields and to test the capability of the microwave system to produce robust results from ancient rocks recording a weak field but with their remanence partially overprinted by a much stronger field.
2 The microwave system
2.1 Background
The first known use of microwaves in palaeomagnetism was by Hale et al. (1978) where eddy current heating of metallic iron grains was used to demagnetise lunar samples. In the field of palaeointensity, however, the aim has been to excite the magnetic grains directly using the magnetic component of the microwave field. The direct input of energy into the magnetic system bypasses the need to raise the temperature of the whole sample. This is in contrast to the traditional heating process, which indirectly demagnetises via lattice vibrations (phonons), heating the whole sample in the process. The bulk temperature reached by the sample should then be substantially lower than that required for an equivalent conventional thermal (de)magnetisation (Suttie et al., 2010). Furthermore, the direct excitation of the ferromagnetic particles is substantially faster than warming the entire sample from the outside leading to substantially shorter heating times in microwave experiments.
The practicalities of designing and building suitable equipment, and the mechanisms involved when exposing a palaeomagnetic sample to high frequency microwaves, are complex. The Liverpool team, initially John Shaw, John Share, and Derek Walton developed the MWS through a combination of experimental and theoretical investigations. The very first experiments performed by the Liverpool team sought to excite the magnetic system at ∼2.8 GHz (Walton et al., 1992). It was thought that more efficient demagnetisation could be achieved by using higher frequencies. This led to the first generation MWS using an 8.2 GHz klystron valve to generate microwaves, and this was combined with a homemade SQUID magnetometer (Shaw et al., 1996). The desire for still higher frequency microwaves, led to the development of “Betty” (e.g., Böhnel et al., 2003); 14 GHz was chosen for practical reasons as this frequency is used in satellite communication systems with readily available hardware. The use of higher frequencies increased the problem of dielectric heating of the matrix, however, and this is discussed below (Section 2.3). The current third generation MWS has developed into an integrated combined 14 GHz microwave resonant cavity and SQUID magnetometer named “Tristan”, completed in August 2006. From January 2007, both 14 GHz systems (Betty and Tristan) were operational with Tristan soon taking over, and in 2016, Betty was decommissioned. Tristan also has the potential (via optical alignment) for using oriented samples though this area of research has not yet been fully exploited.
In parallel, and in collaboration with the Liverpool group, the use of microwaves in palaeomagnetism was also being explored at Centro de Geociencias, Juriquilla, UNAM in Mexico. The Juriquilla MWS was built using similar components compared to the Liverpool MWS including a Tristan Tech DRM-300 rock magnetometer. The set-up additionally allows a high-speed precision pyrometer to measure the sample temperature in real time. The Juriquilla system is controlled by a MATLAB program which constructs an Arai plot as the experiment progresses, and displays all parameters (forward and reflected power, integrated power, temperature) during the experiment. This allows for adjustment of the time of microwave exposure to reach the programmed integrated power or temperature.
The Juriquilla system was used for studying the interaction of microwave radiation with synthetic and natural samples (Walton et al., 2004). Due to frequent technical problems with the DRM-300 magnetometer (mainly due to leaks of the closed helium system), it could be used only intermittently for palaeointensity studies, and published data are limited to those of Larrea et al. (2019). Results of many test experiments to verify the correct working and develop the MATLAB control software have not been published so far.
2.2 System design
The MWS consists of the microwave component (microwave generation, amplification and transport via waveguide to a tuned resonant cylindrical cavity) and a superconducting quantum interference device (SQUID) magnetometer. The current system comprises a model DRM-300 small bore SQUID magnetometer measurement system produced by Tristan Technologies. It is a 3-axis magnetometer with detection coils wound in a Helmholtz-like configuration; three separate detection coil sets configured to simultaneously measure the three orthogonal components (Bx, By, Bz) of the induced field generated. The cryogenic hardware maintains the required ∼4 K using liquified helium gas.
The microwave cavity is designed to resonate in the TE011 mode (H and E field directions; Figure 2); the sample is placed in the centre, which is the node of minimum electric but maximum magnetic energy (Suttie et al., 2010). The cavity is coupled to the waveguide by a small slot in the side of the cavity. The maximum power of 90 W (in practise this rarely exceeds 40 W) at 14.2 GHz is generated by a solid-state amplifier (Microwave Amplifiers Ltd., UK) which is less susceptible to damage by reflected power than conventional travelling wave tube amplifiers.
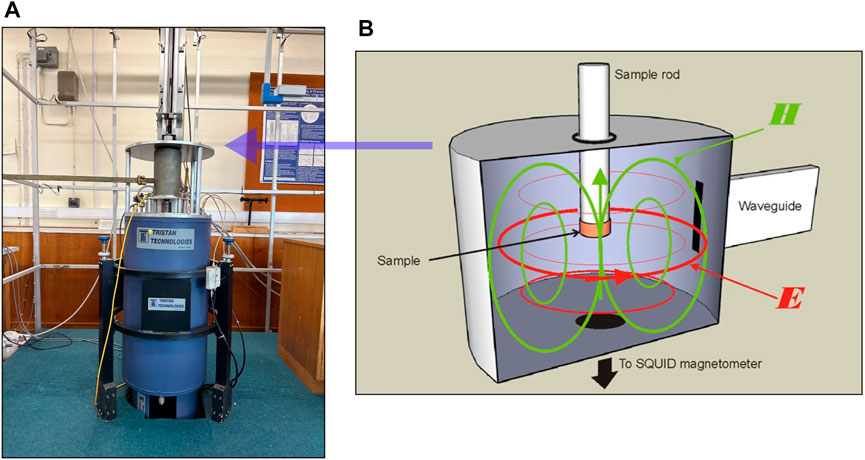
FIGURE 2. (A) Image of the microwave system. (B) Microwave cavity cross section showing the electric and magnetic fields in TE011 mode, waveguide slot, sample/holder position and magnetometer direction, adapted from AGU poster; Shaw et al., 1996.
The MWS, which is under computer control, is designed for use on an individual palaeomagnetic sample that is moved between the resonant cavity for microwave exposure, and the magnetometer for remanence measurement. Helmholz coils surround the microwave cavity to allow a magnetising field (user specified direction and intensity up to 100 μT) to be applied, thus allowing both demagnetisation and remagnetisation of a sample’s remanence.
Relative permeability is much smaller than the relative permittivity in common minerals, and the electric field is everywhere tangential to the cylindrical cavity in TE011 mode (Chen et al., 2004; Suttie et al., 2010). A homogenous cylinder can therefore be inserted along the axis of the cavity with minimal perturbation of the fields. Small cylindrical samples (∼5 mm x 5 mm) are used as a compromise between minimising the field perturbation whilst ensuring a strong enough remanence to be measured by the magnetometer. If, however, there are regions of differing dielectric constant within the cylindrical sample, then it is not possible to simultaneously satisfy the conditions of constant electric field tangential to interfaces and constant displacement current normal to them. Thus, sample heterogeneity and porosity increase the perturbation to fields within the neighbourhood of the sample, with increased propensity for dielectric heating through a build-up of charge.
The empty cavity is constructed and tuned for a specific resonant frequency (14 GHz). This, however, will change with the introduction of a sample based on its material, shape, position, and temperature. The resonant frequency, which effects the efficiency of the demagnetisation, is therefore determined experimentally for every sample by performing a frequency sweep (Figure 3A) at the beginning of each experiment using very low power (∼0.5 W). The system is kept in resonance by computer control; the amount of reflected power returning in the waveguide is monitored and minimised (Figure 3B), allowing as much microwave energy to be absorbed as possible (within the system limitations). The total energy applied to a sample (and the system) is the integrated microwave power and exposure time (W.s).
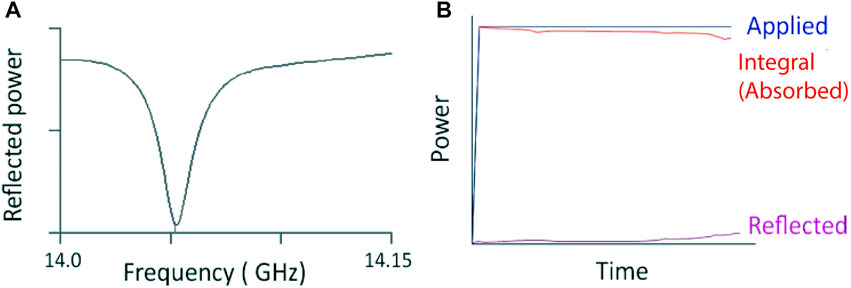
FIGURE 3. (A) Example of a frequency sweep. (B) System monitoring the resonance during the time of applied power.
2.3 Absorption of microwaves by rocks
Magnetite can absorb energy at microwave frequencies by a process similar to that used in ferromagnetic resonance (FMR), where the total magnetic moment precesses around an applied static field. During MW demagnetisation, no static field is applied but the high frequency magnetic field can still cause precession of the electron spins around their equilibrium directions. If the electron magnetic moments precess in unison, the excitation is called a uniform mode. As energy is absorbed, it is possible under specific conditions, for the uniform mode to break down into higher order excitations, known as magnons, or spin waves, which are collective oscillations in the relative orientations of spins on a lattice (Kittel, 2005).
As a microwave resonant cavity is excited, the electric and magnetic fields within it increase until total power losses are equal to the incident power. The proportion of power absorbed by the sample compared to that lost by conduction in the cavity walls depends on how effectively the sample absorbs microwaves. For this reason, the microwave method is only suitable for materials that absorb microwaves strongly; otherwise, the fields may reach levels high enough to cause dielectric breakdown, whereby electrical currents flow through an electrical insulating material.
There are two main mechanisms by which the microwave electric field can couple to non-magnetic materials and allow energy to subsequently be lost to the system. Dielectric heating tends to dominate in electrically insulating material such as a rock matrix, and conductive (eddy current) heating dominate in good electrical conductors. The dominant process depends on the material, temperature, microwave frequency, and how the microwaves are applied (Chen et al., 2004); however, the conductivities associated with magnetite, for example, are too low to produce eddy currents.
The dielectric loss alone for a typical basalt sample in the centre of the cavity far outweighs the small conduction losses in the walls of the cavity (see Appendix A), effectively damping the fields within the cavity, so that the sample absorbs almost all of the incident power. It is important to note that because of this, an even higher loss sample cannot absorb any more energy for a given incident power. For example, Walton et al. (2004) showed a pure magnetite sample and a basalt sample show similarity in their heating profiles but mistakenly interpreted this as evidence for ferromagnetic resonant absorption. Much of their subsequent speculation regarding the resonant excitation of spin-wave modes is founded upon this interpretation. In fact, there is no strong evidence either for any kind of resonance, or for the particular mode through which the magnetic grains absorb energy.
Increasing frequency from 8.2 GHz to 14 GHz has meant more efficient demagnetisation due to increased dielectric heating (increasing frequency increases dielectric loss) and also due to a more efficient system (improved cavity, waveguide coupling, etc.). Differences of opinion regarding the importance of dielectric losses are evidenced in the reply and response to Biggin et al. (2007), (Shaw and Biggin, 2008; Walton and Boehnel, 2008). We have shown that dielectric loss in the sample can explain the demagnetisation; however, the extent to which the magnetic component of the microwave field contributes to the demagnetisation process by normal mode is unknown because the magnetic absorption is difficult to calculate.
Dielectric heating of the non-magnetic matrix via the electric part of the field is sought to be minimised. Suttie et al. (2010) directly demonstrated that it is possible to demagnetise a thin disc (5mm x 0.8 mm) of basalt using either the electric or magnetic part of the microwave field. When coupled to the electric part of the field, the entire basalt sample needed to be heated to its Curie temperature to be completely demagnetised. In this situation, the MWS is acting as a thermal demagnetiser (albeit a very rapid and efficient one). When coupled to the magnetic part of the microwave field, however, complete demagnetisation occurred for a lower bulk sample temperature as desired, although this was in a different cavity mode (TE112 rather than TE011).
2.4 Melt spots
Occasionally, melt spots can sometimes be observed on samples indicating the occurrence of very high temperatures locally in the sample implying strong concentration of the thermal energy. Although the cavity mode is selected to minimise dielectric heating, the electric field around the perimeter of the sample increases with the magnetic flux passing through it. Porosity and heterogeneity of the sample perturb the electric field and, if the sample is a poor microwave absorber that does not damp the fields in the cavity, the electric field can reach high values at the corners of samples (consistent with where melt spots are observed to occur).
Focused dielectric heating leads to steep thermal gradients within the sample and locally to very sharp heating and cooling rates. Samples that are poor absorbers will tend to be affected because they are exposed to larger fields. Results from samples that show severe melt spots are discarded on the basis of catastrophic thermal alteration; but other samples that do not show visual signs of heating may also be prone to these heterogeneous thermal effects. In an empty cavity at 80 W, the electric field reaches about 1.5 kV/mm, and will be about half of that at the edge of a lossless, low permittivity sample. The dielectric strength decreases with temperature and factors like porosity will increase the field locally. The high dielectric constant of the quartz holder also increases the electric field. This may explain why melt spots frequently appear on parts of samples adjacent to the holder.
3 Experimental procedure and analysis
Microwave experiments are carried out in their entirety one specimen at a time which has the advantage that subsequent experiments performed on sister specimens can be improved iteratively. The applied field can be made closer to the suggested ancient field, and the levels of the demagnetisation steps and pTMRM checks can be tailored for a particular remanence’s unblocking behaviour.
The MWS has typically been used to carry out Thellier-type experiments. Contemporary Thellier-style palaeointensity techniques require precise reheating to the same temperature to compare de (re)magnetisation steps and to carry out pTMRM checks. Earlier systems could not reproduce the power absorption precisely enough to accurately repeat steps. It was therefore necessary to use the perpendicular Thellier method (Kono, 1974; Hill and Shaw, 2007) which requires only one microwave application at each de (re)magnetisation step. Unfortunately, this prevented pTMRM checks and hindered the detection of non-ideal effects such as alteration and multi-domain behaviour. The modern MWS achieves the required accuracy by maintaining the reflected power at a minimum (remaining in resonance). This normally allows for precise repeated power absorption to the same level and enables the use of all experimental protocols used in thermal Thellier experiments.
The sensitivity of the system is initially set to the strength of magnetisation in a given specimen, followed by a ‘frequency sweep’ to determine the optimal resonant frequency for that specimen. The resonant frequency, and therefore amount of energy absorbed, can be changed during and between individual microwave treatments. Intra-treatment changes are likely due to the sample losing water or alteration of the specimen during the experiment. This is dealt with by a dynamic algorithm that seeks to modify the frequency to minimise the reflected power through the microwave application. However, these changes can still affect the power integral or energy absorbed. A pTMRM step (and each step pair) should reproduce the same power integral (analogous to temperature) as the step being repeated. If the pTMRM integral is lower, it can be rejected and reapplied with higher power and/or time to achieve the same integral. If a pTMRM check integral is higher than its counterpart then it must be rejected, have its effects removed entirely with a similar demagnetisation treatment, and then redone with a lower power and/or time to achieve the correct integral. It may also be necessary to perform periodic re-sweeps of the frequency during the experiment, typically after each pTMRM check.
While sample movement between the measurement and treatment stages occurs automatically, the experiments are otherwise user-controlled and can be modified in real time. The field to be applied during remagnetisation steps is typically selected based on the sample’s magnetisation after the first demagnetisation step. A common strategy in Thellier experiments is to apply the field at an angle between 45° and 90° to the NRM so as to achieve a trade-off between making pTMRM tails visible while not exaggerating their effects (Biggin, 2006; Yu and Tauxe, 2006).
During microwave demagnetisation, both the applied microwave power and the application time can be increased to raise the absorbed power integral and achieve (de)magnetisation. Generally speaking, time is held constant at 5 s until the power has reached 40 W and then the time is increased to a maximum of 20 s. This frequently has the effect of reducing NRM to <10% of its initial value although this scales with Curie temperature and microwave demagnetisation is particularly ineffective for hematite-bearing samples.
Cooling rates influence the efficiency of the acquisition of TMRMs as for thermal experiments; this is a particular consideration for small, single domain particles (McClelland Brown, 1984; Ferk et al., 2010; Biggin et al., 2013). Poletti et al. (2013) determined microwave cooling rate corrections experimentally for 27 brick fragments and compared the results with Triaxe and Thellier archeointensities given by Hartmann et al. (2010). They experimentally corrected the microwave results for the influence of cooling rate differences, reducing discrepancies between the previous and new results from 25% to 8%. Their results indicate similar cooling-rate effects between microwave and thermal procedures despite the different ways in which the energy is transferred into the spin system.
Ideally, palaeointensity estimates from different parts of a rock unit with different rock magnetic properties will contribute to the final result (Biggin and Paterson, 2014). Nevertheless, rocks are heterogeneous at all scales and therefore, unlike in palaeodirectional studies where independently orientated specimens are key, palaeointensity estimates are not required to follow a hierarchical averaging approach. In microwave palaeointensity studies, several sub-specimens (5 mm diameter) are typically drilled from a standard one-inch or half-inch specimen, and each can be classed as a stand-alone result.
4 Comparison of microwave data with other methods
Earlier microwave data primarily used the perpendicular method, which prevented pTMRM checks from being included, and hindered the detection of non-ideal effects such as alteration and multi-domain behaviour. A thorough comparison was undertaken by Biggin (2010) on 13 paired microwave and thermal Thellier studies. Systematic differences between the results were ascribed to the enhancement of non-ideal effects associated with vortex-state and multi-domain grains in thermal experiments; many of the higher thermal estimates also tended to be associated with the low-temperature portions of concave-up Arai diagrams. The single-treatment perpendicular microwave method without pTMRM checks also produced results that were biased low due to undetected alteration. For bias associated with the microwave, the type of protocol used and its ability to detect non-ideal behaviour was judged to be the most significant factor, rather than the demagnetisation mechanism itself. This conclusion was validated by Grappone et al. (2020) who further studied the SOH-1 Hawaiian lavas included in the same comparison study of Biggin (2010). A change in microwave protocol produced a mean result (29.5 ± 9.2 μT) which sat between the original thermal Thellier results (33.5 μT; Teanby et al., 2002) and the MW-Perpendicular results (25.1 μT; Gratton et al., 2005), which were shown to be biased high and low respectively. The study emphasised the need for both pTMRM checks and detection of non-SD behaviour. This was similarly demonstrated by the 1960 Hawaiian flow, which originally produced microwave-perpendicular results of 33.9 μT (Hill and Shaw, 2000) compared to the IGRF value of 36.2 μT. A later restudy obtained 36.8 ± 3.4 μT using the IZZI+ protocol (Grappone et al., 2019) and concluded that undetected alteration was biasing the original results.
A number of recent multi-method studies combined the microwave Thellier technique with other palaeointensity methods. These have included various thermal Thellier protocols (Coe, 1967; Aitken et al., 1988; Tauxe and Staudigel, 2004), Shaw (Shaw, 1974; Tsunakawa and Shaw, 1994; Lloyd et al., 2021a), multi-specimen (Dekkers and Böhnel, 2006; Fabian and Leonhardt, 2010), the calibrated pseudo-Thellier technique (de Groot et al., 2013; Paterson et al., 2016) and Wilson (1962) methods. This multi-method approach is now widely considered best practice, and is adopted based on the rationale that if the results from multiple, independent, palaeointensity methods agree, then the forthcoming palaeointensities are better established.
Here we compare palaeointensity results from 20 recent multi-method or paired studies (Table 1) that were not included in the comparison of Biggin (2010); these are omitted from our comparison because many of the microwave results were obtained on the old system using protocols that do not incorporate pTMRM checks. Direct comparisons are made for 116 separate sites between microwave palaeointensity results and those of other established methods as described above (Supplementary Table S2). Several sites include results from more than two methods. The included data comes from a wide variety of rock types and ages; we distinguish between younger material, which ranges from 200 years to 470 kyrs (all except one study are younger than 13 kyrs), and ancient material which ranges from 110 Myrs to 1.1 Gyrs (Figure 4). Most of the included studies employ the IZZI protocol in thermal and microwave Thellier methods (Tauxe and Staudigel, 2004; Yu and Tauxe, 2005); other protocols include (modified) Coe (Coe, 1967) and Aitken (Aitken et al., 1988); almost all experiments include pTMRM checks and many include pTMRM tail checks (Table 1).
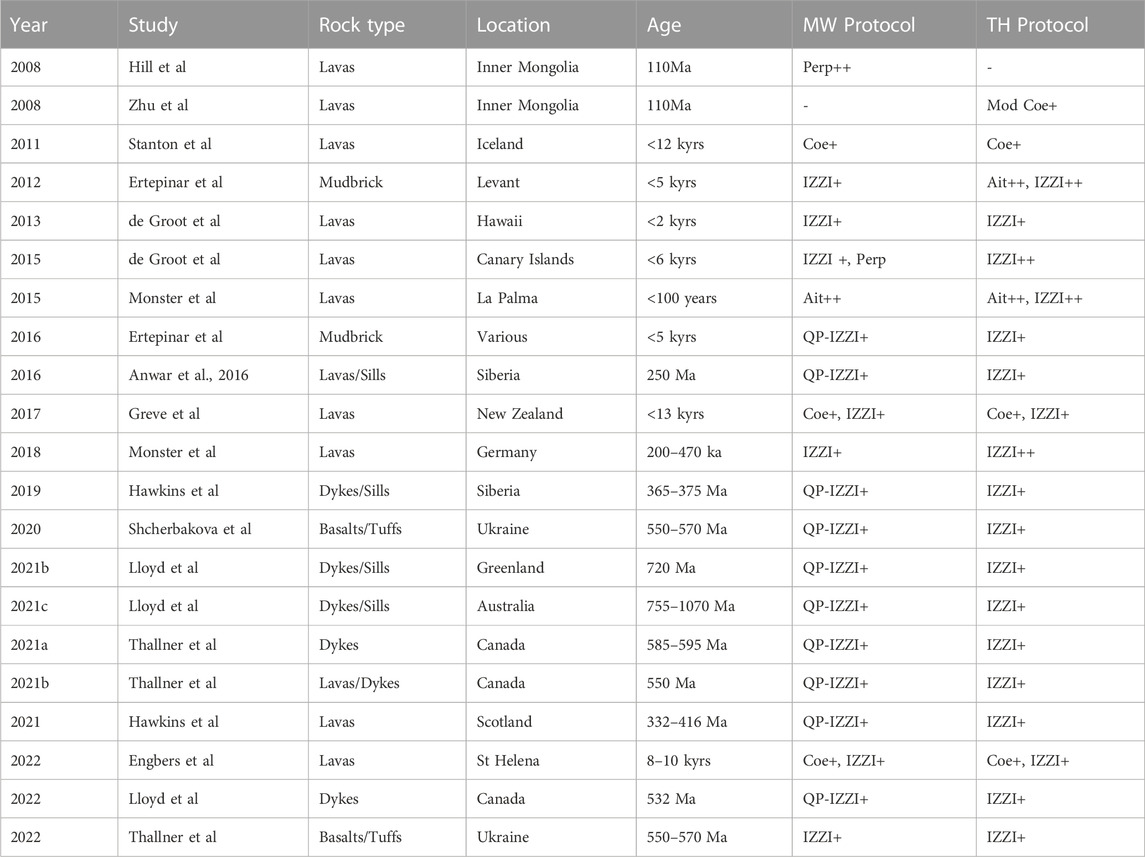
TABLE 1. Details of the studies used in this latest comparison of palaeointensity data which compared microwave data to that from other methods at site level. Age, refers to the age of the rocks in the study; MW and TH (Microwave and Thellier) Protocols are those used in the comparison study and are summarised accordingly; +, includes pTRM check; ++, includes pTRM check and pTRM tail check; Perp, Perpendicular protocol (field applied perpendicular to the NRM; QP, Quasi-perpendicular protocol (Field applied at an angle >45⁰ and < 90⁰ to the NRM); Coe, Thellier Coe method; IZZI, Thellier IZZI method; Mod Coe, modified Thellier Coe method; Ait, Thellier Aitken method.
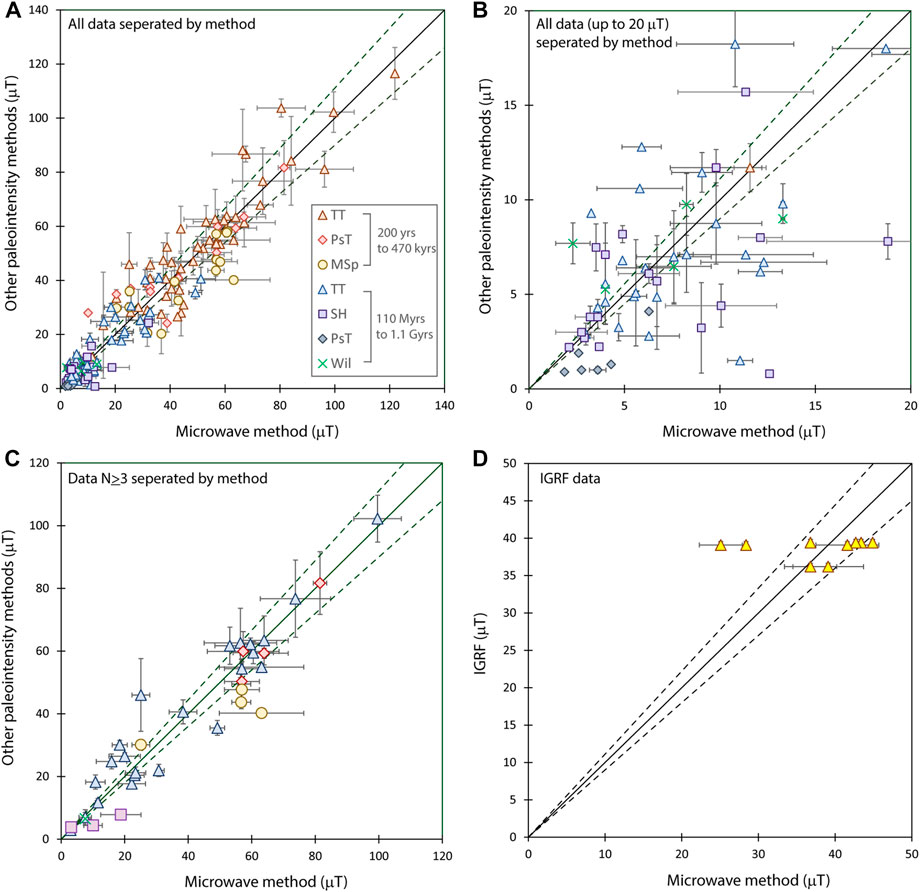
FIGURE 4. Comparisons of microwave palaeointensity data with other methods. A solid unit line and dashed lines (±10%) are shown. (A) All data. (B) A magnified version of the weak-field section of (A). (C) All paired data where n ≥ 3. (D) Microwave data compared to International Geomagnetic Reference Field (IGRF). The key is valid for Figs (A–C); TT, thermal Thellier (blue triangle); PsT, pseudo-Thellier; MSp, multi-specimen; SH, Shaw; Wil, Wilson.
Comparisons of thermal Thellier and microwave results appear evenly distributed about the unit slope (Figure 4A) and a Wilcoxon Signed-Rank Test demonstrates that there is no statistical difference between the two sets of results. Multi-specimen results tend to be slightly lower than Microwave results from the same site (Figure 4A), this is in line with earlier observations of multi-specimen results producing lower palaeointensities than the known palaeofield (Monster et al., 2015). Why this occurs is still enigmatic, but it is hypothesized that it is due to using only one, often relatively low, temperature for the multi-specimen experiment, potentially emphasizing the effects of viscous processes. The microwave and calibrated pseudo-Thellier results are indistinguishable within error for palaeofields >40 μT (Figure 4A). For lower palaeofields, the calibrated pseudo-Thellier results are higher than the Microwave results (except for one data point). This may relate to the non-zero y-axis intercept in the calibration of pseudo-Thellier results (de Groot et al., 2013).
Many of the data have been produced from measurements of ancient rocks. These are intrinsically less ideal recorders than, for example, fresh lavas. The relative scatter between methods is high compared to the weak-field values being recorded (Figure 4B); however, no significant bias is observed, and the absolute scatter is equivalent to that of the younger material (Figure 4A).
Much of the scatter about the unit slope may be due to many of the sites having an n of 1 for either of the compared method data. If we only use sites with n of 3 or greater for both compared paired data, while much of the data are removed, there is an improved relation observed (Figure 4C). When taken as a whole, however, the comparison data indicate that there is no substantial tendency for microwave results, which are achieved across a wide range of grain sizes, to be biased. This is likely a result of appropriate checks for alteration now being incorporated in the protocol.
One of the studies in our comparison employed the microwave technique on two recent lavas (1949 and 1971 AD) from La Palma (Monster et al., 2015). Most of the results obtained for sites in these flows produce the known palaeofield (IGRF) within error (Figure 4D), with only two outliers where the microwave results are too low. These two outliers are unexplained, and may be due to processes affecting the NRM of the sample (e.g., viscous processes), unsuitability for the microwave method, or miss-interpretations of the microwave results. Figure 4D also includes the updated results for two sections of the 1960 Hawaiian lava flow (Grappone et al., 2019).
This historical data represents explicit “ground-truthing” of the microwave method in a more rigorous manner than comparing its estimates with those produced from other methods but where the true result is unknown. In a similar vein, synthetic experiments may be performed, for example, on samples containing a laboratory-imparted TRM that mimics an ancient NRM. Thermal Thellier and microwave (8.2 GHz MWS) palaeomagnetic experiments were performed on lavas from Hawaii and Australia that contained laboratory induced “synthetic” NRMs (Hill et al., 2002). The experiments, which were conducted on the same samples, established the general equivalence of TRM and TMRM and the validity of the microwave palaeointensity technique. The results also demonstrated reduced alteration during microwave experiments compared to their thermal counterparts but showed that microwave demagnetisation was occasionally unable to isolate a pTRM as cleanly as thermal demagnetisation.
5 Case study: The application of microwave palaeointensity analysis on analogues of ancient rocks recording a weak palaeointensity
Here we present new microwave data obtained to investigate how ancient rocks that gained their original remanence in a weak field may behave during palaeointensity experiments. This is motivated by a number of recent studies indicating that the geomagnetic field may have been substantially (up to an order of magnitude) weaker than the more recent field for sustained intervals in the Jurassic (Tauxe et al., 2013; Sprain et al., 2016), Devonian (Shcherbakova et al., 2017; Hawkins et al., 2021), Ediacaran (Meert et al., 2016; Thallner et al., 2021a; Thallner et al., 2021b) and Palaeoproterozoic (Biggin et al., 2015). A significant challenge for these studies is to derive reliable estimates of the palaeointensity from rocks that acquired their primary magnetisation during such time but were subsequently exposed to a considerably stronger field. Such exposure may produce strong secondary magnetisations removed mainly in the lower portion of their unblocking spectrum. The disparity in magnetising fields could potentially produce concave-up Arai plots during Thellier-type palaeointensity experiments. Analyses performed on such samples thus carry an associated risk of their results being erroneously rejected on the grounds of being biased by multidomain effects and/or instability of thermoremanence (Kosterov and Prévot, 1998; Shaar and Tauxe, 2015; Smirnov et al., 2017). We designed a laboratory experiment to assess the veracity of MWS studies to reliably recover the correct, lower intensities stored in such samples. These were given a full TRM in a low field and were subsequently stored at elevated temperatures in a stronger field for 2 weeks to simulate the effect of a long term viscous magnetisation in these samples.
Standard microwave specimens were extracted from a total of 11 conventional palaeomagnetic core and cubic samples sourced from archived collections including baked bricks from a Roman-age archaeological site (N12-8, 12-13 and N20-1, 20-11), Devonian-aged mafic lavas (WB3-5, 3–6 and KH7 and 8), and a variety of Mesoproterozoic intrusive rocks (H25, MP3, PA5, TN125, MR22, ZD12). All samples were first heated to 700°C in air and cooled in a field of 8 µT to impart a weak TRM. Rock magnetic analyses performed on specimens before and after this pre-treatment demonstrated that the majority of samples contained Ti-poor titanomagnetite with hysteresis properties that fell into the central region of a Day (Day et al., 1977) plot (Figure 5). The process of pre-treating the samples is likely to have further stabilised them against alteration and reduced their effective grain size.
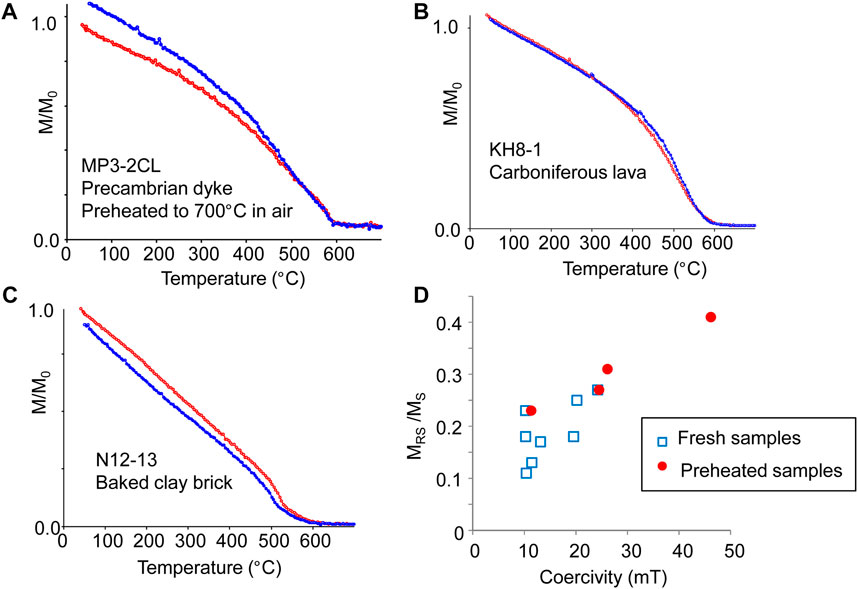
FIGURE 5. Rock magnetic results from samples before and after the 700°C pre-treatment. (A–C) Thermomagnetic analysis performed in air (heating in red, cooling in blue). (D) Summary of hysteresis properties of all measured samples.
IZZI microwave experiments were performed using the Tristan MWS on single specimens spanning the full range of lithologies. In all experiments, pTMRM checks were made after each alternate microwave step and the lab field of 8 µT was applied nearly perpendicular to the synthetic NRM. Results from this first wave of experiments were mostly (though not universally) high quality and are presented in the upper part of Table 2 with example Arai plots given in the left column of Figure 6. Every experiment produced a palaeointensity measurement within 4 µT of the expected result and, although fewer than half of the results were accurate to within 10% (attesting to the absolute limits of working with low field intensities), the mean after no selection criteria were applied (7.2 ± 1.6 µT) was within both 10% and one standard deviation of the expected result.
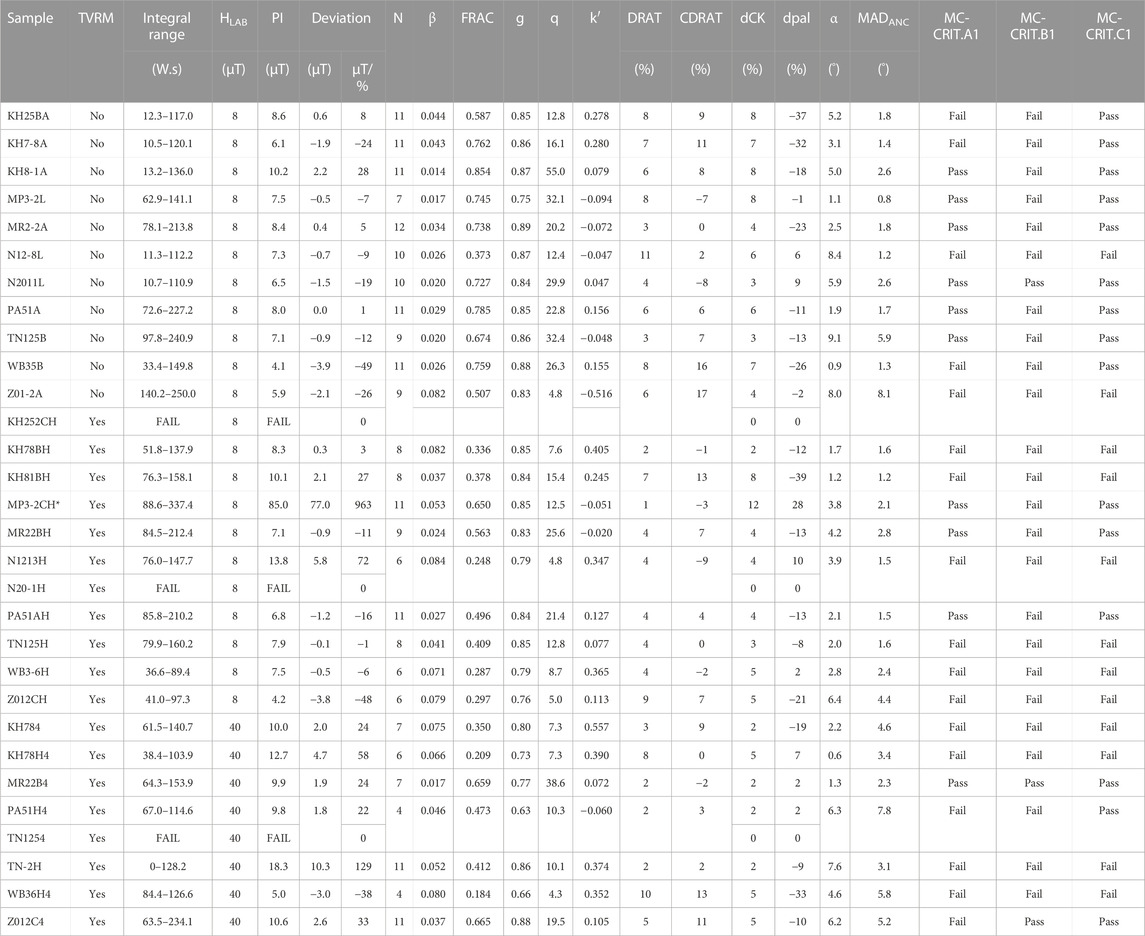
TABLE 2. Palaeointensity results from all IZZI microwave experiments performed on samples containing a laboratory TRM acquired in a field of 8 μT. TVRM indicates whether the samples were also subject to a two-week long heating at 200°C in air and an applied field of 80 μT.
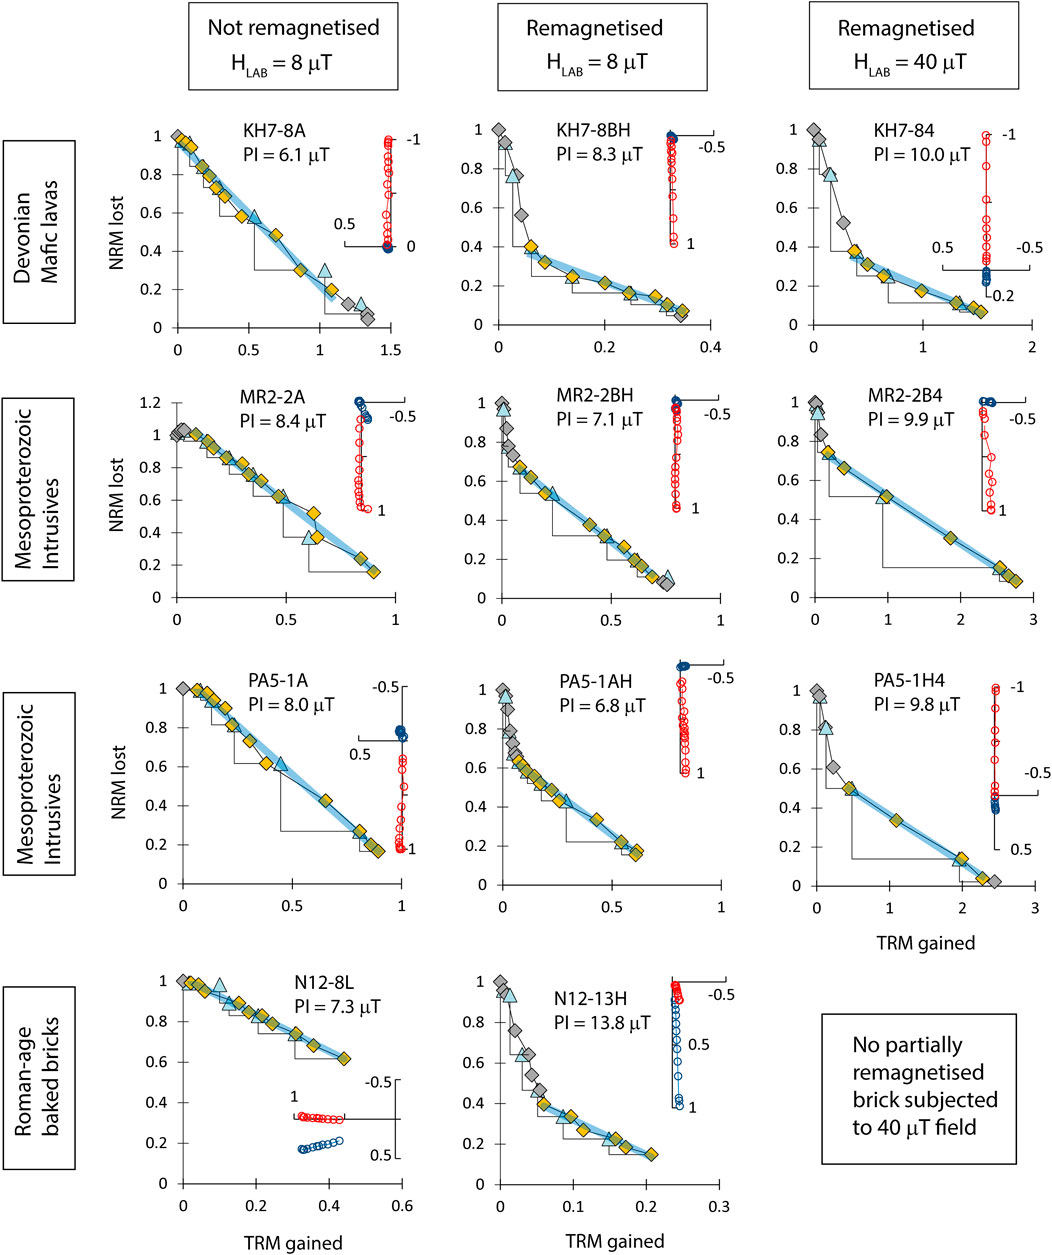
FIGURE 6. Representative Arai plots from four sets of sister specimens, each from different lithologies and subject to different pre-treatments and IZZI microwave experiments. Filled points on the Arai plots were selected and used to obtain the palaeointensity (PI) estimate given. Unfilled points on the Zijderveld plots represent the vertical component in sample coordinates. Both the full TRM and overprinting TVRM were applied parallel close to the z-axis of the specimens.
To simulate the effect of a prolonged exposure of a natural sample to a stronger ambient field prior to measurement, an additional 19 microwave specimens (again spanning the full range of lithologies) were placed into a home-built cooling rate oven and held at 200 °C for 14 days in a field of 80 (eighty) µT directed subparallel to the synthetic NRM, prior to cooling in the same field. These thermal conditions were chosen on the basis that such a treatment is predicted to have a thermoviscous remagnetising effect on assemblages of single domain magnetite particles equivalent to more than several billions of years of exposure at ambient temperatures (Pullaiah et al., 1975). Furthermore, the order of magnitude increase in field strength should represent an extreme of the VRM acquisition conditions encountered in nature.
The majority (11 from 19) of these partially remagnetised specimens were subject to precisely the same microwave palaeointensity experiment as the first batch. The remainder of sister samples had the experiment performed in a field of 40 µT to investigate the effects of choosing a lab field several times larger than the original palaeointensity.
The results indicate that, as expected, the thermoviscous remagnetisation had a deleterious effect on the microwave palaeointensity results (central and right-hand columns of Figure 6 and lower part of Table 2) such that three of the 19 experiments failed completely and, in one sample (MP3-2C2), the synthetic NRM was entirely overprinted so that the palaeointensity estimated was close to that used in the remagnetisation treatment. As an extreme outlier with an obvious explanation, we exclude this final result from further analysis.
The Arai plots of the remaining samples all exhibit some degree of concave-up two-slope behaviour suggesting that this is an expectation for ancient rocks that acquired a primary TRM in a field considerably weaker than the more recent field. Nevertheless, the high-power segments of these Arai plots were still able to record a reasonably accurate palaeointensity in the majority of cases (e.g., 9 of the 15 specimens yielded a measurement within 2 µT of the expected value). The mean palaeointensity estimate from the high-power segments was 9.5 ± 3.6 µT (N = 15) but this was biased to high values by those estimates produced using the inappropriately high lab-field of 40 µT (Table 3). Taking only those results produced with a lab-field of 8 µT produces a mean palaeointensity from the overprinted samples of 8.2 ± 2.8 µT (N = 8); if these are combined with the results from the non-remagnetised samples also treated in a field of 8 μT, this mean becomes 7.6 ± 2.2 µT (N = 19). The contrast between these highly accurate means and that produced by the 40 µT experiments (10.9 ± 4.0 µT, N = 7) highlights the benefit of choosing a lab-field that is approximately equal to the palaeointensity. For this reason, it is standard practise in microwave measurement campaigns to perform palaeointensity experiments such that the lab-field gradually iterates towards the final obtained palaeointensity. We did not explore the effect of varying the direction of the applied external field, which may cause slight differences in the palaeointensity estimates (e.g., Biggin, 2006). Difficulties in separating the two components, particularly in using a parallel external field, may also introduce a slight bias. We point out, however, that any changes to the field direction used for the overprint would make it easier to detect and therefore likely improve the results.
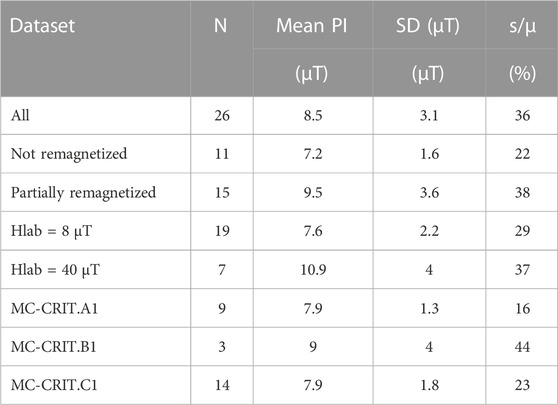
TABLE 3. Summary of palaeointensity results under different criteria indicating the number of estimates (N), the mean palaeointensity (PI), the estimated standard deviation (SD) and the size of the standard deviation relative to the mean (σ/μ).
A further useful application of the dataset reported here is to test the efficacy and efficiency of different selection criteria applied to commonly measured Thellier-type palaeointensity parameters (see Table 2 of Paterson et al. (2014) for a complete description of these). The three MC-CRIT sets of criteria developed by (Paterson et al., 2015) were tested here (Tables 2, 3). All three succeeded in excluding the most deviatory estimates (with the exception of the fully remagnetised outlier) but also failed in the sense that a good proportion of the data they excluded was highly accurate. The most efficient performing criteria set overall was MC-CRIT.C1 and the worst, by far was MC-CRIT.B1 which only passed three estimates, none of which were the most accurate. Since samples recording weaker palaeointensity results will naturally tend to produce less ideal Arai plots because of noise and overprinting issues, care must be taken to ensure that over-zealous use of selection criteria do not lead to a systematic bias towards strong palaeointensity estimates in future studies.
To summarise, the Tristan MWS is quite capable of producing accurate palaeointensity estimates from samples carrying a primary TRM acquired in a weak field even when their magnetisations have been partially reset in a much stronger field. The accuracy and precision of the final result may be improved by selecting a laboratory field (in a Thellier-type experiment) that is close to the obtained palaeointensity. An MWS is especially suitable for this because samples are measured individually, and the applied field can be optimised for the next sample. As expected, we obtained concave-up Arai plots, and show that these may be inevitable in studies performed on otherwise perfectly reliable recorders of ancient but weak palaeointensities. Such estimates should only be rejected when checks specifically undertaken to detect non-ideal behaviour justify it, e.g., in cases where pTMRM (tail) checks fail, IZZI experiments produce zig-zags, or excessive curvature is indicated in the k’ parameter.
6 Discussion and conclusion
Over the past 30 years at least 78 papers have reported on MWS results and/or its technical development (Figure 1A) with the majority of microwave palaeointensity data gathered on the Betty and Tristan systems (Figure 1C). In thirty percent of these studies, the MWS was used as the primary method to obtain palaeointensities but, over recent years, the main use of the microwave technique is as part of a multi-method palaeointensity approach (34% of the publications to date). The remainder of the publications had a more methodological focus whose main aim was to present or assess new palaeointensity or microwave techniques (Figure 1B). This includes comparisons of various protocols on the MWS (e.g., Grappone et al., 2020).
The MWS has provided reliable estimates from a variety of different palaeomagnetic records, ranging from archeomagnetic samples such as pottery and kilns, to both intrusive and extrusive volcanic rocks with widely different ages, from historical lava flows to Precambrian dykes. This study includes the most comprehensive comparison of microwave data and multiple palaeointensity techniques; we show that there is no significant systematic difference between results and that standalone microwave results are accurate when compared to the International Geomagnetic Reference Field (IGRF). A case study further demonstrates the MWS ability to recover weak remanences that are then strongly overprinted.
Microwave magnetic coupling maintains a lower sample temperature compared to equivalent thermal methods, and limits the heating application to seconds which may reduce thermo-chemical alteration. Other advantages of the MWS are not due to the microwave component per se, but the ability to apply a steady field in any direction and to carry out experiments one sample at a time. This allows the experiment to be fully tailored to the individual sample and results can be analysed whilst the experiment is progressing. The versatility of the MWS in tailoring the palaeointensity experiment while measuring, and the possibilities to optimize parameters for subsequent samples (or to decide whether sister specimens are worth further investment) makes the MWS a powerful and time-efficient tool to produce palaeointensities even from the most challenging recorders.
More fundamental research is needed to determine exactly how the samples perturb the fields within the cavity and to further isolate both the dielectric and magnetic coupling (it is experimentally impossible to ensure that only the magnetic part of the field couples with the sample). Additionally, the optimum frequency for the microwaves remains unclear; balancing the size and shape of the cavity, the sample, and the frequency is currently based on practise. The ideal conditions are close, by some degree, to being achieved by the current MWS, although further optimisation could reduce the amount of heat generated during microwave experiments, and hence suppress adverse thermal effects more efficiently.
The modern MWS is computer controlled to keep the reflected power minimised, reproducing the microwave energy absorbed by the system and maintaining the system resonance. This enables all contemporary thermal Thellier protocols to be utilised; the IZZI-protocol (Tauxe and Staudigel, 2004), with pTRM-checks is currently favoured. The use of modern protocols has improved the accuracy and all but eliminated any systematic biases that were apparent in earlier studies (as outlined in Section 4). Future modifications can be made with respect to the experiment monitoring. Although the MWS enables the user to monitor and adjust the progress of an experiment, more advanced software would allow an instant and progressive visualisation of the demagnetisation, ‘live’ Arai plots, and potentially fully-automated experiments.
In summary, since the start of its development 30 years ago in Liverpool, MWS has proved its capability to provide reliable estimates of the palaeofields intensity, including from non-ideal samples that are prone to alteration. It is paramount to tailor palaeointensity experiments according to sample behaviour and the MWS provides the opportunity to optimise an experiment during measuring and make improvements for subsequent samples. Used as either the main palaeointensity technique, or as part of a multi-method approach, results obtained using the MWS are accurate and unbiased, and contribute to our understanding of the behaviour of the Earth’s magnetic field and the processes governing the dynamics in the Earth’s deep interior.
Data availability statement
The raw data supporting the conclusion of this article will be made available by the authors, without undue reservation.
Author contributions
SL compiled and wrote most of the manuscript and completed the meta-analysis in comparison of microwave data with other methods. AB contributed to editing the manuscript in full and supervised undergraduate student Joe JM, who completed the experimental work in Discussion and conclusion. MH contributed to several sections of the manuscript. LD contributed to comparison of microwave data with other methods. NS, JS, and HB contributed to the technical sections and background of the manuscript. All authors contributed to the article and approved the submitted version.
Funding
We acknowledge earlier NERC grants NE/P00170X/1, NE/S008330/1, and NE/T012463/1 for funding for the development of the microwave system. The Natural Environment Research Council have provided almost continual support. NS was supported by Swedish Research Council grant 2020-04813.
Acknowledgments
Everyone who has been involved with the development of the microwave method, and especially the pioneers Derek Walton, John Share, John Hakes and Tim Rolph, are gratefully acknowledged. All the users of the systems–the many PhD students and international visitors are also acknowledged. We also acknowledge Leverhulme RLA-2016-080.
Conflict of interest
The authors declare that the research was conducted in the absence of any commercial or financial relationships that could be construed as a potential conflict of interest.
Publisher’s note
All claims expressed in this article are solely those of the authors and do not necessarily represent those of their affiliated organizations, or those of the publisher, the editors and the reviewers. Any product that may be evaluated in this article, or claim that may be made by its manufacturer, is not guaranteed or endorsed by the publisher.
Supplementary material
The Supplementary Material for this article can be found online at: https://www.frontiersin.org/articles/10.3389/feart.2023.1188528/full#supplementary-material
References
Aitken, M. J., Allsop, A. L., Bussell, G. D., and Winter, M. B. (1988). Determination of the intensity of the Earth’s magnetic field during archaeological times: Reliability of the Thellier technique. Rev. Geophys. 26 (1), 3–12. doi:10.1029/RG026i001p00003
Aubert, J. (2019). Approaching Earth’s core conditions in high-resolution geodynamo simulations. Geophys. J. Int. 219, S137–S151. doi:10.1093/gji/ggz232
Biggin, A. J., and Paterson, G. A. (2014). A new set of qualitative reliability criteria to aid inferences on palaeomagnetic dipole moment variations through geological time. Front. Earth Sci. 2 (10), 1–9. doi:10.3389/feart.2014.00024
Biggin, A. J., Perrin, M., and Shaw, J. (2007). A comparison of a quasi-perpendicular method of absolute palaeointensity determination with other thermal and microwave techniques. Earth Planet. Sci. Lett. 257 (3–4), 564–581. doi:10.1016/j.epsl.2007.03.016
Biggin, A. J., Badejo, S., Muxworthy, A. R., Dekkers, M. J., and Shaw, J. (2013). The effect of cooling rate on the intensity of thermoremanent magnetization (TRM) acquired by assemblages of pseudo-single domain, multidomain and interacting single-domain grains. Geophys. J. Int. 193 (3), 1239–1249. doi:10.1093/gji/ggt078
Biggin, A. J., Piispa, E. J., Pesonen, L. J., Holme, R., Paterson, G. A., Veikkolainen, T., et al. (2015). Palaeomagnetic field intensity variations suggest Mesoproterozoic inner-core nucleation. Nature 526 (7572), 245–248. doi:10.1038/nature15523
Biggin, A. J. (2006). First-order symmetry of weak-field partial thermoremanence in multi-domain (MD) ferromagnetic grains: 2. Implications for thellier-type palaeointensity determination. Earth Planet. Sci. Lett. 245 (1–2), 454–470. doi:10.1016/j.epsl.2006.02.034
Biggin, A. J. (2010). Are systematic differences between thermal and microwave Thellier-type paleointensity estimates a consequence of multidomain bias in the thermal results? Phys. Earth Planet. Interiors 180 (1–2), 16–40. doi:10.1016/j.pepi.2010.03.005
Böhnel, H., Biggin, A. J., Walton, D., Shaw, J., and Share, J. A. (2003). Microwave palaeointensities from a recent Mexican lava flow, baked sediments and reheated pottery. Earth Planet. Sci. Lett. 214 (1–2), 221–236. doi:10.1016/S0012-821X(03)00370-4
Bono, R. K., Paterson, G. A., van der Boon, A., Engbers, Y. A., Michael Grappone, J., Handford, B., et al. (2022). The PINT database: A definitive compilation of absolute palaeomagnetic intensity determinations since 4 billion years ago. Geophys. J. Int. 229 (1), 522–545. doi:10.1093/gji/ggab490
Chen, L. F., Ong, C. K., Neo, C. P., Varadan, V. V., and Varadan, V. K. (2004). Microwave electronics: Measurement and materials characterization. Chichester: John Wiley and Sons Ltd. doi:10.1002/0470020466
Coe, R. S., Grommé, S., and Mankinen, E. A. (1978). Geomagnetic paleointensities from radiocarbon-dated lava flows on Hawaii and the question of the Pacific nondipole low. J. Geophys. Res. Solid Earth 83 (B4), 1740–1756. doi:10.1029/jb083ib04p01740
Coe, R. S. (1967). Paleo-intensities of the Earth’s magnetic field determined from Tertiary and Quaternary rocks. J. Geophys. Res. 72 (12), 3247–3262. doi:10.1029/jz072i012p03247
Cromwell, G., Trusdell, F., Tauxe, L., Staudigel, H., and Ron, H. (2018). Holocene paleointensity of the island of Hawai `i from glassy volcanics. Geochem. Geophys. Geosystems 19 (9), 3224–3245. doi:10.1002/2017GC006927
Day, R., Fuller, M., and Schmidt, V. A. (1977). Hysteresis properties of titanomagnetites: Grain-size and compositional dependence. Phys. Earth Planet. Interiors 13 (4), 260–267. doi:10.1016/0031-9201(77)90108-X
de Groot, L. v., Biggin, A. J., Dekkers, M. J., Langereis, C. G., and Herrero-Bervera, E. (2013). Rapid regional perturbations to the recent global geomagnetic decay revealed by a new Hawaiian record. Nat. Commun. 4, 2727. doi:10.1038/ncomms3727
de Groot, L. v., Pimentel, A., and Chiara, A. (2016). The multimethod paleointensity approach applied to volcanics from terceira: Full-vector geomagnetic data for the past 50 kyr 095, 590–604. doi:10.1093/gji/ggw095
Dekkers, M. J., and Böhnel, H. N. (2006). Reliable absolute palaeointensities independent of magnetic domain state. Earth Planet. Sci. Lett. 248 (1–2), 508–517. doi:10.1016/j.epsl.2006.05.040
Dunlop, D. J. (2011). Physical basis of the Thellier-Thellier and related paleointensity methods. Phys. Earth Planet. Interiors 187 (3–4), 118–138. doi:10.1016/j.pepi.2011.03.006
Engbers, Y. A., Grappone, J. M., Mark, D. F., and Biggin, A. J. (2022). Low paleointensities and Ar/Ar ages from Saint Helena provide evidence for recurring magnetic field weaknesses in the south atlantic. J. Geophys. Res. Solid Earth 127 (3). doi:10.1029/2021JB023358
Ertepinar, P., Langereis, C. G., Biggin, A. J., Frangipane, M., Matney, T., Ökse, T., et al. (2012). Archaeomagnetic study of five mounds from Upper Mesopotamia between 2500 and 700 BCE: Further evidence for an extremely strong geomagnetic field ca 3000 years ago. Earth Planet. Sci. Lett. 357 (358), 84–98. doi:10.1016/j.epsl.2012.08.039
Ertepinar, P., Langereis, C. G., Biggin, A. J., de Groot, L. V., Kulakoğlu, F., Omura, S., et al. (2016). Full vector archaeomagnetic records from Anatolia between 2400 and 1350 BCE: Implications for geomagnetic field models and the dating of fires in antiquity. Earth Planet. Sci. Lett. 434, 171–186. doi:10.1016/j.epsl.2015.11.015
Fabian, K., and Leonhardt, R. (2010). Multiple-specimen absolute paleointensity determination: An optimal protocol including pTRM normalization, domain-state correction, and alteration test. Earth Planet. Sci. Lett. 297 (1–2), 84–94. doi:10.1016/j.epsl.2010.06.006
Ferk, A., Aulock, F. W. V., Leonhardt, R., Hess, K. U., and Dingwell, D. B. (2010). A cooling rate bias in paleointensity determination from volcanic glass: An experimental demonstration. J. Geophys. Res. Solid Earth 115 (8), 08102. doi:10.1029/2009JB006964
Grappone, J. M., Biggin, A. J., and Hill, M. J. (2019). Solving the mystery of the 1960 Hawaiian lava flow: Implications for estimating Earth’s magnetic field. Geophys. J. Int. 218 (3), 1796–1806. doi:10.1093/gji/ggz252
Grappone, J. M., Biggin, A. J., Barrett, T. J., Hill, M. J., and Sprain, C. J. (2020). Comparison of thermal and microwave paleointensity estimates in specimens displaying non-ideal behavior in thellier-style paleointensity experiments. J. Geophys. Res. Solid Earth 125 (8). doi:10.1029/2020JB019802
Gratton, M. N., Shaw, J., and Herrero-Bervera, E. (2005). An absolute palaeointensity record from SOH1 lava core, Hawaii using the microwave technique. Phys. Earth Planet. Interiors 148 (2–4), 193–214. doi:10.1016/j.pepi.2004.09.009
Greve, A., Hill, M. J., Turner, G. M., and Nilsson, A. (2017). The geomagnetic field intensity in New Zealand: Palaeointensities from Holocene lava flows of the Tongariro Volcanic Centre. Geophys. J. Int. 211 (2), 814–830. doi:10.1093/GJI/GGX327
Hale, C. J., Fuller, M., and Bailey, R. C. (1978). On the application of microwave heating to lunar paleointensity determination. Lunar Planet. Sci. Conf. 3, 3165–3178.
Hartmann, G. A., Genevey, A., Gallet, Y., Trindade, R. I. F., Etchevarne, C., le Goff, M., et al. (2010). Archeointensity in Northeast Brazil over the past five centuries. Earth Planet. Sci. Lett. 296 (3–4), 340–352. doi:10.1016/j.epsl.2010.05.016
Hawkins, L. M. A., Anwar, T., Shcherbakova, V. V., Biggin, A. J., Kravchinsky, V. A., Shatsillo, A. V., et al. (2019). An exceptionally weak Devonian geomagnetic field recorded by the Viluy Traps, Siberia. Earth Planet. Sci. Lett. 506, 134–145. doi:10.1016/j.epsl.2018.10.035
Hawkins, L. M. A., Grappone, J. M., Sprain, C. J., Saengduean, P., Sage, E. J., Thomas-Cunningham, S., et al. (2021). Intensity of the Earth’s magnetic field: Evidence for a Mid-Paleozoic dipole low. Proc. Natl. Acad. Sci. U. S. A. 118 (34), 2017342118. doi:10.1073/pnas.2017342118
Hill, M. J., and Shaw, J. (2000). Magnetic field intensity study of the 1960 Kilauea lava flow, Hawaii, using the microwave palaeointensity technique. Geophys. J. Int. 142, 487–504. doi:10.1046/j.1365-246x.2000.00164.x
Hill, M. J., Gratton, M. N., and Shaw, J. (2002). A comparison of thermal and microwave palaeomagnetic techniques using lava containing laboratory induced remanence. Geophys. J. Int. 151 (1), 157–163. doi:10.1046/j.1365-246X.2002.01745.x
Hill, M. J., and Shaw, J. (2007). The use of the ‘Kono perpendicular applied field method’ in microwave palaeointensity experiments. Earth Planets Space 59, 711–716. doi:10.1186/BF03352734
Hill, M. J., Pan, Y., and Davies, C. J. (2008). An assessment of the reliability of palaeointensity results obtained from the Cretaceous aged Suhongtu section, Inner Mongolia, China. Phys. Earth Planet. Interiors 169 (1–4), 76–88. doi:10.1016/j.pepi.2008.07.023
Kissel, C., and Laj, C. (2004). Improvements in procedure and paleointensity selection criteria (PICRIT-03) for Thellier and Thellier determinations: Application to Hawaiian basaltic long cores. Phys. Earth Planet. Interiors 147 (2-3), 155–169. doi:10.1016/j.pepi.2004.06.010
Kono, M. (1974). Intensities of the Earth’s magnetic field about 60 m.y. ago determined from the Deccan Trap Basalts, India. J. Geophys. Res. 79 (8), 1135–1141. doi:10.1029/jb079i008p01135
Kosterov, A. A., and Prévot, M. (1998). Possible mechanisms causing failure of Thellier palaeointensity experiments in some basalts: Thellier palaeointensity experiments. Geophys. J. Int. 134 (2), 554–572. doi:10.1046/j.1365-246X.1998.00581.x
Larrea, P., Siebe, C., Juárez-Arriaga, E., Salinas, S., Ibarra, H., and Böhnel, H. (2019). The ∼ AD 500–700 (late classic) el astillero and el pedregal volcanoes (michoacán, Mexico): A new monogenetic cluster in the making? Bull. Volcanol. 81 (10), 59. doi:10.1007/s00445-019-1318-5
Leonhardt, R., Krása, D., and Coe, R. S. (2004). Multidomain behavior during thellier paleointensity experiments: A phenomenological model. Phys. Earth Planet. Interiors 147 (2-3), 127–140. doi:10.1016/j.pepi.2004.01.009
Lloyd, S. J., Paterson, G. A., Thallner, D., and Biggin, A. J. (2021a). Improvements to the shaw-type absolute palaeointensity method. Front. Earth Sci. 9. doi:10.3389/feart.2021.701863
Lloyd, S. J., Biggin, A. J., Halls, H., and Hill, M. J. (2021b). First palaeointensity data from the cryogenian and their potential implications for inner core nucleation age. Geophys. J. Int. 226, 66–77. doi:10.1093/gji/ggab090
Lloyd, S. J., Biggin, A. J., and Li, Z.-X. (2021c). New paleointensity data suggest possible Phanerozoic-type paleomagnetic variations in the Precambrian. Geochem. Geophys. Geosystems 2021GC009990. doi:10.1029/2021GC009990
Lloyd, S. J., Biggin, A. J., Paterson, G. A., and McCausland, P. J. A. (2022). Extremely weak early Cambrian dipole moment similar to Ediacaran: Evidence for long-term trends in geomagnetic field behaviour? Earth Planet. Sci. Lett. 595, 117757. doi:10.1016/j.epsl.2022.117757
Mcclelland Brown, E. (1984). Experiments on TRM intensity dependence on cooling rate. Geophys. Res. Lett. 11 (3), 205–208. doi:10.1029/GL011i003p00205
Meert, J. G., Levashova, N. M., Bazhenov, M. L., and Landing, E. (2016). Rapid changes of magnetic Field polarity in the late Ediacaran: Linking the Cambrian evolutionary radiation and increased UV-B radiation. Gondwana Res. 34, 149–157. doi:10.1016/j.gr.2016.01.001
Monster, M. W. L., de Groot, L. v., Biggin, A. J., and Dekkers, M. J. (2015). The performance of various palaeointensity techniques as a function of rock magnetic behaviour – a case study for La Palma. Phys. Earth Planet. Interiors 242, 36–49. doi:10.1016/j.pepi.2015.03.004
Panovska, S., Korte, M., Liu, J., and Nowaczyk, N. (2021). Global evolution and dynamics of the geomagnetic field in the 15–70 kyr period based on selected paleomagnetic sediment records. J. Geophys. Res. Solid Earth 126 (12). doi:10.1029/2021JB022681
Paterson, G. A. (2011). A simple test for the presence of multidomain behavior during paleointensity experiments. J. Geophys. Res. Solid Earth 116 (10), B10104. doi:10.1029/2011JB008369
Paterson, G. A., Tauxe, L., Biggin, A. J., Shaar, R., and Jonestrask, L. C. (2014). On improving the selection of Thellier-type paleointensity data. Geochem. Geophys. Geosystems 15 (4), 1180–1192. doi:10.1002/2013GC005135
Paterson, G. A., Biggin, A. J., Hodgson, E., and Hill, M. J. (2015). Thellier-type paleointensity data from multidomain specimens. Phys. Earth Planet. Interiors 245, 117–133. doi:10.1016/j.pepi.2015.06.003
Paterson, G. A., Heslop, D., and Pan, Y. (2016). The pseudo-thellier palaeointensity method: New calibration and uncertainty estimates. Geophys. J. Int. 207 (3), 1596–1608. doi:10.1093/gji/ggw349
Poletti, W., Hartmann, G. A., Hill, M. J., Biggin, A. J., and Trindade, R. I. F. (2013). The cooling-rate effect on microwave archeointensity estimates. Geophys. Res. Lett. 40 (15), 3847–3852. doi:10.1002/grl.50762
Pullaiah, G., Irving, E., Buchan, K. L., and Dunlop, D. J. (1975). Magnetization changes caused by burial and uplift, Earth and Planetary Science Letters 28.
Selkin, P. A., and Tauxe, L. (2000). Long-term variations in palaeointensity. Philosophical Trans. R. Soc. A Math. Phys. Eng. Sci. 358 (1768), 1065–1088. doi:10.1098/rsta.2000.0574
Shaar, R., and Tauxe, L. (2013). Thellier GUI: An integrated tool for analyzing paleointensity data from Thellier-type experiments. Geochem. Geophys. Geosystems 14, 677–692. doi:10.1002/ggge.20062
Shaar, R., and Tauxe, L. (2015). Instability of thermoremanence and the problem of estimating the ancient geomagnetic field strength from non-single-domain recorders. Proc. Natl. Acad. Sci. U. S. A. 112 (36), 11187–11192. doi:10.1073/pnas.1507986112
Shaw, J. (1974). A new method of determining the magnitude of the palaeomagnetic field: Application to five historic lavas and five archaeological samples. Geophys. J. R. Astronomical Soc. 39 (1), 133–141. doi:10.1111/j.1365-246X.1974.tb05443.x
Shaw, J., Walton, D., Yang, S., Rolph, T. C., and Share, J. A. (1996). Microwave archaeointensities from Peruvian ceramics. Geophys. J. Int. 124 (1), 241–244. doi:10.1111/j.1365-246X.1996.tb06367.x
Shaw, J., and Biggin, A. J. (2008). Reply to comment on A comparison of a quasi-perpendicular method of absolute paleointensity determination with other thermal and microwave techniques. Earth Planet. Sci. Lett. 327.
Shcherbakova, V. v., Biggin, A. J., Veselovskiy, R. v., Shatsillo, A. v., Hawkins, L. M. A., Shcherbakov, V. P., et al. (2017). Was the devonian geomagnetic field dipolar or multipolar? Paleointensity studies of devonian igneous rocks from the minusa basin (siberia) and the kola peninsula dykes, Russia. Geophys. J. Int. 209 (2), 1265–1286. doi:10.1093/gji/ggx085
Shcherbakova, V. V., Bakhmutov, V. G., Thallner, D., Shcherbakov, V. P., Zhidkov, G. V., and Biggin, A. J. (2020). Ultra-low palaeointensities from East European Craton, Ukraine support a globally anomalous palaeomagnetic field in the Ediacaran. Geophys. J. Int. 220 (3), 1928–1946. doi:10.1093/gji/ggz566
Smirnov, A. v., Kulakov, E. v., Foucher, M. S., and Bristol, K. E. (2017). Intrinsic paleointensity bias and the long-term history of the geodynamo. doi:10.1126/sciadv.1602306
Sprain, C. J., Feinberg, J. M., Geissman, J. W., Strauss, B., and Brown, M. C. (2016). Paleointensity during periods of rapid reversal: A case study from the middle jurassic shamrock batholith, Western Nevada. Bull. Geol. Soc. Am. 128 (1–2), B31283.1–238. doi:10.1130/B31283.1
Stanton, T., Riisager, P., Knudsen, M. F., and Thordarson, T. (2011). New palaeointensity data from Holocene Icelandic lavas. Phys. Earth Planet. Interiors 186 (1–2), 1–10. doi:10.1016/j.pepi.2011.01.006
Suttie, N., Shaw, J., and Hill, M. (2010). Direct demonstration of microwave demagnetization of a whole rock sample with minimal heating. Earth Planet. Sci. Lett. 292, 357–362. doi:10.1016/j.epsl.2010.02.002
Tarduno, J. A., Cottrell, R. D., and Smirnov, A. v. (2006). The paleomagnetism of single silicate crystals: Recording geomagnetic field strength during mixed polarity intervals, superchrons, and inner core growth. Rev. Geophys. 44 (1). doi:10.1029/2005RG000189
Tauxe, L., and Staudigel, H. (2004). Strength of the geomagnetic field in the cretaceous normal superchron: New data from submarine basaltic glass of the troodos ophiolite. Geochem. Geophys. Geosystems 5 (2). doi:10.1029/2003GC000635
Tauxe, L., Gee, J. S., Steiner, M. B., and Staudigel, H. (2013). Paleointensity results from the Jurassic: New constraints from submarine basaltic glasses of ODP Site 801C. Geochem. Geophys. Geosystems 14 (10), 4718–4733. doi:10.1002/ggge.20282
Teanby, N., Laj, C., Gubbins, D., and Pringle, M. (2002). A detailed palaeointensity and inclination record from drill core SOH1 on Hawaii. Phys. Earth Planet. Interiors 131, 101–140. doi:10.1016/S0031-9201(02)00032-8
Thallner, D., Biggin, A. J., and Halls, H. C. (2021a). An extended period of extremely weak geomagnetic field suggested by palaeointensities from the Ediacaran Grenville dykes (SE Canada). Earth Planet. Sci. Lett. 568, 117025. doi:10.1016/j.epsl.2021.117025
Thallner, D., Biggin, A. J., McCausland, P. J. A., and Fu, R. R. (2021b). New paleointensities from the skinner cove formation, newfoundland, suggest a changing state of the geomagnetic field at the ediacaran-cambrian transition. J. Geophys. Res. Solid Earth 126 (9). doi:10.1029/2021JB022292
Thallner, D., Shcherbakova, V. V., Bakhmutov, V. G., Shcherbakov, V. P., Zhidkov, G. V., Poliachenko, I. B., et al. (2022). New palaeodirections and palaeointensity data from extensive profiles through the Ediacaran section of the Volyn Basalt Province (NW Ukraine). Geophys. J. Int. 231 (1), 474–492. doi:10.1093/gji/ggac186
Thellier, E., and Thellier, O. (1959). Sur l’intensité du champ magnétique terrestre dans le passé historique et géologique. Ann. Géophysique 15, 285–376.
Thellier, E. (1938). Sur l’aimantation des terres cuites et ses applications géophysiques. Paris: PUF. Available at: http://lib.ugent.be/catalog/rug01:001802550.
Tsunakawa, H., and Shaw, J. (1994). The Shaw method of palaeointensity determinations and its application to recent volcanic rocks. Geophys. J. Int. 118 (3), 781–787. doi:10.1111/j.1365-246X.1994.tb03999.x
Walton, D., and Boehnel, H. N. (2008). The microwave frequency method. Phys. Earth Planet. Interiors 167 (3–4), 145–148. doi:10.1016/j.pepi.2008.02.012
Walton, D., Shaw, J., Share, J., and Hakes, J. (1992). Microwave demagnetization. J. Appt. Phys. 71 (3), 1549–1551. doi:10.1063/1.351230
Walton, D., Boehnel, H., and Dunlop, D. J. (2004). 2d order ferromagnetic resonance in nanoparticles. Phys. Status Solidi (A) Appl. Res. 201 (15), 3257–3262. doi:10.1002/pssa.200405435
Wilson, R. L. (1962). An instrument for measuring vector magnetization at high temperatures. Geophys. J. R. Astronomical Soc. 7 (1), 125–130. doi:10.1111/j.1365-246X.1962.tb02257.x
Yu, Y., and Tauxe, L. (2005). Testing the IZZI protocol of geomagnetic field intensity determination. Geochem. Geophys. Geosystems 6 (5). doi:10.1029/2004GC000840
Yu, Y., and Tauxe, L. (2006). Effect of multi-cycle heat treatment and pre-history dependence on partial thermoremanence (pTRM) and pTRM tails. Phys. Earth Planet. Interiors 157 (3–4), 196–207. doi:10.1016/j.pepi.2006.04.006
Zhu, R., Pan, Y., He, H., Qin, H., and Ren, S. (2008). Palaeomagnetism and 40Ar/39Ar age from a Cretaceous volcanic sequence, Inner Mongolia, China: Implications for the field variation during the Cretaceous normal superchron. Phys. Earth Planet. Interiors 169 (1–4), 59–75. doi:10.1016/j.pepi.2008.07.025
Appendix A: Absorption calculations
It is possible to calculate the magnitude of the fields in the empty cavity by considering the power dissipated in the cavity walls by conduction (Pc). To do this we integrate the magnetic field (H) components across the surface of the cavity. The power loss in a conducting sheet (s) is found by a surface integral
where H is always tangential to the surface and RS is the surface resistivity. In a TE011 cavity we integrate Hz around the circumference and Hφ over the two endplates, where
To calculate the conductive power loss in the wall, we take for brass at 14 GHz RS=0.0466Ω, l (cavity length)=2 cm,a (cavity radius)=1.5cm, and J0(q)=-0.40, is a Bessel function, where q is the first zero of
Similarly, the power absorbed at the two end plates can be calculated
The integral can be solved by substituting
whence
We find
These formulae give the power in Watts absorbed over the cavity for a given field in A/m at the centre of the cavity.
Imagine a sample of radius R, (<1/5 the length of the cavity), the axial variation of the electric field can be ignored. Assuming that the presence of the sample does not significantly disturb the fields within the cavity and that the radius of the sample is less than 1/5 that of the cavity we can write, as
We can use this to compare the dielectric loss in a sample with the conductive loss in the brass walls of the cavity.
where V is the volume of the sample.For a basalt disc 2 mm thick of radius 2.5mm, with a typical ε’’ of 4x10⁻¹² F/m this gives a dielectric loss of
over an order of magnitude greater than the conductive wall losses. Even samples with relatively low dielectric loss will contribute as much to the damping of the cavity as the losses in the walls. As a sample of basalt already absorbs almost all the incident energy, replacing it with pure magnetite should not make a difference to the heating profile, as observed by Walton et al. (2004).
Keywords: palaeomagnetism, geomagnetism, palaeointensity, microwave system, rock magnetism
Citation: Lloyd S, Biggin A, Hill M, De Groot L, Suttie N, Morris J, Boehnel H and Shaw J (2023) The use of high frequency microwaves in absolute palaeomagnetic intensity experiments. Front. Earth Sci. 11:1188528. doi: 10.3389/feart.2023.1188528
Received: 17 March 2023; Accepted: 30 May 2023;
Published: 15 June 2023.
Edited by:
Steven P. Lund, University of Southern California, United StatesReviewed by:
Miriam Gomez Paccard, Spanish National Research Council (CSIC), SpainAdrian R. Muxworthy, Imperial College London, United Kingdom
Copyright © 2023 Lloyd, Biggin, Hill, De Groot, Suttie, Morris, Boehnel and Shaw. This is an open-access article distributed under the terms of the Creative Commons Attribution License (CC BY). The use, distribution or reproduction in other forums is permitted, provided the original author(s) and the copyright owner(s) are credited and that the original publication in this journal is cited, in accordance with accepted academic practice. No use, distribution or reproduction is permitted which does not comply with these terms.
*Correspondence: Simon Lloyd, c2psbG95ZEBsaXZlcnBvb2wuYWMudWs=