 Frances Cooke1*
 Andreia Plaza-Faverola1
 Stefan Bünz1
 Nabil Sultan2
 Hariharan Ramachandran3
 Heather Bedle4
 Henry Patton1
 Sunny Singhroha1
 Jochen Knies5
- 1CAGE—Centre for Arctic Gas Hydrate, Environment and Climate, UiT (The Arctic University of Norway), The Arctic University of Norway, Tromsø, Norway
- 2Geo-Ocean, UMR6538, Ifremer, CNRS, UBO, UBS, Plouzané, France
- 3Institute of GeoEnergy Engineering, Heriot-Watt University, Edinburgh, United Kingdom
- 4School of Geosciences, The University of Oklahoma, Norman, OK, United States
- 5NGU—Geological Survey of Norway, Trondheim, Norway
Seafloor hydrocarbon seepage is a natural fluid release process that occurs worldwide on continental shelves, slopes, and in deep oceanic basins. The Vestnesa sedimentary ridge in the eastern Fram Strait hosts a deep-water gas hydrate system that became charged with hydrocarbons ∼2.7 Ma and has experienced episodic seepage along the entire ridge until a few thousand years ago, when seepage activity apparently ceased in the west but persisted in the east. Although it has been documented that faults and fractures play a key role in feeding the seeps with thermogenic gases, the mechanisms controlling seepage periodicity remain poorly understood. Here we integrate high-resolution P-cable 3D seismic and Chirp data to investigate the spatial and temporal evolution of high-resolution fractures and fluid flow features in the west of the Vestnesa Ridge. We characterize sediment deformation using a fracture density seismic attribute workflow revealing two highly deformed stratigraphic intervals and associated small-scale pockmarks (<20 m diameter). Chronostratigraphic constraints from the region show that these two highly deformed intervals are influenced by at least three major climatic and oceanic events during the last 1.2 million years: the Mid-Pleistocene Transition (∼1.25–0.7 Ma), the penultimate deglaciation (∼130 ka) and the last deglaciation (Heinrich Stadial 1: ∼16 ka). These periods of deformation appear associated with seismic anomalies potentially correlated with buried methane-derived authigenic carbonate and have been sensitive to shifts in the boundary of the free gas-gas hydrate interface. Our results show shifts (up to ∼30 m) in the depth of the base of the gas hydrate stability zone (GHSZ) associated with major changes in ocean bottom water temperatures. This ocean-driven effect on the base of the GHSZ since the Last Glacial Maximum coincides with the already highly deformed Mid-Pleistocene Transition sedimentary interval and likely enhanced deformation and gas leakage along the ridge. Our results have implications for understanding how glacial cycles impact fracture formation and associated seepage activity.
1 Introduction
The release of gas-rich fluids to the oceans and the atmosphere is a natural process that occurs worldwide in marine settings, including at sites of gas hydrate accumulations (Hovland, 1988; Anderson and Bryant, 1989; Mazurenko and Soloviev, 2003). Such fluid release is often associated with hydrocarbon leakage pathways that are detected in seismic data as vertical zones of deteriorated strata (Arntsen et al., 2007; Hustoft et al., 2007; Gay et al., 2012; Cartwright and Santamarina, 2015; Ma et al., 2021). These ‘gas chimneys’ (or pipes) are sedimentary disturbances formed through hydrofracturing (Moss and Cartwright, 2010) when the excess fluid pressure exceeds the effective least principal stress plus the tensile strength of the medium (Alfaro and Wong, 2001). The subsequent fluid flow through fractured zones depends on the fluid pressure, which is governed by two critical thresholds: the ‘shut-in pressure,’ which stops the flow, and the ‘re-opening pressure,’ which allows it to restart (Sano et al., 2005). Hydrofractures are known to develop at the base of the gas hydrate stability zone (GHSZ) where overpressure exists at the free gas-gas hydrate interface (e.g., Elger et al., 2018). When fluids migrate vertically towards the seafloor—preferably along gas chimneys during hydrogeological pumping—a cycle of pressure build-up and release occurs (Powers, 1967) leading to the formation of collapse features (Ligtenberg, 2005; Judd and Hovland, 2007; Løseth et al., 2009; Moss and Cartwright, 2010). These seafloor features were first described in the literature by King and Maclean. (1970) as pockmarks, and typically range in size from a few meters to >1 km (Andreassen et al., 2007; Rise et al., 2015). The presence of pockmarks is associated with fluid release related to various geological processes (i.e., compaction and dewatering/degassing, active faulting/tectonics, or gas hydrate dissolution and dissociation (Sultan et al., 2014)). These different geological processes are expressed in the seismic data in different ways and are highly dependent on the resolution of the dataset. Seepage can be episodically active, before slowing down and/or becoming dormant (e.g., Gay and Berndt, 2007) due to a shifting balance between gas pressure build up, and fluid migration from beneath the base of the GHSZ, over geological time scales (Gay and Berndt, 2007; Etiope, 2015).
Such periodic seepage through existing permeable pathways have been documented globally, including across the North Sea (e.g., Hovland, 2008), the mid-Norwegian margin (Plaza-Faverola et al., 2012) Canterbury basin (Bertoni et al., 2019), and Arctic margins (Plaza-Faverola et al., 2015; Himmler et al., 2019). In formerly glaciated domains episodic seepage events are known to span millennial time scales, hypothetically driven by the changing pressure, temperature and tectonic-stress conditions associated with the repeated growth and retreat of continental-scale ice sheets through the Late Quaternary (Crémière et al., 2016; Serov et al., 2017; Himmler et al., 2019; Vachon et al., 2022), evidenced by subsurface pockmarks and buried authigenic carbonate concretions at multiple stratigraphic levels (e.g., Plaza-Faverola et al., 2015, 2011; Moss et al., 2012; Riboulot et al., 2014; Chand et al., 2017; Himmler et al., 2019).
Despite documentation of periodic gas release through vertical pathways at numerous continental margins, the exact mechanisms controlling the periodicity remains poorly investigated. So far, it is known that the slightest pressure perturbations may drive local seepage events (Wiprut and Zoback, 2000). However, it is not known whether the reactivation of pre-existing faults and fractures triggering the seepage are dependent on very small pore-pressure or stress changes (Oye et al., 2022), with a time-transgressive understanding of seepage pathways and periodicity in marine environments primarily limited by the frequency of (i.e., conventional) seismic acquisition and the inattention to data conditioning in seismic post processing.
Here, we conduct integrated analyses of high-resolution (6.25 x 6.25 m) P-cable 3D seismic and Chirp data to constrain deformation structures and fluid flow features at an unprecedented level of detail along the Vestnesa Ridge, an active deep-water gas hydrate and seepage system in the eastern Fram Strait. We pay close attention to the small (<20 m) geological features in the post-stack processing (see Supplementary Appendix SA) and maintain a high signal-to-noise ratio to avoid removing key information in the seismic data. Our results reveal new insights into spatial and temporal variations in the amount of sediment deformation and associated gas migration related to episodic seepage events since the start of the Mid-Pleistocene Transition [∼1.2 million years ago (Ma)]. The integration of advanced seismic attributes with chronostratigraphic information from this region also allows key time intervals of enhanced sediment fracturing to be constrained. We discuss the influence of gas hydrate and glacial dynamics on sediment deformation and seepage periodicity, and how key transitions in the climate and ocean systems have potentially impacted sub-seafloor fracture formation and seepage activity at Arctic deep-marine fluid flow systems.
2 Study area
2.1 The Vestnesa Ridge
The Vestnesa Ridge is a 100 km long and 3–5 km wide contourite drift in the eastern Fram Strait at ∼1,200–1700 m water depth. Located approximately 100 km to the north of the Molloy Transform Fault (MTF), the Vestnesa Ridge lies between the ultra-slow spreading Molloy Ridge and the Knipovich Ridge (Figure 1). Beneath the contourite drift lies a young (<20 Ma) relatively hot oceanic crust (Vanneste et al., 2005; Bünz et al., 2012). Young oceanic crust has higher geothermal gradients, which leads to more buoyant fluid and more active flow. Geothermal gradients increase from 70°C/km over Vestnesa Ridge to 115°C/km closer towards the MTF (Crane et al., 1991; Vanneste et al., 2005). The Knipovich Ridge is the northernmost extension of the Mid-Atlantic Ridge system that propagated northwards and is now buried by thick contourite deposits in the study area (Crane et al., 2001; Vanneste et al., 2005). Extensional faults propagate northwards from the Knipovich Ridge, changing in orientation (∼N–S to NW–SE) further from the Knipovich Ridge spreading center towards the southern rim of the Vestnesa Ridge (Crane et al., 2001; Vanneste et al., 2005; Hustoft et al., 2009; Plaza-Faverola et al., 2015).
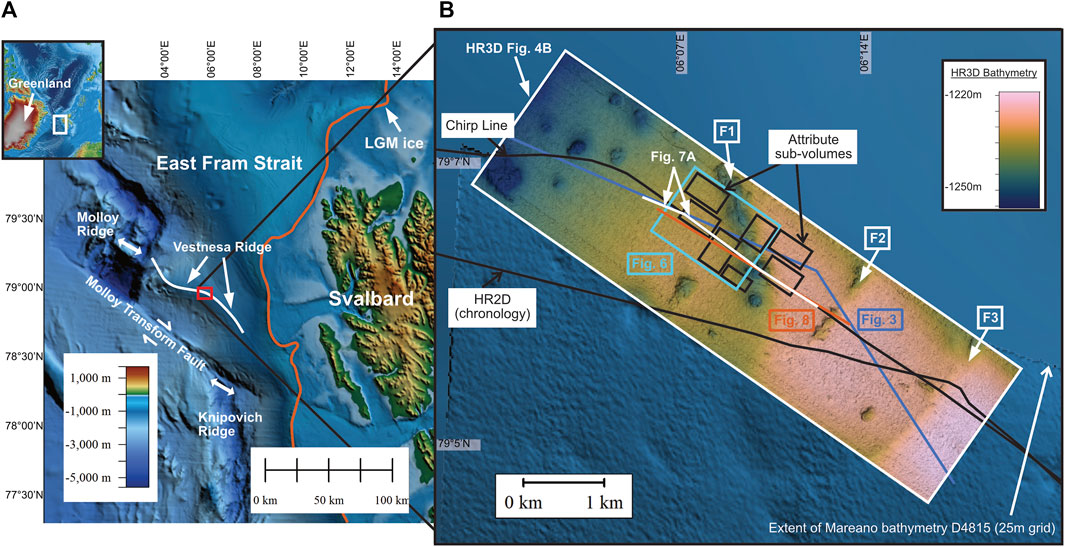
FIGURE 1. Location map of the Vestnesa Ridge in the eastern Fram Strait (A) with IBCAO (200 m x 200 m) bathymetry; the orange line (A) corresponds to the maximum extent of the Barents Sea ice sheet during the Last Glacial Maximum (LGM) adapted from Patton et al., 2015a. Study area (B) displays the HR3D seismic bathymetry (white box); a HR2D line connecting the chronostratigraphy from the east of the Vestnesa Ridge and the Chirp data (black lines); 7 sub-volume selections for fracture density attribute work (black boxes), 1 K1 attribute sub-volume selection (cyan box) (Figure 6); 3 HR3D and Chirp composite lines (orange, lilac and white lines). Overlying the IBCAO bathymetry (A) is the higher resolution (25x25 m) bathymetry (B) available from the region (e.g., from Mareano, and UiT multiple surveys) which overlaps the HR3D bathymetry (B). The seafloor was converted to depth using the water column velocity (CAGE 18-4 cruise report: Bünz, 2022).
The Vestnesa Ridge has a sediment thickness of ∼5 km (Lebedeva-Ivanova et al., 2019) on the ridge and decreases in thickness to hundreds of meters towards the Knipovich and MTF (Breivik et al., 1999; Ritzmann et al., 2004; Bünz et al., 2012). The reflection characteristics of the seismic sections are typical of a slope-sheeted drift, as described in the area northwards, towards the north east of the Spitsbergen Fracture Zone (Osti et al., 2019). The drift is influenced by bottom current controlled sediment activity that began during the opening of the Fram Strait during the middle and late Miocene (Eiken and Hinz, 1993; Osti et al., 2019). Three main stratigraphic units are defined for the Yermak Plateau and the Vestnesa Ridge: YP-1, YP-2, and YP-3 (Eiken and Hinz, 1993). The base of the youngest unit (of main interest for this study), YP-3, is associated to an age estimate of 2.7 Ma, constrained by the Ocean Drilling Program Leg 151 on the Yermak Plateau (ODP Hole 912 (Mattingsdal et al., 2014)). The boundary between YP-2 and YP-3 thus marks the transition of pure contourite deposition to the deposition of glacially transported sediments (Knies et al., 2018; Osti et al., 2019). Characteristic sediments of YP-3 include extensive, regional ice-rafted debris (IRD) (Howe et al., 2008; Sztybor and Rasmussen., 2017) and laminated silty turbidites (Jessen et al., 2010), attributed to an increase in sediment supply from beneath fast flowing ice streams during periods of rapid melting.
The Vestnesa Ridge consists of an eastern segment with a narrow peak forming an anticline that strikes NW–SE, parallel to the MTF. The ridge crest flattens towards the west and extends E–W towards the Molloy Ridge (Figure 1A). Gas hydrates are an important component of the Quaternary sedimentary system along the entire ridge. A widespread bottom-simulating reflection (BSR) has been mapped and it extends from the ridge crest towards the ridge flanks (e.g., Plaza-Faverola et al., 2017). Gas hydrates have been sampled as thin, small flakes and as more massive several cm-long concentrations from sediment cores within the upper 6 m at sites on the eastern end of the sedimentary ridge (e.g., Panieri et al., 2017; Sultan et al., 2020). Head space gas samples along the ridge indicate the presence of methane and heavier hydrocarbons with a thermogenic signature in addition to microbial methane (Plaza-Faverola et al., 2017; Pape et al., 2020).
Hydrocarbon migration modelling at the Vestnesa Ridge suggests large scale fluid migration started around 6 Ma and reached the seafloor around 2 Ma (Knies et al., 2018; Daszinnies et al., 2021). High-resolution P-Cable 3D seismic reveals multi-stage buried pockmarks indicating that recurrent seepage events have occurred episodically with the onset of northern hemisphere glaciations ∼2.7 Ma (Plaza-Faverola et al., 2015). Several periodic events of seepage have also been reported via paleontological proxies since the Last Glacial Maximum (LGM) (Panieri et al., 2014; Consolaro et al., 2015; Sztybor and Rasmussen, 2017; Schneider et al., 2018; Himmler et al., 2019). Seepage has remained active along the entire ridge until a few thousand years ago (Bünz et al., 2012) when high flux seepage ceased in the west but remained active in the east (Plaza-Faverola et al., 2015). Despite the absence of acoustic flare activity in the west, piezometer data reveal shallow (<10 m) high-pressured sediments (e.g., Sultan et al., 2020) suggesting the presence of gas in the near-surface sub-seafloor.
Pockmarks are widespread on the present day seafloor (e.g., Vogt et al., 1994). All pockmarks at the Vestnesa Ridge are seafloor expressions of focused fluid flow identified as chimneys and pipes in subsurface seismic data (Petersen et al., 2010; Bünz et al., 2012). Gas hydrate and fluid flow studies at the Vestnesa Ridge have largely focused on the active pockmarks in the east. Two large (ca. 500 m in diameter) pockmarks (i.e., Lunde and Lomvi), have been used to study paleo-methane seepage and methane transport mechanisms (Smith et al., 2014; Panieri et al., 2017; Dessandier et al., 2019; Yao et al., 2019; Hong et al., 2021; Sauer et al., 2021; Domel et al., 2022). Previous studies suggest that the regional stress regime is the main external factor controlling the long-term pattern of gas seepage here (Plaza-Faverola and Keiding, 2019). However, shorter periodicity seepage is not included in these studies. To the west of the Vestnesa Ridge, pockmarks are more widespread, yet less well studied. Here, they are referred to as inactive or dormant because gas bubbles have not yet been observed in echosounder data, despite decades of acoustic surveying (Bünz et al., 2012). The inactivity of pockmarks in the west, however, does not rule out the possibility that seepage is occurring as micro-seepage or intermittently. Recent studies suggest that seepage periodicity at the Vestnesa Ridge may be related to pressure changes induced by sea-level changes or other external mechanisms able to generate seismicity (Domel et al., 2022); other studies suggest that external pressure is generated by sediment compaction, gravity sliding, and glacial isostatic adjustment (controlled by varying ice sheet thicknesses) (Himmler et al., 2019; Vachon et al., 2022).
3 Data and methods
A high-resolution 3D (HR3D) seismic data volume is the primary dataset for this study. The data were acquired and processed on board the RV Helmer Hanssen in July 2018 during the Centre for Arctic Gas Hydrate, Environment and Climate (CAGE) 18-4 cruise (Bünz, 2022), using the P-cable seismic system (e.g., Planke et al., 2009; Petersen et al., 2010).
The HR3D volume covers an area of ∼2 x 7 km. Data were acquired using 14, 25 m long streamers, with eight channels per streamer. The source consisted of 2 mini-GI guns (30/30 in3 and 15/15 in3) firing every 6 s at a ship speed of 4-5 knots and with a sampling rate of 0.25 s. Onboard processing included geometry assignment, bandpass-filtering with a frequency of 18-25-400–500 Hz, spherical divergence, noise attenuation, de-ghosting, CDP binning at 6.25 x 6.25 m, static corrections, NMO correction, stacking and 3D post stack Stolt migration, using a stacking velocity of 1,480 m/s. The lateral resolution after migration is given by a bin size of 6.25 x 6.25 m, and the vertical resolution is ∼4–5 m at the seafloor (calculated as λ/4 using a water velocity of 1,480 m/s and for a dominant frequency of 138 Hz).
A high-resolution (20–300 Hz) 2D (HR2D) seismic line was collected along the crest of the ridge (Figure 1B) documented in Plaza-Faverola et al. (2017). The HR2D line is used in this study to establish chronostratigraphic constraints based on previous studies (Plaza-Faverola et al., 2015; Plaza-Faverola et al., 2017; Knies et al., 2018; Himmler et al., 2019; Alexandropoulou et al., 2021; Dessandier et al., 2021).
Chirp data was acquired during the CAGE 19-3 cruise on board the R/V Kronprins Haakon (Knies and Vadakkepuliyambatta, 2023) (Figure 1B). The data were acquired using the hull-mounted Kongsberg SBP300 (MK2) with frequencies between 2.5 and 7 kHz. Instantaneous amplitude was applied during the recording of the processed sequence. The frequency sweep of the Chirp source pulse suppresses source ringing and enhances the vertical resolution (Quinn et al., 1998). The maximum vertical resolution of the system is 0.3 m, and the bin size is approximately 10 m, given the average distance between traces.
3.1 Seismic attributes
Seismic attribute analyses allow us to extract additional information from seismic data, leading to enhanced seismic data interpretation and understanding of subsurface geological processes (e.g., Li and Zhao, 2014). A ‘fracture density’ attribute workflow (Supplementary Appendix SA2; Figure 2, section 3.1.3) is used in this study on multiple sub-volumes of HR3D seismic data (areas outlined in Figure 1B) and interpreted in conjunction with two additional seismic discontinuity attributes (section 3.1.2): ‘variance’ (Supplementary Appendix SA1, SA2) and ‘most positive principal structural curvature (K1)’ (e.g., Al-Dossary and Marfurt, 2006) (Supplementary Appendix SA1, SA2).
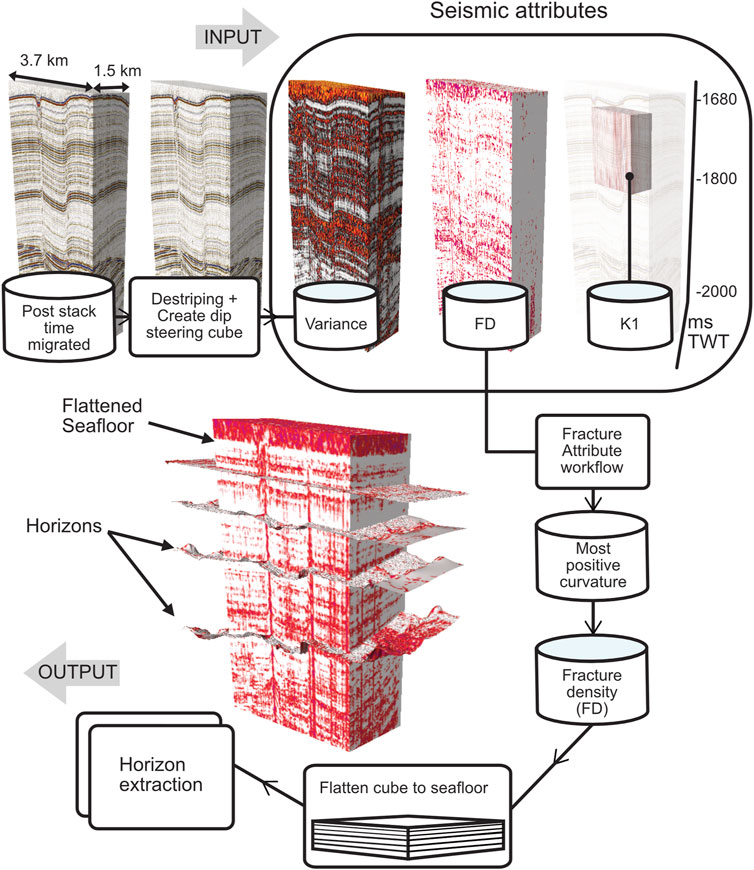
FIGURE 2. Seismic attribute workflow detailing steps used in the fracture attribute processing prior to horizon extraction. The input for the attributes consists of the original seismic volume after removing the residual statics (MGS-destriping). The fracture density (FD) attribute volume requires the calculation of most positive curvature first, prior to calculating FD. A set of horizons were extracted from the FD volume, after seafloor flattening (see Supplementary Appendix SA2 for information on parameters used in the workflow).
3.1.1 Data conditioning
Post stack seismic data should be optimally processed prior to the computation of seismic attributes. This is referred to as data conditioning or image enhancement (e.g., Al-Dossary and Marfurt, 2006; Chávez-Pérez and Vargas-Meleza, 2008). Despite high-resolution static corrections applied in the pre-processing, some residual statics remained in the datasets, revealing an undesirable acquisition footprint. Without footprint removal, artifacts are enhanced in further data conditioning steps and problems arise during the detection of real amplitude discontinuities (Chopra and Marfurt, 2013). In this study, the seismic data is first conditioned with geostatistical filtering using the M-GS Destriping (see Supplementary Appendix SA2) which removes the acquisition geometry footprint from the post stack cube. In addition to geostatistical filtering, a recommendation in structural interpretation is to apply a structure-oriented filter (Fehmers and Höcker, 2003) or dip-steered median filter prior to fault characterization (e.g., Ashraf et al., 2020; Acuña-Uribe et al., 2021). In our fracture density attribute workflow, dip estimation was calculated using the dip steered median filter (DSMF) (principal component analysis (PCA) + median filter (MF)) (Supplementary Appendix SA2). The DSMF decreased the random noise and smoothed the seismic reflectors slightly, keeping the desired geological features intact.
3.1.2 Seismic discontinuity
Coherence and curvature-related seismic attributes are referred to as discontinuity attributes in this work (see Supplementary Appendix SA1). Coherence measures the similarity between waveforms on neighboring traces, while curvature measures lateral changes in dip and azimuth. Both these attributes are widely used as edge detection methods for fault and fracture characterization (e.g., Lisle, 1994; Bahorich and Farmer, 1995; Marfurt et al., 1999; Roberts, 2001; Hart, 2002; Al-Dossary and Marfurt, 2006). They may also be used to detect subtle stratigraphic features (e.g., channels and turbidites, Blumentritt et al., 2003). Falsely interpreted features caused by velocity pull-ups and push-downs and apparent faulting created by noise contamination may also be present (Roberts, 2001).
A plethora of different coherence algorithms exist, and their availability varies between various software packages. In this study we used ‘variance’ which is the inverse of coherence (Supplementary Appendix SA1). High variance (low coherence) can suggest faults or high fracture intensity. Coherence will fail when the offset (or difference in waveform) is below the seismic resolution, causing the seismic reflector to appear continuous (Gao, 2013). Most positive and most negative curvature-related attributes are known to provide some of the best illumination of faults and fractures over other discontinuity attributes (Chopra and Marfurt, 2007). To extract as much detail as possible from the HR3D dataset we use most positive curvature, in the fracture density attribute workflow (Supplementary Appendix SA2; Figure 2) and qualitatively compare the result with the variance and K1 attribute. Most positive curvature is computed on the full HR3D dataset followed by fracture density in separate sub-volumes. K1 was computed on a single sub-volume that areally encompasses the fracture density sub-volumes (Figure 1B).
3.1.3 Fracture density
The fracture density attribute is used to highlight regions of high density fractures. It improves the visualization of potential fracture anomalies by computing the ratio of the number of traces classified as being fractures to the total number of traces present (e.g., Klokov et al., 2017; Ashraf et al., 2020). A radius for scanning is required for the computation and a discontinuity attribute as input to define the fracture anomalies. Most positive curvature was used as the attribute input, with a radius of scanning set to 20 m (Supplementary Appendix SA2).
Prior to horizon extraction, the fracture density volume was flattened to the seafloor (Figure 2). To verify that the resulting fracture density trends were robust we divided the whole volume into 7 fracture density sub-volumes (Figure 1). These sub-volumes were selected with the aim of covering key areas with seafloor structures of relevance (e.g., potential weakness zones associated with major faults in the region; zones mainly free of large fluid flow structures and areas of minimum velocity seismic disturbance for ease of horizon mapping). 24 fracture density horizons were extracted from each 7 sub-volumes with a total of 168 extractions. The 24 horizons represent the ∼170 m interval from the seafloor to the base of the GHSZ. For a more quantitative approach, the mean fracture density was extracted for each horizon. The mean was then multiplied by the respective sub-volume surface to calculate the weighted mean value, giving an overview of fracture density for each horizon.
3.2 Extraction of seafloor and buried pockmark diameters
The shape of the pockmarks was systematically extracted from 5 (10 x 10 m) digital elevation model (DEM) surfaces (H0, H0.3, H1, H2, H2.25), using a rule-based GIS methodology, which defines the pockmark perimeter by analysis of closed-contour properties (Patton et al., 2015). A 1 m contour interval was used, as well as a minimum depth threshold of 2 m for defining pockmarks; other default parameter values remained unchanged. Reflection sags from velocity push-down effects were also extracted from the DEM data and investigated. The size and shape of the pockmarks can provide information about the strength of the fluid flow at each selected horizon and the directionality of the flow if the pockmarks are elongated.
3.3 Chirp data analyses
Chirp data was used to validate fine-scale structures revealed by the various attributes from the HR3D seismic data. The Chirp data provides a higher vertical resolution than the HR3D by a factor of ∼20, in the upper 40 m of the sedimentary column, while the HR3D seismic data provides better penetration (∼200 m i.e., beyond the base of the GHSZ). The high vertical resolution in the Chirp aids the interpretation of fine <0.5 m layering, displayed as the reflection strength, referred to as the envelope of the acoustic wave (Schock, 2004; Zhang and Digby, 2013). The envelope display highlights geological features, such as gas accumulation and faults with only positive values, where peaks reveal high impedance and troughs low impedance.
3.4 Gas hydrate stability zone modelling
To constrain the range of variability of the GHSZ and its effect on fluid dynamics along the investigated transect of the Vestnesa Ridge we ran a 2D transient heat equation model with the temperature and pressure of hydrate-phase equilibrium calculated at each time step using the van der Waals and Platteeuw model (Sultan et al., 2020). We implemented the approach by Sultan et al. (2020) using constraints from cross-disciplinary studies in the area for the last ca. 35 ka (i.e., the constraints for bottom water temperatures and sea-level changes for the Fram Strait are restricted to ca. 33 ka which is the length of available analysed sedimentary records (Ezat et al., 2014; Sessford et al., 2018). Our initial model is an 8-layer model constrained using porosities, thermal conductivity and corresponding sea-level (Peltier and Fairbanks, 2006; Daszinnies et al., 2021) (Supplementary Appendix SB). We generated a simplified bottom water temperature function for the last 35 ka by integrating the data in El bani Altuna et al. (2021), Ezat et al. (2014) and Ezat et al. (2021) (Supplementary Appendix SB). We used an average geothermal gradient (GTG) of 90°C/km (Plaza-Faverola, 2020). Sensitivity tests for reasonable variations in the GTG, bottom water temperatures and salinity conducted for a BSR model along the entire Vestnesa Ridge shows that modelling uncertainties at our study site is in the range of −/+ 20 m (Plaza-Faverola et al., 2017). To compare the modelled BSR depth with the observed BSR, the seismic transect was depth converted following the approach in Plaza-Faverola et al. (2017). For this area they used P-wave interval velocity constraints from two ocean bottom seismometers (OBSs) located >20 km apart from each other along the Vestnesa Ridge used by Petersen et al. (2010). Their sensitivity test for a range of interval velocities showed that the estimated depth of the reflections may have an uncertainty of −/+ 8 m (Plaza-Faverola et al., 2017).
These experiments provide a sense of the shift of the BSR depth in response to the simultaneous effect of changing pressures (sea-level) and temperatures (ocean bottom temperatures) during major climatic transformations (i.e., glacial-interglacial transitions) within the last 35 ka. Gas hydrate dissociation may have occurred after the LGM initiated by elevated bottom water temperatures during oceanic warming (i.e., Heinrich Stadial 1: ∼16 ka) in the last deglacial period (El bani Altuna et al., 2021). We use the BSR behaviour modelled for this period as a reference to discuss the magnitude of changes that can be expected during other comparable major paleoclimatic events and the implications for understanding sediment deformation processes.
4 Results and interpretation
4.1 Seafloor morphology and outcropping sedimentary faults
The depth of the bathymetry for the HR3D survey area ranges from 1,217 to 1,264 m and deepens gradually from east to west (Figure 1B). The investigated sedimentary sequences extend to ca. 1,400 m below the sea surface. The deepest interpreted surface (H2.25) is closest to the gas hydrate related bottom-simulating reflection (BSR) (section 4.2).
There are two main faults (F1 and F2) that display large depressions along the strike (Figure 3, Figure 4B, Figure 1B), located in the center of the survey area. A third major fault (F3) lies 1.6 km to the east of F2 with the same strike (∼NE–SW) orientation. F1 and F2 are located between bathymetric highs BH1 and BH2 which have their long axis in line with the orientation of faults F1 and F2 respectively (Figure 4B, Figure 1B).
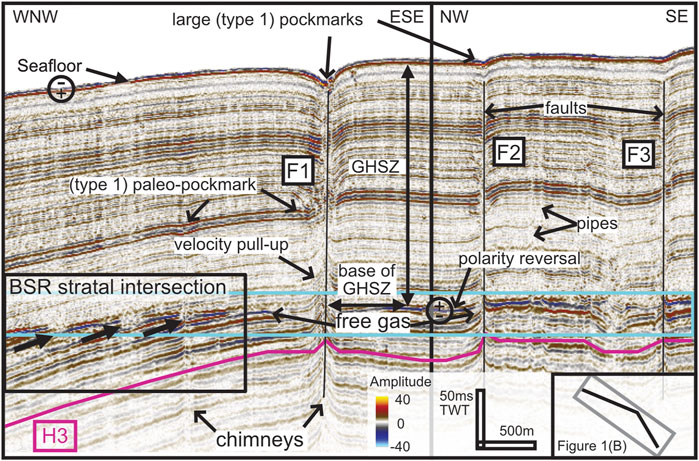
FIGURE 3. HR3D composite seismic section displays faults F1, F2 and F3 (vertical black lines) and the base of the gas hydrate stability zone (GHSZ) revealed by the bottom-simulating reflection (BSR) (enclosed in the cyan box). Where the bathymetry dips downwards towards the WNW the dipping lithology intersects the BSR indicated by the upward dipping black arrows also marking vertical disturbances (i.e., gas chimneys) originating from beneath the BSR. The magenta line beneath the BSR marks the ∼1.5 Ma chronostratigraphic event used to calculate sediment ages marked as horizon H3. The magenta line (horizon H3) beneath the BSR marks the ∼1.5 Ma chronostratigraphic event used to calculate sediment ages (between ∼0.4 and ∼1.5 Ma), (see Figure 8). Chimneys/pipes and type 1 buried (paleo) and present day, pockmarks are indicated. Velocity pull-up features are expressed in the seismic above, at, and below the BSR (revealed most clearly at Fault F1).
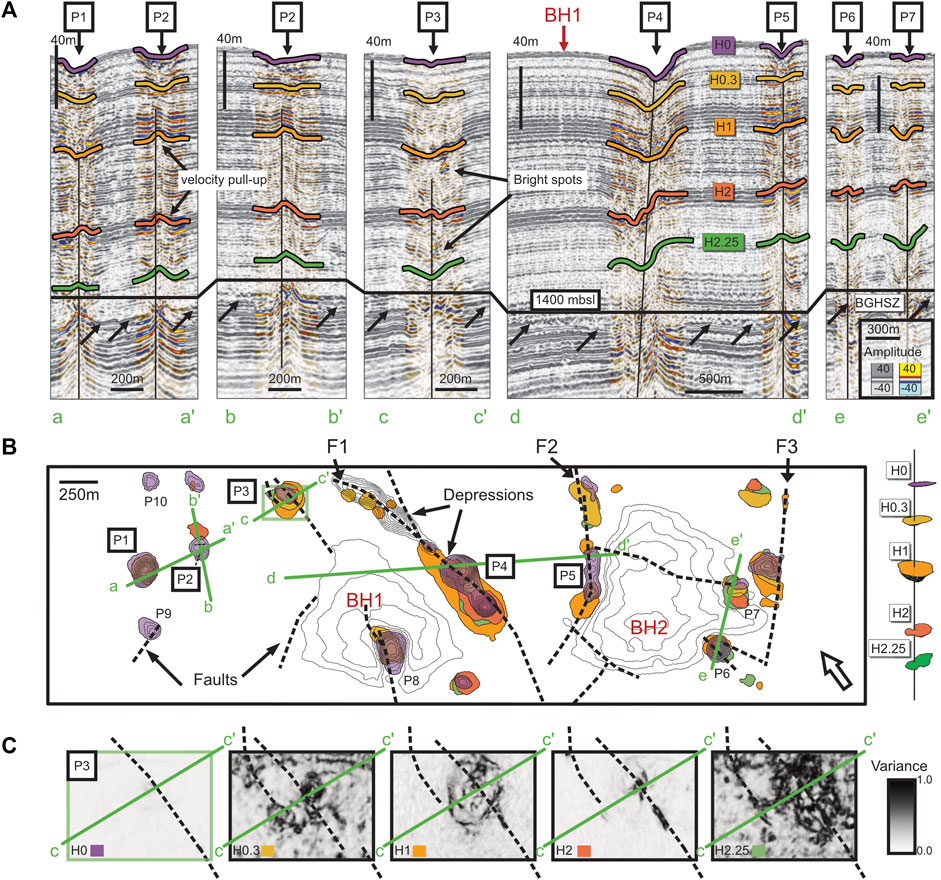
FIGURE 4. (A) Depth converted HR3D vertical sections (a—a’, b—b’, c— c’, d— d’, e—e’) across 7 present day, type 1 pockmarks on the seafloor (see Figure 1B for the HR3D seafloor bathymetry). Five horizon surfaces (H0/Seafloor, H0.3, H1, H2 and H2.25) above the base of the gas hydrate stability zone/bottom-simulating reflection (BGHSZ/BSR), are indicated. (B) Extracted pockmarks from 5 (10 x 10 m) digital elevation model (DEM) surfaces (H0/Seafloor, H0.3, H1, H2, H2.25) using a rule-based GIS methodology (Patton et al., 2015). Bathymetric highs (BH1 and BH2) as well as faults (F2 and F3) are indicated together with extracted seafloor and buried pockmarks. (C) Variance surface extractions at pockmark P3 (H0/Seafloor, H0.3, H1, H2 and H2.25) show differences in fluid activity at each horizon surface.
4.2 Gas hydrate and fluid flow indicators
We observe typical direct hydrocarbon indicators (DHIs) as amplitude anomalies due to the presence of hydrocarbons in the sediments. The first prominent indication of sub-seabed fluid flow dynamics is the presence of the BSR that can be imaged within the entire area at depths ranging from ∼1875–1915 ms TWT ((∼165–170 m beneath the seafloor (mbsf)) (Figure 3). The BSR is characterized by anomalously high amplitudes and a phase reversal with respect to the seafloor polarity indicating the presence of free gas trapped beneath gas hydrate bearing strata (Figure 3). The BSR gets shallower westward with respect to the seafloor (Figure 3, Figure 4A) and is most clearly defined where it cross cuts stratal reflections (Figure 3). In sections, the high amplitude reflections are punctured and locally disturbed creating a discontinuous BSR (Figure 3). The disturbances extend vertically through the seismic data and terminate at the seafloor. They are interpreted as vertical focused fluid migration features (i.e., chimneys or pipes, Løseth et al., 2009; Bünz et al., 2012). The distribution of the chimneys is reflected on the seafloor as pockmarks (Figure 1B, Figure 3, Figure 4).
We observe bright spots (Figure 4A) inside some of the chimneys potentially indicating trapping of fluids at preferential sedimentary or structural features or representing real morphological features such as buried authigenic carbonate domes or infilled buried pockmarks often documented from other margins (e.g., Løseth et al., 2011; Heggland, 2005; Hustoft et al., 2007; Plaza-Faverola et al., 2015).
Gas chimneys provide evidence for gas transport and release into paleo and present day seafloors. The present day seafloor is characterized by two types of fluid seepage indicators. Type 1: large pockmarks (<50 and >250 m width and 5–10 m deep) (Figure 4B) and type 2: small-scale pockmarks (<20–50 m width and very shallow ∼1–3 m deep/minimum resolution of seismic) (Figures 5, 6).
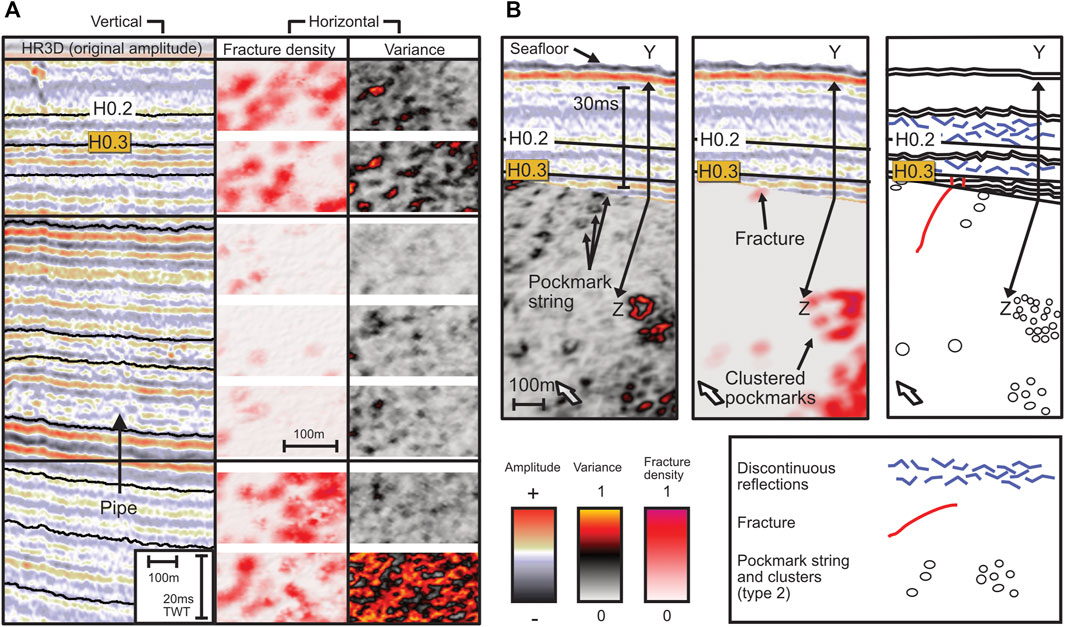
FIGURE 5. (A) Seismic inset from a HR3D inline after seafloor flattening illustrating changes in the seismic character of the fluid flow system. Key seismic horizons are displayed for reference. The insets to the right correspond to fracture density and variance extracted along the indicated horizons. Notice the vertical change in the seismic response across the three indicated regions. (B) Chair views, zoomed in on the same inline (88) as in (A) with (left to right) horizontal variance volume slice (Z: 1720.50), horizontal fracture density (Z: 1720.50), and cartoon combining features observed in the original amplitude, variance and fracture density volumes.
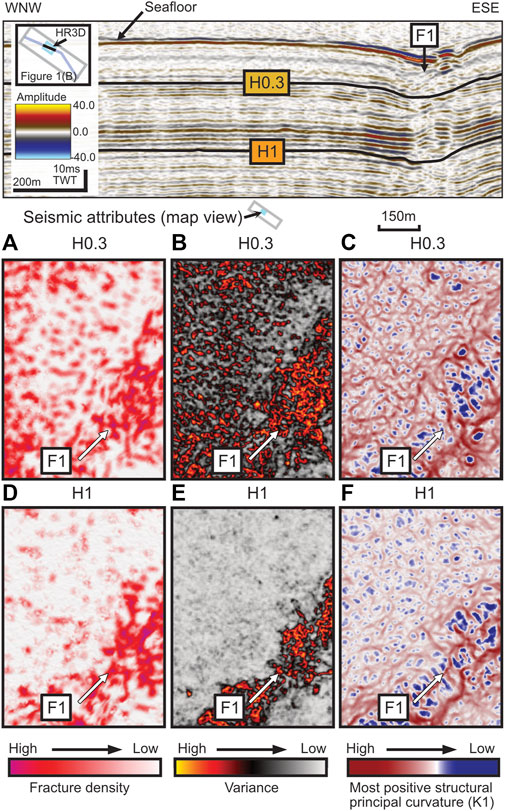
FIGURE 6. Above: HR3D composite seismic section displaying fault F1 indicating location of 2 horizons H0.3 and H1. Below: Comparing three surface attribute extractions (see Figure 1B for location of the area) for both horizons H0.3 (A–C) and H1 (D–F). Fracture density: H0.3 (A) and H1 (D); variance H0.3 (B) and H1 (E) and most positive structural principal curvature (K1) H0.3 (C) and H1 (F).
The large pockmarks (type 1) (e.g., pockmarks P1–P8) are distributed within the investigated 3D volume area (Figure 4B) with some of them following structural lineaments and faults (Figure 4B). The pockmarks with the largest areal surfaces are prominently expressed within F1, in the center of the 3D volume. Here several pockmarks have merged forming irregular shapes (Figure 1B; Figure 4B).
The chimneys vary in character throughout the sedimentary column. The areal surfaces of the chimney structure at each horizon are highly varied in many cases (e.g., P3, P4 and P7: Figure 4B). The seismic disturbance zone sometimes displays narrowing at the surface compared to a much broader buried surface at depth (e.g., P3: Figures 4A, B). Some chimneys display a pull-up effect (e.g., P2: Figures 4A, B) resulting in an apparent pockmark extracted from the DEM surfaces, offset from the central chimney (Figure 4B). The velocity pull-up effect at the P2 chimney starts nearby horizon H2 and affects the seismic below until the BSR. Above horizon H2 the only true pockmark is revealed on the seafloor (Figure 4B).
The variation in the areal extent of the chimney area is shown most clearly in pockmark P3 (Figures 4A–C). A broadened chimney unit is represented by horizon H1 while chimney narrowing is represented by horizons H0 and H2 (Figure 4C). Another notable characteristic is the high level of variance at horizons H0.3 and H2.25 (Figure 4C). The chimney typically broadens at more laterally disturbed seismic reflections and narrows at more laterally continuous seismic reflections (possibly related to the type of sedimentary deposit).
4.3 Sub-seismic scale indications for fracturing and fluid flow
The small-scale pockmarks (type 2) are widely distributed in the seismic volume yet vary in size and density between stratigraphic units (Figure 5). It is difficult to interpret the character of each type 2 feature on a large scale, owing to their small size (<20 m) and high density. However, patterns are observed in variance maps (Figure 5, Figure 6). Higher densities of type 2 features are observed within and at the outer limits of fault zones (Figure 6). In some instances, type 2 features form circular rings, they may be elongated or aligned forming short chains (Figure 5B).
The approach used to visualize only the positive peaks of curvature represented in the seismic (referred to as anticlinal flexures), (relating to both large-scale and small-scale features), was to use fracture density and K1 attributes. The fracture density attribute reveals where fractures intersect, or where there are a high number of them. The anticlinal flexures of the K1 attribute fill in the white spaces (high coherence) between the small-scale pockmarks (type 2) in the variance attribute. We therefore use the three attributes combined, to understand the distribution of small-scale pockmarks (type 2) and their placement, with respect to fractures and faults (Figure 6).
The K1 attribute demonstrates an enhanced curvature inside of the main fault F1 at horizon H0.3 and slightly less outside of the fault zone (Figure 6C). Similar spatial trends can be observed also in the fracture density and the variance attributes (Figures 6A,B). All three attributes document a high degree of disturbance along H0.3 interpreted as small-scale deformation. Along horizon H1 (Figures 6D–F), the three attributes clearly show the fault zone belonging to F1 as deformed, with high variance (low coherence) and curvature. However, the strata outside of it is much less disturbed than it is at H0.3. The key difference between the horizons containing high fracture anomalies and those of an overall low fracture anomaly is the lateral spread of deformation (reflected by an increase in small-scale pockmark intensity (Figure 4C H0.3 and H2.25, Figure 5A, Figures 6A–C). HR3D horizons displaying less defined small-scale pockmarks (e.g., H1) display weaker fracture density anomalies and a thinner main fault zone (Figures 6D, E, F). Those horizons displaying the most defined fracture density anomalies (e.g., H0.3) display strongly defined small-scale pockmarks that extend outwards from the thicker main fault zone and appear connected to the change in the strength of the fluid activity (Figures 6A–C).
Considering that the pattern of discontinuity in the K1 attribute map appears as interconnected joints (best represented in Figure 6C) and that high anomalies are similarly represented in all the discontinuity attributes (Figures 6A–C), we choose the fracture density anomalies to indicate the most likely deformation by ‘fracturing’ and identify sedimentary intervals that are ‘highly deformed’ (from hereon, also referred to as ‘highly fractured’).
There are two highly deformed intervals (HDIs) located, 1) near the seafloor surface at ∼20 to 30 mbsf (Figures 7, 8) and 2) at 20–40 m above the present day BSR (∼170 mbsf) (Figure 8). Of the 24 interpreted horizons in our study, there are three that are contained within the upper highly deformed interval. Between the seafloor and horizon H1, there are three fracture density peaks (I–II, III and IV) (Figure 7); and between horizon H1 and the base of the GHSZ, there are also three fracture density peaks V, VI and VII (Figure 8). Between the two highly deformed intervals (HDIs; Figure 8) there is a significantly less deformed interval (LDI; Figures 6D–F, Figure 8). Fracture density values remain consistently at lower ranges within the less deformed interval. Fracture density peaks contained within the highly deformed intervals are characterized by highly discontinuous seismic responses relative to the less deformed units (Figure 5A, Figure 7D).
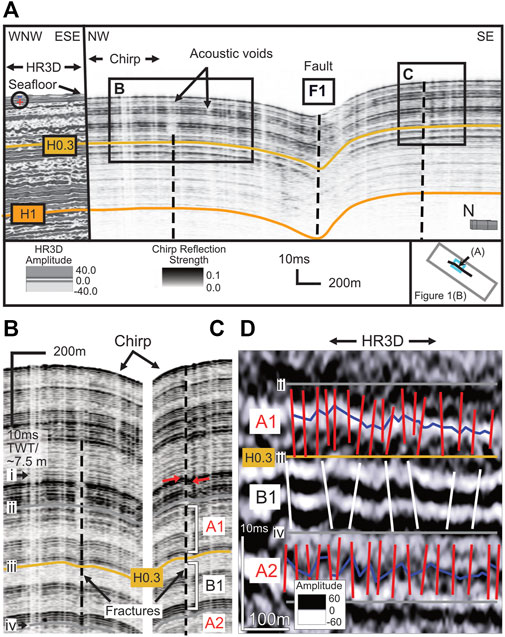
FIGURE 7. (A) Intersecting composite HR3D and Chirp lines to compare seismic character between the two separate datasets and locations of horizons H0.3 and H1. Acoustic voids and small-scale fractures (red arrows in (C) display offset) are clearly revealed in insets (B) and (C) either side of fault F1. Fracture density peaks, specifically (II-IV) (see Figure 8) are marked in the Chirp section in (B) and in the sampled HR3D vertically exaggerated seismic section in (D). The fractures indicated by the vertical broken black line (C) are visible only in the Chirp dataset. Highly fractured units (A1, A2) (indicated by sub-vertical red lines which disrupt the manually traced (purple) horizon (D)) are also marked by the white square brackets in the Chirp section (C). The acoustic void (center of inset B) is contained within the highly fractured unit A1. Horizon H0.3 is at the base of unit A1. Unit B1 (C), (D) contains more continuous seismic reflections and less interpreted fracturing, indicated by fewer sub-vertical (white) lines.
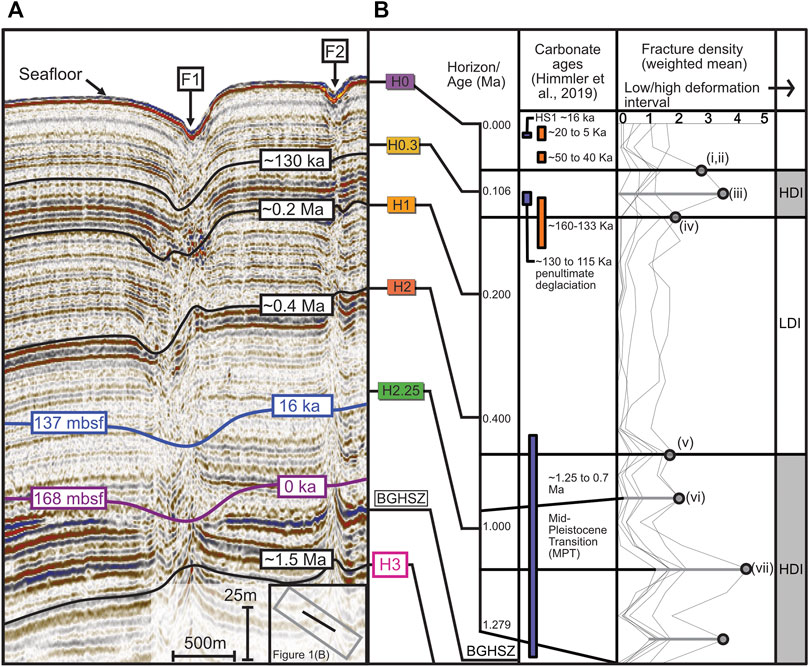
FIGURE 8. (A) Depth converted HR3D composite line with chronostratigraphic markers (black lines) (∼130 ka, ∼0.2 Ma, ∼0.4 Ma and 1.5 Ma). The purple line (168 m below sea floor (mbsf)) indicates the depth to the present day (0 ka) base of the gas hydrate stability zone (BGHSZ), and the blue line (137 mbsf) indicates how much the BGHSZ has shifted from the present day to the peak oceanic warming during Heinrich Stadial 1 (HS1) following the Last Glacial Maximum (LGM)) (see Figure 9). (B) Two highly deformed intervals (HDI) interpreted from the peaks in the fracture density plots, correspond to two significant climatic periods (the penultimate deglaciation and the Mid-Pleistocene Transition (MPT). Between the two major climatic events is a low deformation interval (LDI). Horizon ages are calculated based on rates of sedimentation using established seismic chronostratigraphy. Carbonates are present during the penultimate deglaciation (∼130 ka) (Himmler et al., 2019) coinciding with the (younger) HDI. Fracture density peaks are indicated by filled grey circles.
The sub-volumes used in the fracture density study (Figure 1B) were positioned across the major fault (F1). As expected, the sub-volumes in close range of the fault are among those displaying the highest fracture density peaks (Figure 8). In the upper highly deformed interval (HDI), the three sub-volumes (closest to F1) show a higher overall average of fracture density than the sub-volumes located in a completely fault free zone. However, the fracture density trend with depth matches for each 7 sub-volumes. The varying trends resulting from repeating the approach along given horizons for each sub-volume confirms the veracity of the fracture density patterns.
Highly deformed intervals extend to the present day seafloor. This is evidenced by abundant acoustic masking in the Chirp data (Figures 7A, B). Columnar masking is abundant within the upper ∼30 mbsf. There are narrow (single to multiple trace; 10–20 m) and broad (∼50 m wide x ∼10 m depth) masking events that have either significantly reduced the acoustic energy from the seafloor or from a specific depth (Figures 7A, B, C). The broad events, referred to as acoustic voids or vertical disturbances, are confined within a series of stratigraphic units. The base of the acoustic void appears within the highly reflective unit A1 (Figures 7B–D). Within the same series of fracture density peaks (I-II to III; Figure 7B) there is a <10 m fracture to the east of F1 (Figure 7C). The fracture is displayed on the crest of an acoustic reflection. We may be unable to identify fracturing through displacement if the seismic is disturbed, however we can infer fracture presence from curvature on the edges of acoustic disturbance zones. The disturbance zones are represented in the HR3D variance maps (Figures 5A, B, Figures 6B, E) as small-scale pockmarks.
We argue that the highly deformed events are highly fractured and give way to fluid expulsion forming small-scale (<20 m diameter) pockmarks. The distribution of the small pockmarks also varies between stratigraphic intervals (Figure 5A, Figure 6) providing additional evidence for sporadic fluid discharge. We treat the pockmarks and faulting revealed in the different attributes (i.e., seismic anomalies) to be genetically related and consider the probability of fluid seepage based on fracture density. Within the highly deformed interval, fluid flow mechanisms significantly alter and revert to widespread deformation. The small-scale pockmarks (Figure 6) appear associated with this widespread deformation. The more significant the deformation (as displayed in the fracture density and K1 attribute) the higher the density of the small-scale pockmarks (as seen in the variance attribute) (Figure 5A, Figure 6). This is notable in horizons H0.3 (Figure 4C, Figure 5A, Figure 6B) and H2.25 (Figure 4C) for both major deformation events.
It is possible that the observed deformation features may represent a stage of fracturing that precedes polygonal deformation (Berndt et al., 2003; Cartwright and Santamarina, 2004; Gay and Berndt, 2007) captured at the edge of the resolution of the available seismic data.
5 Discussion
5.1 Chronological framework of sediment deformation and seepage at the Vestnesa Ridge
We identify two major deformation events (HDI: Figure 8) as fluid-leakage-prone intervals that correspond to at least two key climatic events (not yet considering the ocean-driven warming effect, section 5.3) based on existing chronostratigraphic constraints. The HR3D/2D and Chirp surveys were tied to available chronological markers along the Vestnesa Ridge (e.g., Mattingsdal et al., 2014; Plaza-Faverola et al., 2015; Alexandropoulou et al., 2021; Dessandier et al., 2021). We continue the chronostratigraphic reflections marked at drill sites MeBo 125 and MeBo 126 (Dessandier et al., 2021) from the east of the Vestnesa Ridge to the west. In addition, we also continue the 1.5 Ma reflection (Mattingsdal et al., 2014; Alexandropoulou et al., 2021) that dips beneath the base of the GHSZ within our HR3D study area.
The youngest highly fractured interval corresponds to ∼140–70 ka (Figure 8) and coincides with the start of a major seepage event inferred by Dessandier et al. (2021) that began at the end of the penultimate glacial period (Late Saalian) through to the last interglacial period (∼130 ka). The oldest highly fractured interval corresponds to ∼1.2 Ma—0.8 Ma (i.e., coinciding with the Mid-Pleistocene Transition e.g., Head and Gibbard, 2005) and it is situated above the present day base of the GHSZ (Figure 8, Figure 9). Between these two major climatic periods, there is a gap in deformation, where the sediment appears less impacted (LDI: Figure 8).

FIGURE 9. A three-stage sequence (left to right) depicting two types of fracture expression: vertical blue columns highlight zones of vertical fluid flow (i.e., chimneys/pipes) that reach the present day seafloor, and horizontal fractures (irregular yellow shapes) that propagate outwards from the chimneys during significant climatic-oceanic events (i.e., during the Mid-Pleistocene Transition (MPT), followed by the penultimate deglaciation, and the significant oceanic warming period (i.e., Heinrich Stadial 1 (HS1)) during the last deglaciation (post-LGM). In the younger sequences (∼130 ka and post-LGM), enhanced fracturing promoted gas transport, seepage and methane-derived authigenic carbonate formation (yellow filled semi-circles). The older sequences (MPT fractured intervals) are disturbed possibly a second time by localized pressure changes at the free gas zone due to the upward shift of the base of the gas hydrate stability zone (GHSZ) post-LGM, (i.e., blue line). The calculated base of the GHSZ for today (i.e., present day BSR) is represented by the purple line.
5.2 Seepage evolution from the Mid-Pleistocene Transition to the present day
The correlation of highly fractured sedimentary intervals characterized by high density pockmarks with two major climatic events (i.e., the Mid-Pleistocene Transition and the penultimate deglaciation) is in line with studies that associate paleo-seepage in the region with regional glacial dynamics (Consolaro et al., 2015; Plaza-Faverola et al., 2015; Portnov et al., 2016; Schneider et al., 2018; Walmann et al., 2018; Himmler et al., 2019; Plaza-Faverola and Keiding, 2019).
Assuming that the documented fracturing was contemporaneous with the transition from glacial to interglacial periods, we can elucidate the history of glacially influenced Quaternary deformation and associated seepage along the Vestnesa Ridge (Figure 9).
Various studies have suggested that seepage episodes inferred from sedimentary proxies were related to glacial isostasy at the forebulge region of the Barents Sea ice sheet (Schneider et al., 2018; Himmler et al., 2019; Dessandier et al., 2021).
Kinematic fault modelling on land shows that post-glacial rebound transfers stresses to the near-surface and triggers fault reactivation and deformation (e.g., Lund et al., 2009). Whether the same mechanism is valid in offshore regions beyond the ice sheet edge remains to be proven. However, recent glacial stress models show that the Vestnesa Ridge lies in a lithospheric zone (i.e., the forebulge) prone to considerable uplift and subsidence during glacial transitions (Vachon et al., 2022). We propose that the highly fractured sedimentary intervals documented here are evidence of glacial stress transfer to the Quaternary sedimentary succession during maximum uplift and initiation of the subsidence.
The best constrained time intervals and seepage events in the region are over the last ∼130 ka (e.g., Consolaro et al., 2015; Sztybor and Rasmunssen, 2017; Schneider et al., 2018; Himmler et al., 2019) because that is where sedimentary proxies are available. Nevertheless, it is sensible to assume that similar mechanisms would have favored fracturing and seepage at older major glacial transitions.
From bottom to top, the first major glacially induced fracturing and associated seepage event in our model is the Mid-Pleistocene Transition (Figure 9). This significant climatic period represents a time of glacial expansion and increasing ice sheet volumes across the Eurasian Arctic that is tied to a general shift in the duration of glacial cycles from 41 kyr to 100 kyr (Knies et al., 2009; Hjelstuen and Sejrup, 2021; Panieri et al., 2023). The shift towards larger continental-scale ice sheets may have also affected the Vestnesa Ridge, with greater isostatic loading imposing greater mantle uplift in shelf-adjacent forebulge areas (Vachon et al., 2022).
The second and best constrained fracture-controlled seepage event in our model (Figure 9) is that at ∼130 ka, around the transition period between the penultimate glacial maximum and the last interglacial (i.e., the penultimate deglaciation). This seepage event has been recognized at the mid-Norwegian margin (Plaza-Faverola et al., 2012) and on the eastern Vestnesa Ridge segment, where buried authigenic carbonate dating confirmed paleo-seepage events in this area for the first time (Himmler et al., 2019).
For each of the above periods we envision a cyclic process including fracturing, gas seepage, carbonate precipitation, self-sealing, burial, reactivation. Similar processes have been inferred from observations along the mid-Norwegian margin (Hovland, 2002; Hovland et al., 2010). During a period of glacially induced fracturing and sustained methane flux, carbonate precipitation would be expected, as observed and sampled at present day from this and other margins (e.g., Hovland, 2002; Crémière et al., 2016; Mazzini et al., 2017; Himmler et al., 2019). The high fracture density intervals documented here might reveal fractures that have formed after the extensive growth of the carbonates, which have subsequently changed the property of the sediments. Post-glacial fracture development preconditions the system for carbonate growth, and carbonate precipitation eventually seals the sediments, changing the sediment permeability, as demonstrated for vertical fluid migration systems along other margins (e.g., mid-Norwegian margin, Hovland, 2002). This model is relevant to explain why the highly deformed events are confined to specific stratigraphic intervals. Sediment deformation may be reflected by an enhanced precipitated carbonate environment.
Based on this model and the observations of abundant pockmarks on the present day seafloor, we envision that a major seepage event similarly followed the Last Glacial Maximum in the region (Figure 9), with evidence provided from foraminiferal data indicating seepage from 14 to 8 kyr (Consolaro et al., 2015). Today, no active seepage has been observed and the system is believed to be at hydrostatic pressure equilibrium (Ramachandran et al., 2022).
The intensification of glacially induced fracturing would also provide a pathway for a sudden release of gas (Greinert et al., 2001). We suspect that an increase in the density of the small pockmarks is linked to an increase in fluid flow, but it is difficult to determine whether the fracturing forms before, after, or during the release. Despite this uncertainty, we infer that the high fracture density anomalies reveal a high probability of fluid flow at the time of their formation.
5.3 Gas hydrate dynamics during glacial/interglacial transitions
The Vestnesa Ridge has been charged with significant amounts of thermogenic gas since at least 2 Ma (Knies et al., 2018; Daszinnies et al., 2021). A gas hydrate system was already in place at the Mid-Pleistocene Transition at 1.2 Ma. Therefore, gas hydrate dynamics were likely to play a role in enhancing glacially induced seepage in the area.
The effect of isostasy resulting from ice sheet growth and collapse is considered to contribute to shifts in the gas hydrate system (e.g., Wallmann et al., 2018). Stress modelling suggests that the Vestnesa Ridge, which is located on the peripheral forebulge of the Barents Sea and Greenland ice sheets, has experienced uplift and a more tensile stress regime during glacial maximums, and subsidence following ice sheet retreat (Vachon et al., 2022).
The highly deformed interval corresponding to the Mid-Pleistocene Transition exists today at the boundary of the base of the GHSZ (Figure 8, Figure 9), and is most susceptible to hydrofracturing by gas hydrate recycling at the base of the GHSZ (e.g., Haacke et al., 2007; Plaza-Faverola et al., 2012). We imply an adjusted position of the base of the GHSZ in the three-stage sequence (Figure 9), as sediment progressively accumulated from the Mid-Pleistocene Transition (first stage) until the penultimate deglaciation and last deglaciation (second and third stages). In addition, the thickness of the GHSZ fluctuated a few meters in response to the balanced effect of hydrostatic pressure (affected by sea-level changes, sedimentation, and isostasy) and temperature (Ruppel and Kessler., 2017; Serov et al., 2017; Wallmann et al., 2018; Daigle et al., 2020; Trivedi et al., 2022).
Our transient 2D modelling accounts for the balanced effect of sea-level and temperature changes. It shows that during the last deglaciation, elevated and rapid changes in bottom water temperatures (5.5 °C) that initiated ∼16 ka during Heinrich Stadial 1 (HS1) (El bani Altuna et al., 2021) resulted in a maximum upwards shift of the base of the GHSZ by approximately 30 m (Figure 8, Figure 9). However, this model does not account for the effect of isostasy tied to the collapse of the Barents Sea and Greenland ice sheets. This (∼30 m) maximum shift was thus potentially partially compensated by the effect of post-LGM forebulge subsidence, though at 16 ka BP the surrounding ice sheets were still in relatively advanced positions (Vachon et al., 2022).
Nonetheless, even small fluctuations at the base of the GHSZ associated with the HS1 oceanic warming would have affected the already deformed sediments above the base of the GHSZ (Figure 9), as well as impacted near-surface sediments through further authigenic carbonate precipitation after gas hydrate dissolution and gas release (e.g., Sultan et al., 2020) (Figure 9). Additionally, as the system is critically stressed, small increases in free gas amounts beneath the base of the GHSZ would have been enough to trigger gas release through pre-existing fractures within the GHSZ along the Vestnesa Ridge (Ramachandran et al., 2022; Plaza-Faverola et al., 2023). This process reconciles the observation of small-scale buried pockmarks at highly deformed intervals (Figure 4, Figure 5, Figure 6).
The gas beneath the base of the GHSZ may have become depleted after a period of sustained methane flux. The low fracture density observed in the period between the two highly deformed intervals could therefore be a response to gas saturation build up, which will depend on the rate of gas generated from beneath the base of the GHSZ and on the permeability of the sediments that controls the gas flow out (Jung et al., 2012; Ramachandran et al., 2022). We propose that gas may have been depleted after the Mid-Pleistocene Transition interval. Following the Mid-Pleistocene Transition, gas saturation build-up was potentially required before the fracture criterion could be reached, to re-fracture younger authigenic carbonate intervals. This could explain why we do not see more highly deformed intervals associated with younger glaciations after the Mid-Pleistocene Transition and before the Late Saalian period (∼0.7 Ma–140 ka).
Our study focuses on widespread, small-scale sediment deformation; however, we do not disregard the advective flow (i.e., vertical expulsion) through gas chimneys originating at or beneath the base of the GHSZ. The presence of the larger pockmarks at various stratigraphic intervals (Figure 4B) indicates that the vertical migration of fluids has been important in this segment of the Vestnesa Ridge in the past as suggested in previous studies (e.g., Plaza-Faverola et al., 2015). The size of the lateral chimney disturbance zones (Figure 4C) may also reflect the strength in the migration of fluids from beneath the GHSZ or a contrast in sediment properties.
6 Conclusion
We integrate multiple resolution acoustic data sets and available cross-disciplinary observations to constrain the spatial and temporal evolution of highly deformed Quaternary sedimentary strata along the Vestnesa Ridge in the eastern Fram Strait. A new high-resolution 3D seismic attribute workflow to quantify sediment deformation reveals both large- and small-scale fluid flow features mapped out at 5 horizons (seafloor to ∼1.2 Ma). In addition, we supply chronological constraints for the main 5 horizons, that align with major climatic events over the past ∼1.2 Ma.
The variance attribute clearly displays large faults that correlate well with large (∼50 m to >200 m) pockmarks and chimneys. However, the smaller pockmarks (<20 m) are more difficult to connect to potential smaller fractures if we consider only variance. We are unable to match specific small-scale fluid flow features to a unique set of fractures and can only deduce that our choice of attributes reveals fluid flow associated with fractures at a much smaller scale.
The most positive curvature-related attributes provide information where coherency does not; furthermore, the fracture density attribute which is based on most positive curvature (with a 20 m scanning radius) helps to delineate weakness zones susceptible to fluid flow. We indicate that the fracture density anomalies highlight focal points of disturbance.
The fracture density attribute is used to detect where deformation is most pronounced in the sedimentary column. Chronological markers constrain high fracture density peaks following the end of the penultimate glacial (∼130 ka deglaciation) and during the Mid-Pleistocene Transition. We propose that high fracturing that occurred during the Mid-Pleistocene Transition was initially triggered by extensive glacial build up, and accompanied by methane-derived authigenic carbonate growth, further disturbing sediments. The highly fractured sediments may have reactivated during subsequent tectonic events related to younger glacial isostatic adjustment. We also imply re-deformation of highly fractured sediments found ∼30 m above the base of the GHSZ within the Mid-Pleistocene Transition interval. While our first (oldest) process links the formation of authigenic carbonate to deformation during, or after, extensive glacial build up and seepage; the second (youngest) process, considers a pumping mechanism attributed to the shift of the base of the gas hydrate stability zone associated with bottom water temperature variations during the last deglaciation. We suggest that highly fractured sediments at the Mid-Pleistocene Transition may also be affected by climatic-oceanic events during the last deglaciation.
Our results help to advance the current understanding of the effects and interplay of glacial dynamics on sub-seabed deformation, gas hydrates and associated fluid migration systems in Quaternary sedimentary strata at an Arctic margin.
Data availability statement
The datasets presented in this study can be found in online repositories. The names of the repository/repositories and accession number(s) can be found below: https://doi.org/10.18710/NMGLRL.
Author contributions
SB and AP-F planned and acquired the HR3D seismic data set. JK and FC planned and acquired the Chirp data. FC prepared the manuscript with significant contributions from AP-F, JK, NS, SB, and HP. FC processed the data and conceived as well as implemented the working flow with seismic attributes, with contributions from HB and HR. HP contributed to the methodology required for the pockmark extractions. NS prepared the gas hydrate model. All authors contributed to the article and approved the submitted version.
Funding
The SEAMSTRESS project (Tectonic Stress Effects on Arctic Methane Seepage) is supported by grants from the Tromsø Research Foundation (project nr. A31680), the Research Council of Norway (project nr. 287865) and UiT—The Arctic University of Norway through its PhD fellowship programs. Data acquisition was also supported by CAGE - Centre for Arctic Gas Hydrate, Environment and Climate (funding scheme grant nr. 223259).
Acknowledgments
This work is part of the SEAMSTRESS project, supported by grants from the Tromsø Research Foundation (project nr. A31680) and the Research Council of Norway (project nr. 287865). The work has been also supported by the Research Council of Norway through its Center of Excellence CAGE. We are thankful to the ship and scientific crew on board R/V Helmer Hanssen and R/V Kronprins Haakon, for the seismic and Chirp data acquisition. We thank OpendTect and Schlumberger (Petrel) for software and support, and Thang Ha at the Attribute Assisted Seismic Processing and Interpretation (AASPI) research consortium for running volume attribute computations and for providing the K1 dataset. FC is particularly grateful to Jean-Baptiste Koehl for his advice and feedback. AP-F, SB, HP and JK are currently affiliated with the new Norwegian Center of Excellence iC3 (Centre for ice, Cryosphere, Carbon and Climate), project number 332635.
Conflict of interest
The authors declare that the research was conducted in the absence of any commercial or financial relationships that could be construed as a potential conflict of interest.
Publisher’s note
All claims expressed in this article are solely those of the authors and do not necessarily represent those of their affiliated organizations, or those of the publisher, the editors and the reviewers. Any product that may be evaluated in this article, or claim that may be made by its manufacturer, is not guaranteed or endorsed by the publisher.
Supplementary material
The Supplementary Material for this article can be found online at: https://www.frontiersin.org/articles/10.3389/feart.2023.1188737/full#supplementary-material
References
Acuña-Uribe, M., Pico-Forero, M. C., Goyes-Peñafiel, P., and Mateus, D. (2021). Enhanced ant tracking: Using a multispectral seismic attribute workflow to improve 3D fault detection. Lead. Edge 40, 502–512. doi:10.1190/tle40070502.1
Al-Dossary, S., and Marfurt, K. (2006). 3D volumetric multispectral estimates of reflector curvature and rotation. Geophysics 71, P41–P51. doi:10.1190/1.2242449
Alexandropoulou, N., Winsborrow, M., Andreassen, K., Plaza-Faverola, A., Dessandier, P.-A., Mattingsdal, R., et al. (2021). A continuous seismostratigraphic framework for the western svalbard-barents sea margin over the last 2.7 Ma: Implications for the late cenozoic glacial history of the svalbard-barents Sea ice sheet. Front. Earth Sci. 9, 1. doi:10.3389/feart.2021.656732
Alfaro, M. C., and Wong, R. C. (2001). Laboratory studies on fracturing of low-permeability soils. Can. Geotech. J. 38, 303–315. doi:10.1139/t00-096
Anderson, A. L., and Bryant, W. R. (1989). Acoustic properties of shallow seafloor gas. OnePetro. Paper presented at the Offshore Technology Conference, Houston, Texas, May 1–4, 1989. doi:10.4043/5955-MS
Andreassen, K., Ødegaard, C. M., and Rafaelsen, B. (2007). Imprints of former ice streams, imaged and interpreted using industry three-dimensional seismic data from the south-Western Barents Sea. Geol. Soc. Lond. Spec. Publ. 277, 151–169. doi:10.1144/GSL.SP.2007.277.01.09
Arntsen, B., Wensaas, L., Løseth, H., and Hermanrud, C. (2007). Seismic modeling of gas chimneys. GEOPHYSICS 72, SM251–SM259. doi:10.1190/1.2749570
Ashraf, U., Zhang, H., Anees, A., Nasir Mangi, H., Ali, M., Ullah, Z., et al. (2020). Application of unconventional seismic attributes and unsupervised machine learning for the identification of fault and fracture network. Appl. Sci. 10, 3864. doi:10.3390/app10113864
Bahorich, M. S., and Farmer, S. L. (1995). “3D seismic discontinuity for faults and stratigraphic features: The coherence cube,” in SEG technical program expanded abstracts 1995, SEG technical program expanded abstracts (Society of Exploration Geophysicists. The Leading Edge) 14 (10), 1021–1098. doi:10.1190/1.1437077
Bertoni, C., Gan, Y., Philomena), , Paganoni, M., Mayer, J., Cartwright, J., et al. (2019). Late paleocene pipe swarm in the great south – Canterbury basin (New Zealand). Mar. Petroleum Geol. 107, 451–466. doi:10.1016/j.marpetgeo.2019.05.039
Berndt, C., Bünz, S., and Mienert, J. (2003). Polygonal fault systems on the mid-Norwegian margin: a long-term source for fluid flow. Geological Society. London: Special Publications 216, 283–290. doi:10.1144/GSL.SP.2003.216.01.18
Blumentritt, C. H., Sullivan, E. C., and Marfurt, K. J. (2003). “Channel detection using seismic attributes on the Central Basin Platform, west Texas,” in Paper presented at the 2003 SEG Annual Meeting, Dallas, Texas (Society of Exploration Geophysicists), 466–469. doi:10.1190/1.1817953
Breivik, A. J., Verhoef, J., and Faleide, J. I. (1999). Effect of thermal contrasts on gravity modeling at passive margins: Results from the Western Barents Sea. J. Geophys. Res. Solid Earth 104, 15293–15311. doi:10.1029/1998JB900022
Bünz, S., Polyanov, S., Vadakkepuliyambatta, S., Consolaro, C., and Mienert, J. (2012). Active gas venting through hydrate-bearing sediments on the Vestnesa Ridge, offshore W-Svalbard. Mar. Geol. 332, 189–197. doi:10.1016/j.margeo.2012.09.012
Cartwright, J., and Santamarina, C. (2015). Seismic characteristics of fluid escape pipes in sedimentary basins: Implications for pipe Genesis. Mar. Petroleum Geol. 65, 126–140. doi:10.1016/j.marpetgeo.2015.03.023
Chand, S., Crémière, A., Lepland, A., Thorsnes, T., Brunstad, H., and Stoddart, D. (2017). Long-term fluid expulsion revealed by carbonate crusts and pockmarks connected to subsurface gas anomalies and palaeo-channels in the central North Sea. Geo-Mar Lett. 37, 215–227. doi:10.1007/s00367-016-0487-x
Chávez-Pérez, S., and Vargas-Meleza, L. (2008). Enhanced imaging workflow of seismic data from Chicontepec Basin, Mexico. Lead. Edge 27, 352–359. doi:10.1190/1.2896626
Chopra, S., and Marfurt, K. J. (2013). “Preconditioning seismic data with 5D interpolation for computing geometric attributes,” in Paper presented at the 2013 SEG Annual Meeting, Houston, Texas (Society of Exploration Geophysicists), 1368–1373. doi:10.1190/segam2013-0169.1
Chopra, S., and Marfurt, K. J. (2007). “Seismic attributes for fault/fracture characterization,” in Paper presented at the 2007 SEG Annual Meeting, San Antonio, Texas (Society of Exploration Geophysicists), 1520–1524. doi:10.1190/1.2792785
Consolaro, C., Rasmussen, T. L., Panieri, G., Mienert, J., Bünz, S., and Sztybor, K. (2015). Carbon isotope (δ13C) excursions suggest times of major methane release during the last 14 kyr in Fram Strait, the deep-water gateway to the Arctic. Clim. Past 11, 669–685. doi:10.5194/cp-11-669-2015
Crane, K., Doss, H., Vogt, P., Sundvor, E., Cherkashov, G., Poroshina, I., et al. (2001). The role of the Spitsbergen shear zone in determining morphology, segmentation and evolution of the Knipovich Ridge. Mar. Geophys. Res. 22, 153–205. doi:10.1023/A:1012288309435
Crane, K., Sundvor, E., Buck, R., and Martinez, F. (1991). Rifting in the northern Norwegian-Greenland Sea: Thermal tests of asymmetric spreading. J. Geophys. Res. Solid Earth 96, 14529–14550. doi:10.1029/91JB01231
Crémière, A., Lepland, A., Chand, S., Sahy, D., Condon, D. J., Noble, S. R., et al. (2016). Timescales of methane seepage on the Norwegian margin following collapse of the Scandinavian Ice Sheet. Nat. Commun. 7, 11509. doi:10.1038/ncomms11509
Daigle, H., Cook, A., Fang, Y., Bihani, A., Song, W., and Flemings, P. B. (2020). Gas-driven tensile fracturing in shallow marine sediments. J. Geophys. Res. Solid Earth 125, e2020JB020835. doi:10.1029/2020JB020835
Daszinnies, M., Plaza-Faverola, A., Sylta, Ø., Bünz, S., Mattingsdal, R., Tømmerås, A., et al. (2021). The Plio-Pleistocene seepage history off Western Svalbard inferred from 3D petroleum systems modelling. Mar. Petroleum Geol. 128, 105023. doi:10.1016/j.marpetgeo.2021.105023
Dessandier, P.-A., Borrelli, C., Kalenitchenko, D., and Panieri, G. (2019). Benthic foraminifera in arctic methane hydrate bearing sediments. Front. Mar. Sci. 6. doi:10.3389/fmars.2019.00765
Dessandier, P.-A., Knies, J., Plaza-Faverola, A., Labrousse, C., Renoult, M., and Panieri, G. (2021). Ice-sheet melt drove methane emissions in the Arctic during the last two interglacials. Geology 49, 799–803. doi:10.1130/G48580.1
Domel, P., Singhroha, S., Plaza-Faverola, A., Schlindwein, V., Ramachandran, H., and Buenz, S. (2022). Origin and periodic behavior of short duration signals recorded by seismometers at Vestnesa Ridge, an active seepage site on the west-Svalbard continental margin. Front. Earth Sci. 10. doi:10.3389/feart.2022.831526
Eiken, O., and Hinz, K. (1993). Contourites in the Fram Strait. Sediment. Geol. 82, 15–32. doi:10.1016/0037-0738(93)90110-Q
El bani Altuna, N., Ezat, M. M., Greaves, M., and Rasmussen, T. L. (2021). Millennial-scale changes in bottom water temperature and water mass exchange through the Fram Strait 79°N, 63-13 ka. Paleoceanogr. Paleoclimatology 36, e2020PA004061. doi:10.1029/2020PA004061
Elger, J., Berndt, C., Rüpke, L., Krastel, S., Gross, F., and Geissler, W. H. (2018). Submarine slope failures due to pipe structure formation. Nat. Commun. 9, 715. doi:10.1038/s41467-018-03176-1
Etiope, G. (2015). Natural gas seepage. Cham: Springer International Publishing. doi:10.1007/978-3-319-14601-0
Ezat, M. M., Rasmussen, T. L., and Groeneveld, J. (2014). Persistent intermediate water warming during cold stadials in the southeastern Nordic seas during the past 65 k.y. Y. Geol. 42, 663–666. doi:10.1130/G35579.1
Ezat, M. M., Rasmussen, T. L., Hain, M. P., Greaves, M., Rae, J. W. B., Zamelczyk, K., et al. (2021). Deep Ocean storage of heat and CO2 in the Fram Strait, arctic ocean during the last glacial period. Paleoceanogr. Paleoclimatology 36, e2021PA004216. doi:10.1029/2021PA004216
Fehmers, G. C., and Höcker, C. F. W. (2003). Fast structural interpretation with structure-oriented filtering. GEOPHYSICS 68, 1286–1293. doi:10.1190/1.1598121
Gao, D. (2013). Integrating 3D seismic curvature and curvature gradient attributes for fracture characterization: Methodologies and interpretational implications. Geophysics 78, O21–O31. doi:10.1190/geo2012-0190.1
Gay, A., and Berndt, C. (2007). Cessation/reactivation of polygonal faulting and effects on fluid flow in the Vøring Basin, Norwegian Margin. J. Geol. Soc. 164, 129–141. doi:10.1144/0016-76492005-178
Gay, A., Mourgues, R., Berndt, C., Bureau, D., Planke, S., Laurent, D., et al. (2012). Anatomy of a fluid pipe in the Norway Basin: Initiation, propagation and 3D shape. Mar. Geol. Hydrocarbon leakage through Focus. fluid flow Syst. Cont. margins 332– 334, 75–88. doi:10.1016/j.margeo.2012.08.010
Greinert, J., Bohrmann, G., and Suess, E. (2001). “Gas hydrate-associated carbonates and methane-venting at hydrate ridge: Classification, distribution, and origin of authigenic lithologies,” in Natural gas hydrates: Occurrence, distribution, and detection (American Geophysical Union (AGU), 99–113. doi:10.1029/GM124p0099
Haacke, R. R., Westbrook, G. K., and Hyndman, R. D. (2007). Gas hydrate, fluid flow and free gas: Formation of the bottom-simulating reflector. Earth Planet. Sci. Lett. 261, 407–420. doi:10.1016/j.epsl.2007.07.008
Hart, B. S. (2002). Validating seismic attribute studies: Beyond statistics. Lead. Edge 21, 1016–1021. doi:10.1190/1.1518439
Head, M. J., and Gibbard, P. L. (2005). Early-middle pleistocene transitions: An overview and recommendation for the defining boundary. SP 247, 1–18. doi:10.1144/GSL.SP.2005.247.01.01
Heggland, R. (2005). “Using gas chimneys in seal integrity analysis: A discussion basedon case histories,” in Editors P. Boult, and J. Kaldi Evaluating fault andcap rock seals: AAPG Hedberg Series. The American Association of Petroleum Geologists 2, 237–245. doi:10.1306/1060767H23170
Himmler, T., Sahy, D., Martma, T., Bohrmann, G., Plaza-Faverola, A., Bünz, S., et al. (2019). A 160,000-year-old history of tectonically controlled methane seepage in the Arctic. Sci. Adv. 5, eaaw1450. doi:10.1126/sciadv.aaw1450
Hjelstuen, B. O., and Sejrup, H. P. (2021). Latitudinal variability in the quaternary development of the eurasian ice sheets—evidence from the marine domain. Geology 49, 346–351. doi:10.1130/G48106.1
Hong, W.-L., Pape, T., Schmidt, C., Yao, H., Wallmann, K., Plaza-Faverola, A., et al. (2021). Interactions between deep formation fluid and gas hydrate dynamics inferred from pore fluid geochemistry at active pockmarks of the Vestnesa Ridge, west Svalbard margin. Mar. Petroleum Geol. 127, 104957. doi:10.1016/j.marpetgeo.2021.104957
Hovland, M. (2008). Deep-water coral reefs: Unique biodiversity hot-spots. Germany: Springer Science & Business Media.
Hovland, M., Heggland, R., De Vries, M. H., and Tjelta, T. I. (2010). Unit-pockmarks and their potential significance for predicting fluid flow. Mar. Petroleum Geol. 27, 1190–1199. doi:10.1016/j.marpetgeo.2010.02.005
Hovland, M., 2002. On the self-sealing nature of marine seeps. Cont. Shelf Res. Gas Mar. Sediments Contributions 5th Int. Conf. orgainsed by Shallow Gas Group, Bologna, Italy, 22, 2387–2394. doi:10.1016/S0278-4343(02)00063-8
Hovland, M. (1988). Seabed pockmarks and seepages: Impact on geology, biology and the marine environment. London: Graham & Trotman.
Howe, J. A., Shimmield, T. M., Harland, R., and Eyles, N. (2008). Late quaternary contourites and glaciomarine sedimentation in the Fram Strait. Sedimentology 55, 179–200. doi:10.1111/j.1365-3091.2007.00897.x
Hustoft, S., Bünz, S., Mienert, J., and Chand, S. (2009). Gas hydrate reservoir and active methane-venting province in sediments on <20 Ma young oceanic crust in the Fram Strait, offshore NW-Svalbard. Earth Planet. Sci. Lett. 284, 12–24. doi:10.1016/j.epsl.2009.03.038
Hustoft, S., Mienert, J., Bünz, S., and Nouzé, H. (2007). High-resolution 3D-seismic data indicate focussed fluid migration pathways above polygonal fault systems of the mid-Norwegian margin. Mar. Geol. 245, 89–106. doi:10.1016/j.margeo.2007.07.004
Jessen, S. P., Rasmussen, T. L., Nielsen, T., and Solheim, A. (2010). A new Late Weichselian and Holocene marine chronology for the Western Svalbard slope 30,000–0 cal years BP. Quat. Sci. Rev. 29, 1301–1312. doi:10.1016/j.quascirev.2010.02.020
Judd, A., and Hovland, M. (2007). Seabed fluid flow: The impact on geology, biology, and the marine environment. Cambridge: Cambridge University Press. doi:10.1017/CBO9780511535918
Jung, J. W., Jang, J., Santamarina, J. C., Tsouris, C., Phelps, T. J., and Rawn, C. J. (2012). Gas production from hydrate-bearing sediments: The role of fine particles. Energy fuels. 26, 480–487. doi:10.1021/ef101651b
King, L. H., and MacLEAN, B. (1970). Pockmarks on the scotian shelf. Geol. Soc. Am. Bull. 81, 3141. doi:10.1130/0016-7606(1970)81[3141
Klokov, A., Treviño, R. H., and Meckel, T. A. (2017). Diffraction imaging for seal evaluation using ultra high resolution 3D seismic data. Mar. Petroleum Geol. 82, 85–96. doi:10.1016/j.marpetgeo.2017.02.002
Knies, J., Daszinnies, M., Plaza-Faverola, A., Chand, S., Sylta, Ø., Bünz, S., et al. (2018). Modelling persistent methane seepage offshore Western Svalbard since early Pleistocene. Mar. Petroleum Geol. 91, 800–811. doi:10.1016/j.marpetgeo.2018.01.020
Knies, J., Matthiessen, J., Vogt, C., Laberg, J. S., Hjelstuen, B. O., Smelror, M., et al. (2009). The plio-pleistocene glaciation of the Barents Sea–svalbard region: A new model based on revised chronostratigraphy. Quat. Sci. Rev. 28, 812–829. doi:10.1016/j.quascirev.2008.12.002
Knies, J., and Vadakkepuliyambatta, S. (2023). CAGE19-3 Cruise Report: Calypso giant piston coring in the Atlantic-Arctic gateway – investigation of continental margin development and effect of tectonic stress on methane release. CAGE – Centre Arct. Gas Hydrate, Environ. Clim. Rep. Ser. 7, 1. doi:10.7557/cage.6911
Lebedeva-Ivanova, N., Gaina, C., Minakov, A., and Kashubin, S. (2019). ArcCRUST: Arctic crustal thickness from 3-D gravity inversion. Geochem. Geophys. Geosystems 20, 3225–3247. doi:10.1029/2018GC008098
Li, M., and Zhao, Y. (2014). “Chapter 5 - seismic attribute analysis,” in Geophysical exploration technology M. Li, and Y. Zhao (Oxford: Elsevier), 103–131. doi:10.1016/B978-0-12-410436-5.00005-8
Ligtenberg, J. H. (2005). Detection of fluid migration pathways in seismic data: Implications for fault seal analysis. Basin Res. 17, 141–153. doi:10.1111/j.1365-2117.2005.00258.x
Lisle, R. J. (1994). Detection of zones of abnormal strains in structures using Gaussian curvature analysis. AAPG Bull. 78. doi:10.1306/a25ff305-171b-11d7-8645000102c1865d
Løseth, H., Wensaas, L., Arntsen, B., Hanken, N.-M., Basire, C., Graue, K., et al. 2011. 1000 m long gas blow-out pipes. Mar. Pet. Geol. 28, 1047–1060. doi:10.1016/j.marpetgeo.2010.10.001
Løseth, H., Gading, M., and Wensaas, L. (2009). Hydrocarbon leakage interpreted on seismic data. Mar. Petroleum Geol. 26, 1304–1319. doi:10.1016/j.marpetgeo.2008.09.008
Lund, B., Schmidt, P., and Hieronymus, C. (2009). Swedish Nuclear Fuel and Waste Management Co. SKB Technical Report, 106.
Ma, G., Zhan, L., Lu, H., and Hou, G. (2021). Structures in shallow marine sediments associated with gas and fluid migration. JMSE 9, 396. doi:10.3390/jmse9040396
Marfurt, K. J., Sudhaker, V., Gersztenkorn, A., Crawford, K. D., and Nissen, S. E. (1999). Coherency calculations in the presence of structural dip. GEOPHYSICS 64, 104–111. doi:10.1190/1.1444508
Mattingsdal, R., Knies, J., Andreassen, K., Fabian, K., Husum, K., Grøsfjeld, K., et al. (2014). A new 6 Myr stratigraphic framework for the Atlantic–Arctic Gateway. Quat. Sci. Rev. 92, 170–178. doi:10.1016/j.quascirev.2013.08.022
Mazurenko, L. L., and Soloviev, V. A. (2003). Worldwide distribution of deep-water fluid venting and potential occurrences of gas hydrate accumulations. Geo-Marine Lett. 23, 162–176. doi:10.1007/s00367-003-0146-x
Mazzini, A., Svensen, H. H., Forsberg, C. F., Linge, H., Lauritzen, S.-E., Haflidason, H., et al. (2017). A climatic trigger for the giant Troll pockmark field in the northern North Sea. Earth Planet. Sci. Lett. 464, 24–34. doi:10.1016/j.epsl.2017.02.014
Moss, J. L., Cartwright, J., and Moore, R. (2012). Evidence for fluid migration following pockmark formation: Examples from the nile deep sea fan. Mar. Geol. 303, 1–13. doi:10.1016/j.margeo.2012.01.010
Moss, J. L., and Cartwright, J. (2010). The spatial and temporal distribution of pipe formation, offshore Namibia. Mar. Petroleum Geol. 27, 1216–1234. doi:10.1016/j.marpetgeo.2009.12.013
Osti, G., Waghorn, K. A., Waage, M., Plaza-Faverola, A., and Ferré, B. (2019). Evolution of contourite drifts in regions of slope failures at eastern Fram Strait. Arktos 5, 105–120. doi:10.1007/s41063-019-00070-y
Oye, V., Stanchits, S., Babarinde, O., Bauer, R., Dichiarante, A. M., Langet, N., et al. (2022). Cubic-meter scale laboratory fault re-activation experiments to improve the understanding of induced seismicity risks. Sci. Rep. 12, 8015. doi:10.1038/s41598-022-11715-6
Panieri, G., Bünz, S., Fornari, D. J., Escartin, J., Serov, P., Jansson, P., et al. (2017). An integrated view of the methane system in the pockmarks at Vestnesa Ridge, 79°N. Mar. Geol. 390, 282–300. doi:10.1016/j.margeo.2017.06.006
Panieri, G., James, R. H., Camerlenghi, A., Westbrook, G. K., Consolaro, C., Cacho, I., et al. (2014). Record of methane emissions from the West Svalbard continental margin during the last 23.500yrs revealed by δ13C of benthic foraminifera. Glob. Planet. Change 122, 151–160. doi:10.1016/j.gloplacha.2014.08.014
Panieri, G., Knies, J., Vadakkepuliyambatta, S., Lee, A. L., and Schubert, C. J. (2023). Evidence of Arctic methane emissions across the mid-Pleistocene. Commun. Earth Environ. 4, 109. doi:10.1038/s43247-023-00772-y
Pape, T., Bünz, S., Hong, W.-L., Torres, M. E., Riedel, M., Panieri, G., et al. (2020). Origin and transformation of light hydrocarbons ascending at an active pockmark on Vestnesa Ridge, arctic ocean. J. Geophys. Res. Solid Earth 125, e2018JB016679. doi:10.1029/2018JB016679
Patton, H., Andreassen, K., Bjarnadóttir, L. R., Dowdeswell, J. A., Winsborrow, M. C. M., Noormets, R., et al. (2015a). Geophysical constraints on the dynamics and retreat of the Barents Sea ice sheet as a paleobenchmark for models of marine ice sheet deglaciation. Rev. Geophys. 53, 1051–1098. doi:10.1002/2015RG000495
Patton, H., Swift, D. A., Clark, C. D., Livingstone, S. J., Cook, S. J., and Hubbard, A. (2015). Automated mapping of glacial overdeepenings beneath contemporary ice sheets: Approaches and potential applications. Geomorphology 232, 209–223. doi:10.1016/j.geomorph.2015.01.003
Peltier, W. R., and Fairbanks, R. G. (2006). Global glacial ice volume and Last Glacial Maximum duration from an extended Barbados sea level record. Quat. Sci. Rev. Crit. Quat. Stratigr. 25, 3322–3337. doi:10.1016/j.quascirev.2006.04.010
Petersen, C. J., Bünz, S., Hustoft, S., Mienert, J., and Klaeschen, D. (2010). High-resolution P-Cable 3D seismic imaging of gas chimney structures in gas hydrated sediments of an Arctic sediment drift. Mar. Petroleum Geol. 27, 1981–1994. doi:10.1016/j.marpetgeo.2010.06.006
Planke, S., Erikson, F. N., Berndt, C., Mienert, J., and Masson, D. (2009). P-cable high-resolution seismic. Oceanog 22, 85. doi:10.5670/oceanog.2009.09
Plaza-Faverola, A., Bünz, S., Johnson, J. E., Chand, S., Knies, J., Mienert, J., et al. (2015). Role of tectonic stress in seepage evolution along the gas hydrate-charged Vestnesa Ridge, Fram Strait: Arctic seepage modulated by tectonics. Geophys. Res. Lett. 42, 733–742. doi:10.1002/2014GL062474
Plaza-Faverola, A., Bünz, S., and Mienert, J. (2011). Repeated fluid expulsion through sub-seabed chimneys offshore Norway in response to glacial cycles. Earth Planet. Sci. Lett. 305, 297–308. doi:10.1016/j.epsl.2011.03.001
Plaza-Faverola, A., Bünz, S., and Mienert, J. (2012). The free gas zone beneath gas hydrate bearing sediments and its link to fluid flow: 3-D seismic imaging offshore mid-Norway. Mar. Geol. 291, 211–226. doi:10.1016/j.margeo.2011.07.002
Plaza-Faverola, A. (2020). CAGE20-6 Cruise Report: Pore-fluid pressure and heat flow surveys along the Vestnesa Ridge, west-Svalbard continental margin. CAGE – Centre Arct. Gas Hydrate, Environ. Clim. Rep. Ser. 8, 1. doi:10.7557/cage.6918
Plaza-Faverola, A., and Keiding, M. (2019). Correlation between tectonic stress regimes and methane seepage on the Western Svalbard margin. Solid earth. 10, 79–94. doi:10.5194/se-10-79-2019
Plaza-Faverola, A., Vadakkepuliyambatta, S., Hong, W.-L., Mienert, J., Bünz, S., Chand, S., et al. (2017). Bottom-simulating reflector dynamics at Arctic thermogenic gas provinces: An example from Vestnesa Ridge, offshore west Svalbard. J. Geophys. Res. Solid Earth 122, 4089–4105. doi:10.1002/2016JB013761
Plaza-Faverola, A., Sultan, N., Lucchi, R. G., El bani Altuna, N., Ramachandran, H., Singhroha, S., et al. (2023). Spatial Changes in Gas Transport and Sediment Stiffness Influenced by Regional Stress: Observations From Piezometer Data Along Vestnesa Ridge, Eastern Fram Strait. J. Geophys. Res. Solid Earth 128, e2022JB025868. doi:10.1029/2022JB025868
Portnov, A., Vadakkepuliyambatta, S., Mienert, J., and Hubbard, A. (2016). Ice-sheet-driven methane storage and release in the Arctic. Nat. Commun. 7, 10314. doi:10.1038/ncomms10314
Powers, M. C. (1967). Fluid-Release Mechanisms in Compacting Marine Mudrocks and Their Importance in Oil Exploration. AAPG Bulletin 51, 1240–1254. doi:10.1306/5D25C137-16C1-11D7-8645000102C1865D
Quinn, R., Bull, J., and Dix, J. (1998). Optimal processing of marine high-resolution seismic reflection (chirp) data. Mar. Geophys. Res. 20, 13–20. doi:10.1023/A:1004349805280
Ramachandran, H., Plaza-Faverola, A., and Daigle, H. (2022). Impact of gas saturation and gas column height at the base of the gas hydrate stability zone on fracturing and seepage at Vestnesa Ridge, west-svalbard margin. Energies 15, 3156. doi:10.3390/en15093156
Riboulot, V., Thomas, Y., Berné, S., Jouet, G., and Cattaneo, A. (2014). Control of Quaternary sea-level changes on gas seeps: Kiboulot et al.: Control of eustatism on gas seeps. Geophys. Res. Lett. 41, 4970–4977. doi:10.1002/2014GL060460
Rise, L., Bellec, V. K., Chand, S., and Bøe, R. (2015). Pockmarks in the southwestern Barents Sea and finnmark fjords. NJG. doi:10.17850/njg94-4-02
Ritzmann, O., Jokat, W., Czuba, W., Guterch, A., Mjelde, R., and Nishimura, Y. (2004). A deep seismic transect from hovgård Ridge to northwestern svalbard across the continental-ocean transition: A sheared margin study. Geophys. J. Int. 157, 683–702. doi:10.1111/j.1365-246X.2004.02204.x
Roberts, A. (2001). Curvature attributes and their application to 3D interpreted horizons. First Break 19, 85–100. doi:10.1046/j.0263-5046.2001.00142.x
Ruppel, C. D., and Kessler, J. D. (2017). The interaction of climate change and methane hydrates. Rev. Geophys. 55, 126–168. doi:10.1002/2016RG000534
Sano, O., Ito, H., Hirata, A., and Mizuta, Y. (2005). Review of methods of measuring stress and its variations. Bull. Earthq. Res. Inst. Univ. Tokyo 80, 87–103.
Sauer, S., Hong, W.-L., Yao, H., Lepland, A., Klug, M., Eichinger, F., et al. (2021). Methane transport and sources in an Arctic deep-water cold seep offshore NW Svalbard (Vestnesa Ridge, 79°N). Deep Sea Res. Part I Oceanogr. Res. Pap. 167, 103430. doi:10.1016/j.dsr.2020.103430
Schneider, A., Panieri, G., Lepland, A., Consolaro, C., Crémière, A., Forwick, M., et al. (2018). Methane seepage at Vestnesa Ridge (NW svalbard) since the last glacial maximum. Quat. Sci. Rev. 193, 98–117. doi:10.1016/j.quascirev.2018.06.006
Schock, S. G. (2004). A method for estimating the physical and acoustic properties of the sea bed using chirp sonar data. IEEE J. Ocean. Eng. 29, 1200–1217. doi:10.1109/JOE.2004.841421
Serov, P., Vadakkepuliyambatta, S., Mienert, J., Patton, H., Portnov, A., Silyakova, A., et al. (2017). Postglacial response of Arctic Ocean gas hydrates to climatic amelioration. Proc. Natl. Acad. Sci. 114, 6215–6220. doi:10.1073/pnas.1619288114
Sessford, E. G., Tisserand, A. A., Risebrobakken, B., Andersson, C., Dokken, T., and Jansen, E. (2018). High-resolution benthic Mg/Ca temperature record of the intermediate water in the Denmark strait across D-O stadial-interstadial cycles. Paleoceanogr. paleoclimatology 33 (11), 1169–1185. doi:10.1029/2018pa003370
Smith, A. J., Mienert, J., Bünz, S., and Greinert, J. (2014). Thermogenic methane injection via bubble transport into the upper Arctic Ocean from the hydrate-charged Vestnesa Ridge, Svalbard. Geochem. Geophys. Geosystems 15, 1945–1959. doi:10.1002/2013GC005179
Sultan, N., Bohrmann, G., Ruffine, L., Pape, T., Riboulot, V., Colliat, J.-L., et al. (2014). Pockmark formation and evolution in deep water Nigeria: Rapid hydrate growth versus slow hydrate dissolution. J. Geophys. Res. Solid Earth 119, 2679–2694. doi:10.1002/2013JB010546
Sultan, N., Plaza-Faverola, A., Vadakkepuliyambatta, S., Buenz, S., and Knies, J. (2020). Impact of tides and sea-level on deep-sea Arctic methane emissions. Nat. Commun. 11, 5087. doi:10.1038/s41467-020-18899-3
Sztybor, K., and Rasmussen, T. L. (2017). Diagenetic disturbances of marine sedimentary records from methane-influenced environments in the Fram Strait as indications of variation in seep intensity during the last 35 000 years. Boreas 46, 212–228. doi:10.1111/bor.12202
Trivedi, A., Sarkar, S., Marin-Moreno, H., Minshull, T. A., Whitehouse, P. L., and Singh, U. (2022). Reassessment of hydrate destabilization mechanisms offshore west svalbard confirms link to recent ocean warming. J. Geophys. Res. Solid Earth 127, e2022JB025231. doi:10.1029/2022JB025231
Vachon, R., Schmidt, P., Lund, B., Plaza-Faverola, A., Patton, H., and Hubbard, A. (2022). Glacially induced stress across the arctic from the eemian interglacial to the present—implications for faulting and methane seepage. J. Geophys. Res. Solid Earth 127, e2022JB024272. doi:10.1029/2022JB024272
Vanneste, M., Guidard, S., and Mienert, J. (2005). Bottom-simulating reflections and geothermal gradients across the Western Svalbard margin. Terra nova. 17, 510–516. doi:10.1111/j.1365-3121.2005.00643.x
Vogt, P. R., Crane, K., Sundvor, E., Max, M. D., and Pfirman, S. L. (1994). Methane-generated(?) pockmarks on young, thickly sedimented oceanic crust in the Arctic: Vestnesa ridge, Fram strait. Geology 22, 255–258. doi:10.1130/0091-7613(1994)022<0255:MGPOYT>2.3
Wallmann, K., Riedel, M., Hong, W. L., Patton, H., Hubbard, A., Pape, T., et al. (2018). Gas hydrate dissociation off Svalbard induced by isostatic rebound rather than global warming. Nat. Commun. 9, 83. doi:10.1038/s41467-017-02550-9
Wiprut, D., and Zoback, M. (2000). Constraining the stress tensor in the Visund field, Norwegian North Sea: Application to wellbore stability and sand production. Int. J. Rock Mech. Min. Sci. 37, 317–336. doi:10.1016/s1365-1609(99)00109-4
Yao, H., Hong, W.-L., Panieri, G., Sauer, S., Torres, M. E., Lehmann, M. F., et al. (2019). Fracture-controlled fluid transport supports microbial methane-oxidizing communities at Vestnesa Ridge. Biogeosciences 16, 2221–2232. doi:10.5194/bg-16-2221-2019
Keywords: sediment fracturing, episodic seepage, high-resolution seismic attributes, glacial dynamics, Fram Strait
Citation: Cooke F, Plaza-Faverola A, Bünz S, Sultan N, Ramachandran H, Bedle H, Patton H, Singhroha S and Knies J (2023) Sedimentary deformation relating to episodic seepage in the last 1.2 million years: a multi-scale seismic study from the Vestnesa Ridge, eastern Fram Strait. Front. Earth Sci. 11:1188737. doi: 10.3389/feart.2023.1188737
Received: 17 March 2023; Accepted: 16 May 2023;
Published: 30 May 2023.
Edited by:
Jacek Raddatz, Goethe University Frankfurt, GermanyReviewed by:
André Bahr, Heidelberg University, GermanyWang Yun, China University of Geosciences, China
Copyright © 2023 Cooke, Plaza-Faverola, Bünz, Sultan, Ramachandran, Bedle, Patton, Singhroha and Knies. This is an open-access article distributed under the terms of the Creative Commons Attribution License (CC BY). The use, distribution or reproduction in other forums is permitted, provided the original author(s) and the copyright owner(s) are credited and that the original publication in this journal is cited, in accordance with accepted academic practice. No use, distribution or reproduction is permitted which does not comply with these terms.
*Correspondence: Frances Cooke, ZnJhbmNlcy5hLmNvb2tlQHVpdC5ubw==