 Kang Sen
 Zhao Zihao*
- School of Mining and Coal, Inner Mongolia University of Science and Technology, Baotou, China
High and steep slopes in open pit mines used for ore production require careful monitoring to ensure stability and safeguard lives, property, and social welfare. Understanding the evolutionary characteristics of hazard sources within these slopes is crucial for effective slope management. This article presents a novel approach to identify the evolution of hazard sources within slopes by utilizing the derivative of normalized inversion data versus time as a characteristic feature. To analyze the evolution of hazard sources, raw apparent resistivity data collected at different times are processed using smoothing and wavelet denoising algorithms to reduce noise. Geological constraints are then applied to the collected data through the parametric region method. The least squares method is employed for independent inversion, and the inversion results are standardized. Subsequently, the standardized inversion results are used to derive the derivative of resistivity versus time equation, which reveals the evolution of hazard sources within the slope. A case study is conducted on a large open pit rocky slope to analyze the effectiveness of the proposed approach. The results demonstrate the successful reduction of noise through the smoothing and wavelet threshold denoising algorithms, effectively suppressing interference caused by acquisition equipment and environmental electromagnetic noise. The application of the parametric region method with geological constraints highlights the spatial and temporal evolution characteristics of hazard sources within the slope. The findings indicate varying degrees of evolution of hazard sources within the slope, with significant changes observed mainly in the shallow part influenced by water erosion and blasting vibration. Areas with lithological stability show minimal changes, while original hazard source areas have evolved to different extents, distinguishable based on the size and sparsity of contour values. By combining inversion data analysis, noise reduction techniques, and geological constraints, the proposed approach provides valuable insights into the evolution of hazard sources within slopes. This information can aid in the development of effective slope management strategies in open pit mines, contributing to enhanced safety and protection of valuable assets.
1 Introduction
China’s annual demand for ore is substantial, with a significant portion being sourced from open-pit mines. Open-pit mining represents a widespread method for mineral and resource extraction from the Earth’s surface, and its implementation demands meticulous management of unique hazards and risks. These operations entail the excavation of extensive amounts of earth and rock, engendering steep slopes and towering walls. The slopes associated with open-pit mining pose significant dangers of instability, resulting in slope failures, landslides, and rockfalls. Through the identification and assessment of hazard sources, such as unstable geological formations, weak rock layers, and excessive slope angles, mining engineers can adopt appropriate slope stabilization measures, design secure access roads, and establish monitoring systems to detect incipient signs of instability. Such measures ensure the safety of workers and forestall accidents and injuries relating to slope failures. However, the occurrence of landslide accidents in these mines poses a major challenge to the expansion of their production. Addressing slope safety concerns is crucial for mitigating this issue. Given that safety primarily relies on preventive measures, effective control of the dynamic changes in the slope’s medium becomes paramount.
The conventional high-density resistivity method is a geophysical technique used to investigate the subsurface properties of the Earth. It involves measuring the electrical resistivity of the ground at multiple locations to create a resistivity image or model. In this method, a series of electrodes are placed at regular intervals along a survey line or grid. Typically, the electrodes are inserted into the ground, and an electrical current is injected into the Earth through one pair of electrodes. The resulting potential difference is measured using another pair of electrodes. By varying the electrode configurations and measuring the potential differences at different locations, a resistivity profile of the subsurface can be obtained. The resistivity of the subsurface materials plays a crucial role in this method. Different geological formations and structures, such as bedrock, clay, water-bearing zones, or mineral deposits, have varying resistivity values. By analyzing the resistivity data, geophysicists can infer the subsurface lithology, identify potential groundwater resources, locate mineral deposits, and map geological structures (Dupis, 1980; Loke and Barker, 1996; Loke et al., 2013).
In the field of engineering practice and research, ensuring mine safety and accurately predicting the timing of slope damage occurrence often involves the establishment of a numerical model for the slope’s geotechnical body. This approach allows for the simulation of the progressive collapse process of the slope, aiding in the enhancement of safety measures (Du and Song, 2022; Bao et al., 2023; Du et al., 2023; Ren et al., 2023; Song and Du, 2023). Simultaneously, to preserve slope stability, the placement of anchors within the slope body is frequently implemented, thereby reinforcing slope stability through the enhancement of anchor performance (Wang Q. et al., 2022; Li et al., 2023).
The high-density electrical method collects more data and has a good application effect in detecting slope damage sources. The high-density electrical method offers a comprehensive approach for assessing and analyzing slope safety by detecting faults, fracture zones, and water-conducting fissure zones within a slope. This geophysical technique enables a thorough evaluation of potential hazards and provides valuable insights into slope stability. (Dong and Wang, 2003; Hojat et al., 2019; Lin et al., 2019). The high-density electrical method can also be employed to measure the water content within the slope. This capability allows for a comprehensive assessment of the slope’s hydrological conditions, providing important information for evaluating slope stability and potential water-related risks (Lu et al., 2023).
However, the conventional resistivity method can only identify the underground fault sources and cannot reflect the dynamic changes of the fault sources. However, the time-lapse high-density resistivity method can not only show the electrical properties of underground media but also obtain the changes in underground electrical structures by analyzing multiple detection data of the same section at different times (Doetsch et al., 2010; Boyd et al., 2021). The time-lapse high-density resistivity method excels in providing high-resolution imaging of subsurface variations over time. It facilitates in-depth insights into spatial and temporal changes in resistivity, enabling a comprehensive understanding of dynamic subsurface processes. This level of resolution is particularly advantageous for detecting and evaluating disaster sources in the high slopes of open-pit mines, where even small-scale changes can significantly impact slope stability. In comparison with invasive techniques such as drilling or excavation, the time-lapse high-density resistivity method is non-invasive. It eliminates the need for physical disturbance of the site, making it a cost-effective and environmentally friendly option. This advantage holds particular importance when assessing large areas or conducting long-term monitoring campaigns. The time-lapse high-density resistivity method surpasses other geophysical techniques with its high resolution, real-time monitoring capabilities, sensitivity to fluid migration, non-invasive nature, cost-effectiveness, and potential for integration with complementary methods. These advantages make it an invaluable tool for disaster detection and evaluation, particularly in high slopes of open-pit mines, where proactive risk management and effective mitigation strategies are crucial.
At present, it has achieved good application results in dynamic detection of oil and gas reservoirs, groundwater pollution, leak detection of dams, and leak detection of hazardous substances in landfills (Johnson et al., 2021; Norooz et al., 2021; Zhang et al., 2022). In the process of open pit mining, the rock and soil mass of the slope is always in a state of deformation, and its internal electrical structure also changes in real time. It is of great significance for slope safety to master the evolution law of disaster sources in the slope. Therefore, the study of hazard source evolution has also become a current research hotspot (Loke et al., 2013; Lapenna and Perrone, 2022). The study area is located on the northwest border of Baotou City. After 60 years of mining, a large mine has formed a high and steep slope of more than 200 m. In recent years, several cave-ins have occurred. The rock mass of the open pit slope is mainly dolomite and schist and contains a small amount of macular dyke and mica schist. However, the main rock of the slope, dolomite, is different in different regions due to various complex geological processes such as alteration, weathering, and erosion. At the same time, there are 108 geologically identifiable slope faults, mainly in an east-west direction, due to geological formations. The stable dolomite body contains a variety of lithologies such as iron-rich oxidized dolomite, mica, and sodalite (Zhongxin et al., 1992; Fan et al., 2016; Wang et al., 2019). In this study, the rock slope of a large open pit mine was taken as the research object. In 2016, the high-density electrical method was used to explore the slope, and the geophysical data body of the slope was established according to factors such as weak structure fracture zone, lithology, and groundwater extracted from the geophysical data. The slope stability and rock mass characteristics at different depths were analyzed in detail, and the distribution of fault sources was finally determined. In 2020, the mine slope landslide occurred.
The landslide-affected region falls within the designated key geological disaster prevention and control area, as established in 2016. Building upon this designation, the mine successfully predicted slope collapses by integrating slope deformation warning radar data. Analysis of the exposed geological formations following the landslides validated the efficacy of the high-density electrical method in detecting disaster sources within the mine slope. To gain insight into the status of disaster sources in non-landslide areas, understand their evolutionary patterns within the mine slope, and enhance slope disaster prevention and control measures, repeated high-density electrical explorations were conducted in the non-landslide section of the mine slope in 2022. The derivative order and isoline distribution of high-density electrical data over time were employed to visualize the dynamic evolution of the disaster sources within the slope.
2 Overview of the open pit mine slope
2.1 Geology
The mine is situated in a town within Baotou City, located in the Inner Mongolia Autonomous Region. The region is characterized by expansive grasslands and plateau hills and falls within the inland dry climate zone. It experiences the influence of cold air masses originating from Siberia, Lake Baikal, and Wendur Khan, resulting in low temperatures, minimal precipitation, dry and windy conditions, and significant temperature fluctuations. During the summer, there is a concentration of short-term rainfall, and in recent years, there has been an increase in summer rainfall compared to historical records, likely due to warming trends (Wang X. et al., 2022).
The Bayan Obo REE-Nb-Fe deposit is located in the Bayan Obo continental margin rift in the north of the NCC. The ore-hosting dolomites, covered by K-rich slate (H9 term) and extending 18 km from east to west with approximately 2 km width (Figure 1), were once considered as a component of Bayan Obo Group, called H8 term. The origin of the dolomites is still disputed, and it has been proposed to be either sedimentary (Yang et al., 2009; Lai et al., 2012), or carbonatite rel (Yang et al., 2011; Zhu et al., 2015). Basement rocks at Bayan Obo are composed of Neoarchean mylonitic granite-gneiss (2,588 ± 15 Ma), Paleoproterozoic syenite and granodiorite (2018 ± 15 Ma), and biotite granite-gneiss and garnet-bearing granite-gneiss (−1890 Ma). Dioritic-granitic plutons, composed of gabbro, gabbroic diorite, granitic diorite, adamellite, and biotite granite, are distributed within a large area in the south and east Bayan Obo mine (Figure 1). These plutons were once regarded as intruding from Devonian to Jurassic. New geochronology data reveal that these plutons were formed in a post-collisional tectonic regime at convergent margins in the late Paleozoic at a narrow time from 263 to 281 Ma with a peak age of 269 Ma.
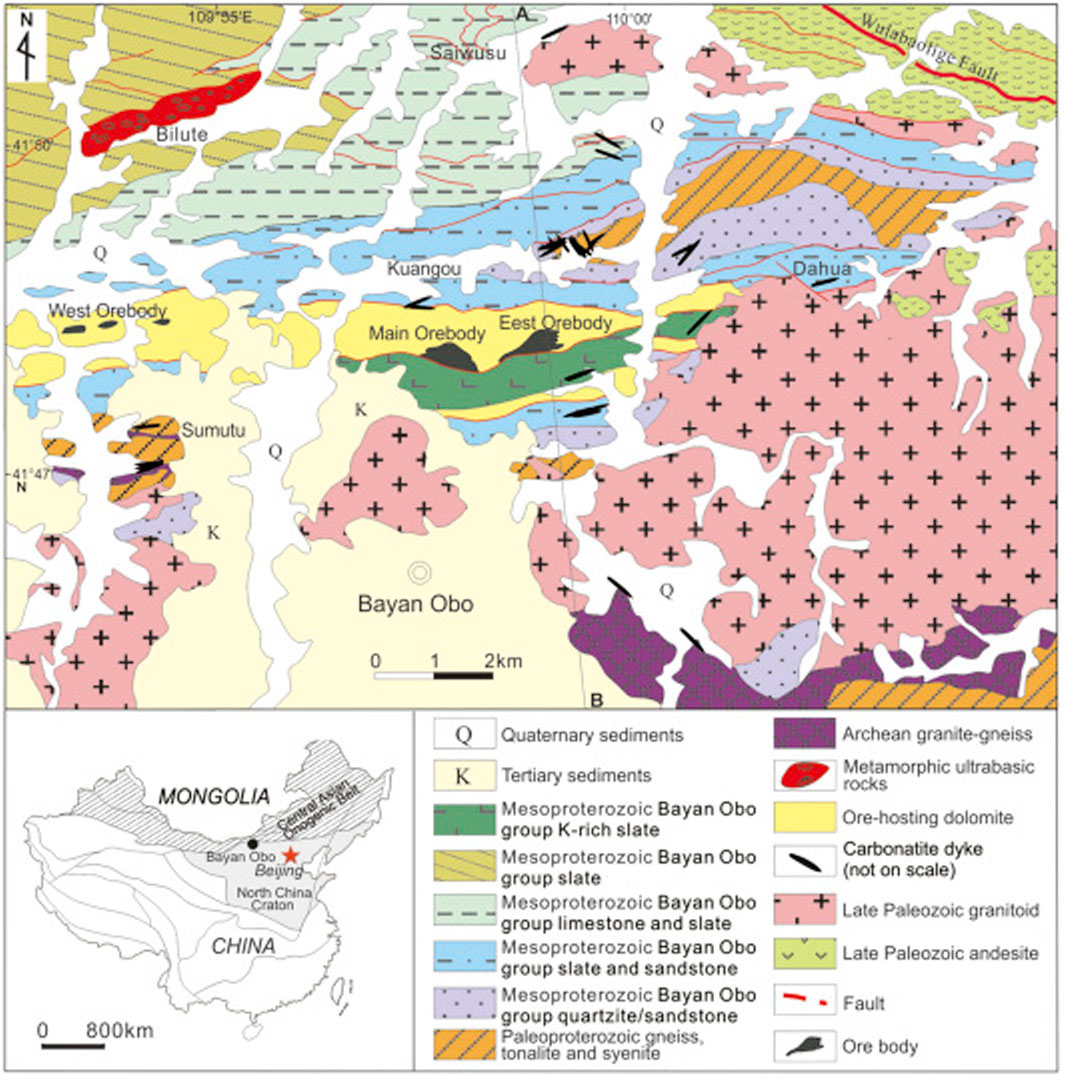
FIGURE 1. Geological sketch map of the Bayan Obo area, northern China. Cited after (Fan et al., 2016).
2.2 Geological hazards
Based on the site investigation and regional information, it has been determined that the southwest side of the quarry primarily consists of the Quaternary rock group, comprising layers of powder clay and gravel, among others. The main rock groups present in the slope include the slate rock group, dolomite rock group, mica schist rock group, and pyroxene veins. Notably, there is no distinct boundary between the slate rock group and the dolomite rock group, resulting in a complex geological structure. The area is characterized by extensive fault development, with numerous fault fragmentation zones. These fragmentation zones exhibit high water content, and evidence of groundwater erosion can be observed, particularly in the weathering zone of the upper part of the slope and in association with fault influences. Among the identified geological features, certain disaster sources such as cis-layer fracture zones, pyroclastic veins, and mica rocks are known to induce slope collapse occurrences. These factors play a significant role in the stability and potential hazards of the slope.
The slope collapse posed a direct threat to the safety of production personnel and had significant implications for the haul road and ecological restoration of the slope. Furthermore, it resulted in the generation of substantial amounts of rock dust and contributed to an increase in sandstorms within the surrounding residential areas. As a consequence of the slope collapse, approximately 800 m of the haul road were destroyed, exacerbating the instability of the slope.
The slope collapse has presented a significant challenge in terms of slope management. Currently, the No. 1 sweeping platform area has suffered complete destruction, and ongoing rockfall poses a persistent hazard. The No. 2 production and transportation area has experienced significant accumulation due to the collapse, with the impact continuing to expand. Additionally, there is a potential for further collapse in the No. 3 area (Figure 2). Previous minor collapses in area 4 have been reinforced, while the soft rock formations in area 5 of the sweeping platform have accumulated due to weathering and blasting vibrations (Figure 3).
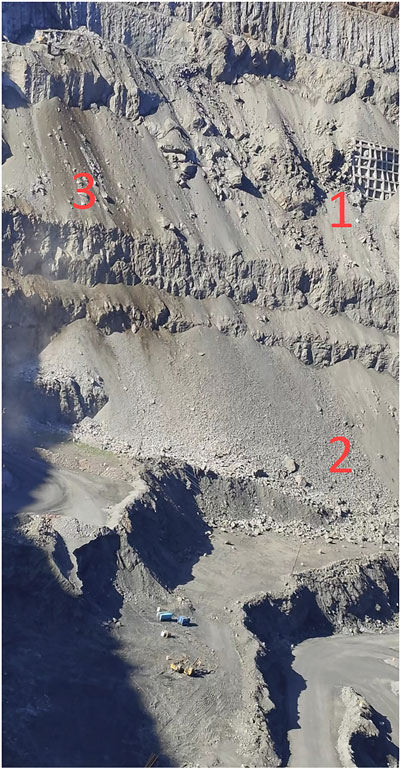
FIGURE 2. Extent of lateral slope collapse and the affected area.
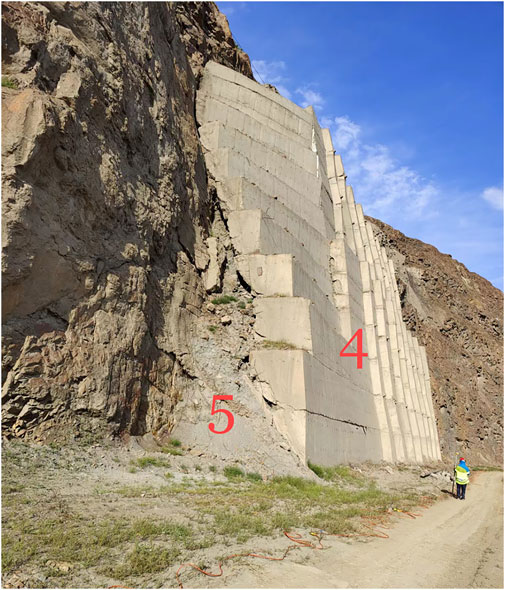
FIGURE 3. Reinforcement area for side slope.
3 Exploration method of the disaster sources in the high slopes of open-pit mines
3.1 Principle of the time-lapse high-density resistivity method forward calculation
In the actual measurement of the high-density electrical method, all electrodes are simultaneously placed on the measurement points, maintaining a specific interval between them. The reflected apparent resistivity profile is then processed and analyzed to extract information regarding the distribution of stratigraphy. This information can be utilized to delineate different geological layers, identify anomalous areas, and determine the locations of potential hazards. (Figure 4).
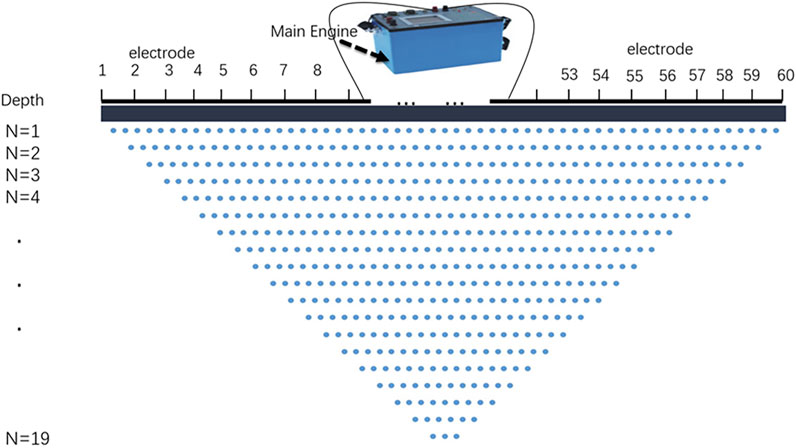
FIGURE 4. Schematic diagram of high-density electrical detection.
Open pit mining disrupts the original mechanical balance of slope rock layers. The rock and soil bodies in the slope are influenced by various factors such as gravity, freeze-thaw weathering, continuous rainfall, groundwater movement, and periodic blasting. As a result, they undergo continuous dynamic changes in order to regain mechanical equilibrium, albeit on a macroscopic scale these changes may be minute. Traditional high-density electrical methods only provide information on the distribution of hazard sources at the time of exploration through the detection of subsurface electric fields. They fail to capture the evolving nature of hazard sources within the slope. Various factors contribute to the evolution of potential hazard sources, including faults, fractures, and weak inclusions within the original rock. When an originally stable rock layer fractures to form a fracture zone, the apparent resistivity increases when the water content of the rock layer is low and decreases when the fracture zone is water-filled. The apparent resistivity also increases as faults develop and expand, particularly in areas of higher resistivity, and decreases when faults are filled. Weak inclusions undergo increased fracturing due to weathering, resulting in a decrease in apparent resistivity when water content is high, and an increase when porosity increases under external forces.
In summary, as hazard sources evolve, the resistivity of the corresponding area undergoes changes. These electrical variations serve as the basis for time-shifted high-density electrical exploration. The time-shifted high-density electrical method introduces a time dimension to the conventional approach. By conducting multiple high-density electrical surveys over time on the same section, it becomes possible to obtain resistivity distribution data for different time periods. These resistivity distribution characteristics can then be utilized to study the evolution of underground fault sources over time, influenced by external forces. (Lesparre et al., 2017; Liu et al., 2017).
In a homogeneous isotropic medium, the current field obeys the following laws (Purcell and Morin, 2013):
Where j is the current density, σ is the conductance, and E is the electric field strength. U represents the electric potential (also known as voltage) at a point in an electric field relative to infinity. According to the nature of the stable current field as a potential field, the relationship between the electric field strength and the potential is satisfied as follows (Purcell and Morin, 2013):
Assuming that a point source of current magnitude I is placed at point A (
where σ is σ
The time-shifted resistivity method is employed to study the spatial and temporal evolution of slope hazard sources by conducting multiple surveys along the same profile while keeping the coordinates of the excitation source and receiving electrode unchanged. The resistivity values obtained represent the relative resistivity of the surveyed area. Under the theoretical assumption that only the changes in slope hazard sources under external forces are considered, the evolution of these hazard sources leads to variations in the relative resistivity of the surveyed area. By monitoring the resistivity of the area and analyzing the changes in resistivity over time, we can discern the evolutionary patterns of hazard sources in response to external forces.
To simplify the analysis, we assume that the electrical properties of the subsurface medium do not change along the direction perpendicular to the measurement profile (i.e., no changes in the y-axis direction). Consequently, the four-dimensional problem is reduced to a three-dimensional problem, specifically the changes in resistivity of the two-dimensional profile in the time dimension. By employing the cosine Fourier transform, we eliminate the y-axis and obtain a time-shifted partial differential equation in the wave number domain, which describes the stable current field.
where
The resistivity measured during high-density electrical logging represents the resistivity of a specific region within the subsurface medium. When considering the measurement area as a whole, the change in resistivity over time can be represented by a resistivity curve. The first-order derivative of this curve indicates the rate of resistivity change within the subsurface medium, while the second-order derivative reflects the sharpness of resistivity changes in the area. The resistivity derivative for a point on the curve can be approximated theoretically using a Taylor series expansion, which allows us to analyze and understand the variations in resistivity.
After deformation, it can be written in the following form:
where
In the process of development of the fault zone, the larger the absolute value of
Eq. 4 represents a partial differential equation that describes the electrical properties of the subsurface medium. It considers changes in resistivity along the x and z directions and introduces the wavenumber variable λ. By incorporating the cosine Fourier transform, the equation simplifies the problem from four dimensions to three dimensions by eliminating the y-axis. This equation is essential for modeling the stable current field and understanding the temporal changes in resistivity within the subsurface medium. Eq. 5 characterizes the temporal variations in resistivity within the subsurface medium. It utilizes a Taylor series expansion to approximate the resistivity derivative at a specific point on the resistivity curve. The equation highlights the relationship between the first-order derivative (rate of resistivity change) and the second-order derivative (sharpness of resistivity changes). This equation provides a theoretical basis for analyzing and interpreting resistivity variations, which are crucial for understanding subsurface geological features and phenomena. Eq. 6 further refines the description of the resistivity derivative by providing a more explicit formulation. It demonstrates that the rate of resistivity change at a given time point can be approximated by the difference in resistivity between consecutive time points divided by the time interval (h), subtracting the second-order derivative term, and incorporating an error residual term. This equation enables a quantitative assessment of resistivity changes and offers insights into the deformation and stability of fault zones within the subsurface.
In summary, Eqs 4–6 play a significant role in this study by mathematically representing the electrical properties, resistivity changes, and behavior of fault zones within the subsurface medium. They contribute to the methodology by establishing the necessary theoretical framework and mathematical models for analyzing and interpreting data obtained through high-density electrical logging. These equations facilitate a deeper understanding of resistivity variations and their implications for subsurface geological structures and processes.
3.2 Principle of the time-lapse high-density resistivity method inversion
The least squares method is widely employed in high-density electrical inversion and serves as the basis for the inversion algorithm utilized in this study (Loke et al., 2014). In our approach, apparent resistivity data from the same profile obtained through high-density electrical sounding at different times are utilized. Anomalies are detected using a consistent threshold, and the same interpolation method is employed. Additionally, a common wavelet threshold is chosen for denoising the apparent resistivity data, thereby minimizing errors arising from the measurement system and environmental currents. Subsequently, the multi-period detection data are independently inferred, and the resulting inversion results are further processed to quantify the resistivity changes over time. This approach enables us to investigate the variations in resistivity within the time dimension (Camporese et al., 2015).
Where:
4 Data processing
During the measurement process of the high-density electrical method, various sources of noise such as electrode grounding, undulating terrain, earth electric field, stray current from underground cables, and system noise from the measurement system can introduce artifacts and reduce the authenticity and clarity of the inverse image. In this study, we have employed the mean threshold filtering method to eliminate outliers and applied conformal interpolation to segment the outliers. Additionally, wavelet decomposition has been utilized to mitigate the influence of instrument system noise and environmental noise. The same threshold filtering and interpolation methods have been consistently applied to ensure the validity of the data obtained from different periods of the apparent resistivity data for the same profile (Fritsch and Carlson, 1980; Ferahtia et al., 2012). A comparison of the denoised third layer data from an exploration profile at the mine is as follows (Figure 5).
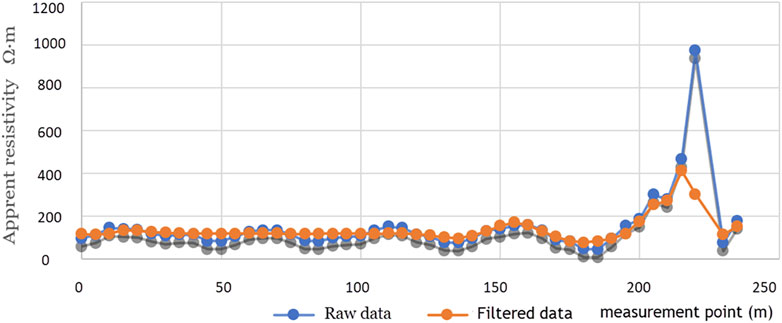
FIGURE 5. Comparison of before and after denoising of the third layer of apparent resistivity data.
To highlight the spatial and temporal progression of the disaster source and mitigate the influence of potential coupling factors, we incorporate the fundamental concept of the reference region approach from the section linkage. This approach involves employing group-ordered clustering, relative coordinate transformation, and weighted averaging techniques to geologically constrain the profiles at the same location. In this approach, we identify a geologically stable region within the same location profile and assume it remains in a constant state throughout the monitoring period. This stable region serves as a reference point against which we can assess the impact of other factors on the disaster source region over time. By comparing the variations in the disaster source region with the reference region, we can better understand the spatial and temporal dynamics of the hazard. This approach helps to isolate the effects of other factors and provides a clearer picture of the evolution of the disaster source.
Data normalization plays a crucial role in highlighting the inherent trends of the data, reducing random noise and systematic errors, and providing a foundation for subsequent data denoising and analysis. There are primarily two common methods for data normalization: standardization and normalization.
Standardization involves transforming the data in such a way that it has a mean of zero and a standard deviation of one. This method ensures that the data distribution is centered around zero and has a consistent scale. Standardization is useful when the absolute values of the data are not as important as their relative differences or when the data have varying scales or units. Normalization, on the other hand, involves scaling the data to a specific range, typically between 0 and 1. This method maintains the relative proportions of the data and allows for easier interpretation and comparison across different variables. Normalization is particularly useful when the absolute values and the relationships between them are important. Both standardization and normalization methods have their advantages and can be applied depending on the specific requirements and characteristics of the data. The choice of method should be made based on the nature of the data and the goals of the analysis. Assuming that a total of 100 periods of high-density electrical exploration have been conducted and 100 sets of apparent resistivity data have been obtained,
Where
In this article, we use the normalization method, which can reduce the influence of large and small values during the measurement process. Assuming that the apparent resistivity data consists of two sets of data, the equation for the amount of resistivity change in the time dimension is as follows (Figure 6).
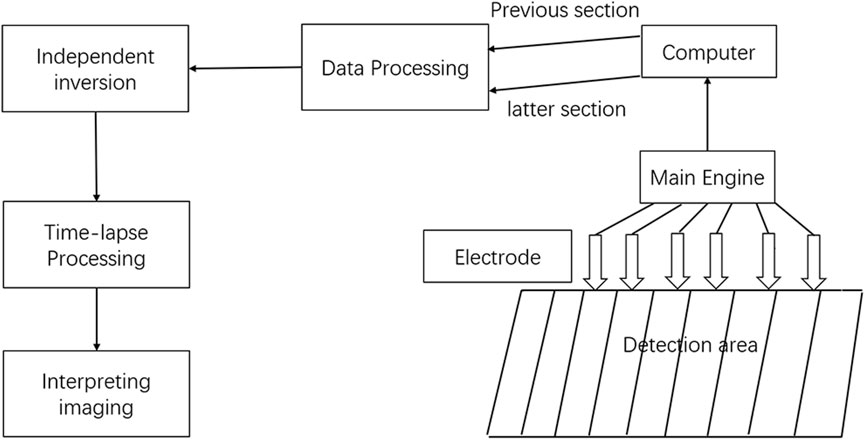
FIGURE 6. Working block diagram of the time-lapse high-density resistivity method.
Where W is the derivative of resistivity versus time (taking the absolute value to highlight the change in data);
5 Fieldwork methods
The resistivity statistics provided in Table 1 illustrate the typical resistivity ranges of various rock types within the study area. Mica rocks exhibit the highest resistivity, usually exceeding 10,000 Ω m. Micaceous dolomites possess relatively high resistivity values, typically greater than 5,000 Ω m. Altered dolomites with high iron content exhibit lower resistivity, generally below 3,000 Ω m. Weak rock layers, such as sodium amphibolite dikes, display lower resistivity values, typically below 50 Ω m, due to their high water-bearing capacity. Fracture zones, characterized by the presence of natural surface water infiltration channels, exhibit low resistivity. These resistivity parameters serve as valuable indicators for determining the distribution of hazard sources within the slope. By analyzing the resistivity values of different rock types, it becomes possible to infer the presence and characteristics of hazard sources, thereby contributing to the understanding and assessment of slope stability.
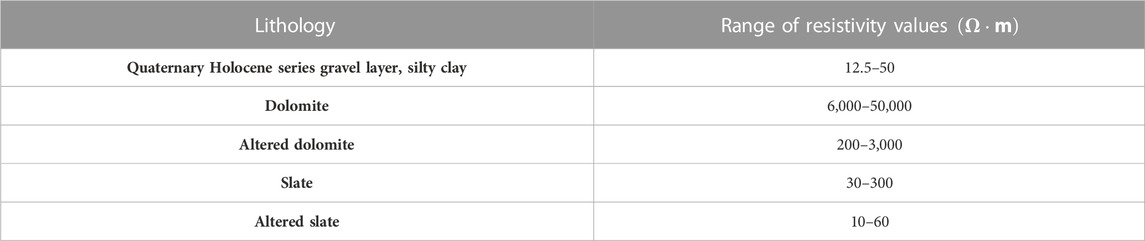
TABLE 1. Resistivity characteristics of different strata in the study area.
In 2016, we conducted an exploration of the slope using the high-density electrical method. Based on the physical exploration data, which included factors such as fault fracture zones, lithology, and groundwater, we established a comprehensive dataset of the slope. Detailed analysis of the slope stability and rock characteristics at different depths was performed, leading to the determination of the distribution of disaster sources within the slope. In 2020, a landslide occurred on the slope of the mine, and the affected area fell within the designated key geological disaster prevention and control area established in 2016. Utilizing the data obtained from the slope deformation early warning radar, we were able to successfully predict the occurrence of the landslide. Furthermore, the analysis of the exposed geological features after the landslide confirmed the effectiveness of the high-density electrical method in detecting the disaster sources within the slope.
To further investigate the situation of intra-slope hazard sources in areas where no landslide had occurred and to understand the evolutionary patterns of these hazard sources within the mine, a repeated high-density electrical exploration was conducted in 2022. The primary objective of this exploration was to demonstrate the dynamic evolution of intra-slope hazard sources by utilizing the derivative magnitudes and contour distribution of the high-density electrical method data with respect to time. By analyzing the changes in the high-density electrical data over time and observing the derivative magnitudes and contour distributions, we aim to gain insights into the temporal evolution of hazard sources within the slope. By employing the high-density electrical method and analyzing the resulting data, we aimed to provide valuable information for the prevention and control of slope hazards in the mine (Figures 7, 8).
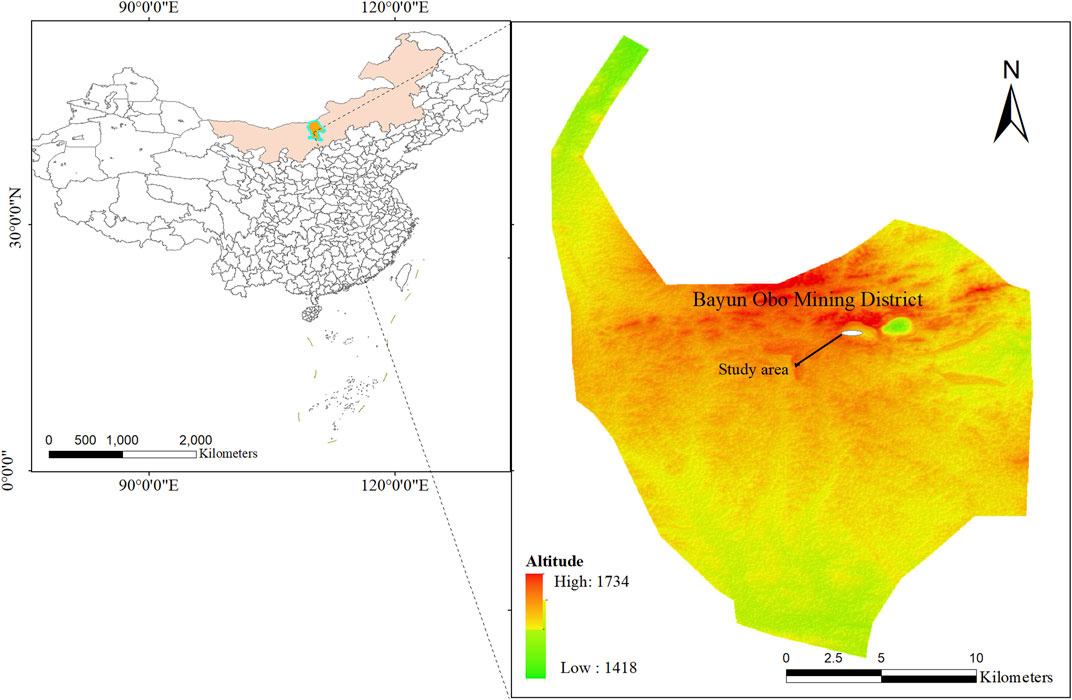
FIGURE 7. Location of the study area of the open mine, Inner Mongolia, China.
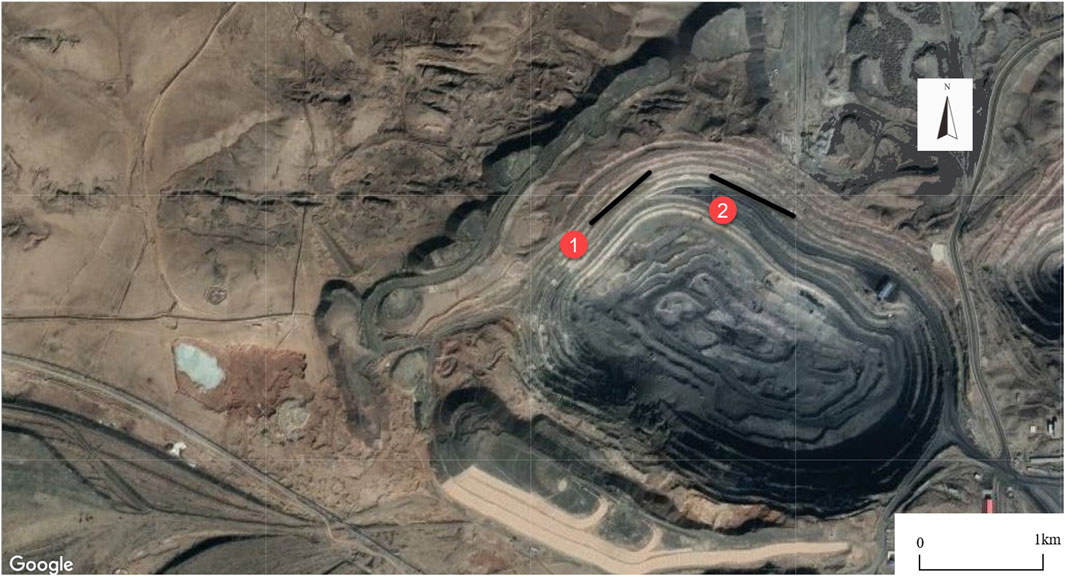
FIGURE 8. Schematic diagram of the survey line layout and geological survey map.
In order to maintain consistency and comparability with the previous measurements conducted in 2016, the measurement lines were arranged in areas unaffected by the landslide that occurred in 2020. To ensure the position of the measuring lines remained unchanged, a GPS coordinate positioning device was used to select the same electrode points as in 2016. The electrodes were then placed at the same points, and the same measuring direction on the slope steps was maintained for arranging the high-density electrical measuring lines. For the measurements, the same high-density electrical measuring instrument, such as the DUK-2B high-density electrical measuring instrument, was selected. The instrument type, electrode spacing, working voltage, insulation coefficient, and other measuring parameters were also kept consistent with the previous measurements to ensure the comparability of the data obtained. By maintaining these consistent measurement conditions, the study aimed to accurately compare and analyze the changes in the slope hazard sources over time (Table 2).

TABLE 2. List of measurement parameters.
According to the geological conditions and geophysical characteristics of the area, a total of 2 survey lines were laid in the high slopes of open-pit mines.
6 Results of detective areas and explanation
In this article, we have selected two groups of profiles for analysis: one group consists of profiles showing more pronounced changes in the slope hazard sources, while the other group comprises profiles without significant changes. Prior to the analysis, a preliminary geological survey was conducted, and relevant geological data were collected. Using two high-density electrical methods, we examined the underground structure and inferred the characteristics and locations of the slope hazard sources. By analyzing the resistivity changes observed in the physical inversion maps, we identified areas exhibiting low resistivity anomalies. These areas were determined to be fault fragmentation zones, water-bearing soft rock layers, water-conducting fracture zones, and other potential hazard sources based on their resistivity variations.
Furthermore, by studying the resistivity changes over time in the physical inversion, we observed minor variations in the slope hazard sources. Areas demonstrating significant changes were identified as regions with a higher potential for slope collapse hazards. Through these analyses, we aim to provide valuable insights into the dynamics of slope hazard sources and their potential impact on slope stability.
In the analysis of Section 1, the raw data obtained from the high-density electrical method in both 2016 and 2022 underwent mean-filtering and wavelet denoising. Following the mean-filtering and wavelet denoising, the data underwent further refinement through geological correction using the parametric area method. This correction method incorporates the geological information and characteristics specific to the study area, aiming to enhance the accuracy of the inversion results.
Through the application of the parametric area method for geological correction, a more comprehensive consideration of the subsurface geological structures and properties can be achieved. Consequently, this approach enables more precise interpretations and representations of the resistivity distribution in Section 1 for both the 2016 and 2022 datasets.
In 2016, the inversion was conducted using the least squares method with smoothing constraints, resulting in the generation of Figure 9A. The resistivity values across the entire section predominantly ranged between 100 Ω m and 300 Ω m. However, there was a notable decrease in resistivity between measurement points 200 and 220, typically falling below 20 Ω m. Beyond point 250, the resistivity values increased significantly, generally exceeding 10,000 Ω m. Additionally, localized anomalies with low resistivity were observed at survey points 70 and 120, forming closed patterns. By considering the findings from surface surveys, it can be inferred that the majority of the slope rock layers consist of weathered dolomite. Moreover, a fault fracture zone is present between survey points 200 and 220, while mica rocks are observed in the layers beyond point 250. The distinct resistivity variation between deep and shallow dolomite layers can be attributed to various geological factors, as suggested by previous studies. It is worth noting that survey points 70 and 120 might represent pseudo-anomalies or indicate minor fractures and the resistivity of deep dolomite differs from that of the shallow portion.
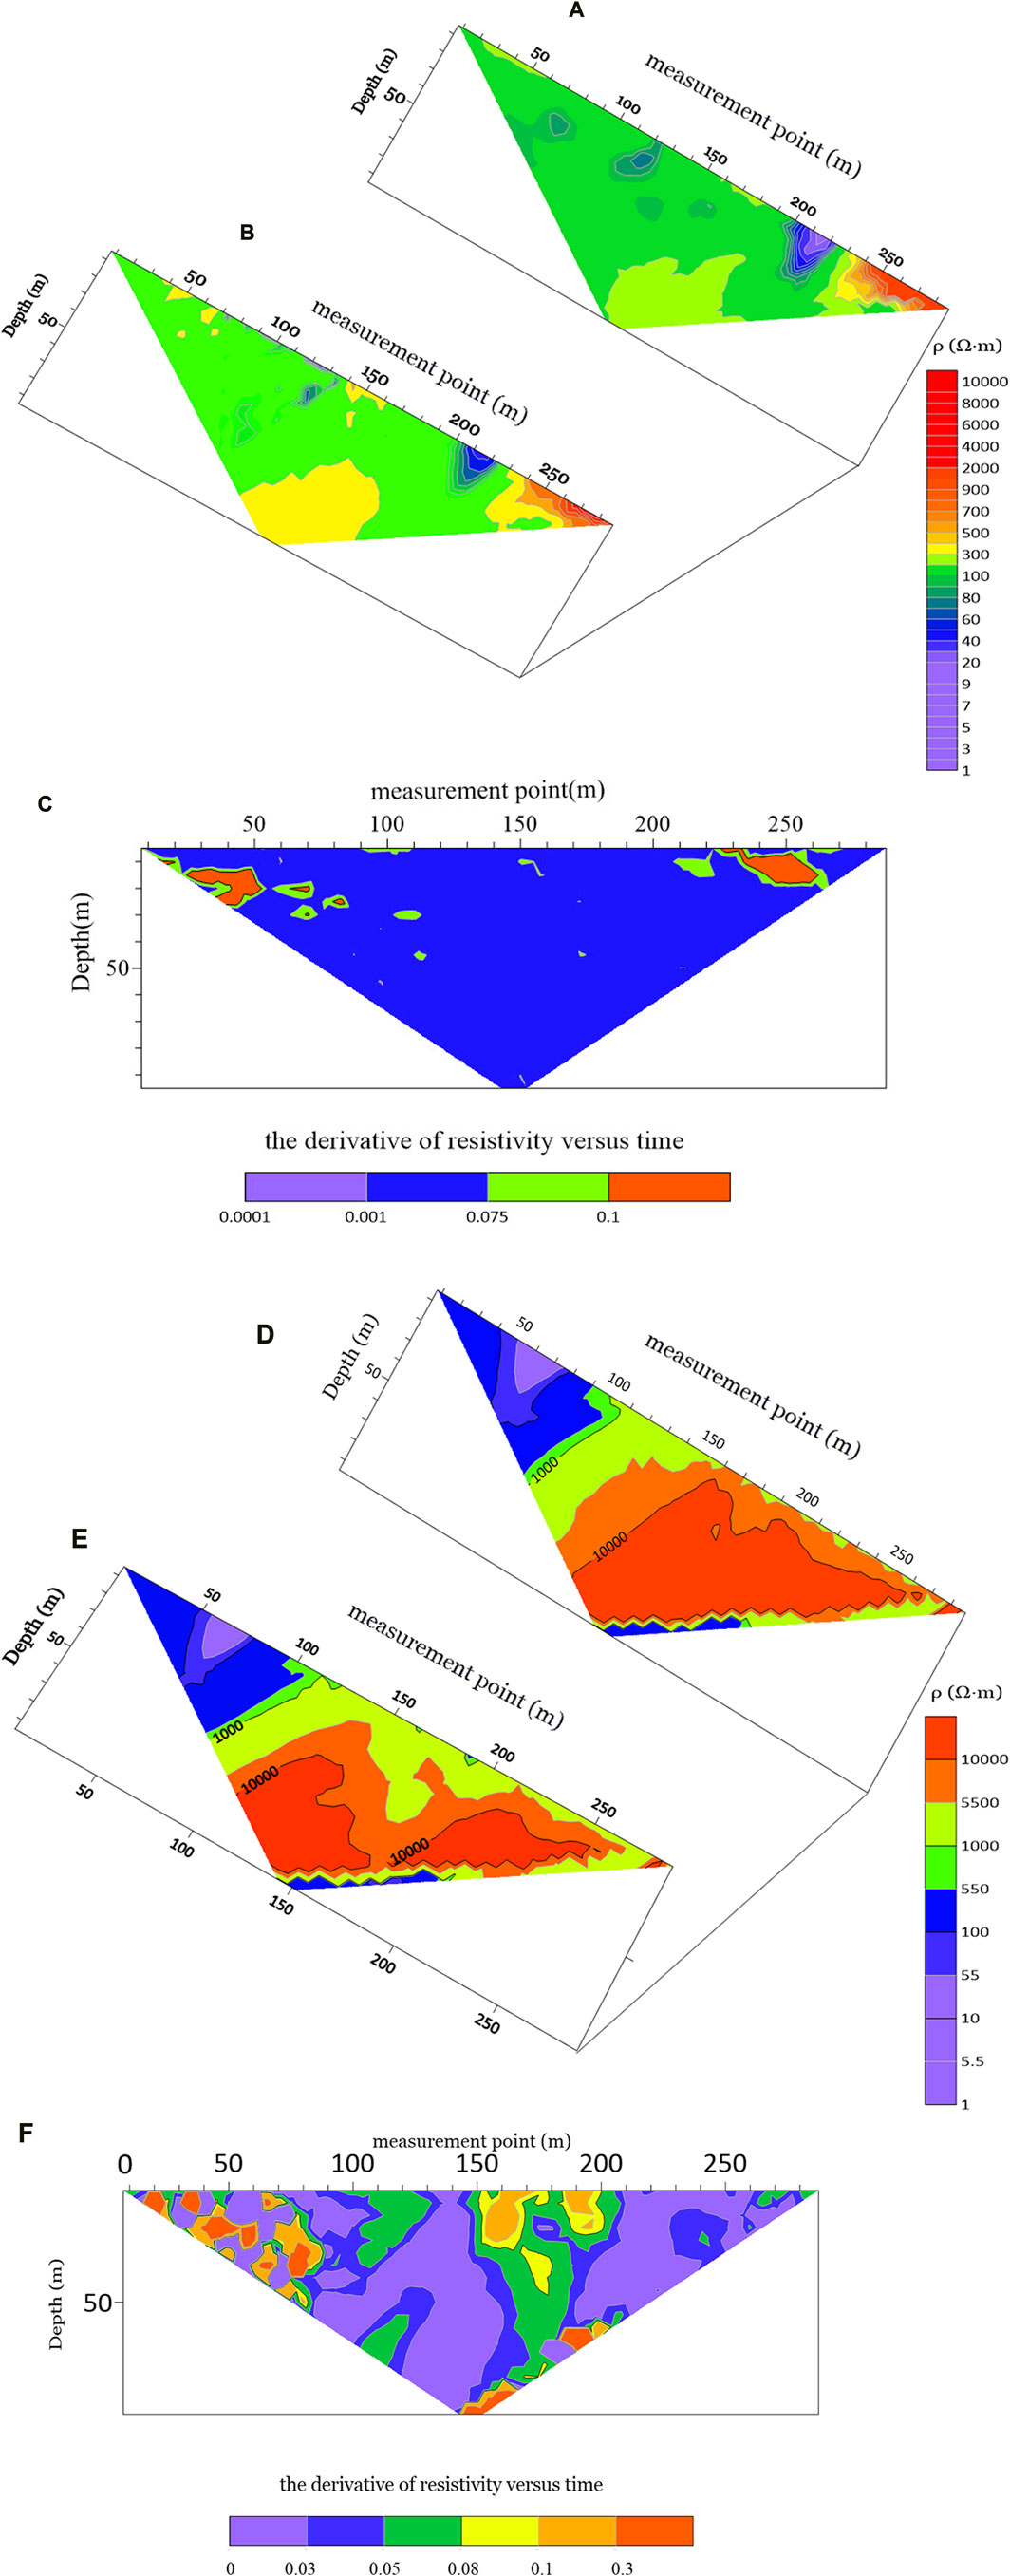
FIGURE 9. Geophysical inversion section Section 1, (A, B); Section 2, (D, E) of the high-density resistivity method. The inversion section of the derivative of resistivity changes with time (C, F).
In 2022, the inversion was also performed using the least squares method with smoothing constraints, resulting in the generation of Figure 9B. When compared with the 2016 results, the resistivity distribution across the entire section remained largely consistent. Notably, there were no localized anomalies with closed patterns observed at measurement points 70 and 120 in 2022. This absence of anomalies at those points may be attributed to false anomalies generated during the inversion process in 2016 (Figures 9A,B).
Based on the analysis of the resistivity change relationship over time, it can be observed that the majority of the area in profile 1 exhibits a resistivity change rate below 0.09, indicating that the subsurface structure remains relatively unchanged. However, there are specific regions within the profile where the resistivity change rate exceeds 0.12, indicating significant changes in the disaster source in those areas. In the 30–50 m region, which did not initially show the presence of disaster sources in 2016, the derivative inversion diagram of normalized resistivity versus time indicates values above 0.12. This evolution is likely due to the combined effects of external freezing and thawing and water erosion on the original geological fractures, leading to weathering and fragmentation of the slate. Field surveys confirm the presence of fault fragmentation zones in the side slope step, with broken geotechnical bodies indicating the evolution of the disaster source in this area. In the 120 m region, the derivative value is below 0.09, suggesting that the disaster source has not significantly evolved compared to the surrounding dolomite area. This implies that the geotechnical body in the fault fragmentation zone remains relatively stable, with a stronger water-supply capacity than the surrounding rock. The measurement line in the 240–260 m area consists of mica-containing dolomite, mica rock, and weathered dolomite. The derivative of resistivity versus time in this region exceeds 0.15, indicating the presence of exposed mica rock that has undergone fragmentation due to the influence of atmospheric precipitation and groundwater. Further fragmentation of weathered dolomite occurs under external forces. Site investigations confirm the abundance of mica rocks in this area, which are susceptible to destruction by water erosion, leading to decreased resistivity (Figure 9C).
In summary, for profile 1, the majority of the area exhibits a resistivity change rate below 0.09, suggesting limited evolution. However, the disaster sources in this profile have evolved to varying degrees. The 120 m region shows minimal evolution, while the area of 200–220 m exhibits further internal evolutionary damage. The 30–50 m region, originally considered more stable, experienced significant changes due to the nature of the slate, rainwater erosion, and periodic blasting vibrations. The evolution of slope hazard sources is non-uniform and asynchronous, influenced by geological conditions, structural characteristics, and external factors such as precipitation and blasting vibrations. The derivative of resistivity versus time, with values above 0.12, indicates significant evolution in the respective regions.
Figure 9D presents the inversion map of mine profile 2, obtained by denoising the high-density electrical exploration data in 2016. The map clearly illustrates a region with very low resistivity, ranging from points 0 to 80 with values between 0 and 50 Ω m. Based on the known resistivity characteristics of different rock types and previous geological studies, this area is interpreted as fractured dolomite and shale. Notably, the resistivity remains low in the range from measurement point 80 to 120, and an evident boundary is observed between low resistivity on the left and high resistivity on the right. This observation suggests the presence of a fault fracture zone, which is further confirmed by the field geological survey, and it corresponds to the boundary line between dolomite and shale. The resistivity values beyond point 120, extending to 300 m, exceed 6,000 Ω m, indicating the presence of intact dolomite. Figure 8E depicts the high-density electrical inversion map of Profile 2 in 2022, employing the same parameters for data acquisition and processing. Upon comparison with the 2016 results, the resistivity distribution in most areas remains relatively stable, with no significant changes observed. However, a noticeable alteration is evident between survey points 150 and 200. In conjunction with field surveys, this variation suggests the occurrence of mica-bearing dolomite breakage in that region (Figures 9D,E).
In the 0–80 m area, the majority of derivatives exceed 0.1, indicating that the disaster source has undergone some degree of evolution compared to the surrounding rock. It is presumed that the slate and weak rock layers in this area have experienced fragmentation and an increase in rock voids due to water erosion. Field surveys have provided verification of this evolution, as the weak interlayer in the area was found to be filled with rock debris, and the previously intact slate appeared broken. These observations further support the occurrence of evolution in the area. In the 150–220 m area, the derivative of shallow resistivity versus time interval is above 0.1, while in the downward extension area, the derivative value ranges between 0.05 and 0.1. These values differ noticeably from the surrounding area, suggesting the presence of two small fracture zones at approximately 160m and 190 m. However, due to their limited influence area, these zones were not detected during the exploration process. Weathering and mechanical action have contributed to the expansion and downward extension of these zones. Field surveys have revealed fault zone outcroppings at 165 m and 187 m, providing further evidence of the evolution of the disaster source in this area. In the 100–150 m area, both the shallow and deep resistivity derivatives versus time interval range between 0.05 and 0.1. This area consists of weathered dolomite, which is prone to weathering when exposed to water. The upper part of the area may be affected by precipitation, surface water, and blasting vibrations, leading to further weathering damage. The lower part, on the other hand, may experience erosion from underground bedrock water, resulting in the breakage of weathered dolomite. The presence of groundwater seepage in the lower part of the terrace during field surveys suggests some level of evolution in this area, as it acts as a transitional zone between slate and dolomite.
In summary, for profile 2, the disaster source originally identified within the 0–80 m range undergoes noticeable evolution, with further damage occurring due to water erosion. The 150–220 m area, not initially identified as a disaster source, experiences significant expansion and evolution of an unidentified small fault at the junction of slate and dolomite. This evolution is attributed to the high degree of rock weathering and periodic blasting vibrations. The single high-density electrical method inversion map alone may not easily identify these changes. However, by utilizing the derivative of the inversion resistivity versus time interval as a characteristic parameter in the time-shifted high-density electrical method, the evolution of the disaster source can be effectively highlighted (Figure 8F).
7 Conclusion
The mine is in production, and due to the complex geological genesis, periodic blasting, and short-term heavy rainfall in the summer in the mining area caused by climate warming, the slope has collapsed several times, which greatly affects the life and property safety of the mine operators. Time-shifted high-density electrical method is a very effective method for slope exploration, which can obtain information about the nature and distribution of underground materials by observing the change of underground resistivity with time. We have investigated and analyzed the slopes in the area where no collapse has occurred and have reached the following conclusions.
1 The time-lapse high-density electrical method can show the evolution of fault sources within the slope, and the use of the derivative of resistivity versus time can effectively identify the stratigraphic structure within the slope. During our exploration, the time-shifted high-density electrical method accurately identified faults and weak rock layers, and can clearly reflect the interface between dolomite and fault fracture zones.
2 We found that the geological structure of most areas of the slope did not change significantly, but obvious changes were produced in the original fault fracture zone, soft rock layer, and other hazard source areas, and the potential collapse hazard areas can be classified according to the magnitude of values and sparseness of contours.
3 The time-shifted high-density resistivity method is applicable to slope hazard source monitoring, which can effectively identify the morphological characteristics of the distribution and evolution of hazard sources, on the basis of which the dynamic monitoring of hazard sources within the slope can be realized. It can provide an important basis for future slope safety management and a theoretical basis for monitoring similar geological hazards.
In future research, it is important to conduct a comparative analysis of this method with other approaches for detecting slope hazard sources. Additionally, the implementation of intelligent procedures for automated data collection and processing should be considered. These advancements will contribute to enhancing the effectiveness and efficiency of slope hazard detection and analysis.
Data availability statement
The original contributions presented in the study are included in the article/Supplementary material, further inquiries can be directed to the corresponding author.
Author contributions
KS wrote the manuscript, prepared the graphs, and analyzed the data; ZZ provided guidance in data processing and results interpretation and supervised the fieldwork. All authors contributed to the article and approved the submitted version.
Funding
The project was funded by the Natural Science Foundation of Inner Mongolia Autonomous Region (2019MS04016).
Conflict of interest
The authors declare that the research was conducted in the absence of any commercial or financial relationships that could be construed as a potential conflict of interest.
Publisher’s note
All claims expressed in this article are solely those of the authors and do not necessarily represent those of their affiliated organizations, or those of the publisher, the editors and the reviewers. Any product that may be evaluated in this article, or claim that may be made by its manufacturer, is not guaranteed or endorsed by the publisher.
References
Bao, Y., Chen, J., Su, L., Zhang, W., and Zhan, J. (2023). A novel numerical approach for rock slide blocking river based on the CEFDEM model: A case study from the samaoding paleolandslide blocking river event. Eng. Geol. 312, 106949. doi:10.1016/j.enggeo.2022.106949
Boyd, J., Chambers, J., Wilkinson, P., Peppa, M. V., Watlet, A., Kirkham, M., et al. (2021). A linked geomorphological and geophysical modelling methodology applied to an active landslide. Landslides 18, 2689–2704. doi:10.1007/s10346-021-01666-w
Camporese, M., Cassiani, G., Deiana, R., Salandin, P., and Binley, A. (2015). Coupled and uncoupled hydrogeophysical inversions using ensemble Kalman filter assimilation of ERT-monitored tracer test data. Water Resour. Res. 51, 3277–3291. doi:10.1002/2014wr016017
Doetsch, J., Linde, N., and Binley, A. (2010). Structural joint inversion of time-lapse crosshole ERT and GPR traveltime data. Geophys. Res. Lett. 37. doi:10.1029/2010gl045482
Dong, H.-B., and Wang, C.-L. (2003). Development and application of 2D resistivity imaging surveys. Earth Sci. Front. 10, 171–176. doi:10.3321/j.issn:1005-2321.2003.01.020
Du, H., and Song, D. (2022). Investigation of failure prediction of open-pit coal mine landslides containing complex geological structures using the inverse velocity method. Nat. Hazards 111, 2819–2854. doi:10.1007/s11069-021-05159-w
Du, H., Song, D., Liu, G., Guo, W., Wang, X., and Bai, R. (2023). Influence of the extra-thick coal seam exploitation on the deformation characteristics of the overlying rock mass in an open-pit mine slope. Geomatics, Nat. Hazards Risk 14, 1–23. doi:10.1080/19475705.2022.2161952
Dupis, A. (1980). “Geosounding principles, 1. Resistivity sounding measurements: O. Koefoed,” in Methods in geochemistry and geophysics. Physics of the earth and planetary interiors (Amsterdam: Elsevier), 23, 160. ISBN 0-444-41704-4. xiv + 276 pp. + 11 pp. encl., Dfl. 130.00., approx. US $ 66.50.
Fan, H.-R., Yang, K.-F., Hu, F.-F., Liu, S., and Wang, K.-Y. (2016). The giant Bayan Obo REE-Nb-Fe deposit,China:Controversy and ore genesis. Geosci. Front. 7, 335–344. doi:10.1016/j.gsf.2015.11.005
Ferahtia, J., Djarfour, N., Baddari, K., and Kheldoun, A. (2012). A fuzzy logic-based filter for the removal of spike noise from 2D electrical resistivity data. J. Appl. Geophys. 87, 19–27. doi:10.1016/j.jappgeo.2012.08.007
Fritsch, F. N., and Carlson, R. E. (1980). Monotone piecewise cubic interpolation. SIAM J. Numer. Analysis 17, 238–246. doi:10.1137/0717021
Hojat, A., Arosio, D., Ivanov, V. I., Longoni, L., Papini, M., Scaioni, M., et al. (2019). Geoelectrical characterization and monitoring of slopes on a rainfall-triggered landslide simulator. J. Appl. Geophys. 170, 103844. doi:10.1016/j.jappgeo.2019.103844
Johnson, T. C., Burghardt, J., Strickland, C., Knox, H., Vermeul, V., White, M., et al. (2021). 4D proxy imaging of fracture dilation and stress shadowing using electrical resistivity tomography during high pressure injections into a dense rock formation. J. Geophys. Research-Solid Earth 126. doi:10.1029/2021jb022298
Lai, X., Yang, X., and Sun, W. (2012). Geochemical constraints on genesis of dolomite marble in the bayan Obo REE–Nb–Fe deposit, inner Mongolia: implications for REE mineralization. J. Asian Earth Sci. 57, 90–102. doi:10.1016/j.jseaes.2012.06.008
Lapenna, V., and Perrone, A. (2022). Time-lapse electrical resistivity tomography (TL-ERT) for landslide monitoring: recent advances and future directions. Appl. Sciences-Basel 12, 1425. doi:10.3390/app12031425
Lesparre, N., Nguyen, F., Kemna, A., Robert, T., Hermans, T., Daoudi, M., et al. (2017). A new approach for time-lapse data weighting in electrical resistivity tomography. Geophysics 82, E325–E333. doi:10.1190/geo2017-0024.1
Li, G., Zhu, C., He, M., Zuo, Y., Gong, F., Xue, Y., et al. (2023). Intelligent method for parameters optimization of cable in soft rock tunnel base on longitudinal wave velocity. Tunn. Undergr. Space Technol. 133, 104905. doi:10.1016/j.tust.2022.104905
Lin, S., Wang, W., Deng, X., Zha, Y., Zhou, H., and Cheng, M. (2019). Geophysical observation of typical landslides in three gorges reservoir area and its significance: A case study of sifangbei landslide in wanzhou district. Earth Sci. 44, 3135–3146. doi:10.3799/dqkx.2019.074
Liu, B., Liu, Z., Li, S., Fan, K., Nie, L., and Zhang, X. (2017). An improved Time-Lapse resistivity tomography to monitor and estimate the impact on the groundwater system induced by tunnel excavation. Tunn. Undergr. Space Technol. 66, 107–120. doi:10.1016/j.tust.2017.04.008
Loke, M. H., and Barker, R. D. (1996). Rapid least-squares inversion of apparent resistivity pseudosections by a quasi-Newton method1. Geophys. Prospect. 44, 131–152. doi:10.1111/j.1365-2478.1996.tb00142.x
Loke, M. H., Chambers, J. E., Rucker, D. F., Kuras, O., and Wilkinson, P. B. (2013). Recent developments in the direct-current geoelectrical imaging method. J. Appl. Geophys. 95, 135–156. doi:10.1016/j.jappgeo.2013.02.017
Loke, M. H., Dahlin, T., and Rucker, D. F. (2014). Smoothness-constrained time-lapse inversion of data from 3D resistivity surveys. Near Surf. Geophys. 12, 5–24. doi:10.3997/1873-0604.2013025
Lu, X. C., Liu, X., Xiong, B. B., Cui, X., Tian, B., Cai, Z. L., et al. (2023). Water distribution characteristics of slopes based on the high-density electrical method. Water 15, 895. doi:10.3390/w15050895
Norooz, R., Olsson, P. I., Dahlin, T., Gunther, T., and Bernstone, C. (2021). A geoelectrical pre-study of alvkarleby test embankment dam: 3D forward modelling and effects of structural constraints on the 3D inversion model of zoned embankment dams. J. Appl. Geophys. 191, 104355. doi:10.1016/j.jappgeo.2021.104355
Purcell, E. M., and Morin, D. J. (2013). Electricity and magnetism. Cambridge: Cambridge University Press.
Ren, F., Zhu, C., He, M., Shang, J., Feng, G., and Bai, J. (2023). Characteristics and precursor of static and dynamic triggered rockburst: insight from multifractal. Rock Mech. Rock Eng. 56, 1945–1967. doi:10.1007/s00603-022-03173-3
Song, D., and Du, H. (2023). Numerical investigation of the evolution process of an open-pit mine landslide using discrete-element method. Int. J. Geomechanics 23, 04023054. doi:10.1061/ijgnai.gmeng-7568
Wang, K., Fang, A., Zhang, J., Yu, L., Dong, C., Zan, J., et al. (2019). Genetic relationship between fenitized ores and hosting dolomite carbonatite of the Bayan Obo REE deposit, Inner Mongolia, China. J. Asian Earth Sci. 174, 189–204. doi:10.1016/j.jseaes.2018.12.007
Wang, Q., Xu, S., Xin, Z., He, M., Wei, H., and Jiang, B. (2022a). Mechanical properties and field application of constant resistance energy-absorbing anchor cable. Tunn. Undergr. Space Technol. 125, 104526. doi:10.1016/j.tust.2022.104526
Wang, X., Wang, Y., Lin, Q., Li, N., Zhang, X., and Zhou, X. (2022b). Projection of China landslide disasters population risk under climate change. Progress. Inquisitiones Mutat. Clim. 18, 166–176. doi:10.12006/j.issn.1673-1719.2021.154
Wilkinson, P. B., Chambers, J. E., Meldrum, P. I., Kuras, O., Inauen, C. M., Swift, R. T., et al. (2022). Windowed 4D inversion for near real-time geoelectrical monitoring applications. Front. Earth Sci. 10. doi:10.3389/feart.2022.983603
Yang, K.-F., Fan, H.-R., Santosh, M., Hu, F.-F., and Wang, K.-Y. (2011). Mesoproterozoic mafic and carbonatitic dykes from the northern margin of the north China craton: implications for the final breakup of columbia supercontinent. Tectonophysics 498, 1–10. doi:10.1016/j.tecto.2010.11.015
Yang, X.-Y., Sun, W.-D., Zhang, Y.-X., and Zheng, Y.-F. (2009). Geochemical constraints on the genesis of the bayan Obo Fe–Nb–REE deposit in inner Mongolia, China. Geochimica Cosmochimica Acta 73, 1417–1435. doi:10.1016/j.gca.2008.12.003
Zhang, H. R., Zhao, B., Dong, S. Q., Wang, X. X., and Jing, P. F. (2022). A method for the inversion of reservoir effective permeability based on time-lapse resistivity logging data and its application. Geofluids 2022, 1–13. doi:10.1155/2022/8704344
Zhongxin, Y., Ge, B., Chenyu, W., Zhongqin, Z., and Xianjiang, Y. (1992). Geological features and genesis of the Bayan Obo REE ore deposit, Inner Mongolia, China. Appl. Geochem. 7, 429–442. doi:10.1016/0883-2927(92)90004-m
Keywords: slope of open-pit mine, time-lapse high-density electricity method, apparent resistivity, evolution of disaster sources, geophysical inversion
Citation: Sen K and Zihao Z (2023) Detection and evolution of disaster sources in high slopes of open-pit mines based on time-lapse high-density electricity method. Front. Earth Sci. 11:1194446. doi: 10.3389/feart.2023.1194446
Received: 27 March 2023; Accepted: 28 August 2023;
Published: 12 September 2023.
Edited by:
Yunhui Zhang, Southwest Jiaotong University, ChinaReviewed by:
Danqing Song, South China University of Technology, ChinaChun Zhu, Hohai University, China
Rui Yong, Ningbo University, China
Copyright © 2023 Sen and Zihao. This is an open-access article distributed under the terms of the Creative Commons Attribution License (CC BY). The use, distribution or reproduction in other forums is permitted, provided the original author(s) and the copyright owner(s) are credited and that the original publication in this journal is cited, in accordance with accepted academic practice. No use, distribution or reproduction is permitted which does not comply with these terms.
*Correspondence: Zhao Zihao, aHVhMXNoZW5nMjNAMTI2LmNvbQ==