 Zhong Guangjian1,2,3
 Zhao Zhongquan1*
 Tu Guanghong1*Zhang Kangshou1Zhao Jing1Yi Hai1Feng Changmao1Yu Junhui2
- 1Guangzhou Marine Geological Survey, Guangzhou, China
- 2Key Laboratory of Ocean and Marginal Sea Geology, South China Sea Institute of Oceanology, Innovation Academy of South China Sea Ecology and Environmental Engineering, Chinese Academy of Sciences, Guangzhou, China
- 3Key Laboratory of Marine Mineral Resources, Ministry of Natural Resources, Guangzhou, China
The marine Mesozoic is widely distributed in the northeastern waters of the South China Sea and is an important field for oil-gas exploration in the South China Sea. The Chaoshan Depression is the largest residual depression in this sea. At a previous well, LF35-1-1, no oil and gas have been discovered with then pre-drilling prediction techniques. Post-drill analysis shows that the physical properties of the Mesozoic reservoir are not favorable there. So, in accurate prediction of the oil-gas reservoirs is necessary. Since the drilling at the LF35-1-1, extensive surveys and studies have been carried out which shows a number of favorable trapping structures. In the middle low bulge of the Chaoshan Depression, the DS-A structures found with potential reservoirs, complete trap structures, and dual source hydrocarbon supply on both sides, making it the most favorable zone for oil-gas accumulation. We apply the state of art prediction techniques for it using pre-stack seismic raw gather. The sensitivity analysis results of reservoir physical properties indicate that the difference in P- wave velocity between sand and mudstone is 500 m/s, the difference in density is 0.02 g/cm3, and the Poisson’s ratio ranges between 0.11 and 0.33. The Mesozoic sandstone reservoirs in the Chaoshan Depression have characteristics of high velocity and low Poisson’s ratio, and the P-wave velocity, density, and Poisson’s ratio are the main sensitive parameters for predicting reservoir and its oil-gas bearing properties. The density inversion, P-wave impedance inversion, and S-wave impedance inversion jointly characterize the “wedge-shaped” sand body in the DS-A structural area, with a maximum thickness of over 400 m and an area of ∼130 km2. The overlap of the sand body contour map and Poisson’s ratio inversion results indicates that the “wedge-shaped” sand body is an oil-gas bearing sand body. It can be concluded that pre-stack elastic parameter inversion is an effective method for reservoir prediction in deep-sea no-well exploration areas. It has the characteristics of high signal-to-noise ratio, strong stability and reliability, and high accuracy, which is conducive to reduce the non-uniqueness and uncertainty of seismic inversion. The inversion results predict that the DS-A structure is an oil-gas bearing structure.
1 Introduction
The distribution area of Mesozoic in the northern of South China Sea (SCS) is more than 10×104 km2, several residual depressions have developed, among which the Chaoshan Depression is the largest one, it has good potential for oil-gas exploration, but oil and gas have not been discovered through drilling. The physical properties of the Mesozoic reservoir are complex, the seismic response is weak, the mechanism of oil-gas accumulation is unclear, and the pre drilling prediction does not match the actual drilling results (Wang et al., 2000; Hao et al., 2001; Hao et al., 2004; Yang et al., 2008; Hao et al., 2009; Wang et al., 2009; Yao et al., 2011; Duan et al., 2012; Zhang et al., 2012; Ji et al., 2014; Zhang et al., 2014; Hu et al., 2022; Guo et al., 2022; Yang et al., 2022; Zhong et al., 2022a; Zhao et al., 2023;). In recent years, a large number of oil-gas exploration investigations and studies have been conducted in this area, and organic-rich marine Mesozoic and trap structures have been discovered. The middle low bulge, especially the DS-A structural area, has developed reservoirs, complete trap structures, and dual source hydrocarbon supply on both sides, making it the most favorable area for oil-gas accumulation. Effective identification and prediction of reservoir oil-gas bearing properties are the key to successful exploration.
Seismic inversion is the most widely used technology for predicting oil-gas reservoirs today. Seismic inversion of elastic properties is one of the important seismic inversion methods, it uses Pre-stack CRP gather data, velocity data, and well data to invert various elastic parameters related to lithology and oil-gas properties, and is further used to predict rock physical properties and their oil-gas bearing properties, it has good stability and high accuracy (Gardner et al., 1974; Gray D.1999; Han et al., 2018; Hamed et al., 2018; Heidari et al., 2013; Ji et al., 2014; Kelly et al., 2001; Liu et al., 2016; Ojha et al., 2021; Pan et al., 2016; Pedro et al., 2018; Sena et al., 2011; Smith et al., 1987; Son et al., 2018; Subhashis M.2001; Ursin et al., 1996; Zong et al., 2012). This paper is based on the physical intersection analysis of sandstone rocks in well LF35-1-1, searches for reservoir and hydrocarbon sensitive elastic parameters, and then describes the gas bearing reservoir morphology and internal structure to achieve accurate prediction of gas bearing properties of sandstone reservoirs.
2 Geological setting and research status of seismic inversion in study area
Marine Mesozoic rocks in the northern of SCS have been found by a large number of geophysical surveys and drilling data. For example, many wells (CFC-1, A-1B, etc.) in the southwestern Taiwan basin reveal the Lower Cretaceous (Zhou et al., 2002; He et al., 2006; Zhong et al., 2007), and the well LF35-1-1 in the Chaoshan depression reveals the Middle and Upper Jurassic organic-rich marine strata (Shao et al., 2007; Wu et al., 2007). After experiencing multiple stages of basin formation and deformation, a large superimposed basin formed (Zhong et al., 2011). The Chaoshan depression is the largest Mesozoic residual depression in the northern SCS, with an area of more than 3.7 × 10⁴ km2 and a water depth of 300 m–3000 m. Six secondary tectonic units can be divided as the eastern sag, western sag, middle-low bulge, northern slope, central slope, and western slope. Based on the latest survey data, it is found that there is a large trap structure (structure-A) in the low bulge in the central Chaoshan Depression, bounded by antithetic and synthetic faults, which may provide favorable conditions for the formation of oil–gas (Figure 1). Its underlying structural layer is Mesozoic marine deposits, with a maximum deposition thickness of approximately 6,000 m. The Mesozoic strata in Chaoshan depression comprises of T3-J1, J2, J3 and K (Figure 2) (Zhong et al., 2022b).
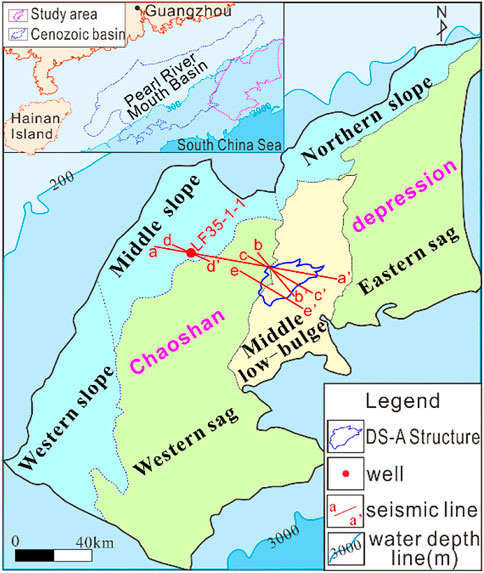
FIGURE 1. Location of chaoshan depression.
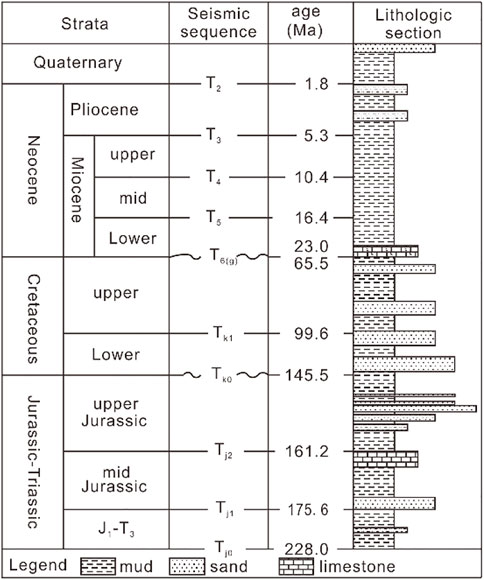
FIGURE 2. Stratigraphic column map.
Well LF35-1-1 confirmed that the Chaoshan depression was filled with Cretaceous continental deposits and Middle - Late Jurassic marine deposits, of which the Middle - Late Jurassic marine deposits had good petroleum geological conditions (Hao et al., 2001), and revealed two beds of hydrocarbon source rocks in 1940 m–2022 m and 2,100 m–2412 m well section. Table 1 shows its geochemical indicators. The 1940 m–2022 m hydrocarbon source rock is poor to medium hydrocarbon source rock, and the 2,100 m–2400 m hydrocarbon source rock is medium to good hydrocarbon source rock (Yang et al., 2008). The organic matter types of these two hydrocarbon source rocks are mainly type III and a small amount of type II2, which are distributed in the marine strata of the Middle and Upper Jurassic and are stable over a large scale. The minimum thickness of the single layer of the source rock is 6 m, the maximum is more than 40 m, and the average thickness is approximately 20 m. The average thickness of a single layer of the lower source rock is greater than that of the upper source rock.
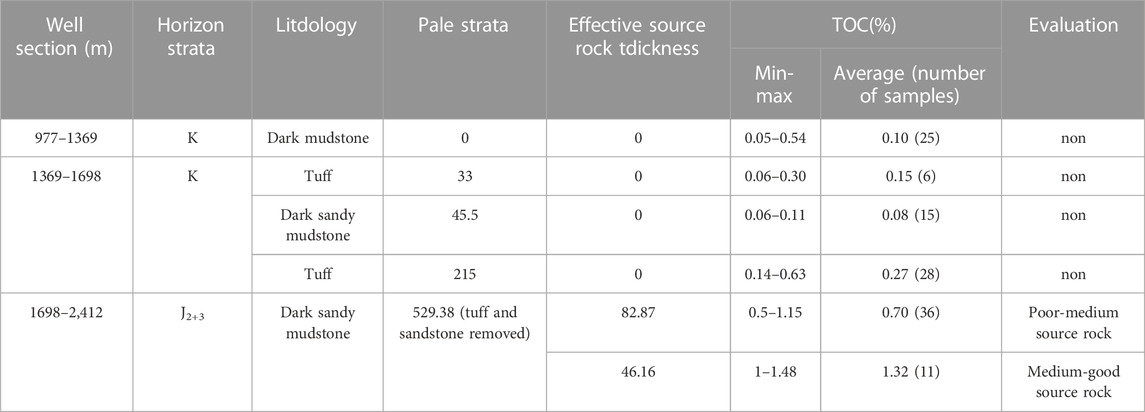
TABLE 1. Geochemical characteristics of dark mudstone in well LF35-1-1
From the interpretation of seismic data in the Chaoshan depression based on calibration of well LF35-1-1 (Figure 3), three sets of source rocks are developed in the Mesozoic, of which the Upper Triassic-Lower Jurassic source rocks are dominated by bathyal-shallow marine facies, the Middle Jurassic source rocks are dominated by shallow marine facies, and the Upper Jurassic source rocks are dominated by bathyal-shallow marine facies.
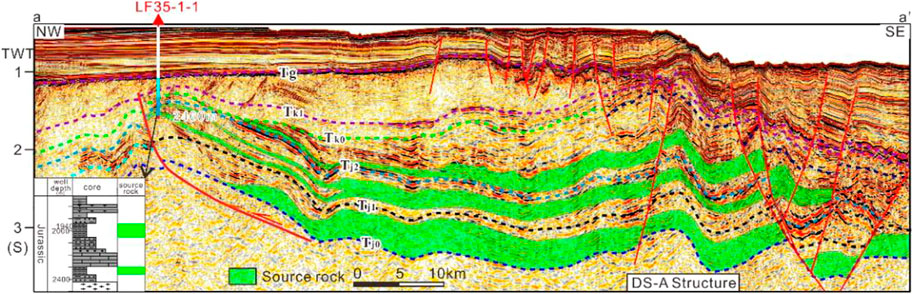
FIGURE 3. Interpreted seismic profile of line (a–a’) (see Figure 1 for location).
The seismic profile shows (Figure 4A) that there is a set of submarine fan sandstones advancing from SE to NW is developed at the top of the Upper Jurassic. This article focuses on this set of submarine fan sandstones (Figure 4B), the root of the fan (inner fan natural embankment deposits (Figure 4C)) is located in the southeast of the profile, while the middle of the fan is located in the middle and northwest of the profile. Among them, the middle part is mainly middle fan channel deposits, and the sandstone reservoir at this location has the best physical properties. Middle fan front deposits are mainly developed in the northwest. On the plane, the seismic facies analysis results show that the submarine fan is distributed in the SE‒NW direction, and the target structure is located in the braided channel area of the middle fan and the non-water channel area of the middle fan, which are both high-quality sandstone reservoir development areas.
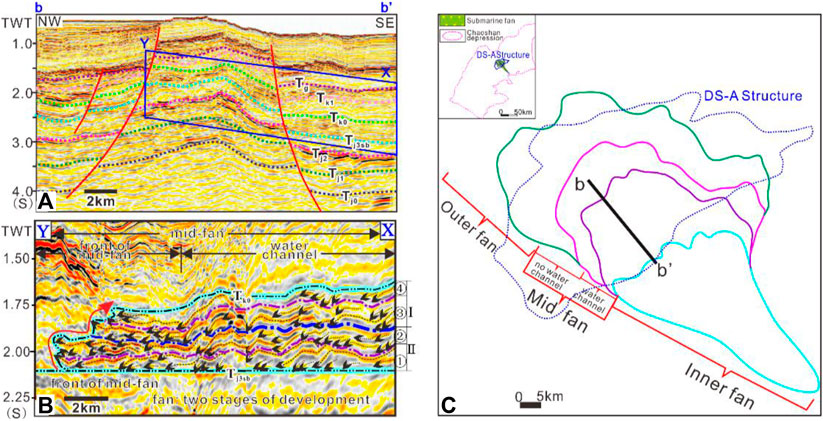
FIGURE 4. Reservoir characterization of DS-A structure (see Figure 1 for location).
Shore-shallow marine facies and semi-deep sea facies mudstones with the thicknesses of more than 200 m, which are widely distributed throughout the region in the late Oligocene and after, are relatively pure in texture, have good capping ability, and can form a regional capping layer. According to the drilling data of the well LF35-1-1, the single layer of multiple sets of mudstone encountered in this well is large, with a maximum thickness of more than 40 m. It should have good sealing capacity and be an important local cap rock in this area.
In reservoirs with a high oil-gas accumulation, the seismic wave velocity and strata density will decrease, “dark spots” reflections will appear at the top interface of the reservoir, and “bright spots” reflections will appear at the bottom interface of the reservoir. Oil-gas discovery will be achieved in many domestic oilfields using “dark spot” and “bright spots” technology (Zhang et al., 2009; Yin et al., 2014). In oil-gas exploration, the most conventional method of predicting hydrocarbons by “bright spots” or traditional AVO anomalies has been formed, but this method has encountered challenges in the practice of deep-water exploration in SCS (Figures 5A, B). It is found that “bright spots” or traditional AVO anomaly does not necessarily mean that the reservoir contains highly saturated hydrocarbons, and water, low saturation gas and even no reservoir may cause superimposed amplitude “bright spots” or AVO anomaly. Sometimes gas-bearing sandstones may not be “bright spots” of amplitude.
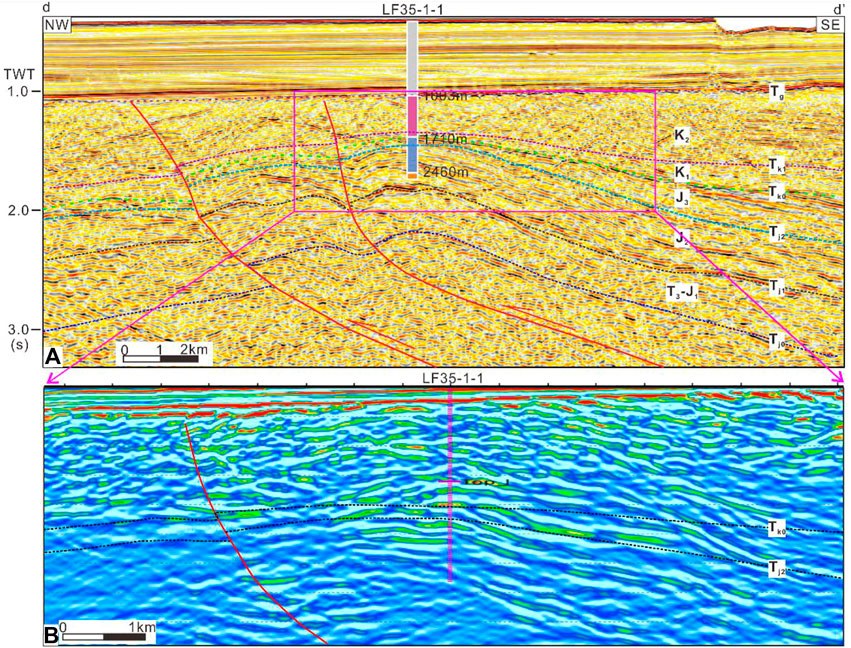
FIGURE 5. AVO index characteristic profile line (d–d’) (see Figure 1 for location).
From the results of AVO analysis in the Chaoshan Depression, it can be observed that the AVO index generally presents certain anomalies at well LF35-1-1 (blue ellipse), while the actual drilling of LF35-1-1 has not found any oil-gas. That means the AVO anomaly does not have a very good prediction effect on Mesozoic oil-gas in the Chaoshan Depression.
To solve this problem of deep-water oil-gas exploration, it is necessary to use other effective geophysical prediction methods to reduce the risk of oil-gas exploration. In view of the low elastic property of gas-bearing reservoirs, the sensitive elastic parameters obtained from pre-stack (elastic) inversion, such as S-wave velocity, density and Poisson’s ratio, can be used to predict hydrocarbons and compensate for the lack of AVO attribute analysis. Elastic parameter inversion has achieved good results in predicting “bright spots” or “sweet spots” (Pan et al., 2016; Zhang et al., 2017; Han et al., 2018).
3 Data and methods
Guangzhou Marine Geological Survey (GMGS) has conducted long-array 2D and quasi-3D seismic surveys. Seismic wave was recorded using a 480-channel streamer at group interval of 12.5 m. The shooting spacing is 37.5 m using a source capacity of 5080 cubic inches. The coverage is up to 80-fold.
The seismic data used in our inversion are pre-stack time migration CRP gather data. Overall, there is no acquisition footprint or abnormal amplitude band. The maximum offset is more than 4000 m, and the maximum incidence angle is approximately 30°. Therefore, the seismic data can fully meet the needs of pre-stack inversion research (Figures 6, 7).
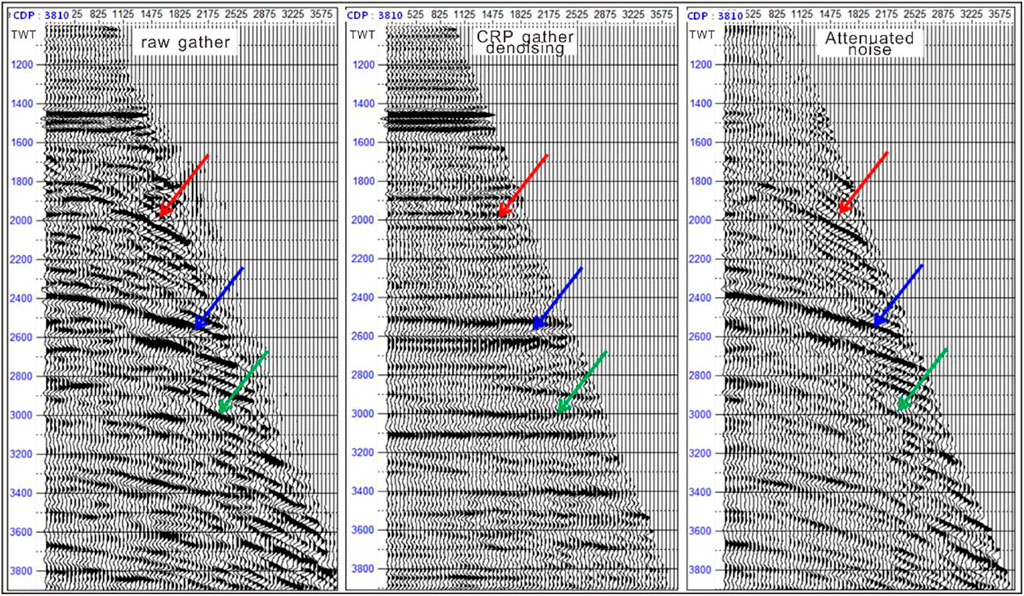
FIGURE 6. CRP gather denoising.
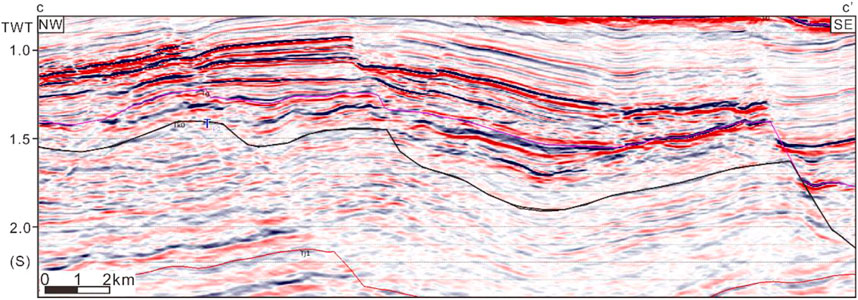
FIGURE 7. Stack profile of line (c–c’) (see Figure 1 for profile location).
Similar to conventional logging data (such as GR and resistivity) to identify lithology and fluid, petro-physical data (such as Poisson’s ratio and density) can also discriminate lithology and fluid, and Poisson’s ratio curve and GR curve are very similar. The difference between the two is that rock physical parameters can be obtained from pre-stack seismic data inversion, while logging parameters such as GR and resistivity cannot be obtained from seismic data, this provides a solution for determining rock physical properties with few wells.
Seismic inversion of elastic properties can be divided into well-constrained and well-free- constrained inversion. Well-free-constrained inversion technology refers to the direct inversion of different elastic parameter using the CRP gather data and velocity data of pre-stack time migration. In this inversion process, “calculate the angle, but do not divide the angle” (Zoeppritz et al., 1919; Aki et al., 1980; Shuey R T, 1985; Zong et al., 2012). Since the well LF35-1-1 is not in the area of structure-A, this study adopts well-free-constrained inversion. Based on the relationship between P-wave velocity and elastic parameters in well LF35-1-1 and taking seismic velocity as a link, a sensitive elastic parameter inversion model in a no-well area is established. The most indicative hydrocarbon prediction elastic parameters are selected, a hydrocarbon elastic identification model is established, and a complete elastic prediction is formed.
Elastic parameters including P-wave impedance (Ip), S-wave impedance (Is), bulk modulus (K), shear modulus (µ), compression modulus (Lame coefficient λ), density (ρ), Young’s modulus (E) and Poisson’s ratio (s) (Fatti J L, 1994; Gray D, 1999) can be obtained by inversion. These elastic parameters can indicate the physical properties of rocks. In addition to S-wave impedance (Is), the other seven elastic parameters can also indicate the fluid properties in rocks. The inversion results are characterized by a high signal-to-noise ratio, strong stability and reliability, and high accuracy, which are very suitable for new exploration areas or no-well area.
The elastic parameters in this study refer to the parameters extracted from pre-stack seismic data, including P-wave velocity, S-wave velocity, density, Poisson’s ratio, etc. The “sweet spot” of the reservoir is related to a variety of elastic parameters and seismic attributes. As a kind of energy, the seismic wave will generate stress on the rock when it propagates underground, and the rock will generate strain accordingly. Because the stress changes relatively fast, the rock response is close to elasticity, and the rock can be regarded as an elastic body. In the elastic deformation zone of the elastomer, the ratio of stress to strain is defined as the elastic modulus. The elastic modulus is a constant, which indicates the difficulty of rock strain under stress. According to different stress and strain conditions, it can be divided into the tensile modulus of elasticity (Young’s modulus E), shear modulus of elasticity (shear modulus μ), bulk modulus of elasticity (bulk modulus k), and commonly used Lame coefficient, which is sensitive to hydrocarbons λ. Pre-stack elastic inversion is carried out for P-wave velocity, S-wave velocity, P-wave impedance, S-wave impedance, density, Poisson’s ratio and Young’s modulus.
4 Results
4.1 Reservoir sensitivity analysis
Through the intersection analysis of rock physical parameters, appropriate sensitive parameters and threshold values can be selected from a large number of elastic parameters (Zhang et al., 2009). Figure 8 shows the lithological sensitivity crossplot of the Jurassic sand-mudstone section of well LF35-1-1. The red sample points represent sandstone, and the blue sample points represent mudstone. From the crossplot of interval transit time (Figure 8A), P-wave velocity (Figure 8B), density, wave impedance (Figure 8C) and gamma rays (Figure 8D) of the Jurassic sandstone mudstone section, it can be seen that the sandstone velocity of this section is higher than that of mudstone, but there are still some parts interwoven together. The density of sandstone is slightly lower than that of mudstone, and most of them are scattered and interwoven. The wave impedance of sandstone is slightly higher than that of mudstone, and there are still some scattered points.
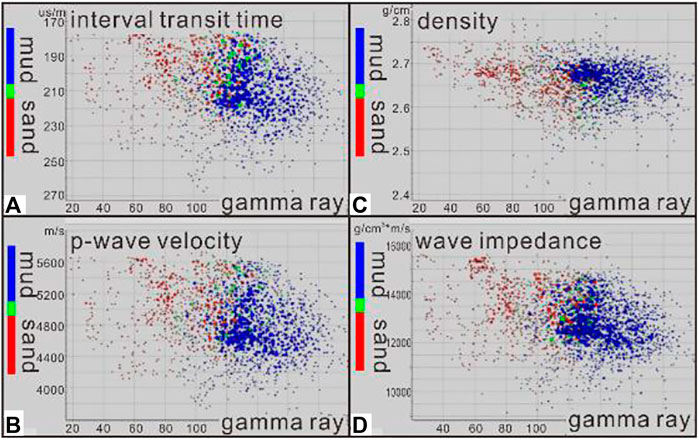
FIGURE 8. Crossplot of the lithology sensitivity of the Jurassic sandstone of well LF35-1-1.
According to the analyzing results of interval transit time (Figure 9A), P-wave velocity (Figure 9B), density (Figure 9C) and P-wave impedance (Figure 9D) in the sand-mudstone histogram (Figure 9), the main value of sandstone velocity in the Jurassic sand-mudstone section of well LF35-1-1 in the Chaoshan Depression is 5150 m/s, the main value of mudstone velocity is 4650 m/s, and the sandstone velocity is 500 m/s higher than that of mudstone (Figure 9C). The main value of sandstone density is 2.65 g/cm3, the main value of mudstone density is 2.67 g/cm3, and the density of sandstone is 0.02 g/cm3 lower than that of mudstone (Figure 9B). Due to the high velocity and low density of sandstone relative to mudstone, the wave impedance value is relatively close. The main value of sandstone wave impedance is 13,800 g/cm3 * m/s, and the main value of mudstone wave impedance is 12,500 g/cm3 * m/s (Figure 9D).
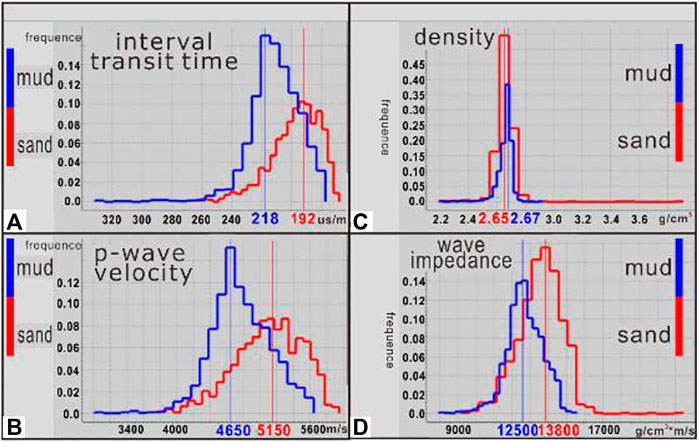
FIGURE 9. Histogram of the lithology sensitivity of the Jurassic sandstone of well LF35-1-1.
4.2 Hydrocarbon sensitivity analysis
Due to the lack of drilling data in the northern of SCS and similar basin filling patterns, the results of hydrocarbon sensitivity analysis of Mesozoic strata in the North Yellow Sea can be used for reference. Liu Jinping found that oil-bearing sandstones have obvious characteristics of low Poisson’s ratio and can be identified by Poisson’s ratio parameters. The threshold value of Poisson’s ratio is 0.21 (Liu et al., 2015).
4.3 Oil-gas reservoirs prediction
Figure 10 shows the line-cc’ linear density inversion profile (see Figure 1 for the location). Multiple sets of low-density anomalies appear at the “wedge” on the stack profile (Figure 10A). The low-density anomalies can reflect the shape of the fan body and the development of the sand body as a whole (Figure 10B). Combined with the analysis of sedimentary facies, this is a deep-water fan. However, other elastic parameters, such as P-wave impedance inversion (Figure 10C) and S-wave impedance inversion (Figure 10D), are similar to the stacking results and do not reflect the development status of sediments and reservoirs. Combined with petro-physical characteristics, pre-stack density inversion can better predict Mesozoic reservoirs.
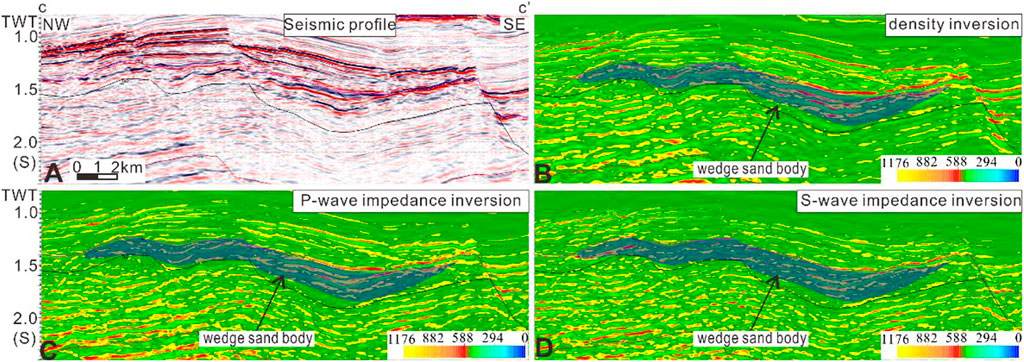
FIGURE 10. Inversion profile of line (c–c’).
Figure 11 is the time thickness map of the Upper Jurassic sandstone in the study area (one-way travel time) converted by the density inversion results (Figures 11A, B). The average velocity is 5000 m/s. The thickness of the sand body in the western part of the study area is more than 300 m, and the maximum thickness can reach approximately 400 m. The thickness of sandstone in the middle area is slightly thin, and the range is relatively small, approximately 150 m overall. It also corresponds well with the Root-Mean-Square (RMS) amplitude anomaly map.
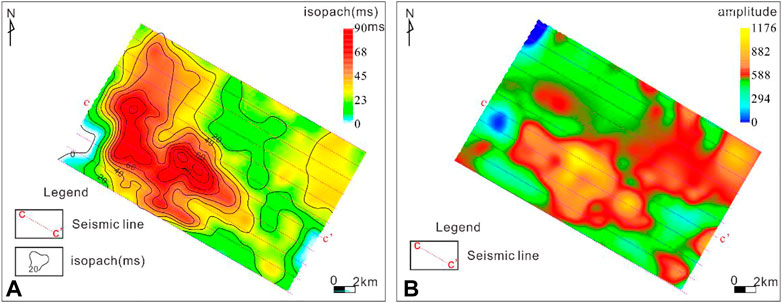
FIGURE 11. Isopach (A) and RMS amplitude map (B) of upper Jurassic sandstone.
Figure 12 shows the Poisson’s ratio inversion profile of line-cc’. It can be seen from the figure that there are multiple sets of low Poisson’s ratio anomalies on the Poisson’s ratio inversion profile and a “wedge” on the profile. The low Poisson’s ratio anomaly can reflect the hydrocarbon accumulation in the sand body as a whole and has a good matching relationship with the density inversion results (Figures 13A, B).
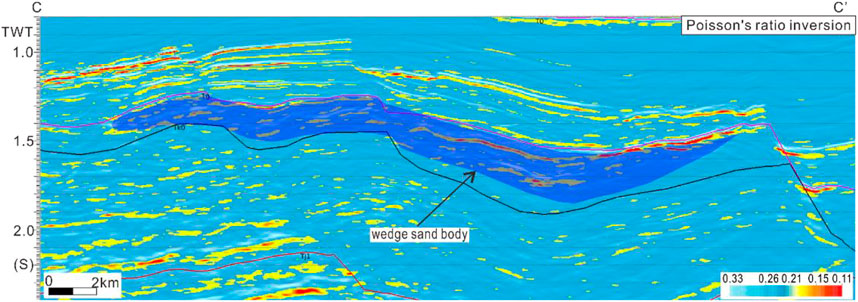
FIGURE 12. Poisson’s ratio inversion profile of line-(cc’).
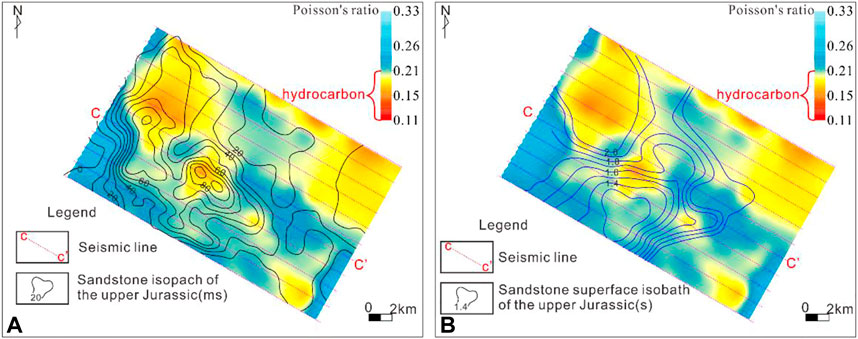
FIGURE 13. Hydrocarbon distribution map of the upper Jurassic.
Based on the understanding of petrophysical analysis and pre-stack Poisson’s ratio inversion quality analysis, the hydrocarbon distribution with low Poisson’s ratio anomalies in the Chaoshan depression is predicted.
The sandstone reservoir in this area is large, the total thickness exceeds 400 m, and the plane distribution of the sand body is stable. Hydrocarbon detection shows obvious hydrocarbon anomalies in this area. In terms of structure, this area is located at the local structural high point, and the overall structural conditions are favorable.
5 Discussion
The poor physical properties of the reservoir encountered during the drilling of well LF35-1-1 are related to the baking of igneous rock. At the same time, the post stack inversion also has multiple solutions, leading to the inconsistency between the reservoir prediction and the actual drilling. The DS-A structure is far away from the igneous rock activity area, and the reservoir physical property is relatively good. The high P-wave velocity of its reservoir should be related to the burial depth of Mesozoic. The pre-stack inversion uses gather data with high signal-to-noise ratio and strong stability, and its inversion results are highly reliable.
The Mesozoic sandstone in the North Yellow Sea Basin and the Chaoshan Depression both have similar geological background with deep burial and multiple uplifts, and have similar physical conditions. The Poisson’s ratio threshold value of 0.21of the North Yellow Sea Basin can be used as the threshold for determining oil-gas in the Chaoshan Depression.
Before new drilling, there is no new well data to verify the predicted results, but some of phenomenon of oil-gas leakage is indirect evidence, such as geochemical anomaly (Figure 14), mud volcanoes and hydrates (yan et al., 2022; zhong et al., 2022a). There are some differences between the prediction reliability of the two types of parameters adopted this time and the accuracy and reliability of the predecessors, this can be seen from AVO inversion near well LF35-1-1, the inversion results basing on elastic properties are highly reliable.
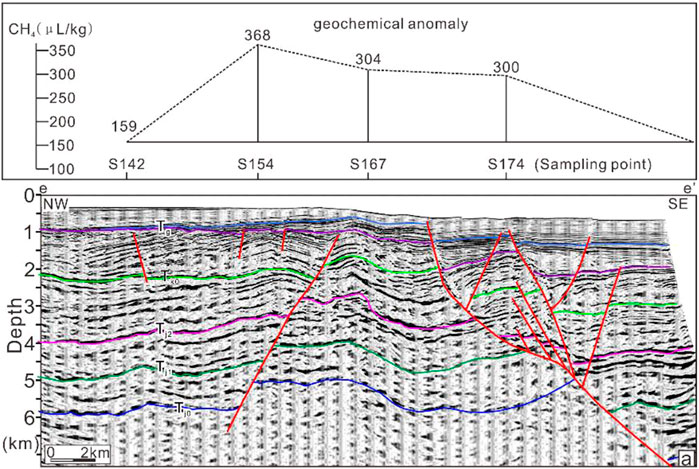
FIGURE 14. Geochemical anomaly along the survey line (e-e’) (see Figure 1 for location).
6 Conclusion
Reservoir sensitivity analysis and hydrocarbon sensitivity analysis results show that the Mesozoic sandstone reservoir in the Chaoshan depression has obvious low-density and low Poisson’s ratio characteristics, but the density and Poisson’s ratio of other lithology are relatively high, which can be used to identify sandstone reservoirs based on the density parameter and to predict the oil-gas potential based on Poisson’s ratio. Oil-gas reservoirs prediction results show the high possibility of hydrocarbon accumulation of DS-A structure. The sandstone reservoir in the area of DS-A structure is highly developed, with good lateral stability and relatively favorable structural conditions. The hydrocarbon detection Poisson’s ratio anomaly can respond better the hydrocarbon accumulation in the sand body as a whole and has a good matching relationship with the density inversion results. Pre-stack elastic wave impedance inversion is an effective method for the next step of oil-gas exploration in the Chaoshan Depression. The method of predicting oil and gas based on elastic parameter seismic inversion is effective. (Zhao et al., 2012).
1. The inversion of density, P-wave impedance, S-wave impedance, and Poisson’s ratio based on pre-stack seismic data is an effective method for predicting reservoirs and oil-gas in the Chaoshan Depression.
2. The DS-A structure is an oil-gas bearing structure with developed “wedge-shaped” sand bodies, with a maximum thickness of 400 m and an area of 130 km2.
Data availability statement
The original contributions presented in the study are included in the article/Supplementary Material, further inquiries can be directed to the corresponding authors.
Author contributions
Data processing: ZZ; seismic inverting: ZG, TG, and ZK; writing-original draft preparation: YH, ZJ, and YJ; writing—reviewing and editing: ZG, ZZ, TG, and YJ; all authors contributed to the article and approved the submitted version.
Funding
This research was funded by the National Natural Science Foundation of China (42076218, U1901217, and 91855101) and the Key Special Project for Introduced Talents Team of Southern Marine Science and Engineering Guangdong Laboratory (Guangzhou) (GML2019ZD0104 and GML2019ZD0201).
Acknowledgments
The reviewers are acknowledged for their constructive comments.
Conflict of interest
The authors declare that the research was conducted in the absence of any commercial or financial relationships that could be construed as a potential conflict of interest.
Publisher’s note
All claims expressed in this article are solely those of the authors and do not necessarily represent those of their affiliated organizations, or those of the publisher, the editors and the reviewers. Any product that may be evaluated in this article, or claim that may be made by its manufacturer, is not guaranteed or endorsed by the publisher.
References
AkiRichards, P. G. (1980). Quantitative seismology. San Francisco, CA, USA: W. H. Freeman, 158–164. https://onlinelibrary.wiley.com/doi/epdf/10.1002/gj.3350160110.
Duan, J., and Mi, H. (2012). Seismic facies and sedimentary facies study of Mesozoic in Chaoshan sag. Resour. Industries 14 (1), 100–105. (in Chinese with English abstract). http://www.resourcesindustries.net.cn/EN/abstract/abstract2169.shtml.
Fatti, J. L., Smith, G. C., Vail, P. J., Strauss, P. J., and Levitt, P. R. (1994). Detection of gas in sandstone reservoirs using AVO analysis: A 3-D seismic case history using the geostack technique. Geophysics 59 (59), 1362–1376. https://library.seg.org/doi/10.1190/1.1443695. doi:10.1190/1.1443695
Gardner, G. H. F., Gardner, L. W., and Gregory, A. R. (1974). Formation velocity and density; the diagnostic basics for stratigraphic traps. Geophysics 39 (6), 770–780. doi:10.1190/1.1440465
Gray, D. (1999). PS converted-wave AVO. Seg. Tech. Program Expand. Abstr. 22 (1), 165–168. https://www.semanticscholar.org/paper/P%E2%80%90S-converted%E2%80%90wave-AVO-Gray/ab77724a173daa2f224eee71aeb4b55a9fcb6970.
Guo, H., Wang, Z., Wang, B., Zhang, Y., Meng, H., and Sui, H. (2022). Molecular dynamics simulations of oil recovery from dolomite slit nanopores enhanced by CO2 and N2 injection. Adv. Geo-Energy Res. 6 (4), 306–313. doi:10.46690/ager.2022.04.05
Hamed, Z., El-Mowafy, M., IbrahimDallas, B. D., and Dunlap, D. B. (2018). Unlocking gas reserves in bypassed stratigraphic traps in a deepwater brownfield using prestack seismic inversion: A case study from offshore nile delta, Egypt. Lead. Edge 37, 502–509. doi:10.1190/tle37070502.1
Han, X., Yan, J., Zhu, D., Yao, J., and Wang, H. (2018). Application of pre-stack elastic parameter inversion in the prediction of Longmaxi formation shale's brittleness. Comput. Tech. Geophys. Geochem. Explor. 40 (3), 337–344. (in Chinese with English abstract). https://www.researchgate.net/publication/327569563_Application_of_pre-stack_elastic_parameter_inversion_in_the_prediction_of_Longmaxi_formation_shale's_brittleness.
Hao, H., Lin, H., Yang, M., Xie, H., and Chen, J. (2001). The mesozoic in chaoshan depression: A new domain of petroleum exploration. China Offshore Oil Gas 15 (3), 157–163. (in Chinese with English abstract). https://en.cnki.com.cn/Article_en/CJFDTOTAL-ZHSD200103000.htm.
Hao, H., Shi, H., Zhang, X., Wang, T., and Tang, S. (2009). Mesozoic sediments and their petroleum geology conditions in chaoshan sag: A discussion based on drilling results from the exploratory well LF35-1-1. China Offshore Oil Gas 21 (3), 151–156. (in Chinese with English abstract). https://en.cnki.com.cn/Article_en/CJFDTOTAL-ZHSD200903001.htm.
Hao, H., Wang, R., Zhang, X., Xie, H., and Chen, Z. (2004). Mesozoic marine sediment identification and distribution in the eastern Pearl River Mouth Basin. China Offshore Oil Gas 16 (2), 84–88. (in Chinese with English abstract). https://www.semanticscholar.org/paper/Mesozoic-marine-sediment-identification-and-in-the-Petroleum/59300365ddad9383f3ac62aa620adfe674c94d52.
Heidari, Z., and Carlos, T. (2013). Inversion-based method for estimating total organic carbon and porosity and for diagnosing mineral constituents from multiple well logs in shale-gas formations. Interpretation 1 (1), T113–T123. doi:10.1190/INT-2013-0014.1
He, J., Xia, B., Wang, Z., and Sun, D. (2006). Petroleum geologic characteristics and exploration base of taixinan basin in eastern area of continental shelf in northern of the South China Sea. Nat. Gas. Geosci. 17 (3), 345–350. (in Chinese with English abstract). https://www.semanticscholar.org/paper/PETROLEUM-GEOLOGIC-CHARACTERISTICS-AND-EXPLORATION-Jia-xiong/c1b68568f6cdd9a8c19c1eded725c54b84ed2597.
Hu, T., Wu, G., Xu, Z., Pang, X., Liu, Y., and Yu, S. (2022). Potential resources of conventional, tight, and shale oil and gas from Paleogene Wenchang Formation source rocks in the Huizhou Depression. Adv. Geo-Energy Res. 6 (5), 402–414. doi:10.46690/ager.2022.05.05
Ji, Z., Zhao, H., Wang, H., and Li, C. (2014). Mesozoic petroleum system in chaoshan depression. Petroleum Geol. Eng. 28 (3)–15. (in Chinese with English abstract). http://www.sydzygc.cn/article/id/f8de6c5b-37a5-4db6-8eda-58a9c202bf29 9.
Kelly, M. C., and Skidmore, C. (2001). Non-linear AVO equations and their use in 3-parameter inversions. Seg. Tech. Program Expand. Abstr. 160 (1), 255–256. https://library.seg.org/doi/abs/10.1190/1.1816584.
Liu, J., Wang, L., Jian, X., Wang, X., Zhao, R., and Cheng, G. (2015). Application of pre-stack synchronous inversion technology in the mesozoic reservoir prediction in the Yellow Sea Basin. Mar. Geol. Quat. Geol. 35 (4), 141–148. (in Chinese with English abstract). http://en.cgsjournals.com/article/doi/10.16562/j.cnki.0256-1492.2015.04.015.
Ojha, M., and Ghosh, R. (2021). Assessment of gas hydrate using prestack seismic inversion in the Mahanadi Basin, offshore eastern India. Interpretation 9, SD15–SD26. doi:10.1190/INT-2020-0139.1
Pan, G., Zhou, J., Han, G., Zhu, P., and Liu, F. (2016). Seismic prediction method of "sweet" reservoir in middle-deep zone: A case study from wenchang A sag. West. Pearl River Mouth Basin Lithol. Reserv. 28 (1), 94–100. (in Chinese with English abstract). http://www.yxyqc.net/EN/10.3969/j.issn.1673-8926.2016.01.012.
Pedro, A., William, M., Juan, B., Marin, W., Berrizbeitia, J., Newton, P., et al. (2018). Seismic reservoir characterization of a class-1 amplitude variation with offset turbiditic system located offshore Cote d’Ivoire, West Africa. Interpretation 6 (2), SD115–SD128. doi:10.1190/INT-2017-0163.1
Sena, A., Castillo, G., Chesser, K., Chesser, K., Voisey, S., Estrada, J., et al. (2011). Seismic reservoir characterization in resource shale plays: Stress analysis and sweet spot discrimination. Lead. Edge 30, 758–764. doi:10.1190/1.3609090
Shao, L., You, H., Hao, H., Wu, G., Qiao, P., and Lei, Y. (2007). Petrology and depositional environments of mesozoic strata in the northeastern South China sea. Geol. Rev. 53 (2), 164–169. https://en.cnki.com.cn/Article_en/CJFDTOTAL-DZLP200702004.htm.
Shuey, R. T. (1985). A simplification of the Zoeppritz equations. Geophysics 50 (4), 609–614. https://library.seg.org/doi/10.1190/1.1441936#:∼:text=%EE%80%80A%20simplification%20of%20the%20Zoeppritz%20equations%EE%80%81.%20The%20compressional,incidence%20%28%CE%B8%20%3D%200%29%2C%20the%20second%20term%20. doi:10.1190/1.1441936
Smith, G. C., and Gidlow, P. M. (1987). Weighted stacking for rock property estimation and detection of gas. Geophys. Prospect. 35 (9), 993–1014. doi:10.1111/j.1365-2478.1987.tb00856.x
Son, Phan, Mrinal, K. S., and Sen, M. K. (2018). Hopfield networks for high-resolution prestack seismic inversion. Seg. Tech. Program Expand. Abstr., 526–530. doi:10.1190/segam2018-2996244.1
Subhashis, M. (2001). AVO and elastic impedance. Lead. Edge 20 (10), 1094–1104. doi:10.1190/1.1487239
Ursin, B., and Tjäland, E. (1996). The information content of the elastic reflection matrix. Geophys. J. Int. 125 (1), 214–228. https://library.seg.org/doi/10.1190/1.1822220. doi:10.1111/j.1365-246x.1996.tb06547.x
Wang, L., Cheng, R., Li, F., Zhang, L., and Xu, Z. (2009). The mesozoic sedimentary sequences. Correlation and geological significance for petroleum of the North margin of South China sea. J. Jilin Univ. (Earth Sci. Ed. 39 (2), 175–182. (in Chinese with English abstract). https://www.semanticscholar.org/paper/The-Mesozoic-Sedimentary-Sequences%2CCorrelation-and-Zhong-jie/0e9ac696f72559bf0650c9050efc2d1dcb145721.
Wang, P., Xia, K., and Huang, C. (2000). The mesozoic marine sediment distribution and geology-geophysics characteristic at the North-eastern of South China continent. J. Trop. Oceanogr. 19 (4), 28–35. (in Chinese with English abstract). https://kns.cnki.net/kcms/detail/detail.aspx?dbcode=CJFD&dbname=CJFD2000&filename=RDHY200004004&uniplatform=NZKPT&v=SSOOogLH9I4fPQOJAHkYL7YYdSD0XwrleHteIOcywdqBscyno6lCU8nVfB-vZ_PQ.
Wu, G., Wang, R., Hao, H., and Shao, L. (2007). Microfossil evidence for development of marine Mesozoic in the north of South China Sea. Mar. Geol. Quat. Geol. 27 (1), 79–85. (in Chinese with English abstract). http://jhydz.com.cn/en/article/id/080d7e39-a946-49be-b226-f2c5953be43b.
Yan, Y., Liao, J., Yu, J., Chen, C., Zhong, G., Wang, Y., et al. (2022). Velocity structure revealing a likely mud volcano off the Dongsha Island, the northern South China Sea. Energies 15, 195. doi:10.3390/en15010195
Yang, S., Tong, Z., He, Q., and Hao J, (2008). Mesozoic hydrocarbon generation history and igneous intrusion impacts in chaoshan depression. South China sea: A case of LF35-1-1 well. China Offshore Oil Gas 20 (3), 152–156. (in Chinese with English abstract). https://en.cnki.com.cn/Article_en/CJFDTOTAL-ZHSD200803002.htm.
Yang, Z., Zou, C., Gu, Z., Yang, F., Li, J., and Wang, X. (2022). Geological characteristics and main challenges of onshore deep oil and gas development in China. Adv. Geo-Energy Res. 6 (3), 264–266. doi:10.46690/ager.2022.03.09
Yao, B., Zhang, L., Wei, Z., Yi, H., Lin, Z., Wang, L., et al. (2011). The mesozoic tectonic characteristics and sediment basins in the eastern margin of South China continent. Mar. Geol. Quat. Geol. 31 (3), 47–60. (in Chinese with English abstract). http://jhydz.com.cn/en/article/doi/10.3724/SP.J.1140.2011.03047. doi:10.3724/sp.j.1140.2011.03047
Yin, X., Cui, W., Zong, Z., and Liu, X. (2014). Petrophysical property inversion of reservoirs based on elastic impedance. Chin. J. Geophys. 57 (12), 4132–4140. (in Chinese with English abstract). http://en.dzkx.org/article/doi/10.6038/cjg20141224.
Zhang, J., Sun, Z., and Zhang, S. (2014). Analysis of mesozoic tectonic deformation in the chaoshan depression of pearl river mouth basin. J. Trop. Oceanogr. 33 (5), 41–49. (in Chinese with English abstract). http://www.jto.ac.cn/EN/abstract/abstract578.shtml.
Zhang, D. (2009). Principles and practice of seismic data oil and gas display research. Beijing, China, Petroleum Industry Press.
Zhang, L., Geng, A., Wang, L., Liao, Y., Xu, G., Wei, Z., et al. (2012). Assessment of mesozoic source rocks at the margin of South China continent. Mar. Geol. Quat. Geol. 32 (1), 99–108. (in Chinese with English abstract). http://jhydz.com.cn/en/article/doi/10.3724/SP.J.1140.2012.01099. doi:10.3724/sp.j.1140.2012.01099
Zhang, Q., Zhang, H., Jiang, X., Xu, Y., and Zhou, H. (2017). Application of elastic parameters inversion and attribute fusion technology in the "sweet spot" prediction. Nat Gas Geosci. 28 (4), 582(in Chinese with English abstract)http://wwwnggsaccn/EN/abstract/abstract4347shtml.
Zhao, M., Liu, H., and Wu, Z. (2012). Mesozoic stratigraphic and structural features and collisional orogeny between the northern and southern continental margins of South China sea. Prog. Geophys. 27 (4), 1454–1464. (in Chinese with English abstract). https://en.cnki.com.cn/Article_en/CJFDTOTAL-DQWJ201204021.htm.
Zhao, Z., Zhong, G., Sun, M., FengCTu, G., Yi, H., and Sun, M. (2023). Hydrocarbon accumulation analysis based on quasi-3D seismic data in the turbulent area of the northern South China sea. J. Mar. Sci. Eng. 11, 338. doi:10.3390/jmse11020338
Zhong, G., Feng, C., Wang, Y., Chen, S., Sun, M., Yi, H., et al. (2022a). Fault bounded models of oil–gas and gas–hydrate accumulation in the chaoshan depression, the South China sea. Front. Earth Sci. 10, 965898. doi:10.3389/feart.2022.965898
Zhong, G., Su, P., Feng, C., Chen, S., Sun, M., Yi, H., et al. (2022b). Mesozoic hydrocarbon accumulation model in the northern South China sea. IOP Conf. Ser. Earth Environ. Sci. 1087. doi:10.1088/1755-1315/1087/1/012053
Zhong, G., Wu, S., and Feng, C. (2011). Sedimentary model of mesozoic in the northern South China sea. J. Trop. Oceanogr. 30 (1), 43–48. (in Chinese with English abstract). https://en.cnki.com.cn/Article_en/CJFDTOTAL-RDHY201101006.htm.
Zhong, G., Yi, H., Lin, Z., Jin, H., and Liu, Z. (2007). Characteristic of source rocks and mesozoic in continental slope area of northeastern the South China Sea and east Guangdong of China. XINJIANG Pet. Geol. 28 (6), 676–680. (in Chinese with English abstract). https://www.zgxjpg.com/EN/abstract/abstract2219.shtml.
Zhou, D. (2002). Mesozoic strata and sedimentary environment in SW Taiwan basin of ne South China Sea and peikang high of Western Taiwan. J. Trop. Oceanogr. 21 (2), 50–57. (in Chinese with English abstract). https://www.semanticscholar.org/paper/MESOZOIC-STRATA-AND-SEDIMENTARY-ENVIRONMENTIN-SW-OF-Di/4664810c06970041a510369dd5e303215fdab5be.
Zoeppritz, K., and Erdbebenwellen, V. (1919). On the reflection and propagation of seismic waves. Gottinger Nachrichten, 1. 66–84.
Keywords: south China sea, mesozoic, seismic inversion, elastic properties, oil-bearing sand prediction
Citation: Guangjian Z, Zhongquan Z, Guanghong T, Kangshou Z, Jing Z, Hai Y, Changmao F and Junhui Y (2023) Oil and gas prediction basing on seismic inversion of elastic properties in Chaoshan depression, south China sea. Front. Earth Sci. 11:1194663. doi: 10.3389/feart.2023.1194663
Received: 27 March 2023; Accepted: 19 May 2023;
Published: 30 May 2023.
Edited by:
Lele Liu, Qingdao Institute of Marine Geology (QIMG), ChinaReviewed by:
Jinan Guan, Chinese Academy of Sciences (CAS), ChinaTao Hu, China University of Petroleum, China
Jing Sun, Qingdao Institute of Marine Geology (QIMG), China
Jiliang Wang, Chinese Academy of Sciences (CAS), China
Copyright © 2023 Guangjian, Zhongquan, Guanghong, Kangshou, Jing, Hai, Changmao and Junhui. This is an open-access article distributed under the terms of the Creative Commons Attribution License (CC BY). The use, distribution or reproduction in other forums is permitted, provided the original author(s) and the copyright owner(s) are credited and that the original publication in this journal is cited, in accordance with accepted academic practice. No use, distribution or reproduction is permitted which does not comply with these terms.
*Correspondence: Zhao Zhongquan, enpxaGVsbG9AMTYzLmNvbQ==; Tu Guanghong, VGd1YW5naG9uZ0BtYWlsLnNncy5nb3YuY24=