 Ariel T. Thomas
 Aaron Micallef
 Shuangmin Duan2
 Zhihui Zou
- 1Marine Geology and Seafloor Surveying, Department of Geosciences, University of Malta, Msida, Malta
- 2Key Lab of Submarine Geosciences and Prospecting Techniques, College of Marine Geosciences, Ocean University of China, Qingdao, China
Offshore freshened groundwater (OFG) has been encountered in continental margins around the world and identified as a potential unconventional water resource. In China, coastal areas and islands face limited freshwater resources. The East China Sea, specifically the region north of Shengsi islands, may contain an OFG system hosted in buried paleochannels associated with the ancient Yangtze river. To assess the OFG potential, characteristics, and controls in this region, we employed an integrated modeling approach. We constructed a 2D geological model of Quaternary sediments based on data from two well sites. By considering sea-level fluctuations over the past 200,000 years, we conducted a paleo-reconstruction of groundwater flow and solute transport conditions on the 2D transect. We compared the simulated present-day distribution of OFG in the model with borehole observations. Our findings indicate that the region was mostly sub-aerially exposed during the simulated period, allowing for potential meteoric recharge. Numerical results demonstrate a high likelihood of a laterally extensive OFG system existing today. The mechanism responsible for its formation appears to be meteoric recharge and offshore directed groundwater flow caused by increased hydraulic gradients during sea-level lowstand. The model suggests that the OFG system forms an oceanward dipping wedge, with the top occurring approximately 50–100 m below the seafloor. Freshwater is likely present down to the basement at around 250 m. The geometry and volume of the OFG system are strongly influenced by the shelf stratigraphy. We estimate the volume of freshwater in the region to range from 0.5 to 1.6 km3 km-1, indicating a viable potential freshwater resource for the Shengsi region and coastal city of Shanghai. To gain further insights, we recommend conducting additional investigations using geophysical techniques.
1 Introduction
Offshore freshened groundwater (OFG) refers to groundwater stored in pores of sediments or fractures of rocks in the sub-seafloor, which have a total dissolved solid concentration below that of seawater (Micallef et al., 2021). These systems have been encountered in continental margins with various geological settings around the globe (Post et al., 2013). Siliciclastic passive margins are the most common hosts of OFG, and they typically occur at 100–200 m below the seafloor (Micallef et al., 2021). Based on the current understanding of the dynamics of OFG systems, there are two predominant ways in which they are emplaced. OFG systems can occur as near-shore extensions of terrestrial groundwater aquifers, which are actively recharged by terrestrial groundwater due to the presence of an overlying confining layer extending offshore (Kooi and Groen, 2001; Bakker, 2006), or recharged via complex preferential flow pathways resulting from geological heterogeneity (Michael et al., 2016). Other OFG sites have been attributed to meteoric recharge during former periods of sea-level lowstand, when the continental shelf was sub-aerially exposed (Cohen et al., 2010; Thomas et al., 2019; Micallef et al., 2020). Such systems tend to extend further offshore and their connectivity to onshore groundwater is unclear in most cases (Post et al., 2013). Geological features have been shown to strongly influence the shape and distribution of freshwater reservoirs on the continental shelf (Michael et al., 2016). Stratigraphic features typically found in deltaic deposits, such as clinoforms, are known to correlate with the distribution of OFG reservoirs on the New Jersey shelf (Lofi et al., 2013; Gustafson et al., 2019). Buried paleochannels form high-permeability preferential pathways, which have coincided with OFG systems extending far offshore on continental shelves (Krantz et al., 2004; Mulligan et al., 2007; Micallef et al., 2020). Additional mechanisms that can lead to the development of OFG include: sub-glacial and pro-glacial injection of freshwater attributed to glacial lakes, permeability alterations by permafrost and sub-glacial drainage networks (Mulligan and Uchupi, 2003; DeFoor et al., 2011; Person et al., 2012; Siegel et al., 2014); diagenesis in deeply buried marine sediments (Hensen et al., 2004; Mora, 2005; Ijiri et al., 2018), and decomposition of gas hydrates resulting from temperature or pressure variations (Hesse, 2003; Lin et al., 2010).
OFG systems have mostly been sampled incidentally during scientific and industry drilling campaigns designed to study other Earth and climatic processes, e.g., The aquifer system discovered offshore New Jersey (Hathaway et al., 1979; Mountain et al., 2010). As a result, characterization of OFG system is often a challenge due to data scarcity, and many open questions remain about the origins, dimensions, distribution and flow characteristics (Micallef et al., 2021). Stable isotope analysis of pore fluid can provide information on the relative age and origins of porewater in OFG systems (van Geldern et al., 2013), however such studies are very rare. Geophysical methods such as seismic reflections and electromagnetic surveys are well suited for remotely imaging continental shelf stratigraphy and the presence of relatively fresh porewater. Seismic sequence stratigraphy has been widely used to delineate reservoir geometries and derive facies distributions in studies of OFG systems (Bertoni et al., 2020; Thomas et al., 2019; Micallef et al., 2020). Freshwater stored in these reservoirs offshore is less conductive than the surrounding saline porewater, therefore inversion of EM data can reveal resistivity anomalies which provide information on the distribution and geometry of freshwater (Evans and Lizarralde, 2011; Gustafson et al., 2019; Attias et al., 2020; Micallef et al., 2020). However, such field data are difficult to acquire and only available from a few sites globally.
In comparison to the methods described above, numerical forward modelling provides a cost-effective tool to investigate the characteristics of OFG systems such as volumes in place, their evolution with time and response to external drivers such as sea-level change. Previous studies on 2D shelf transects (Person et al., 2003; Thomas et al., 2019; Micallef et al., 2020) and 3D shelf models (Cohen et al., 2010; Biase et al., 2023) have applied numerical models to investigate the evolution of OFG systems over geological time scales. Such transient analyses cannot be achieved with traditional imaging methods. OFG systems involve coupled processes of groundwater flow and solute transport that occur over a wide range of spatial and temporal scales (Bratton, 2010). It is known that these systems respond very slowly to changes in the hydraulic forces, and therefore are often not in equilibrium with present-day sea-level conditions. An early numerical study on the effects of eustatic sea-level changes on an OFG system in the New Jersey shelf showed that the position of the fresh–saltwater interface is not in equilibrium with the present-day sea-level (Meisler et al., 1984). This study used a steady-state sharp-interface approach in which the interface between fresh and salt water is approximated using a closed boundary condition. Since then, advances in computational capacity have allowed for more sophisticated modelling of OFG systems, which account for variable density flow (Kooi and Groen, 2001; Kooi et al., 2000) and the influence of geological heterogeneity (Michael et al., 2016). Numerical modelling studies of OFG have also taken into consideration porosity loss with depth due to compaction (Athy, 1930), as well as anisotropy in hydraulic conductivity due to sediment layering (Houben et al., 2018). Numerical models provide valuable insights and can be validated by incorporating borehole observations of pore-fluid salinity as demonstrated in previous studies (Thomas et al., 2019; Micallef et al., 2020).
OFG has been identified as a potential unconventional water resource and it may be essential to ensuring water security in water stressed regions of the world (UN-Water, 2020). To date, there have been a limited number of studies on OFG systems in the Asia-Pacific Ocean region including Japan (Marui, 2003) and Hong Kong (Jiao et al., 2015). In China, approximately 60% of the largest cities are facing water shortages (He et al., 2020). Freshwater resources are very limited in the developed coastal areas and islands offshore China (Zhen and Jie, 2008). Northern China is experiencing severe water stress, which is exacerbated by changing climate, rapid urbanization and extreme population density (Varis and Vakkilainen, 2001). Many provinces in China are reported to have severely low water resources (i.e., below 500 m3/capita), including major cities such as Beijing–206 m3/capita, Shanghai–198 m3/capita (Bao and Fang, 2012). Some preliminary studies have been conducted to investigate the potential of OFG resources as part of the solution to alleviate water stress in the region. Based on a numerical study of core samples from five offshore boreholes in Hong Kong, Jiao et al. (2015) concluded that relatively fresh–brackish water is stored in aquifers below the seabed that may be utilized after minimal treatment. In the region of the East China Sea (ECS) offshore Shanghai, north of the Shengsi islands, paleochannels associated with the ancient Yangtze River have been hypothesized to contain freshwater aquifers below the present-day seafloor (Wang, 2005). Based on analysis of core data and water samples from boreholes, Zhen and Jie (2008) reported that multiple freshwater-bearing sand layers were present in Quaternary sediments north of Shengsi islands. Zhang et al. (2011) presented further analysis including pumping test results from the aquifer intervals. The study concluded that offshore freshened groundwater would most likely occur in the deeper Early Pleistocene sediments, with brackish water in shallower mid–late Pleistocene and Holocene units.
Previous studies of this region have focused on the stratigraphic structure, sedimentary environment and spatial distribution of the Quaternary sediments. However, to our knowledge, no study has attempted to incorporate this information into a numerical characterization of offshore freshened groundwater distribution in this region of the shelf. As a result, the distribution of the freshwater system away from the Shengsi well locations is not known. Features of the OFG system such as the thickness of potential reservoirs, geometrical characteristics of the system and the volumes of freshwater in place are not well constrained. In this paper, we characterize the freshened groundwater system occurring offshore Shengsi islands in terms of depth, offshore extent and geometry, and identify the role played by stratigraphy on OFG occurrence. We do so by developing a hydrogeological model and performing numerical groundwater simulations considering sea-level fluctuations over the past 200,000 a. The implications for water resource potential are discussed.
1.1 Regional setting
The Shengsi islands make up the largest Chinese archipelago and are located in the East China Sea (ECS), southeast of the modern Yangtze River mouth. The ECS is situated between 22° and 33° N latitude. It is bounded to the west by the Eurasian continent and to the East by the Okinawa Trough. The broad continental shelf has an area of approximately
The stratigraphy on the ECS shelf is due to the combined influence of changes in sediment discharge, sea-level and oceanic currents during the last glacial cycle (Yang et al., 2014). The Quaternary-age sediments on the shelf of the East China Sea have been characterized in previous studies based on drilling logs and seismic data; they comprise of predominantly siliciclastic sediments with some carbonates (Liu et al., 2000; Li et al., 2005). Muddy sediments dominate the most proximal region, whereas sandy sediments form ridges and sand sheets in the middle-outer shelf (Liu et al., 2000; Wang et al., 2013). The sedimentary record shows evidence of periodic shifts between land and marine depositional environments as a result of sea-level fluctuations related to Pleistocene glacial periods (Zhang et al., 2011). Transgressive and regressive cycles during the Quaternary drove the sedimentary cycles observed in the modern delta plain. The Yangtze river is thought to be the dominant sediment source on the ECS shelf during the last glaciation and early Holocene (Dou et al., 2010). Sediments are delivered from the northwest and reworking primarily occurs by tidal forces (Yang et al., 2014). Therefore, the Yangtze river delta has been characterized as a classical tide-dominated delta (Chen et al., 1988; Goodbred and Saito, 2012).
Buried tidal sand ridges and paleochannels are also associated with the proto-river system during the period of relative sea-level rise from the lowstand of the Last Glacial Maximum (LGM) to the mid-Holocene highstand. This transgressive period resulted in considerable re-working of onshore sandbars into tidal sand ridges and sheets (Yang et al., 2014). The approximate location of buried paleo-channels associated with the ancient Yangtze river was first discussed by Zhijian (1989). Several other studies have focused on describing the sedimentary environment and estimating paleo-channel distribution (Xiao et al., 2004; Zhen and Jie, 2008; Zhang et al., 2011; Liu et al., 2014). Li et al. (2005) proposed that six main distributary systems of the ancient Changjiang may be buried beneath the present-day continental shelf. A later study by Wang et al. (2013) demonstrated that the ancient Yangtze deposited river channel facies in incised valleys on the middle—outer shelf, and developed estuarine—tidal flat facies.
In 1993, the Shanghai Marine Geological Survey conducted a high-resolution seismic survey in the northwestern part of Shengsi Island, which confirmed the presence of the Early Pleistocene paleo-channels and concluded that they were oriented in an East—West direction. In addition to geological characterization, preliminary studies were conducted on the potential for freshened groundwater reserves in shelf sediments north of the Zhoushan islands. The Shanghai Marine Geological Survey completed hydrogeological exploration wells Shengsi-1 and Shengsi-2, in 1993, and 2007, respectively. These wells were drilled in shallow waters to the north of the Shengsi islands, as shown in Figure 1. The wells revealed the average thickness of the unconsolidated Quaternary sediments to be between 200–250 m in that region of the shelf. The basement encountered at approximated 201 m in Shengsi-2 and 250 m in Shengsi-1. Based on analysis of core data and water samples, Zhen and Jie (2008) reported that multiple freshwater-bearing sand layers were present in both wells. Zhang et al. (2011) presented further analysis of data from both wells included pumping test results from the aquifer intervals. The study concluded that offshore freshened groundwater would most likely occur in the deeper Early Pleistocene sediments, with brackish water in shallower mid—late Pleistocene and Holocene units.
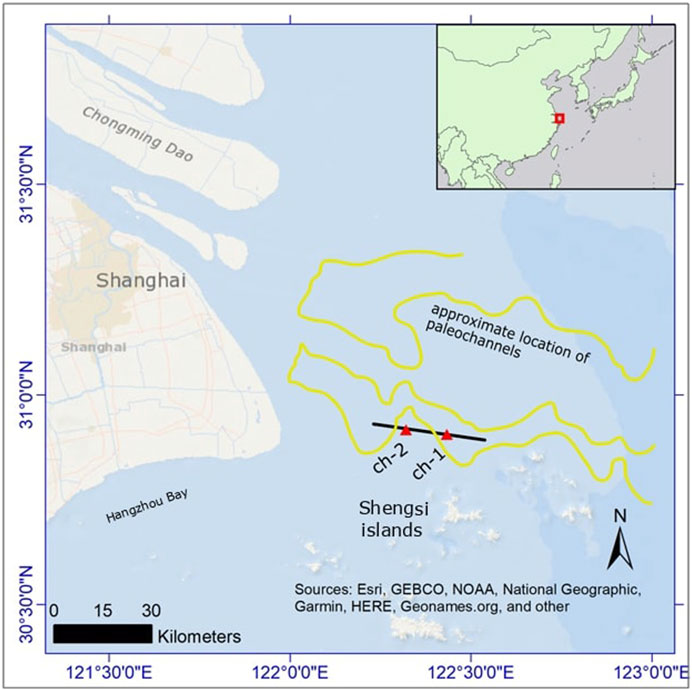
FIGURE 1. Study area map showing location of 2D model section (black line), well sites ch-1 and ch-2 (red triangles), and the approximate location of paleochannels (yellow lines, modified from (Zhang Z. et al., 2018)).
2 Data
The Shanghai Marine Geological Survey completed the Shengsi-1 well in 1993, in a water depth of 13.5 m. The well penetrates the Upper Pleistocene sediments. Pumping tests were carried out to determine flow properties of the sediments. Shengsi-2 was completed in 2007, 12 km west of Shengsi-1 and 20 km North of the Shengsi island. The position of both wells is shown in Figure 1. Previous analysis of the wells provide information about the types of lithologies encountered in each layer of the sedimentary stratigraphy from the seafloor to the basement including grain size and ages based on paleontological markers (Zhen and Jie, 2008). Data on the porosity ranges of aquifer units at well site Shengsi 1 were reported by (Wang, 2005). The present-day seafloor depth was extracted along the model profile shown in Figure 1 from gridded bathymetric data available from GEBCO (2022).
3 Methodology
We utilized lithological descriptions from two wells to build a 2D geological cross-section north of the Shengsi islands consisting of four lithological classes: gravel, sand, silt and shale. The model is discretized on a finite difference grid and hydraulic properties are assigned based on a combination of the well data and empirical models. Numerical simulations of groundwater and solute transport were run for a period of 200,000 a, reconstructing groundwater conditions on the shelf transect. This period was chosen as it includes the past two glacial-interglacial cycles. Modelling the evolution of OFG systems during successive glacial cycles is crucial to understanding conditions at present-day (Micallef et al., 2020).
3.1 Geological model
The first step in the workflow was to identify the lithological composition of the Quaternary sediments in the study region, as these strongly influence the flow properties of the subsurface. These were defined based on drilling log observations reported by Zhen and Jie (2008). We considered four lithologies listed here from largest to smallest in terms of grain size: gravel, sand, silt and clay. The legacy data pre-dates digital wireline logging in the region. Thus, the data were digitized to produce a lithology summary of the two control wells.
A 2D cross-section was defined by connecting a straight line between both wells, which are approximately 12 km apart. This was used to make a geological interpretation of the lithological units to form the structure of the model. This qualitative approach was adopted due to the limited availability of seismic data to identify subsurface structures. The interpretation was extended 8 km beyond each well location, resulting in a total length of 28 km in a West—East direction. This model was limited to 2D due to unavailability of data to constrain the model in North—South direction. In the interpretation of the borehole drilling log observations, each interval described with a specific lithology was considered as a lithostratigraphic unit (Mathur, 2008). The units were connected across the wells based on their shared lithographic properties in a simplified, layered geological model. This resulted in the definition of 15 lithostratigraphic units, overlying the basement. These interfaces were digitized and used as input data to generate a 2D model with a finite difference grid using GemPy (Varga et al., 2019). The depth of the model is 300 m based on the location of the basement in the well data. The model shown was discretized at 50 m horizontally, 5 m vertically and has a total of 33,600 active cells.
3.2 Groundwater model
The groundwater model was parametrized using the iMOD-python library (Deltares, 2022). This was used to define matrix and fluid properties in the model domain, initial and boundary conditions, and to control time stepping for the numerical solver. The simulations were performed using a parallelized version of SEAWAT (Langevin et al., 2008) developed by Verkaik et al. (2021). SEAWAT, initially developed by the US Geological Survey, is the most widely used algorithm for the modelling of 3D variable density groundwater flow and solute transport. SEAWAT has been verified using the Henry salt water intrusion problem (Henry, 1964), a well-known benchmark for variable-density groundwater and solute transport algorithms. A detailed discussion on the partial differential equations solved by SEAWAT is presented in Verkaik et al. (2021).
The model was parametrized with flow properties (porosity and hydraulic conductivity) based on the expected range for the unconsolidated sediments (Freeze and Cherry, 1979), as well as data from a previous field study (Wang, 2005). The study presented ranges of porosity values for five aquifer units that were tested, they ranged between 0.20 and 0.48 for the aquifer intervals. These represented the only in-situ measured data values available to our knowledge at the time of this study. No porosity data was reported for the confining units. Therefore, we relied on empirical models to assign hydraulic conductivity and a porosity to our model domain.
3.2.1 Porosity
An initial porosity value was assigned to each of the four lithological classes in the model domain as follows: gravel–30%, sand–45%, silt–57% and shale–69%. The porosity values for gravel and sand were assigned based on values reported in Wang (2005) based on aquifer tests at the Shengsi-1 well site. The field study only reported values in the aquifer units, therefore values within the typical range for silt and shale were assigned to our model. Shales tends to have a high initial porosity at deposition ranging between 50% and 70% (Potter et al., 2005), with coarse-grained sands and gravel in a relatively lower range between 30% and 50% (Freeze and Cherry, 1979; Chuhan et al., 2002). Our model also accounts for compaction. Porosity reduction is known to occur due to the compaction of sediments under the weight of burial (Athy, 1930). It has also been shown that the rate of compaction differs depending on sediment type and the initial porosity at the time of deposition (Chuhan et al., 2003; Sclater and Christie, 1980; Athy, 1930; Giles et al., 1998). However, due to differences in grain size and physical properties, shale and finer-grained sediments experience greater and more rapid compaction. In this study, we apply an exponential compaction function to the porosity distribution after Athy (1930), in which:
where
The exponential trends applied based on Eq. 1 were.
•
•
3.2.2 Hydraulic conductivity
Hydraulic conductivity, denoted by K (m/s), is the property that determines the rate of fluid flow through the pores and fractures of the medium and known to be a combination of fluid and solid properties (Ingebritsen et al., 2008). In a previous field study by Wang (2005), values for porosity and hydraulic conductivity were reported for some units encountered at the Shengsi well sites. The analysis was only performed in aquifer units, therefore we adopt these values here. For other lithostratigraphic units we rely on values within the typical ranges based on empirical data (Freeze and Cherry, 1979). All flow parameters are summarized in Table 1.
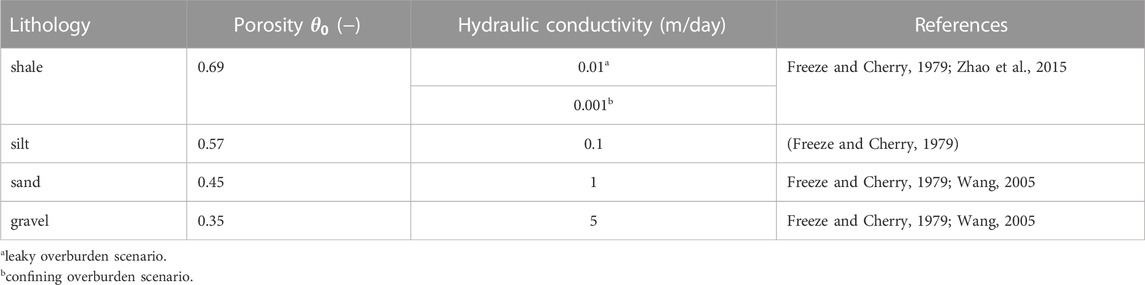
TABLE 1. Summary of flow properties assigned to each lithology in the model domain.
In addition to the porous media properties defined in Table 1, the numerical model is constrained by fluid and solute transport properties. Standard physical values for fluid density, compressibility and viscosity were used for water at a standard temperature of 20°C. The solute parameters were based on NaCl as sodium (Na) and Chloride (Cl) are the most abundant in seawater accounting for 85% of dissolved ions (Garrison, 2012). The parameters of the numerical model executed using SEAWAT are summarized in Table 2.
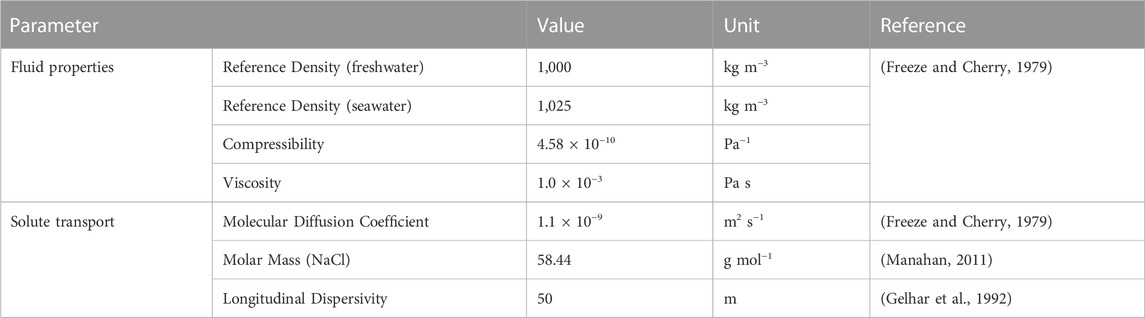
TABLE 2. Summary of model fluid and solute transport parameters used in all simulations.
3.3 Simulation scenarios
There is very limited borehole data available to constrain the numerical simulation results and characterize the OFG system. Therefore, we considered different scenarios of the likely subsurface conditions in this region of the shelf and investigated how they influence the distribution of potential OFG resources. For all scenarios, the same boundary conditions to represent sea-level fluctuations were imposed along the model boundaries for the past 200,000 a. In order to assess the influence of active lateral recharge on the OFG system, we considered two hydraulic gradient regimes. These are referred to as cases ‘a’ and ‘b’ for the purpose of discussion. For case a, we considered the hydraulic gradient across the model domain to be only due to the seafloor topography and sea-level variation to simulate topography-driven flow. In case b, topography-driven flow is still invoked, however, we increased the hydraulic head at the landward boundary by 5 m relative to the surface elevation to model an increased discharge from the landward direction. These two cases allow us to compare the influence of potential discharge from the landward direction. Finally, we assess the influence of the confining layer properties by considering two scenarios for each of the previously described cased. The scenarios are (i) a confined aquifer system, i.e., the uppermost lithostratigraphic unit is assigned a very low hydraulic conductivity value to represent an aquitard, and (ii) a leaky aquifer system, in which the uppermost unit is assigned a higher hydraulic conductivity. The four simulated scenarios are summarized in Table 3.
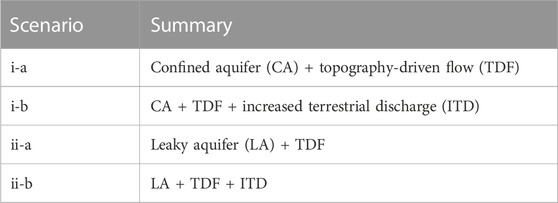
TABLE 3. Summary of simulated scenarios.
Finally, we attempt to obtain a best-fit scenario between the well site observations and simulated salinity distribution in the model domain. According to the available well observations by Wang (2005), the region around well site Shengsi-1 is saturated with saline pore fluid down to approximately 150 m depth. Freshwater was reported in the lower aquifer units at site Shengsi-1. At site Shengsi-2, freshwater was reported in the upper aquifer and brackish water in the lower units. This suggests that the upper and lower aquifer units are not hydraulically connected. To test this hypothesis, we reduced the hydraulic conductivity of the shale units between 100 m and 150 m depth by one order of magnitude from 0.01 to 0.001 m/day to simulate an impermeable barrier between the aquifer units.
3.4 Initial and boundary conditions
All numerical simulations were run for two cycles of sea-level rise and fall over a period extending from 200, 000 a BP to present day. Relative sea-level data was taken from the global sea-level curve presented by Imbrie et al. (1984) and shown in Figure 2. The curve is filled in green to show periods when the region of interest in this study was completely sub-aerially exposed to meteoric recharge. The regions under the curve shaded in light-red indicate periods when the domain was fully or partially submerged by the sea. The figure reveals that the model domain was exposed to meteoric recharge for the majority of the past 200, 000 a. For the purpose of simulation, the sea-level curve was discretized into stress periods, during which boundary conditions are fixed to represent a specific sea-level. We considered 200-year stress periods, resulting in a total of 1,000 stress periods for each model run. This provides a high time resolution of sea-level variations over the period, and allows us to observe the influence of relatively brief flooding periods, such as between 125 and 119 ka BP.
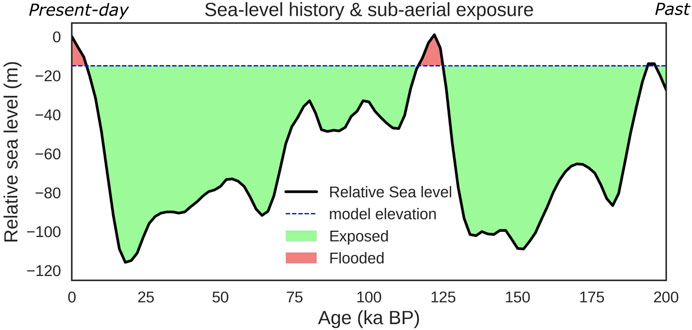
FIGURE 2. Sea-level curve for the past 200,000 a showing periods when the model domain is completely exposed (green), and periods of flooding (red) when the ocean is transgressing across the seafloor in the model domain. Data source: (Imbrie et al., 1984).
In all simulations, the model domain was initialized with all cells saturated with saline water at 35 g/L. While it is likely that there may have been existing freshwater, any estimates would be highly uncertain. Therefore, a conservative assumption of completely saline pore fluids provides a consistent baseline across all model scenarios. The boundary conditions were designed to recreate hydrological conditions on the shelf transect over the past 200,000 a (i.e., fluctuating sea-level). The model datum elevation is 0 m at the top left corner. This corresponds to the shallowest point of the present-day seafloor on the model domain. The landward (left) model boundary was assigned a general head boundary condition of 0 m for scenarios (i-a) and (ii-a), and a fixed solute concentration of 0 g/L. A hydraulic head of 5 m above the surface elevation was assigned to the landward boundary for scenarios (i-b) and (ii-b) to simulate terrestrially derived influx of freshwater with a fixed solute concentration of 0 g/L. At any given time throughout the simulated period, cells at the model surface were assigned boundary conditions dependent on their position relative to the fluctuating sea-level. Active cells above the sea-level are assigned a concentration of 0 g/L, simulating freshwater infiltration into the model domain via exposed surface cells. Cells below the sea-level were assigned a general head equivalent to the sea-level in that stress period, and a concentration of 35 g/L. The oceanward (right) model boundary was assigned a general head boundary condition equivalent to the sea-level of the stress period, and concentration of 35 g/L. During periods when the sea-level was below the seafloor on the oceanward boundary, the uppermost cells of the boundary were also assigned a concentration of 0 g/L down to the depth corresponding with the sea-level for that stress period. This ensures a realistic representation of conditions at the oceanward boundary where freshwater may be discharged out of the model domain as a result of the falling sea-level. The general head boundary condition is used to simulate head-dependent flux boundaries that allow flow into or out of the model domain depending on the difference in head between the boundary and some external reference point (Harbaugh, 2005). A static summary of the boundary conditions is shown in Figure 3.
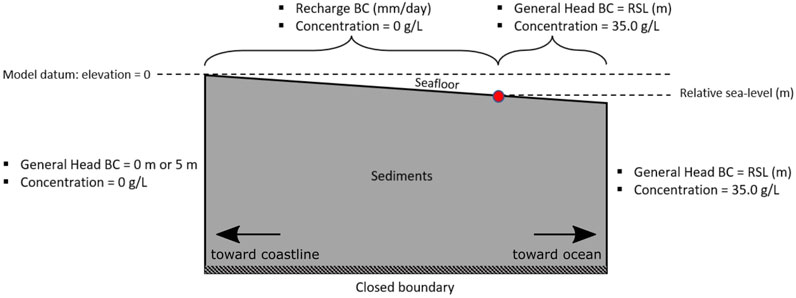
FIGURE 3. Schematic diagram of model domain showing a summary of boundary conditions applied during numerical simulations. Boundary conditions applied at the model surface were time-variant depending on the position of the coastline (red circle).
3.5 Volumetric analysis and OFG characteristics
The volume of freshwater was determined in the model domain at present day. A threshold for freshwater of TDS <10 g/L was used to calculate the OFG resource volume. The 10 g/L contour was also plotted on all simulated salinity distributions to visualize the geometry of the OFG system. This value has been used in previous studies including global and regional OFG volume estimates (Post et al., 2013; Micallef et al., 2021). The volumes were calculated based on the porosity distribution. Therefore, the total volume was calculated on a cell-by-cell basis over the entire model domain. The volume is described in cubic km per km of coastline, a metric that is often used to report OFG resources in previous studies (Micallef et al., 2021). This rough estimate is achieved by multiplying the volume in the 50 m domain by a factor of 20.
4 Results
4.1 Geological model
The digitized borehole data from Shengsi well sites 1 and 2 are shown in Figure 4. This plot depicts the upward fining trend in grain-size typically associated with fluvial or deltaic depositional environments (Meyers and Emery, 1996). The report on porewater salinity indicated two freshwater intervals at 50 m in borehole Shengsi-2 and a thicker interval between 200 m–250 m at the Shengsi-1 site. The section of Shengsi-2 above 200 m was reported to have saline porewater with a thin brackish interval at 130 m depth. A thicker brackish interval was also reported in Shengsi-2 at approximately the same depth.

FIGURE 4. Summary of lithology based on drilling observations at well sites Shengsi 1 and 2, the true distance between the wells is 12 km. The colors in the right column indicates the water salinity that was reported by Wang (2005) in three qualitative categories: fresh, brackish or saline. No total dissolved solid (TDS) values were available in that initial report, only qualitative descriptions.
The interpretated cross-section based on the two wells is shown in Figure 5A, the section is oriented from west (left) to east (right). The interpretation and model in Figure 5B show a gradual Eastward dip of the lithostratigraphic units. The two wells show similar upward fining stacking patterns; therefore, major aquifer units were interpreted to be connected across the wells. Thinner units, which did not appear in both wells, were interpreted to pinch out laterally away from the wells. These include the alternating silt and sand intervals between 50 m–100 m in Shengsi-2 and the sand unit at 150 m depth in Shengsi-1. The porosity compaction model is shown in Figure 5C.

FIGURE 5. (A) Lithostratigrahpic interpretation from available well log data showing interface between units. (B) Geological model generated using GemPy (Varga et al., 2019) showing lateral distribution of sand, silt, shale and gravel units overlaying the basement. (C) Porosity compaction model.
4.2 Groundwater model simulations
This section presents the results of the paleo-reconstruction performed on the model for all four scenarios. The simulated present-day salinity distributions are presented and our analysis of the OFG characteristics are summarized.
4.2.1 Present-day OFG distribution
The present-day simulated salinity distributions are shown in Figure 6A–D. In each plot, the geometry of the potential freshwater resource portion of the system is outlined with a dark blue dashed contour, representing the salinity threshold of <10 g/L. Based on this distribution it can be observed that the top of the system deepens in the offshore direction. The freshwater interval is likely to extend down to the basement at 300 m below the present-day seafloor. The system extends laterally as far as 20 km into the model domain, showing a high likelihood of continuity between the two wells. Furthermore, we include a dashed green contour, representing a salinity threshold of <17.5 g/L or roughly half the salinity of ocean water. In all scenarios the groundwater body progresses into a broad zone of brackish pore fluid in the offshore direction.
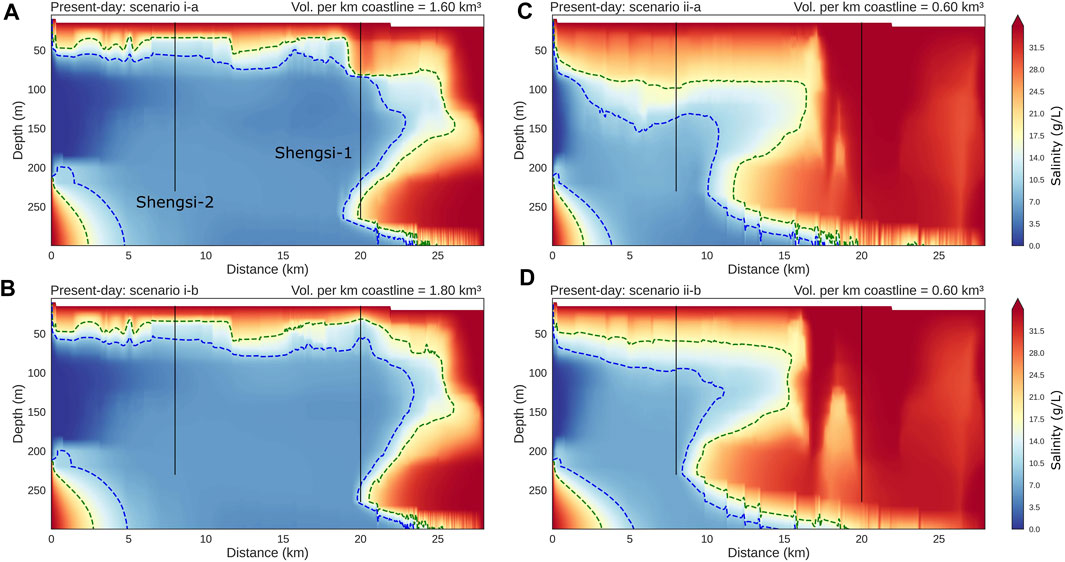
FIGURE 6. Salinity distribution in model domain for each simulated scenario. (A) Scenario i-a (B) scenario i-b (C) scenario ii-a (D) scenario ii-b. The dark blue dashed line bounds the region of fresh water based on a threshold of TDS <10 g/L. The green dashed line indicates the general shape of the OFG system defined by a threshold salinity of 17.5 g/L which includes the brackish water zone of the reservoir.
In scenario i-a (Figure 6A), a thick and laterally extensive body of freshwater is preserved in the model domain. The top of the surviving OFG body is relatively flat with a sharp contact between the overlying saline water and the preserved freshwater interval. It extends 22 km into the model domain with a gradual increase in salinity in the oceanward direction. At site Shengsi-2, the top of the relatively fresh water occurs around 60 m below the seafloor and continues to the basement with a slight increase in salinity with depth. At site Shengsi-1, the top of relatively fresh water is deeper at 80 m and extends down to 200 m. Saline water intrusion can be observed in the lowermost aquifer, between 200 m and 250 m depth. In scenario i-b (Figure 6B), all conditions were the same except for increased hydraulic head driving freshwater oceanward from the landward model boundary. This resulted in a 12.5% increase in the volume of freshwater in the model domain. The general geometry of the surviving OFG system remains the same. A two-to 3-km oceanward shift in the position of the boundary between the fresh and saline water is observed.
In scenario ii-a (Figure 6C), the leaky aquifer system (i.e., higher hydraulic conductivity of the overburden) allows for saline pore fluid to penetrate into the uppermost aquifer units. Consequently, the top of the OFG system is deeper in the sediment column, with an offshore dipping interface between 50 m–100 m below the seafloor. It extends as far as 15 km into the model domain and is 200 m thick with freshwater also occurring down to the basement. The top of relatively fresh water occurs at 100 m depth at site Shengsi-2, and extends to the basement as in the confining overburden scenarios. The salinity distribution along well site Shengsi-1 is considerably different with saline pore fluid permeated down to the basement. There is a landward shift of the fresh—saline interface.
The volume of freshwater stored in the system increased marginally between scenario i-a and i-b as a result of the increased terrestrial discharge implemented in i-b. In the leaky overburden scenarios, we observe a negligible increase in the freshwater volume, however, a significant change in the geometry of the distribution occurs. There is a significant difference in the volume of fresh water in the system between the confined and the leaky aquifer scenarios (Figure 6A, B) and the leaky overburden scenarios (Figure 6C, D). In the cases considering only topography-driven flow (Figure 6A, C), there is a 62.5% decrease in the freshwater volume between scenarios i and ii. In the cases that additionally considered increased terrestrial discharge (Figure 6C, D), there is a 67% decrease in freshwater volume when the leaky aquifer system is modelled.
4.2.2 OFG and lithology
The plots Figure 7 highlight the correlation between the freshwater distribution and the lithostratigraphic units. In the presence of a strongly confining overburden unit (Figure 7A, B), the top of the OFG system strongly correlates with the dipping interface between the shale and underlying silt unit. The results indicate that freshwater can be preserved in all the lithologies, however the sand/gravel intervals between 100 m and 150 m depth coincide with the furthest oceanward extent of the OFG system. The thickness of the brackish water zone is evidenced by the distance between the green and blue contours overlayed on the lithology. In the leaky overburden scenarios (Figure 7C, D), the top of the OFG is characterized by a thicker brackish interval occurring the shallow gravel aquifer. In the presences of a stronger confining overburden layer, the top of the OFG system shows a considerably thinner brackish zone. During the marine transgression and flooding of the shelf transect, the denser saline pore fluid intrudes the lower gravel aquifer more rapidly as the fresh—saline interface migrates landward. This results in a landward sloping interface observed in all simulated scenarios.
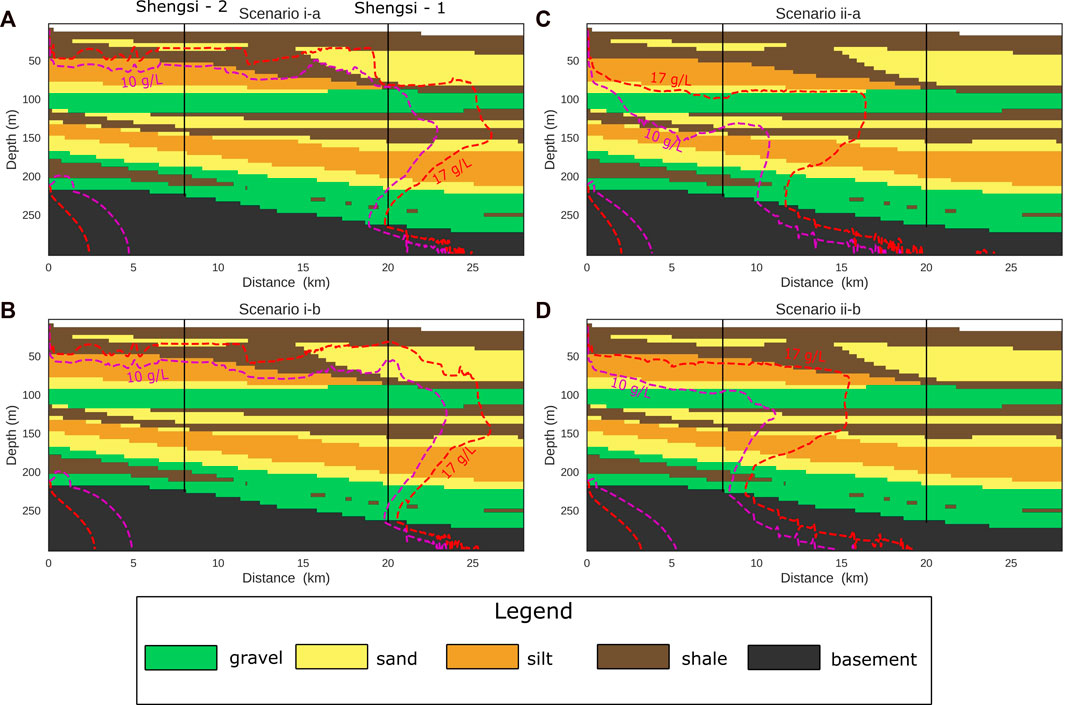
FIGURE 7. (A) Scenario i-a (B) scenario i-b (C) scenario ii-a (D) scenario ii-b. Overlay of 10 g/L (purple) and 17.5 g/L (red) threshold contour on the lithostratigraphic model compared for the 4 simulated scenarios. The results show that all lithologies can potentially store freshwater reserves.
This brackish water zone correlates with the more thinly interbedded sand—shale intervals.
4.3 Fitting the observations
According to the available well data, the region around well site Shengsi-1 is saturated with saline pore fluid down to approximately 150 m depth (Figure 4). Freshwater was reported in the lower aquifer units at site Shengsi-1. At site Shengsi-2, freshwater was reported in the upper aquifer and brackish water in the lower units. This suggests that the upper and lower aquifer units are not hydraulically connected. We reduced the hydraulic conductivity of the shale units between 100 m and 150 m depth by one order of magnitude from 0.01 to 0.001 m/day to simulate an impermeable barrier between the aquifer units. This resulted in a close fit to the observe well data. We believe this offers a general characterization of the OFG system in the region north of Shengsi islands. The system consists of two main aquifer units, likely separated by an impermeable barrier as suggested by numerical simulation results. The upper aquifer unit is between 60 m and 100 m depth and the lower unit is between 160 m and 220 m. The present-day distribution of the simulated system for this best-fit scenario is shown in Figure 8. The top of the system dips in the offshore direction from 50 m to approximately 150 m. The pore fluid in the upper aquifer unit extends laterally 15 km into the model domain, where it becomes brackish due to mixing with downward permeating saline pore fluid from the overlying strata in the region of well Shengs-1 (Figure 8B). The lower aquifer unit is shielded from salinification from overlying units and the freshwater extends 25 km into the model domain. Salinification occurs due to lateral seawater intrusion from the oceanward direction. The simulated OFG volume in this case is 1.4 km3/km−1.
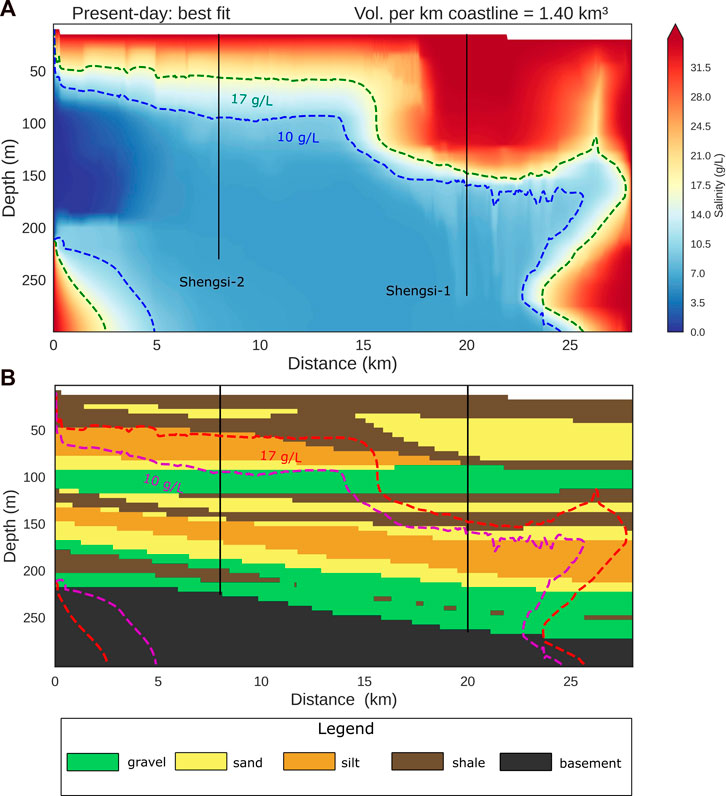
FIGURE 8. Numerical model results of OFG distribution for the scenario that best fits the well site observations reported by Wang (2005). (A) Simulated presentday salinity distribution. The dark blue dashed line bounds the region of fresh water based on a threshold of TDS <10 g/L. (B) Overlay of 10 g/L (purple) and 17.5 g/L (red) threshold contour on the lithostratigraphic model. The red dashed line indicates the general shape of the OFG system defined by a threshold salinity of 17.5 g/L which includes the brackish water zone of the reservoir.
4.4 Summary of OFG characteristics
Some characteristics of the surviving freshwater body observed from the simulated salinity distribution are summarized in Table 4. These are based on some typical metrics used to describe other OFG occurrences globally (Micallef et al., 2021).
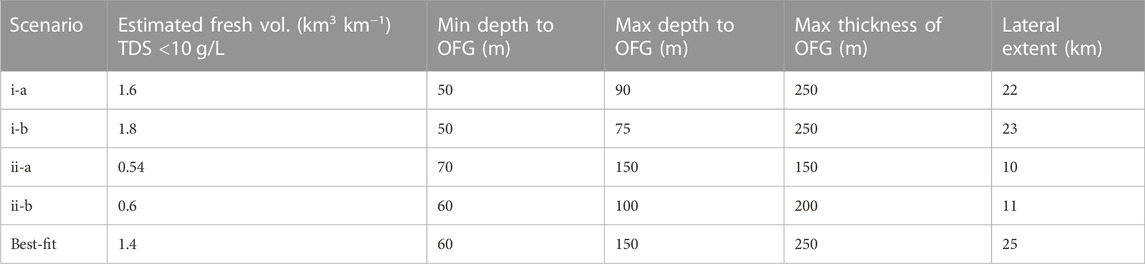
TABLE 4. Summary of OFG system properties for all simulated scenarios.
5 Discussion
This study shows an integrated numerical modelling approach to investigate the potential for the existence of an OFG system in the Shengsi region of the East China Sea (ECS). In this section, we present a characterization of the OFG potential in this region, the dimensions, geometry and potential volume in place are discussed. We also discuss the water resource implications and make recommendations for further investigation of this region.
5.1 Characteristics of OFG
The numerical simulation results strongly suggest that the Shengsi region of the East China Sea hosts a laterally extensive OFG body that has been emplaced during periods of sea-level lowstand. Our paleo reconstruction of the past two glacial—interglacial cycles reveals that hydraulic conditions during that period is sufficient to explain the persistence of an OFG body to present day. The system has a lateral extent of up to 25 km and occurs as a thick oceanward dipping interval of freshwater. The top of the relatively freshwater occurs between 50 m and 70 m in the proximal region of the model domain, whereas further offshore the top occurs between 75 m and 150 m. In all the simulated cases, freshwater occurs down to the basement with a potential thickness of up to 250 m (Figure 6). Freshwater occurs in all lithologies; however, it is mostly in sand/gravel units. This is consistent with the borehole observations reported in Wang (2005), which suggests that freshwater in the region is stored in sand/gravel aquifers.
According to the available well data, the region around well site Shengsi-1 is saturated with saline pore fluid down to approximately 150 m depth (Figure 4). Freshwater was reported in the lower aquifer units at site Shengsi-1. At site Shengsi-2, freshwater was reported in the upper aquifer and brackish water in the lower units. This suggests that the upper and lower aquifer units are not hydraulically connected. We reduced the hydraulic conductivity of the shale units between 100 m and 150 m depth by one order of magnitude from 0.01 to 0.001 m/day to simulate a less permeable barrier between the aquifer units. This resulted in a close fit to the observe well data. We believe this offers a general characterization of the OFG system in the region north of Shengsi islands. The system consists of two main aquifer units, likely separated by an impermeable barrier as supported by numerical simulation results. The upper aquifer unit is between 60 m and 100 m depth and the lower unit is between 160 m and 220 m. These intervals have been identified as aquifers in previous regional hydrogeological investigations (Wang, 2005; Zhen and Jie, 2008; Zhang Z. et al., 2018).
The predicted OFG volumes based on the simulated distribution ranges between 0.5 km3 km−1–1.6 km3 km−1. The volume in the best-fit model scenario is 1.4 km3 km−1. These values, while representative for this region of the shelf, are likely an underestimate of the ECS more broadly. This is due to the position of our model domain approximately 30 km from present day coastline. Therefore, any freshwater that may persist in that region closer to the Shanghai coastline is not accounted for in this estimate. However, the estimated values are comparable to 1.6 km3 km−1–1.8 km3 km−1 offshore New England (Cohen et al., 2010), 1.0 km3 km−1 offshore Jakarta, 2 km3 km−1 in Hoog Kong and 0.24 km3 km−1 offshore Israel; values reported in a database of OFG systems presented by Micallef et al. (2021). Our volume estimates are based on porosity values that range between 31% and 69%, taking into consideration porosity reduction with depth due to compaction as described by Athy (1930). Our implementation of porosity compaction also takes into consideration the variable compaction rates shown by different lithologies (Bahr et al., 2001). We used initial porosity values based on field data (Wang et al., 2013) as well as empirical values for siliciclastic sediments (Freeze and Cherry, 1979) where borehole observations were not available. Therefore, this model provides a realistic representation of the porosity distribution in this region.
5.2 Controls on OFG emplacement and survival
The model domain in this preliminary study does not extend all the way onshore and therefore, the rate of submarine groundwater discharge that may influence reservoirs in the model region is not well constrained. This is one of the limitations of this study. However, we considered both high and low influx boundary conditions at the landward model boundary to account for this uncertainty. The connectivity to the onshore terrestrial discharge is strongly influenced by the geological setting and the heterogeneity (Michael et al., 2016). The extensive delta associated with the Yangtze River has been classified as a tide-dominated delta (Yang et al., 2014). Tide-dominated deltas are typically characterized by linear depositional features, which are parallel to the tidal flow and perpendicular to the shoreline. These features can be several tens of kilometers long (Reading, 1978). Therefore, our 28 km 2D model of laterally extensive lithostratigraphic units is a good geological representation for this depositional environment.
Evidence for the presence of buried paleo-channels of the ancient Yangtze river has been presented in a number of previous studies (Liu et al., 2000; Xiao et al., 2004; Li et al., 2005). Palaeochannels are known to play a key role in groundwater to seawater exchange across the coastline (Mulligan et al., 2007). These types of shoreline perpendicular geological features are conducive to connected pathways that can transport present-day terrestrial discharge far offshore (Micallef et al., 2021). Based on our observations, some active recharge is also necessary to obtain a distribution in the model domain that matches the observations at the Shengsi well sites (Figure 8). Therefore, this system may consist of a mixture of palaeo-groundwater and more modern meteoric recharge in the proximal region of the shelf. We compared cases with and without increased terrestrial discharge. In the presence of a strongly confining layer (Figure 6A, B), the top of relatively fresh water at both well sites remain approximately the same in both cases. The increased influx of freshwater from the landward boundary pushes the fresh—saline interface further offshore as the strong confining layer provides a better conduit for a preferential path. However, in the leaky aquifer scenario, regardless of the influx prescribed at the landward boundary we observed a significant landward shift in the position of the fresh—saline interface. This highlights the significance of preferential flow pathways in the persistence of this OFG system. This study was conducted in 2D and does not account the potential influence of 3D flow pathways via buried paleo-channels. These can enhance vertical and horizontal fluid exchange as discussed in Micallef et al. (2020). Further analysis in 3D is needed to improve our understanding of the role of geological heterogeneity on the OFG system in the ECS.
In our comparison of the confining versus leaky overburden scenarios, we observed a 62.5%–67% decrease in present-day simulated freshwater volume for the leaky overburden cases. This highlights the significance of a continuous confining layer in the preservation of freshwater in this depositional setting. The field data reported by Wang (2005) suggests that freshwater in the region is stored in sand/gravel aquifer units, therefore, the presence of a confining layer in this stratigraphic setting is crucial. In the absence of a confining layer, we observe no chance for the persistence of a fresh water interval at Shengsi-1, where freshwater was reported below 150 m depth (Wang, 2005). The study region was only submerged by seawater for approximately 8% of the past 200,000 a. This allowed for significant freshwater recharge into the main aquifers. The shelf was only submerged 5,000 years ago so slow diffusion through confining layers below the seabed result in the preservation of considerable freshwater in all simulated scenarios. The preservation of OFG reservoirs is typically associated with the presence of a confining layer, which shields the underlying sediments from salinification by slowing the downward mixing of seawater (Kooi et al., 2000). While this is generally the case, there are instances of OFG where freshwater has been found to be preferentially stored in low-permeability shale intervals such as the New Jersey shelf, United States (Lofi et al., 2013; Thomas et al., 2019). The stratigraphy and geometry of the sediment in the region are highly conducive to the development of an OFG system, however, there is high uncertainty about the continuity of the overlying confining layer. Further imaging via geophysical methods such as 3D seismic and electromagnetic methods can greatly improve constraints on the geological structure, lithology as well as geometry of the OFG body. New boreholes and collection of geophysical wireline data will greatly improve the characterization of the property distribution in the shelf sediments such as porosity and permeability. Geophysical imaging methods such as controlled source electromagnetics will be instrumental in determining the geometry of the system such as depth of the freshwater and the continuity of the confining layer.
5.3 Implications
Water resource shortage is a significant challenge facing many urban centres around the world, including the city of Shanghai, China. Shanghai is one of the world’s most populous cities, with a population of over 24.25 million people. The city’s rapid economic growth and urbanization have resulted in increased demand for water resources, while the available water resources have remained relatively constant (Zhang F. et al., 2018). Additional studies have identified climate change as another factor that has affected water availability in the city, leading to increased frequency and intensity of droughts (Li et al., 2015; Wang et al., 2015). Several strategies have been proposed to address the water resource shortage in Shanghai. For example, the implementation of integrated water resources management approaches, including water conservation measures, water pricing reforms, and technological innovations. Zhang F. et al. (2018) presented a quantitative analysis of water consumption by the energy sector in Shanghai, they reported that 55% more water would be required to ensure a self-sufficient energy sector. Freshwater stored in offshore aquifers, similar to the system modelled in this paper, have been proposed as a source of unconventional freshwater that can relieve scarcity, particularly in water-stressed coastal regions (Bakken et al., 2012; UN-Water, 2020).
While, there still remain gaps in our understanding of the feasibility and sustainability of these potential systems, the existing methods to address these gaps have been clearly outlined in a review of OFG by Micallef et al. (2021). These include numerical modelling studies on 2D transects as in this study, as well as 3D shelf models. Geophysical imaging techniques can significantly improve the estimates of OFG volumes and delineate their geometry in 3D. Electromagnetic surveys image the resistivity anomalies created by the existence of relatively fresh pore fluid in the continental shelf environment. Has been used effectively to image extensive OFG systems on the New Jersey shelf, US (Gustafson et al., 2019), Canterbury Bight in New Zealand (Micallef et al., 2020) and offshore Hawaii, United States (Attias et al., 2020). Drilling and core sampling can also provide key data to help validate models of OFG systems and better constrain hydrogeological and petrophysical properties of the shelf sediments (Micallef et al., 2021). Detailed analysis of well log data including pore fluid salinity as well as geochemical analysis, was crucial to revealing the layered complexity of the OFG system offshore New Jersey in the United States (Mountain et al., 2010; Lofi et al., 2013; van Geldern et al., 2013). Considering the high likelihood for an extensive OFG system as discussed in this numerical study and evidenced by earlier observations, further investigation in the East China Sea is highly recommended. The top of the OFG system is relatively shallow at approximately 50 m–60 m below the seafloor. It is also laterally extensive, with freshwater occurring in sand/gravel lithostratigraphic units. Therefore, these factors point to a viable potential resource that warrants further exploration. The results of pumping and production tests carried out in previous studies of the Shengsi region offshore Shanghai suggests that the aquifer units are viable for production of water resources (Wang, 2005; Zhang Z. et al., 2018). Geophysical measurements such as a controlled source electromagnetic survey as earlier discussed would be highly effective and cost efficient to delineate the geometry of the system over a larger area. Further research is highly recommended to improve our understanding of the dynamics of this system, its extent and the volumes in place.
6 Conclusion
There is a high likelihood for the occurrence of an extensive OFG system in the region of the East China Sea, north of Shengsi Islands. The low gradient of the shelf in the region means that large areas would have been subaerially exposed during the last two sea-level lowstand periods. Our key findings from this analysis are summarized below.
1. The system has a lateral extent of up to 25 km and occurs as a thick oceanward dipping interval of freshwater. The top of the relatively freshwater occurs between 50 m and 70 m below the seafloor and likely extends down to the basement with a potential thickness of up to 250 m
2. A conservative estimate of the volume of freshwater (TDS <10 g/L) in the system is at least 0.5 km3 km−1–1.6 km3 km−1. This constitutes a viable potential freshwater resource that can be beneficial for addressing water scarcity in the Shengsi region and heavily populated coastal city of Shanghai.
3. The presence of confining layers in the stratigraphic column is crucial and strongly suggest that there is geological control on the OFG distribution and volume of freshwater in place.
4. Further analysis using geophysical imaging methods and 3D modelling including the onshore data is necessary to improve our understanding of this potential resource and the implications it may have for alleviating water stress in the Shengsi islands and on the mainland in Shangai.
Data availability statement
The raw data supporting the conclusion of this article will be made available by the authors, without undue reservation.
Author contributions
AT performed geological interpretation, numerical modeling and analysis of results. Writing and editing of final manuscript. AM provided technical guidance and feedback on the overall design of the study and editing of the manuscript. SD and ZZ provided the literature review for the study region and translation of Chinese language papers and provided feedback on overall manuscript layout. All authors contributed to the article and approved the submitted version.
Funding
MGMTOFGR is a 2-year research project jointly funded by the Malta Council for Science and Technology (MCST) as per Grant agreement No: SINO-MALTA-2020-04; and the Ministry of Science and Technology (MOST), China under the National Key R&D Program of China, No. 2021YFE0108800. This publication is based upon work from CA21112 Offshore freshened groundwater: An unconventional water resource in coastal regions?-OFFSOURCE, supported by the COST (European Cooperation in Science and Technology).
Conflict of interest
The authors declare that the research was conducted in the absence of any commercial or financial relationships that could be construed as a potential conflict of interest.
Publisher’s note
All claims expressed in this article are solely those of the authors and do not necessarily represent those of their affiliated organizations, or those of the publisher, the editors and the reviewers. Any product that may be evaluated in this article, or claim that may be made by its manufacturer, is not guaranteed or endorsed by the publisher.
References
Attias, E., Thomas, D., Sherman, D., Ismail, K., and Constable, S. (2020). Marine electrical imaging reveals novel freshwater transport mechanism in Hawai'i. Sci. Adv. 6 (48), eabd4866. doi:10.1126/sciadv.abd4866
Bahr, D. B., Hutton, E. W. H., Syvitski, J. P. M., and Pratson, L. F. (2001). Exponential approximations to compacted sediment porosity profiles. Comput. Geosciences 27 (6), 691–700. doi:10.1016/s0098-3004(00)00140-0
Bakken, T. H., Ruden, F., and Mangset, L. E. (2012). Submarine groundwater: A New concept for the supply of drinking water. Water Resour. Manage 26 (4), 1015–1026. doi:10.1007/s11269-011-9806-1
Bakker, M. (2006). Analytic solutions for interface flow in combined confined and semi-confined, coastal aquifers. Adv. Water Resour. 29 (3), 417–425. doi:10.1016/j.advwatres.2005.05.009
Bao, C., and Fang, C. (2012). Water resources flows related to urbanization in China: Challenges and perspectives for water management and urban development. Water Resour. Manage 26 (2), 531–552. doi:10.1007/s11269-011-9930-y
Bertoni, C., Lofi, J., Micallef, A., and Moe, H. (2020). Seismic reflection methods in offshore groundwater research. Geosciences 10 (8), 299. doi:10.3390/geosciences10080299
Biase, M., Chidichimo, F., Micallef, A., Cohen, D., Gable, C., and Zwinger, T. (2023). Past and future evolution of the onshore-offshore groundwater system of a carbonate archipelago: The case of the Maltese Islands, central Mediterranean Sea. Front. Water 4, 1068971. doi:10.3389/frwa.2022.1068971
Bratton, J. F. (2010). The three scales of submarine groundwater flow and discharge across passive continental margins. J. Geol. 118 (5), 565–575. doi:10.1086/655114
Chen, J. Y., Shen, H. T., and Yun, C. X. (1988). Processes of dynamics and geomorphology of the Changjiang estuary. Shanghai: Shanghai Science and Technical Publication.
Chuhan, F. A., Kjeldstad, A., Bjørlykke, K., and Høeg, K. (2003). Experimental compression of loose sands: Relevance to porosity reduction during burial in sedimentary basins. Can. Geotech. J. 40 (5), 995–1011. doi:10.1139/t03-050
Chuhan, F. A., Kjeldstad, A., Bjørlykke, K., and Høeg, K. (2002). Porosity loss in sand by grain crushing—Experimental evidence and relevance to reservoir quality. Mar. Petroleum Geol. 19 (1), 39–53. doi:10.1016/S0264-8172(01)00049-6
Cohen, D., Person, M., Wang, P., Gable, C. W., Hutchinson, D., Marksamer, A., et al. (2010). Origin and extent of fresh paleowaters on the Atlantic continental shelf, USA. Ground water 48 (1), 143–158. doi:10.1111/j.1745-6584.2009.00627.x
DeFoor, W., Person, M., Larsen, H. C., Lizarralde, D., Cohen, D., and Dugan, B. (2011). Ice sheet-derived submarine groundwater discharge on Greenland's continental shelf. Water Resour. Res. 47 (7). doi:10.1029/2011WR010536
Deltares (2022). iMOD 5.4. iMOD-WQ (Water Quality). Version 5.4. The Netherlands. Available online at https://oss.deltares.nl/web/imod.
Dou, Y., Yang, S., Liu, Z., Clift, P. D., Yu, H., Berne, S., et al. (2010). Clay mineral evolution in the central Okinawa Trough since 28ka: Implications for sediment provenance and paleoenvironmental change. Palaeogeogr. Palaeoclimatol. Palaeoecol. 288 (1-4), 108–117. doi:10.1016/j.palaeo.2010.01.040
Evans, R. L., and Lizarralde, D. (2011). The competing impacts of geology and groundwater on electrical resistivity around Wrightsville Beach, NC. Cont. Shelf Res. 31 (7-8), 841–848. doi:10.1016/j.csr.2011.02.008
Feng, Y. (1983). The sea-level changes and the lowest sea-level in the East China Sea since the late 40 ka. Donghai Mar. Sci. 1 (2), 36–42.
GEBCO (2022). Gridded bathymetry data (general bathymetric chart of the oceans). British Oceanographic Data Centre (BODC). Available online at https://www.gebco.net/data_and_products/gridded_bathymetry_data/ (Accessed on March 2, 2023).
Gelhar, L. W., Welty, C., and Rehfeldt, K. R. (1992). A critical review of data on field-scale dispersion in aquifers. Water Resour. Res. 28 (7), 1955–1974. doi:10.1029/92WR00607
Giles, M. R., Indrelid, S. L., and James, D. M. D. (1998). Compaction — The great unknown in basin modelling. SP 141 (1), 15–43. doi:10.1144/gsl.sp.1998.141.01.02
Goodbred, S. L., and Saito, Y. (2012). “Tide-dominated deltas,” in Principles of tidal sedimentology (Dordrecht: Springer).,
Gustafson, C., Key, K., and Evans, R. L. (2019). Aquifer systems extending far offshore on the U.S. Atlantic margin. Sci. Rep. 9 (1), 8709. doi:10.1038/s41598-019-44611-7
Harbaugh, A. W. (2005). MODFLOW-2005: The U.S. Geological survey modular ground-water model--the ground-water flow process. Tech. Methods, 6–A16. doi:10.3133/tm6A16
Harris, Pr T., and Macmillan-Lawler, M. (2016). “Global overview of continental shelf geomorphology based on the SRTM30_PLUS 30-arc second database,” in Seafloor mapping along continental shelves. Research and techniques for visualizing benthic environments/Charles W. Finkl, Christopher Makowski. Editors C. W. Finkl, and C. Makowski (Cham: Springer).
Hathaway, J. C., Poag, C. W., Valent, P. C., Miller, Rt E., Schultz, D. M., Manhe, F. T., et al. (1979). US geological survey core drilling on the atlantic shelf. Science 206 (4418), 515–527. doi:10.1126/science.206.4418.515
He, C., Harden, C. P., and Liu, Y. (2020). Comparison of water resources management between China and the United States. Geogr. Sustain. 1 (2), 98–108. doi:10.1016/j.geosus.2020.04.002
Henry, H. R. (1964). Effects of dispersion on salt encroachment in coastal aquifers: US geological survey. Sea water Coast. aquifers 8, 70.
Hensen, C., Wallmann, K., Schmidt, M., Ranero, C. R., and Suess, E. (2004). Fluid expulsion related to mud extrusion off Costa Rica—a window to the subducting slab. Geology 32 (3), 201. doi:10.1130/G20119.1
Hesse, R. (2003). Pore water anomalies of submarine gas-hydrate zones as tool to assess hydrate abundance and distribution in the subsurface what have we learned in the past decade? Earth-Science Rev. 61 (1-2), 149–179. doi:10.1016/S0012-8252(02)00117-4
Houben, G. J., Stoeckl, L., Mariner, K. E., and Choudhury, A. S. (2018). The influence of heterogeneity on coastal groundwater flow - physical and numerical modeling of fringing reefs, dykes and structured conductivity fields. Adv. Water Resour. 113, 155–166. doi:10.1016/j.advwatres.2017.11.024
Ijiri, A., Tomioka, N., Wakaki, S., Masuda, H., Shozugawa, K., Kim, S., et al. (2018). Low-temperature clay mineral dehydration contributes to porewater dilution in bering sea slope subseafloor. Front. Earth Sci. 6, 36. doi:10.3389/feart.2018.00036
Imbrie, J., Hays, J. D., Martinson, D. G., McIntyre, A., Mix, A. C., Morley, J. J., et al. (1984). “The orbital theory of Pleistocene climate: Support from a revised chronology of the marine d18O record,” in Milankovitch and climate, Part 1. Editor A. Berger (Boston, MA: D. Reidel Publishing Company).
Ingebritsen, S. E., Sanford, W. E., and Neuzil, Cr E. (2008). Groundwater in geologic processes. Cambridge, UK: Cambridge University Press.
Jiao, J. J., Shi, L., Kuang, X., Lee, C. M., Yim, W. W.-S., and Yang, S. (2015). Reconstructed chloride concentration profiles below the seabed in Hong Kong (China) and their implications for offshore groundwater resources. Hydrogeol. J. 23 (2), 277–286. doi:10.1007/s10040-014-1201-6
Kooi, H., Groen, J., and Leijnse, A. (2000). Modes of seawater intrusion during transgressions. Water Resour. Res. 36 (12), 3581–3589. doi:10.1029/2000WR900243
Kooi, H., and Groen, J. (2001). Offshore continuation of coastal groundwater systems; predictions using sharp-interface approximations and variable-density flow modelling. J. Hydrology 246 (1), 19–35. doi:10.1016/s0022-1694(01)00354-7
Krantz, D. E., Manheim, F. T., Bratton, J. F., and Phelan, D. J. (2004). Hydrogeologic setting and ground water flow beneath a section of Indian river bay, Delaware. Ground water 42 (7), 1035–1051. doi:10.1111/j.1745-6584.2004.tb02642.x
Langevin, C. D., Thorne, D. T., Dausman, A. M., Sukop, M. C., and Guo, W. (2008). Techniques and methods: US geological survey (techniques and methods).
Li, G., Liu, Y., Yang, Z., Yue, S., Yang, W., and Han, X. (2005). Ancient Changjiang channel system in the East China Sea continental shelf during the last glaciation. Sci. China Ser. D-Earth Sci. 48 (11), 1972–1978. doi:10.1360/04yd0053
Li, Z., Deng, X., Wu, F., and Hasan, S. (2015). Scenario analysis for water resources in response to land use change in the middle and upper reaches of the heihe river basin. Sustainability 7 (3), 3086–3108. doi:10.3390/su7033086
Lin, I-T., Wang, C-H., You, C-F., Lin, S., Huang, K-F., and Chen, Y-G. (2010). Deep submarine groundwater discharge indicated by tracers of oxygen, strontium isotopes and barium content in the Pingtung coastal zone, southern Taiwan. Mar. Chem. 122 (1-4), 51–58. doi:10.1016/j.marchem.2010.08.007
Liu, D., Hu, T., Huang, P., and Ji, Y. (2014). Classification and distribution of marine geohazards factors in Zhoushan Islands. Trans. Oceanol. Limnol. 3, 153–160.
Liu, Z-X., Berne, S., Saito, Y., Lericolais, G., and Marsset, T. (2000). Quaternary seismic stratigraphy and paleoenvironments on the continental shelf of the East China Sea. J. Asian Earth Sci. 18 (4), 441–452. doi:10.1016/s1367-9120(99)00077-2
Lofi, J., Inwood, J., Proust, J-N., Monteverde, D. H., Loggia, D., Basile, C., et al. (2013). Fresh-water and salt-water distribution in passive margin sediments: Insights from integrated ocean drilling program expedition 313 on the New Jersey margin. Geosphere 9 (4), 1009–1024. doi:10.1130/ges00855.1
Marui, A (2003). Groundwater conditions along the seawater/freshwater interface on a volcanic island and a depositional area in Japan. Geological Quarterly 47 (4), 381–388. Available at: https://yadda.icm.edu.pl/baztech/element/bwmeta1.element.baztech-article-bat3-0016-0023.
Meisler, H., Leahy, P., Knobel, P., and LeRoy, L. (1984). Effect of eustatic sea-level changes on saltwater-freshwater in the northern Atlantic Coastal Plain. Alexandria, VA: US Geological Survey. (US Geological Survey Water-Supply Paper 2255), updated on 1984.
Micallef, A., Person, M., Berndt, C., Bertoni, C., Cohen, D., Dugan, B., et al. (2021). Offshore freshened groundwater in continental margins. Rev. Geophys. 59 (1). doi:10.1029/2020RG000706
Micallef, A., Person, M., Haroon, A., Weymer, B. A., Jegen, M., Schwalenberg, K., et al. (2020). 3D characterisation and quantification of an offshore freshened groundwater system in the Canterbury Bight. Nat. Commun. 11 (1), 1372. doi:10.1038/s41467-020-14770-7
Michael, H. A., Scott, K. C., Koneshloo, M., Yu, X., Khan, M. R., and Li, K. (2016). Geologic influence on groundwater salinity drives large seawater circulation through the continental shelf. Geophys. Res. Lett. 43, 10,782–10,791. doi:10.1002/2016GL070863
Mora, G. (2005). Isotope-tracking of pore water freshening in the fore-arc basin of the Japan Trench. Mar. Geol. 219 (2-3), 71–79. doi:10.1016/j.margeo.2005.06.020
Mountain, G., Proust, J. N., McInroy, D., and Cotterill, C.Expedition 313 Scientists (2010). Proceedings of the integrated ocean drilling program. New Jersey Shallow Shelf: Integrated Ocean Drilling Program.
Mulligan, A. E., Evans, R. L., and Lizarralde, D. (2007). The role of paleochannels in groundwater/seawater exchange. J. Hydrology 335 (3-4), 313–329. doi:10.1016/j.jhydrol.2006.11.025
Mulligan, A., and Uchupi, E. (2003). New interpretation of glacial history of Cape Cod may have important implications for groundwater contaminant transport. Eos Trans. AGU 84 (19), 177–183. doi:10.1029/2003EO190001
Person, M., Dugan, B., Swenson, J. B., Urbano, L., Stott, C., Taylor, J., et al. (2003). Pleistocene hydrogeology of the atlantic continental shelf, New England. Geo. Soc. Am. Bull. 115 (11), 1324. doi:10.1130/B25285.1
Person, M., Marksamer, A., Dugan, B., Sauer, P. E., Brown, K., Bish, D., et al. (2012). Use of a vertical δ18O profile to constrain hydraulic properties and recharge rates across a glacio-lacustrine unit, Nantucket Island, Massachusetts, USA. Hydrogeol. J. 20 (2), 325–336. doi:10.1007/s10040-011-0795-1
Post, V. E. A., Groen, J., Kooi, H., Person, M., Ge, S., and Edmunds, W. M. (2013). Offshore fresh groundwater reserves as a global phenomenon. Nature 504 (7478), 71–78. doi:10.1038/nature12858
Potter, P. E., Depetris, P. J., and Maynard, J. B. (2005). Mud and mudstones. Introduction and overview. Berlin, Heidelberg: Springer-Verlag Berlin Heidelberg.
Sclater, J. G., and Christie, P. A. F. (1980). Continental stretching: An explanation of the post-mid-cretaceous subsidence of the central north sea basin. J. Geophys. Res. 85 (B7), 3711–3739. doi:10.1029/JB085iB07p03711
Siegel, J., Person, M., Dugan, B., Cohen, D., Lizarralde, D., and Gable, C. (2014). Influence of late Pleistocene glaciations on the hydrogeology of the continental shelf offshore Massachusetts, USA. Geochem. Geophys. Geosystems 15 (12), 4651–4670. doi:10.1002/2014GC005569
Thomas, A. T., Reiche, S., Riedel, M., and Clauser, C. (2019). The fate of submarine fresh groundwater reservoirs at the New Jersey shelf, USA. Hydrogeol. J. 27 (7), 2673–2694. doi:10.1007/s10040-019-01997-y
UN-Water (2020). UN-water analytical brief on unconventional water resources. Geneva, Switzerland: UN-Water. Available online at https://www.unwater.org/publications/un-water-analytical-brief-on-unconventional-water-resources/.
van Geldern, R., Hayashi, T., Böttcher, M. E., Mottl, M. J., Barth, J. A. C., and Stadler, S. (2013). Stable isotope geochemistry of pore waters and marine sediments from the New Jersey shelf: Methane formation and fluid origin. Geosphere 9 (1), 96–112. doi:10.1130/ges00859.1
Varga, L., de, M., Schaaf, A., and Wellmann, F. (2019). GemPy 1.0: Open-source stochastic geological modeling and inversion. Geosci. Model Dev. 12 (1), 1–32. doi:10.5194/gmd-12-1-2019
Varis, O., and Vakkilainen, P. (2001). China's 8 challenges to water resources management in the first quarter of the 21st Century. Geomorphology 41 (2-3), 93–104. doi:10.1016/S0169-555X(01)00107-6
Verkaik, J., van Engelen, J., Huizer, S., Bierkens, M. F. P., Lin, H. X., and Oude Essink, G. H. P. (2021). Distributed memory parallel computing of three-dimensional variable-density groundwater flow and salt transport. Adv. Water Resour. 154, 103976. doi:10.1016/j.advwatres.2021.103976
Wang, Z., Deng, X., Li, X., Zhou, Q., and Yan, H. (2015). Impact analysis of government investment on water projects in the arid Gansu Province of China. Phys. Chem. Earth 79-82, 54–66. Parts A/B/C. doi:10.1016/j.pce.2015.03.006
Wang, Z. (2005). Preliminary study on submarine freshwater resources in Shengsi sea area, zhejiang province. Shanghai Geol. 03, 16–21.
Wang, Z., Yang, S., Zhang, Z., Lan, X., Gu, Z., and Zhang, X. (2013). Paleo-fluvial sedimentation on the outer shelf of the East China Sea during the last glacial maximum. Chin. J. Ocean. Limnol. 31 (4), 886–894. doi:10.1007/s00343-013-2253-5
Xiao, S., Li, A., Jiang, F., Li, T., Wan, S., and Huang, P. (2004). The history of the Yangtze River entering sea since the last glacial maximum: A review and look forward. J. Coast. Res. 202, 599–604. doi:10.2112/1551-5036(2004)020[0599:THOTYR]2.0.CO;2
Yang, S., Wang, Z., Dou, Y., and Shi, X. (2014). Chapter 21 A review of sedimentation since the Last Glacial Maximum on the continental shelf of eastern China. Geol. Soc. Lond. Memoirs 41 (1), 293–303. doi:10.1144/M41.21
Zhang, F., Zhan, J., Li, Z., Jia, S., and Chen, S. (2018a). Impacts of urban transformation on water footprint and sustainable energy in Shanghai, China. J. Clean. Prod. 190, 847–853. doi:10.1016/j.jclepro.2017.08.157
Zhang, Z., Zou, L., and Han, Y. (2011). Primary study on submarine freshwater resources in north Zhoushan sea area. Geol. Rev. 57 (1).
Zhang, Z., Zou, L., and Zhou, L. (2018b). Occurrence potential study on submarine Quaternary freshwater resources in the north Zhoushan sea area. Haiyang Xuebao 40 (3), 50–61.
Zhao, Z., Sun, Z., Wang, Z., Sun, Z., Liu, J., and Zhang, C. (2015). The high resolution sedimentary filling in Qiongdongnan Basin, Northern SouthSouth China sea. Mar. Geol. 361, 11–24. doi:10.1016/j.margeo.2015.01.002
Zhen, Li, and Jie, Li (2008). The primary research on the Quaternary stratigraphic sequence and the characteristics of the water-bearing stratum in the sea of Shengsi Area, Zhejiang Province. Shanghai Geol. 2, 7–13.
Zhijian, L. (1989). Discussion on the water supply problem of Shengsi islands from the distribution of underground freshwater paleochannel aquifers in Shanghai. Shanghai Geol. 1, 25–28. Available online at https://kns.cnki.net/kcms/detail/detail.aspx?filename=SHAD198901002&dbcode=CJFD&dbname=CJFD1989&v=lB2SNsF_R5_ZPhIZYU9mlq5otWc5wHP2Rb8cHzk6LyRsxMnhMxd_wWF-xTvJT49j.
Keywords: offshore freshened groundwater, hydrogeology, geology, numerical modeling, water resources
Citation: Thomas AT, Micallef A, Duan S and Zou Z (2023) Characteristics and controls of an offshore freshened groundwater system in the Shengsi region, East China Sea. Front. Earth Sci. 11:1198215. doi: 10.3389/feart.2023.1198215
Received: 31 March 2023; Accepted: 05 June 2023;
Published: 19 June 2023.
Edited by:
Francisca Martinez-Ruiz, Spanish National Research Council (CSIC), SpainReviewed by:
Gopal Krishan, National Institute of Hydrology, IndiaKhaled Omar, National Research Institute of Astronomy and Geophysics, Egypt
Copyright © 2023 Thomas, Micallef, Duan and Zou. This is an open-access article distributed under the terms of the Creative Commons Attribution License (CC BY). The use, distribution or reproduction in other forums is permitted, provided the original author(s) and the copyright owner(s) are credited and that the original publication in this journal is cited, in accordance with accepted academic practice. No use, distribution or reproduction is permitted which does not comply with these terms.
*Correspondence: Ariel T. Thomas, YXJpZWwudC50aG9tYXNAdW0uZWR1Lm10
†Present address: Aaron Micallef,Monterey Bay Aquarium Research Institute, Moss Landing, CA, United States