 Haifang Xue1,2
 Haoteng Wang
 Ying Zhao
 Yonghao Zhang
- 1Qinghai Traffic Investment Co., Ltd., Xining, China
- 2Qinghai Xihu Expressway Management Co., Ltd., Xining, China
- 3State Key Laboratory of Eco-Hydraulics in Northwest Arid Region, Xi’an University of Technology, Xi’an, China
- 4School of Highway, Chang’an University, Xi’an, China
- 5China National Logging Corporation, Xi’an, China
As a result of the complex geological conditions of sand-cobble stratum, various types of problems may arise during construction of tunnels crossing sand-cobble stratum, the most prominent of which is the stability problem of the face. In order to study the stability of the tunnel face in sand-cobble stratum, first, a continuous medium model of sandstone soil is established, and numerical simulation is carried out on the three-axis compression test of sandstone soil to analyze its micro-mechanical characteristics. Second, a calculation model of simulated sandstone strata excavation is established by FLAC3D finite difference software. Then, the safety factor K calculated by the strength reduction method is introduced as the evaluation index of the face stability, and the face stability of sand-cobble tunnels with a series of stone content, tunnel burial depth and tunnel diameter are analyzed. The results show that the macro stress-strain curve of sand-cobble soil in the three-axis compression test can be divided into linear stage, elastic-plastic stage and ideal plastic stage, and the shear strength of sand-cobble soil increases with the increase of stone content. In the process of tunnel excavation, the stability of tunnel face increases with the increase of stone content in the stratum; while the tunnel buried depth and diameter increase, the stability of tunnel face decreases. These results provide a reference for predicting the instability and failure of sand-cobble tunnels, which is critical for the construction and safety of tunnels in sand-cobble stratum.
1 Introduction
The tunnel of the project traverses a sandy cobble stratum, which represents a distinctive soil-rock mixture consisting of rock blocks with specific dimensions and high strength, combined with low-strength soil. This stratum exhibits geotechnical properties that significantly differ from those encountered in conventional engineering practices. During tunnel excavation, the uneven distribution and substantial dispersion of cobble particles often lead to over-excavation challenges and hinder the formation of a stable tunnel. The roof and sidewalls of the tunnel are prone to deformation, making collapse and roof falls more likely to occur. Without timely and appropriate support, the rock surrounding the tunnel face may become destabilized and collapse, resulting in ground settlement, deformation, and collapse. Hence, the investigation of tunnel face stability in the sandy cobble stratum holds paramount importance in such excavation scenarios.
Numerous scholars have conducted extensive research on the mechanical properties of sand-cobble mixture and the stability of the face during tunnel excavation under geological conditions. Some scholars have used the discrete element method to establish a numerical model of sand-cobble mixture and performed uniaxial loading tests, which showed good consistency between the numerical simulation results and insitu tests in terms of nonlinear deformation and failure mode (Wang et al., 2005). In addition, many scholars have studied the shear characteristics of the soil-rock mixture through the discrete element method and found that the shear characteristics of the soil-rock mixture are mainly related to factors such as the stone content and moisture content, with the stone content having a greater impact on the shear characteristics of the soil-rock mixture (Medley and SanzRehermann, 2004; Xu et al., 2014; Kalender et al., 2014; Zhang et al., 2016; Napoli et al., 2018a; Napoli et al., 2018b, 2019; Napoli et al., 2021). Regarding the issue of large deformation caused by tunnel excavation, many scholars have analyzed the stability of the face using analytical, experimental, and numerical simulation methods (Augarde et al., 2003; Chen et al., 2011; Ukritchon and Keawsawasvong, 2017). Due to the good reproducibility of numerical simulation methods, they have been widely applied to the study of instability and failure modes of tunnel faces (Huang et al., 2018; Ukritchon and Keawsawasvong, 2019a; Ukritchon and Keawsawasvong, 2019b, c; Ukritchon et al., 2019). Based on these failure mechanisms, many scholars have conducted extensive research on the factors affecting and improving the stability of the face (Zhang et al., 2015; Han et al., 2016a; Han et al., 2016b; Li and Zhang, 2020). Despite the progress made in the study of face stability, there are still some limitations. Currently, in numerical experiments on the stability of sand-cobble strata tunnel faces, the sand-cobble stratum is usually treated as a homogeneous material. However, sandy cobble stratum is a heterogeneous material with large and random cobble size distribution, and its internal structure characteristics have an important influence on the overall mechanical properties (Zhang et al., 2023). Moreover, the stone content has been proven to be an important factor affecting the mechanical properties of the sand-cobble mixture, but there are relatively few studies on the influence of the stone content on the stability of sand-cobble tunnel faces. Therefore, given the geological conditions of the engineering project, it is necessary to conduct research on the stability of tunnel faces under the influence of stone content.
In numerical simulation methods, the Finite Element Method (FEM) suffers from the drawback of ill-conditioned mesh dependence when analyzing localization problems. In comparison to FEM and Finite Difference Method (FDM), Discrete Element Method (DEM) is highly time-consuming when simulating failure in tunnel surfaces. Furthermore, the microscale parameters inputted into DEM from parameter calibration are challenging to represent the true characteristics of the soil. The three-dimensional Finite Difference code FLAC3D (Itasca Consulting Group, 2006) utilizes an explicit Lagrangian computational scheme and hybrid discretization zoning technique. It is a forward scheme designed for nonlinear problems, eliminating the need for iteration, unlike other techniques such as FEM using implicit solution methods. Additionally, FLAC3D performs well in handling large deformation problems. In this study, tunnel excavation calculations will be modeled using FLAC3D software.
In the field of geotechnical engineering, the strength reduction method is often used to analyze the safety factor of geotechnical soils, and some related scholars have combined the strength reduction method with the finite element or finite difference method (Zhang et al., 2006; Zhang et al., 2007; Zheng et al., 2008; Qiao et al., 2010; Xing and Jianlin, 2010; Zheng, 2011), which began to be gradually integrated into the stability verification of tunneling projects. Among them, Zheng (2008) first introduced the strength reduction method into the stability calculation of tunnel engineering, and used the safety factor calculated by the strength re-duction method as the judgment condition for the instability of the surrounding rock, and showed that this judgment condition has a strict mechanical basis and is not influenced by other factors, which can form the same standard. Huang et al. (2016) introduced the strength reduction method and solved the upper limit solution of the overall safety factor of shallow buried tunnels under complex conditions, verifying its rationality and accuracy. Additionally, a number of scholars have applied the strength reduction method to tunnel engineering and verified its applicability (Yang and Huang, 2009; Xia et al., 2012; Espada et al., 2018; Shiau and Asadi, 2020), which provides a novel tool for tunnel stability analysis in this paper.
Based on the considerations mentioned above, this paper introduces the intensity reduction method to analyze the stability of the tunnel face in sand-cobble formations. Firstly, the block shape of the rock under random conditions was considered, and a random model of sand-cobble mixture was established. Numerical simulation methods were used to conduct numerical calculations for the triaxial compression test of sand-cobble mixture, and the influence mechanisms of different confining pressures and stone contents on the mechanical properties of the sand-cobble mixture were quantitatively studied, providing parameters for engineering-scale simulations. Then, using the FLAC3D finite element simulation method, tunnel excavation models with different stone contents, tunnel depths, and different tunnel diameters were established. The safety factor was used as the evaluation index for the stability of the tunnel face, and the variation of the active failure safety factor of the tunnel face under various factors was analyzed. Based on the safety factor of the tunnel under different working conditions and the analysis of the changes in the tunnel face caused by excavation under different working conditions, this paper reveals the impact of various factors on the stability of the tunnel face in sand-cobble stratum. The research results of this paper can further improve the stability evaluation mechanism of the tunnel face in sand-cobble tunnels, and provide references for predicting the instability and failure of the tunnel face in sand-cobble tunnels.
2 Numerical modelling of the sandy cobble stratum
2.1 Study on the mechanical properties of sandy cobble stratum
Figure 1 shows a schematic diagram of the deformation prediction of the sand-cobble stratum. As illustrated, the sand-cobble stratum is a soil-rock mixture composed of high-strength cobble with varying sizes and low-stiffness fine-grained soil, and its deformation characteristics are related to the micro-structural properties of the cobble and the soil matrix. In previous studies, the stone content has been identified as an important micro-structural property that affects the mechanical properties of the sand-cobble soil (Jian et al., 2016). Hall (1951) first conducted large-scale triaxial tests on SRMs to investigate their shear strength and found that the shear strength of SRMs increases with an increase in stone content. Similar conclusions were obtained by many scholars in subsequent experiments (Lindquist, 1994; Iannacchione and Vallejo, 2000; Jafari and Shafiee, 2004; Xue et al., 2012). Based on the physical and mechanical properties of the sand-cobble soil, the failure and deformation problems of the sand-cobble soil can generally be classified into two categories: small deformation problems dominated by stress (such as triaxial compression tests), and large deformation problems dominated by particle flow (such as sand-cobble tunnel excavation problems). When studying the large deformation problems caused by tunnel excavation in sandy cobble strata, it is necessary to consider the mechanical properties of the sand-cobble mixture itself. Namely, by studying the deformation laws of the sand-cobble mixture dominated by stress to provide parameters for numerical simulation of tunnel excavation.
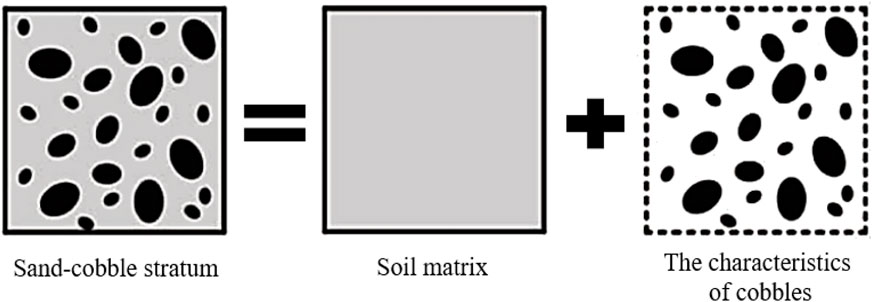
FIGURE 1. Deformation prediction method of sand-cobble stratum.
2.2 Construction of pebble block profile database
As mentioned above, the stone content of the sandy cobble stratum plays an important role in its stability due to its high mineral content. In order to accurately simulate the mechanical properties and kinematic characteristics of the sandy cobble stratum, this scenario requires and emphasizes the significance of better constructing a block model with similar particle size composition and random block morphology to the actual rock and soil, particularly when conducting numerical simulation tests. Firstly, the actual surface contour of the block is obtained by digital photography and digital image processing, and the shape of the block is counted. In this process, the block is equivalent to an ellipse. The laws of the long axis ratio, inclination angle and gradation of the block are obtained. In addition, a block contour shape library is established.
Mollon and Zhao’s research has demonstrated that Fourier descriptors can be utlized to depict the shape of particles (Mollon and Zhao, 2012), enabling the quantitative generation of blocks with particular shape features. In this section, the two-dimensional shape features of blocks will be analyzed from a quantitative perspective based on the discrete Fourier Transform, and a two-dimensional block database will be established. Firstly, the shape features of blocks need to be studied. In previous research, Barrett proposed three-level shape index analysis methods, describing the shape of a block in a way from overall, local to detailed (Barrett, 1980). This paper will adopt Barrett et al.'s approach to analyze the shape information features of blocks at three levels. The first level describes the overall shape form, with corresponding indicators including flatness (AR) and sphericity (SP); the second level describes local roundness, with corresponding indicators including angle number (AN), convexity (CO) and shape factor (SF); the third level is the degree of roughness of surface texture, with corresponding indicators including roughness (RO). The expression method is shown in Figure 2.
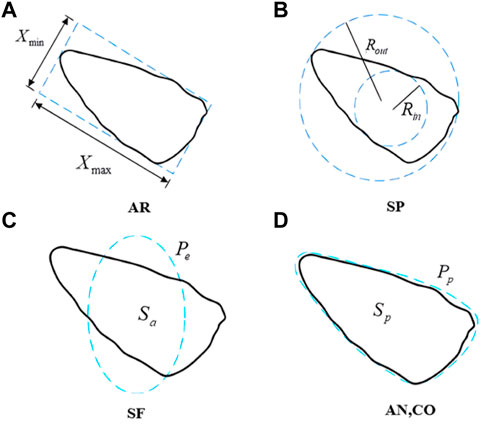
FIGURE 2. Schematic diagram of the evaluation indexes (A) AR, (B) SP, (C) SF and (D) AN, CO for the overall shape characteristics of the rock.
They can be expressed by Eqs 1–6
where,
Figure 3 depicts the transformation of the block contour with the discrete signal. As shown in Figure 3, the two-dimensional block center coordinates are

FIGURE 3. Transformation of block outlines and discrete signals.
The equation is expressed as follows:
According to the right-angle coordinate system:
Using the discrete Fourier inverse transform for the reconstruction of the block,
where,
where,
Figure 4 illustrates the flowchart of the Python implementation of the discrete Fourier inverse transform for reconstructing two-dimensional rock blocks. To generate a stochastic model of soil-rock mixtures with varying stone content, a block surface morphology library and a stone content rate should be leveraged. Figure 5 displays the stochastic model generation process based on the aforesaid block surface morphology library and stone content rate.
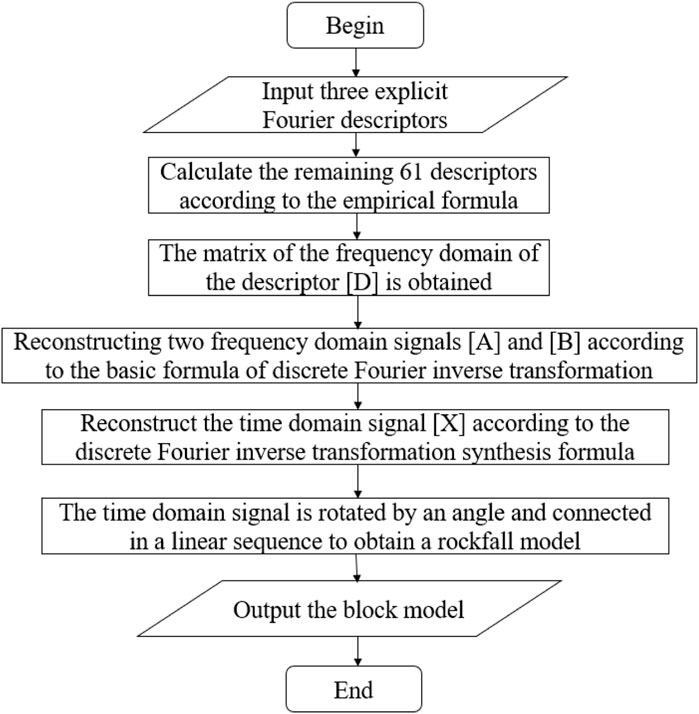
FIGURE 4. Process of obtaining a block model.
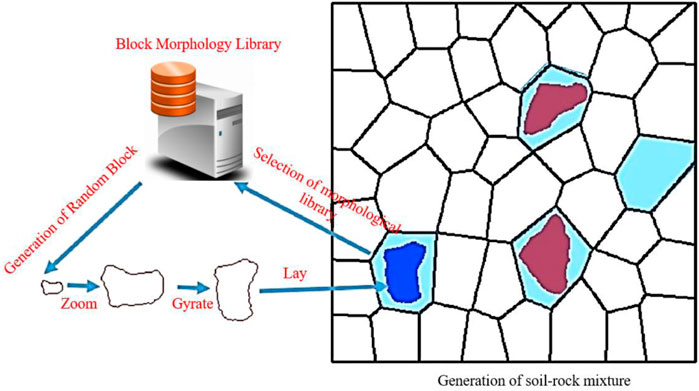
FIGURE 5. Generation of stochastic model of soil-rock mixture.
2.3 Modelling
Under the conditions of a triaxial compression test, sandy cobble stratum belongs to the category of small deformation. Based on the assumption of small deformation continuity, the unit size of the sandy is generally arbitrary. According to the engineering background of the project, the model of this test is a cylinder with diameter B) 400 mm and height H) 800 mm, and a hexahedral unit is used for free mesh division, and the mesh size is 0.005–0.01 m. In previous studies, Medley and Goodman (1994) proposed that the soil-stone threshold can be defined as:
where,
For the triaxial test specimen, the radius is taken as the specimen, so the soil and rock threshold in this paper is 10 mm. In order to improve the calculation efficiency, this paper simplifies the soil and rock body to a certain extent, simplifying the soil particles into spheres and the block particle size into a normal distribution within 30–70 mm. Note that the particle size here is not the actual particle size of the rock block, but the equivalent particle size with the same volume of the sphere. When the particle size range of any unit sphere is 8–10 mm, it is defined as the sandy property; when the particle size of any unit polyhedron is in the range of 30–70 mm, the polyhedron is designated as the cobble property. The contact interface of the soil and rock unit is discretized and the contact interface model is established. The test adopts displacement control loading, rigid plate is set on the surface of the specimen and appropriate loading speed is set, and the bottom surface is set with fixed displacement boundary. Radial pressure boundary is adopted in the circumferential direction to simulate the surrounding pressure, and 0.1, 0.2, 0.3 and 0.4 MPa are set for four kinds of surrounding pressure respectively. According to the field survey report, the unit parameters are set as shown in Table 1.
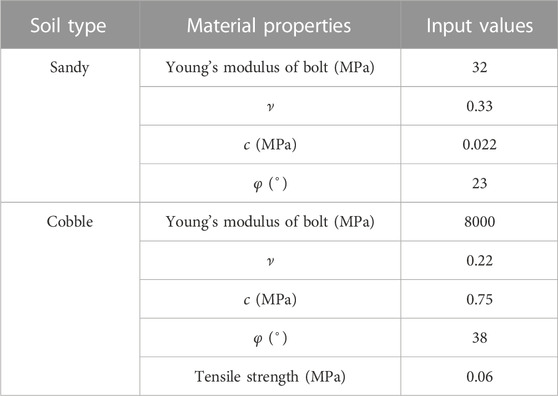
TABLE 1. Material parameters of elements.
According to the above discussion, the strength of sandy cobble soil is determined by the block stone and the soil matrix. When the stone content is small, the strength of the sandy cobble soil is determined by the soil itself, and when the stone content is too much, the strength of the sandy cobble soil is determined by the skeleton formed by the rock block. In order to better clarify the change in the shear strength of the sandy cobble stratum under different stone content conditions, numerical models with too high stone content should not be selected. In this paper, the method of establishing the block stone database in Sect. 2.2 is adopted in numerical simulation, and five different forms of stone content are selected, which are set to 0, 10%, 20%, 30% and 40%. Figure 6A,B are the numerical model of triaxial test and the random models of sandy cobble soil with five different stone contents.
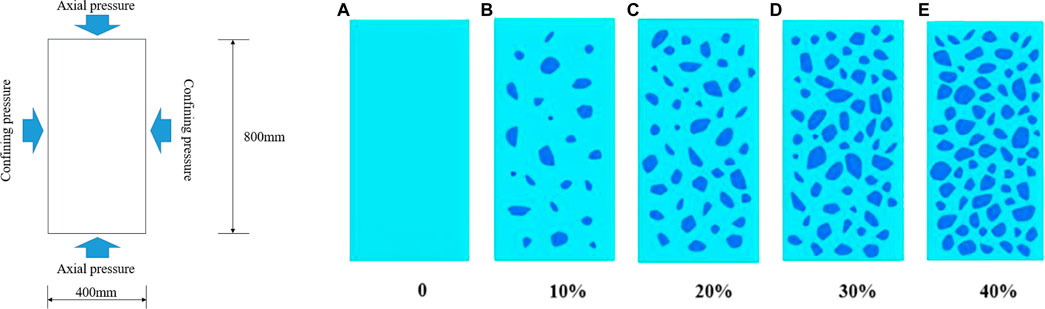
FIGURE 6. Numerical model of triaxial test and sandy cobble soil random models with different stone contents of (A) 0, (B) 10%, (C) 20%, (D) 30% and (E) 40%.
2.4 Experimental results and analysis of influencing factors
2.4.1 Validation for numerical tests
To ensure the applicability and reliability of numerical models in practical engineering, it is necessary to validate the results of numerical experiments. Considering the constraints imposed by practical factors, validation can be performed by utilizing existing numerical experimental results. In this paper, taking the test results with 40% stone content and 0.2 MPa confining pressure as an example, the stress-strain relationship curve was derived, as shown in Figure 7. The deformation process of the sample was divided into three stages: the first stage was the linear elastic stage, the deviatoric stress increased with the axial strain and had a linear relationship, which increased from
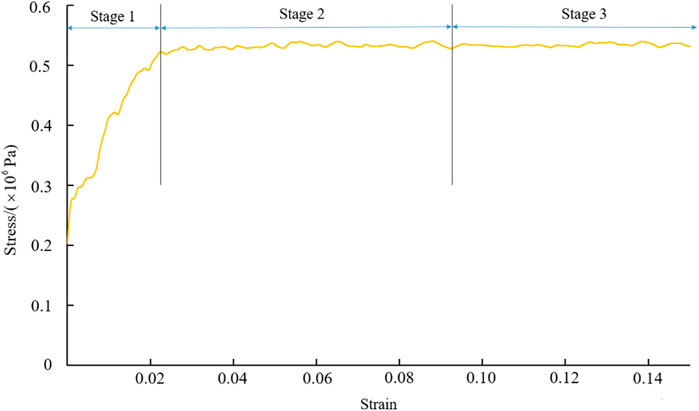
FIGURE 7. Typical deviation of stress-strain curve.
2.4.2 Calculation method of cohesion and angle of internal friction
The shear strength of cohesive soil depends on the cohesive force and friction between soil particles. For the shear strength of weakly cemented sandy cobble mixtures, it is usually expressed by the cohesive force
As a result of a set of triaxial tests, all the Mohr’s circles cannot be exactly tangent to the same tangent line; however, there has to be a common tangent line between two non-nested circles in the set. By finding the tangent points of all the Mohr’s circles two by two, and finally by calculating the least squares equation for all the tangent points, we can obtain the envelope equation and the shear strength parameters. According to the illustration shown in Figure 8.
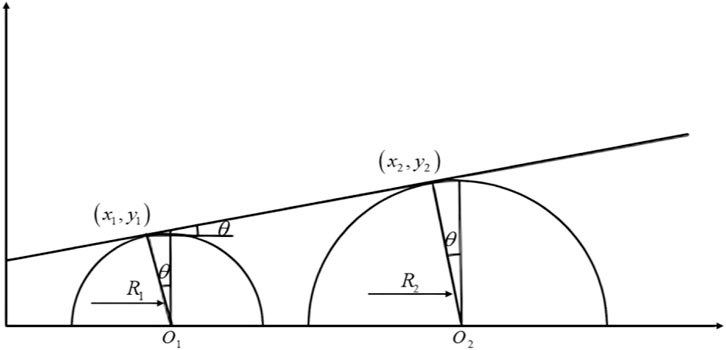
FIGURE 8. Common tangent line and its points coordinates of two cycles.
Mohr’s circles
where,
Based on the geometric relationship equation:
where,
From geometric analysis there is:
The following equation can be obtained from Eqs 16, 17:
Similarly, the coordinates of the tangent points of any two tangent lines can be determined:
Assume that there are
For fitting a curve, one should derive its most general n-polynomial fit, which assumes that its most general curve expression is:
According to the principle of least squares:
The problem of finding the extreme value of I function on
According to Eq. 24, there is:
where:
Eq. 27 can theoretically be fitted to the molar envelope of any number of polynomials, and the coefficients
2.4.3 Influence of confining pressure and stone content
This paper adopted four confining pressures of 0.1 MPa, 0.2 MPa, 0.3 MPa and 0.4 MPa respectively, keeping the confining pressure constant and increasing the axial pressure step by step until the sample was damaged. Taking the unit size of 0.01 m and 40% stone content, the stress-strain relation curves of the samples under different confining pressures
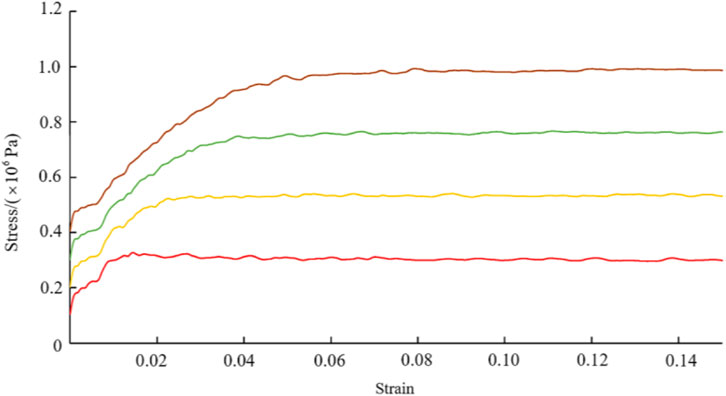
FIGURE 9. Deviation curves of stress versus strain under different confining pressures.
Under the condition of a 0.05 m unit size, specimens with different stone contents (0%, 10%, 20%, 30%, and 40%) were prepared and tested under various confining pressures. The Mohr stress circles obtained from the numerical simulation of the triaxial tests on the sand-cobble mixtures with different stone contents are presented in Figure 10. The strength envelopes exhibit a typical linear trend. Using the method described in Section 2.4.2 to calculate the shear strength parameters
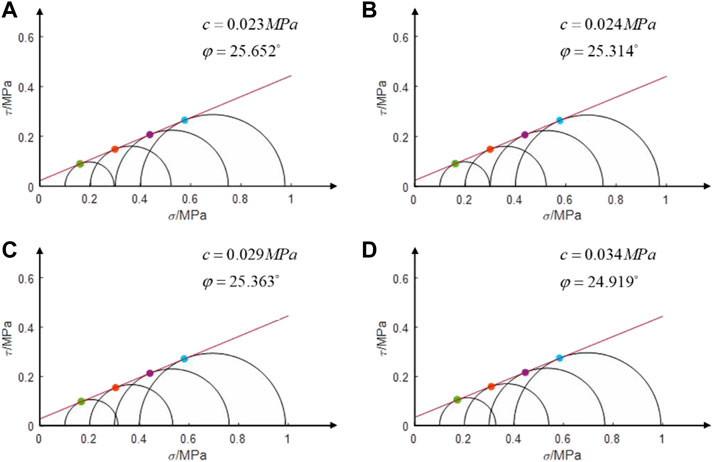
FIGURE 10. Curves of Mohr’s circle with different stone contents of (A) 10%, (B) 20%, (C) 30% and (D) 40%.
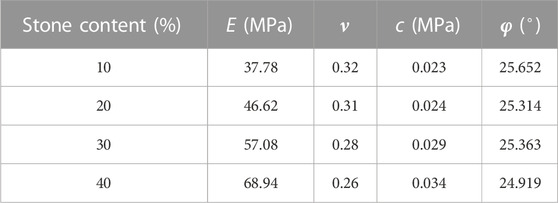
TABLE 2. Strength and deformation parameters of samples with different stone content.
3 Numerical modelling of the tunnel face stability
3.1 Project overview
The Da Zhuang Tunnel is located in Xishan Village, Donggou Township, Huzhu Tu Autonomous County, Qinghai Province, which is a separated middle tunnel. The left line starts from ZK40+366 to ZK40+960, with a length of 594 m, and the right line starts from YK40+454 to YK41+126 with a length of 672 m. The portal section is mainly composed of sand-cobble strata (Figure 11), which is gray and yellow soil, medium density, mostly cobble, filled with sand and fine clay. The cobble size and shape are irregular, which greatly impacts the tunnel. After tunnel construction, the construction party adjusted the design parameters according to the actual geological conditions. Initial support was S5H-a, and the lining type was C22 drug roll anchor single 4 m (radial space 100 cm, vertical 50 cm) +
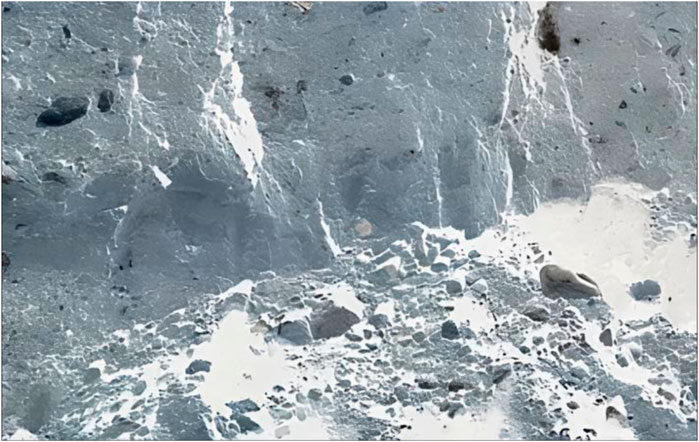
FIGURE 11. Sandy cobble stratum.
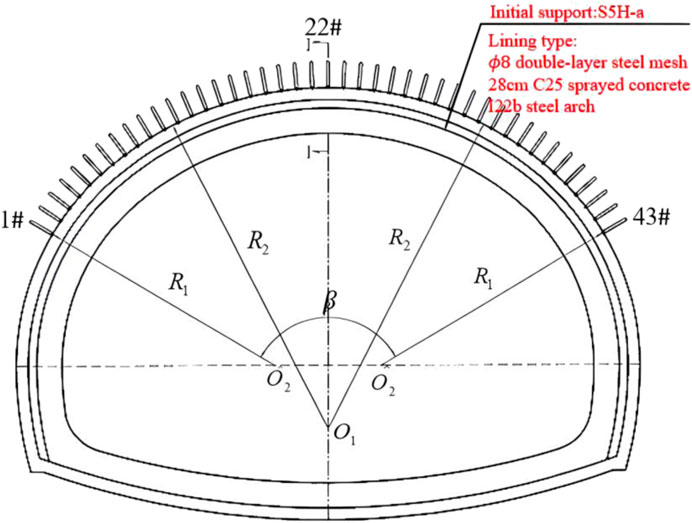
FIGURE 12. Tunnel profile and support parameter.
3.2 Numerical model description
In accordance with the actual engineering situation of the project, the stepwise method is adopted in this paper, taking the arc guide pit excavation and reserving the core soil as the basic model, with three steps and seven excavation faces. The excavation and support at each position are staggered and parallel along the tunnel. To study the stability of the face during the excavation of sand-cobble tunnel, FLAC3D is used for numerical simulation. Figure 13 shows the calculation model of sandy cobble tunnel with a burial depth of
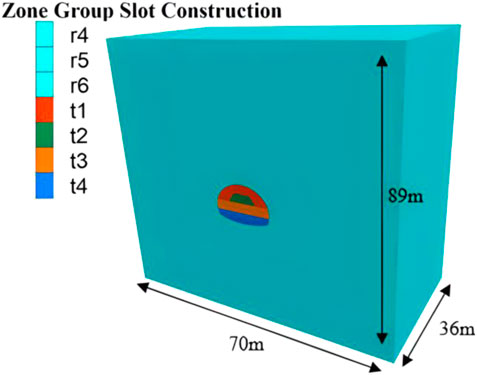
FIGURE 13. Numerical model for the analysis of tunnel face stability.
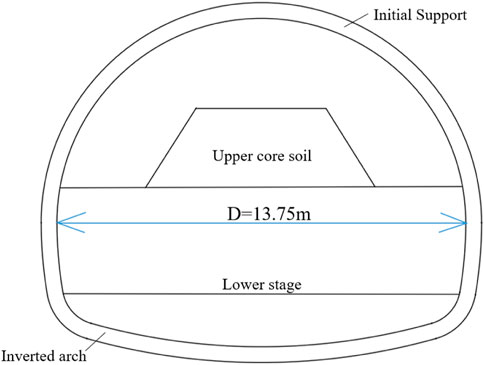
FIGURE 14. Cross-section of tunnel in numerical test.
3.3 Simulation process
In order to ensure the stability of the face in the tunnel construction process, many scholars have studied the factors influencing the stability of the face through numerical simulation. The main influencing factors leading to the deformation of the face are relatively high stress and poor geological conditions, and the relationship between stress and burial depth is relatively large, so the burial depth of the tunnel is the main factor affecting the stability of the face (Chen et al., 2013; Liu et al., 2019; Li et al., 2022). The ultimate support pressure of the face is the key factor to ensure the stability of the face. Li used FLAC3D to numerically analyze the critical support pressure of the face in the tunnel, and found that the diameter of the excavation surface was also important for the stability of the face in the process of tunnel excavation (Li et al., 2022). According to the conditions of the sandy cobble stratum tunnel, the stone content is an important factor affecting the stability of the sandy cobble soil, so the large deformation problem of the face caused by the excavation of tunnel is related to the stone content in sandy cobble stratum. Based on the above discussion, in the stability analysis of the face in sandy cobble stratum tunnel, the influence of stone content, tunnel burial depth and tunnel diameter should be considered comprehensively. This paper will analyze in detail according to the following three working conditions:
Condition 1: The stone content of the sandy cobble soil is the variable, while the tunnel depth and tunnel diameter are the constants. Calculate according to the stone content of the core soil, which are 0%, 10%, 20%, 30%, and 40%, the tunnel depth is 30m, and the tunnel diameter is 13.75 m, to study the influence of the stone content on the stability of the tunnel face in sandy cobble stratum.
Condition 2: The tunnel depth is the variable, while the stone content and tunnel diameter are the constants. Calculate according to the tunnel depth, which are 10 m, 20 m, 30 m, 40 m, and 50 m, the stone content is 10%, and the tunnel diameter is 13.75 m, to study the influence of the tunnel depth on the stability of the tunnel face in sandy cobble stratum.
Condition 3: The tunnel diameter is the variable, while the stone content and tunnel depth are the constants. Calculate according to the tunnel diameter, which are 11.75 m, 12.75 m, 13.75 m, 14.75 m, and 15.75 m, the stone content is 10%, and the depth of tunnel is 30 m, to study the influence of the chamber size on the stability of the tunnel face in sand-cobble stratum.
3.4 Analysis of safety factor of tunnel face stability
The analysis of tunnel face stability is a three-dimensional problem. Although numerical simulation analysis technology can simulate the whole construction process and the damage mechanism of the face, it is difficult to obtain the safety factor of the tunnel face support in time due to its poor temporality, which is not conducive to the judgment of the stability of the tunnel face during construction and the overall control of the project (Jiang et al., 2015). The safety factor obtained by the strength reduction method not only can describe the relative quantity relationship between the strength of the tunnel face and the secondary stress caused by excavation, and the overall resistance of the tunnel face to the secondary stress, but also can characterize the shear stability of the face. Therefore, the safety factor can be used as an important index for the overall safety evaluation of the tunnel.
The strength reduction method was first proposed by Bishop (1955), which defined the strength reduction coefficient as the ratio of the existing shear strength of the soil to the shear strength required to maintain equilibrium. The principle is to divide the soil parameters (
where,
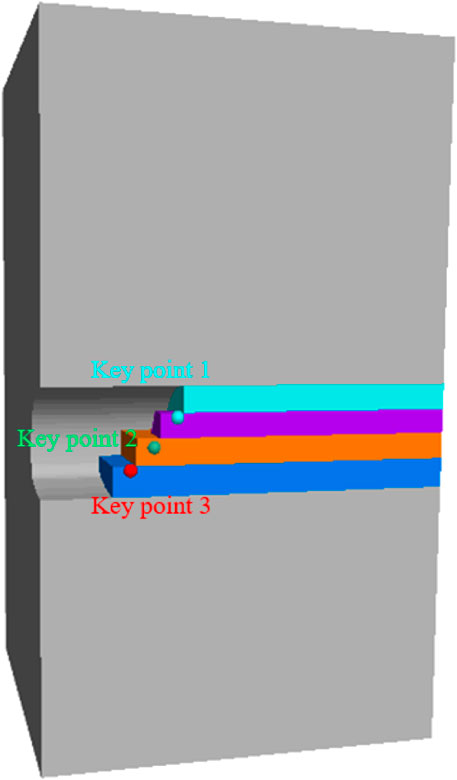
FIGURE 15. The location of key points.
When a numerical model with 10% stone content, 30 m tunnel burial depth and 13.75 m tunnel diameter is selected, the displacement of the test point changes with the reduction factor as the abscissa and the displacement of the key feature point as the ordinate, as shown in Figure 16. Based on the engineering geological background, we first quantify the variations in displacement at the monitoring points. We set the threshold for the slope of the curve indicating abrupt changes in displacement to 1.5. It can be seen from the figure that the reduction factor increases gradually from 0.8 and the displacement of the measuring point increases slowly with the increase of the reduction factor before reaching 1.3, which shows a linear proportional relationship between them, indicating that the tunnel face is in the elastic-plastic deformation stage and is overall stable, which can continue to bear the load. When the reduction factor increases to 1.3, the slope of the curve is 1.5, the variation rate of the displacement of the measuring point increases and enters the rapid increase stage, indicating that the tunnel face enters the unstable destruction stage and is in the quasi-limit equilibrium state. When the reduction factor is greater than 1.3, the displacement variation of the measuring point is almost parallel to the ordinate representing the deformation displacement, indicating that the tunnel face has undergone destruction.
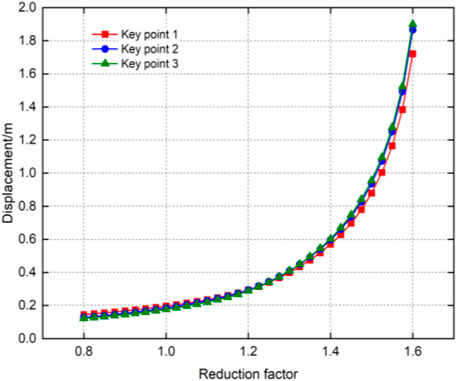
FIGURE 16. Fitting curve of displacement of the key point vs reduction coefficient.
4 Numerical modelling results and discussions
4.1 Effect of stone content
To analyze the deformation of the face under varying stone content conditions, we numerically simulated five different types of tunnels with a buried depth of 30 m, a tunnel diameter of 13.75 m, and stone contents of 0%, 10%, 20%, 30%, and 40%. Two methods, namely, the stepwise method and the core soil method, were employed under working condition 1. By statistically analyzing the deformation of the soil in front of the face caused by the different control groups, we obtained displacement cloud maps of the soil under various conditions (Figure 17). The failure pattern was extracted from the vertical cross section of the three-dimensional numerical model. As depicted in Figure 17, under the same tunnel buried depth and diameter, the soil in front of the face exhibited the highest displacement near the semicircular region across different stone contents, which aligns with previous numerical experiments (Zhang et al., 2015).
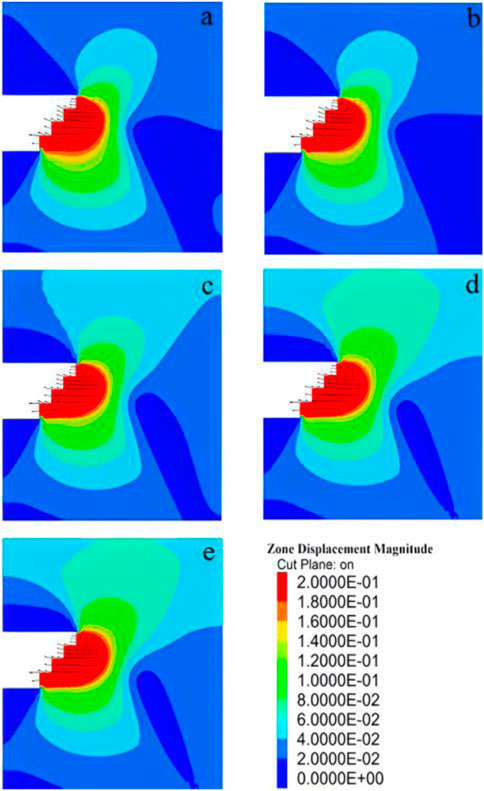
FIGURE 17. Displacement nephogram in front of tunnel face with different stone contents of (A) 0, (B) 10%, (C) 20%, (D) 30% and (E) 40%.
As the stone content increased, the red area indicating maximum soil deformation in front of the face gradually decreased. Conversely, the area with minimal displacement of the upper soil in front of the face gradually increased, while the displacement of the lower soil remained relatively unchanged. Figure 18 illustrates the change in shear strain during tunnel excavation for both the face and the soil in front of it. Notably, the upper and lower steps of the face exhibited the highest shear strain. Moreover, with increasing stone content, the area with maximum shear strain at the face decreased, and the shear strain transferred from the soil below the face to the soil above it. Consequently, the stability of the tunnel face improved during excavation as observed in the figure.
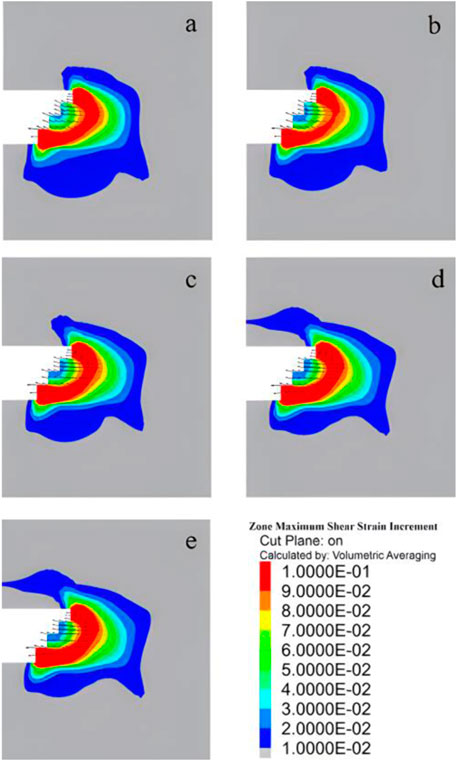
FIGURE 18. Stress nephogram with different stone contents of (A) 0, (B) 10%, (C) 20%, (D) 30% and (E) 40%.
Table 3 presents the safety factor values calculated using the method proposed in Section 3.3 for the sand-cobble tunnel model, with stone content ranging from 0% to 40%. It is evident that the safety factor increases with higher stone content. At 0% stone content, the calculated safety factor was 1.15, indicating an unstable and vulnerable face. However, at 40% stone content, the safety factor increased to 1.65, accompanied by reduced shear strain at the face and improved face stability. Therefore, we can conclude that, under equivalent excavation depth and chamber size, increasing the stone content in the sand and gravel stratum enhances the stability of the tunnel face during excavation.
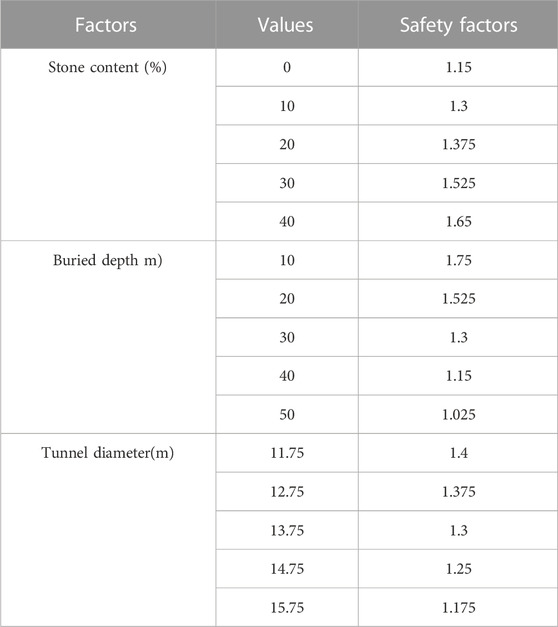
TABLE 3. Safety factors with different stone content, buried depth and tunnel diameter.
4.2 Effect of tunnel buried depth
The buried depth of a sandy cobble stratum tunnel is a critical factor influencing the stability of the tunnel face. In Condition 2, we simulated the excavation of tunnel models with five different buried depths. These sandstone tunnel models had a stone content of 10%, a tunnel diameter of 13.75 m, and embedment depths of 10 m, 20 m, 30 m, 40 m, and 50 m respectively. By analyzing the displacement and shear strain changes in the soil in front of the tunnel face for each experimental group, we obtained displacement and shear strain change cloud maps, shown in Figure 19 and Figure 20 respectively. Figure 19 reveals that the greatest soil deformation in front of the tunnel face typically occurs at the face itself. At a buried depth of 10m, the maximum displacement of the tunnel face and the soil in front of it is concentrated in the middle and upper part of the face. As the buried depth increases, the displacement decreases in the upper part and increases in the lower part. At a buried depth of 50m, the displacement mainly occurs in the middle and lower part of the soil in front of the tunnel face. Figure 20 demonstrates that, during excavation using the step method, the highest shear strain occurs at the upper and lower steps of the tunnel face and the front of the face. With increasing buried depth, the maximum range of shear strain in front of the face gradually decreases. At a buried depth of 50 m, the maximum range of shear strain reaches a minimum, indicating that the tunnel face is most unstable and susceptible to damage at this point. Consequently, in sandy cobble tunnels with a consistent stone content and tunnel diameter, deeper buried depths result in poorer tunnel face stability during excavation.
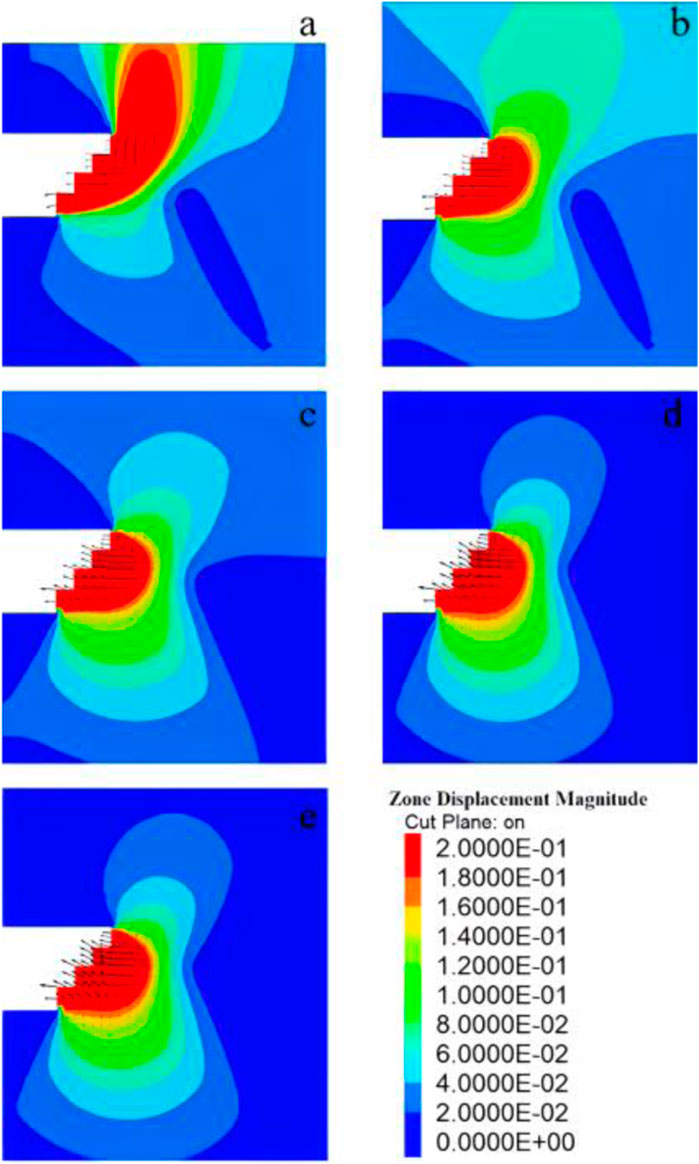
FIGURE 19. Displacement nephogram in front of tunnel face with different buried depths of (A) 10 m, (B) 20 m, (C) 30 m, (D) 40 m and (E) 50 m.
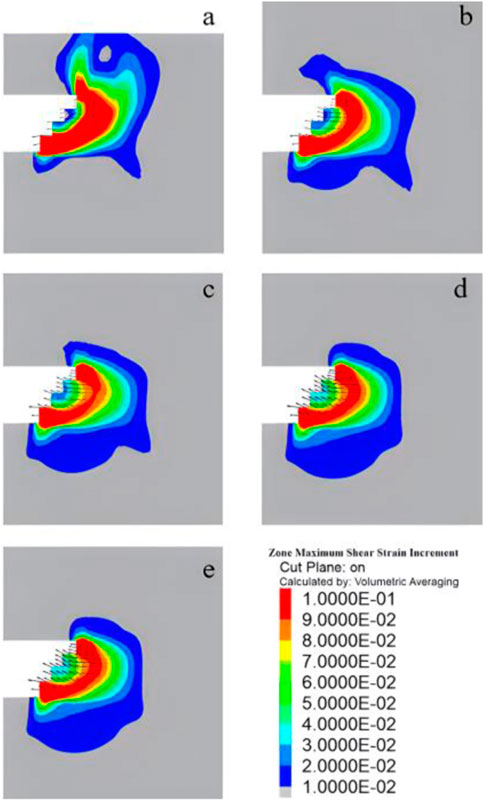
FIGURE 20. Stress nephogram with different buried depths of (A) 10 m, (B) 20 m, (C) 30 m, (D) 40 m and (E) 50 m.
As shown in Table 3, when a buried depth of 10 m, the safety factor of the tunnel face is 1.75. As the buried depth increases, the safety factor progressively decreases. When the buried depth reaches 50 m, the safety factor drops to 1.025, indicating a high vulnerability of the tunnel face to damage. In conclusion, when excavating tunnels in sandstone strata with a constant stone content and tunnel diameter, the stability of the tunnel face deteriorates with increasing buried depth.
4.3 Effect of tunnel diameter
In working condition 3, simulations were conducted on tunnel models with a 10% stone content and a 30 m buried depth, with five different tunnel diameters: 11.75 m, 12.75 m, 13.75 m, 14.75 m, and 15.75 m. The displacement of the face and the soil in front of the face varied with the tunnel diameter, as depicted in Figure 21. Analysis of Figure 21 reveals that the largest displacement of the face and the soil in front of the face occurred at the tunnel diameter, while the soil above and below the face exhibited slight displacements in an elliptical shape. As the tunnel diameter increased, the displacement of the soil in the upper part in front of the face gradually increased, and the area of soil deformation in front of the face gradually expanded. Figure 22 presents the shear strain of the soil in front of the face as the tunnel diameters changed. It is evident from the figure that the shear strain of the soil in front of the face increased with the increase in tunnel diameter.
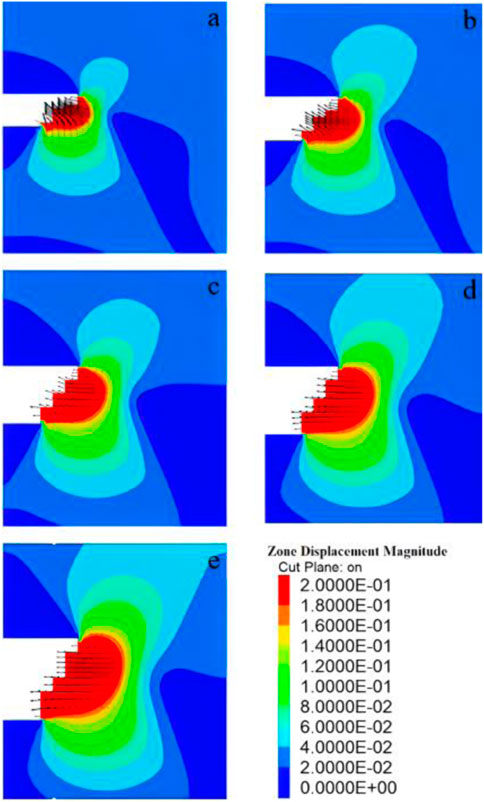
FIGURE 21. Displacement nephogram in front of tunnel face with different tunnel diameters of (A) 11.75 m, (B) 12.75 m, (C) 13.75 m, (D) 14.75 m and (E) 15.75 m.
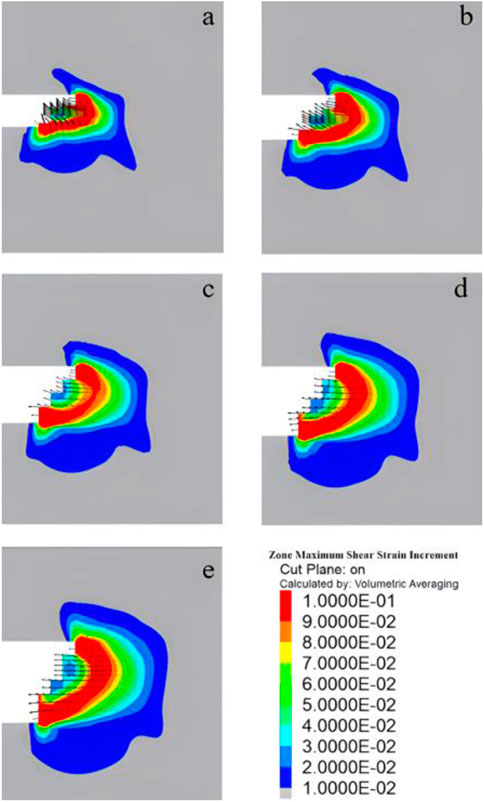
FIGURE 22. Stress nephogram with different tunnel diameters of (A) 11.75 m, (B) 12.75 m, (C) 13.75 m, (D) 14.75 m and (E) 15.75 m.
In Table 3, when the tunnel diameter was 11.75 m, the calculated safety factor of the face was 1.4. Considering the displacement and shear strain of the soil in front of the face, the stability of the face was deemed satisfactory at this point. However, as the tunnel diameters increased to 15.75 m, the safety factor of the face decreased to 1.175. At this stage, a large area of soil displacement in front of the face and significant shear strain were observed, indicating that the face became unstable and susceptible to damage during excavation. Consequently, it can be concluded that under constant stone content and buried depth conditions, the stability of the tunnel face diminishes with increasing tunnel diameters during the excavation of the sandy cobble tunnel.
5 Conclusion
Based on the inhomogeneity of the sand-cobble stratum, this paper has developed a numerical model to investigate tunnel excavation under different stone contents. The model combines numerical simulation, the finite difference program FLAC3D, and the strength reduction method to provide a more comprehensive understanding of the stability evaluation mechanism of the tunnel face in the sand-cobble stratum. The following conclusions were drawn in order to analyze the influence of various factors on the stability of the tunnel face and to examine the stability under various working conditions.
(1) When the stone content increases from 0% to 40% under the same confining pressure, the maximum shear strength of the sand-cobble soil increases accordingly. This suggests that a higher stone content in the sand-cobble stratum enhances the macroscopic strength of the material.
(2) The stability of the tunnel face can be evaluated using the strength reduction method with the characteristic point mutation criterion as the instability criterion. This method enables the calculation of the stability safety factor of the face and provides a novel approach for assessing tunnel face stability.
(3) Prior to damage, the tunnel face in the sand-cobble stratum experiences extrusion deformation, with the maximum deformation occurring in the face and the soil in front of it. The development of damage tends to initiate from the front of the face.
(4) The stone content in the sand-cobble stratum significantly affects the stability of the tunnel face. As the stone content increases, the stability of the tunnel face gradually improves. Additionally, the tunnel excavation depth and diameter have a significant impact on the stability of the tunnel face. Increasing the depth and diameter of the tunnel excavation leads to a decrease in the stability of the tunnel face.
Data availability statement
The original contributions presented in the study are included in the article/supplementary material, further inquiries can be directed to the corresponding authors.
Author contributions
HX: methodology, writing–original draft. LL: investigation, resources. XG: investigation, resources. YiZ: software, formal analysis, methodology, writing–review and editing. HW: conceptualization, methodology, supervision. All authors contributed to the article and approved the submitted version.
Funding
This research is financially supported by the Key R&D and Transformation Plan of Qinghai Province (2021-SF-167).
Conflict of interest
Authors HW, LL, and XG were employed by Qinghai Traffic Investment Co., Ltd and Qinghai Xihu Expressway Management Co., Ltd; JZ and YZ were employed by China National Logging Corporation.
The remaining authors declare that the research was conducted in the absence of any commercial or financial relationships that could be construed as a potential conflict of interest.
Publisher’s note
All claims expressed in this article are solely those of the authors and do not necessarily represent those of their affiliated organizations, or those of the publisher, the editors and the reviewers. Any product that may be evaluated in this article, or claim that may be made by its manufacturer, is not guaranteed or endorsed by the publisher.
References
Augarde, C. E., Lyamin, A. V., and Sloan, S. W. (2003). Stability of an undrained plane strain heading revisited. Comput. Geotechnics 30 (5), 419–430. doi:10.1016/s0266-352x(03)00009-0
Barrett, P. J. (1980). The shape of rock particles, a critical review. Sedimentology 27 (3), 291–303. doi:10.1111/j.1365-3091.1980.tb01179.x
Bishop, A. W. (1955). The use of the slip circle in the stability analysis of slopes. Geotechnique 5 (1), 7–17. doi:10.1680/geot.1955.5.1.7
Chen, R. P., Li, J., Kong, L. G., and Tang, L. j. (2013). Experimental study on face instability of shield tunnel in sand. Tunn. Undergr. Space Technol. Incorporating Trenchless Technol. Res. 33 (Jan.), 12–21. 3. doi:10.1016/j.tust.2012.08.001
Chen, R. P., Tang, L. J., Ling, D. S., and Chen, Y. (2011). Face stability analysis of shallow shield tunnels in dry sandy ground using the discrete element method. Comput. Geotechnics 38 (2), 187–195. doi:10.1016/j.compgeo.2010.11.003
Das, N. (2007). Modeling three-dimensional shape of sand grains using discrete element method[M]. University of South Florida.
Espada, M., Muralha, J., Lemos, J. V., Jiang, Q., Feng, X. T., Fan, Q., et al. (2018). Safety analysis of the left bank excavation slopes of Baihetan arch dam foundation using a discrete element model. Rock Mech. Rock Eng. 51, 2597–2615. doi:10.1007/s00603-018-1416-2
Guo, X., Dias, D., Carvajal, C., Peyras, L., and Breul, P. (2018). Reliability analysis of embankment dam sliding stability using the sparse polynomial chaos expansion. Eng. Struct. 174, 295–307. doi:10.1016/j.engstruct.2018.07.053
Hall, E. (1951). A triaxial apparatus for testing large soil specimens. Triaxial testing of soils and bitminous mixtures. ASTM International.
Han, K., Zhang, C., Li, W., and Guo, C. (2016a). Face stability analysis of shield tunnels in homogeneous soil overlaid by multilayered cohesive-frictional soils. Math. Problems Eng. 2016, 1–9. doi:10.1155/2016/1378274
Han, K., Zhang, C., and Zhang, D. (2016b). Upper-bound solutions for the face stability of a shield tunnel in multilayered cohesive–frictional soils. Comput. Geotechnics 79, 1–9. doi:10.1016/j.compgeo.2016.05.018
Hoek, E., Marinos, P., and Benissi, M. (1998). Applicability of the Geological Strength Index (GSI) classification for very weak and sheared rock masses. The case of the Athens Schist Formation. Bull. Eng. Geol. Environ. 57, 151–160. doi:10.1007/s100640050031
Huang, F., Li, Z., and Ling, T. (2016). Upper bound solution of safety factor for shallow tunnels face using a nonlinear failure criterion and shear strength reduction technique. Math. Problems Eng. 2016, 1–8. doi:10.1155/2016/4832097
Huang, M., Li, S., Yu, J., and Tan, J. Q. W. (2018) Continuous field based upper bound analysis for three-dimensional tunnel face stability in undrained clay. Comput. Geotech. 94, 207–213.
Iannacchione, A. T., and Vallejo, L. E. (2000) Shear strength evaluation of clay-rock mixtures. Slope Stab. 209–223.
Jafari, M. K., and Shafiee, A. (2004). Mechanical behavior of compacted composite clays. Can. Geotechnical J. 41 (6), 1152–1167. doi:10.1139/t04-062
Jiang, Y., Yong, F., and He, C. (2015). Study on delayed settlement formation induced by shield tunneling in sandy cobble strata. Chin. J. Undergr. Space Eng.
Jian, P. J., Lu, J. F., and Zhong, Y. Z. (2016). Study on strength parameter of sandy pebble soil based on different density and moisture content. Sci. Technol. Eng. 16 (24), 257–261.
Kalender, A. Y. C. A. N., Sonmez, H., Medley, E., Tunusluoglu, C., and Kasapoglu, K. E. (2020). An approach to predicting the overall strengths of unwelded bimrocks andbimsoils. IEng. Geol. 183, 65–79.
Li, W., and Zhang, C. (2020). Face stability analysis for a shield tunnel in anisotropic sands. Int. J. Geomechanics 20 (5), 04020043. doi:10.1061/(asce)gm.1943-5622.0001666
Li, W., Zhang, C., Zhang, D., Ye, Z., and Tan, Z. (2022). Face stability of shield tunnels considering a kinematically admissible velocity field of soil arching. J. Rock Mech. Geotechnical Eng. 14 (2), 505–526. doi:10.1016/j.jrmge.2021.10.006
Lindquist, E. S. (1994). The strength and deformation properties of melange. Berkeley: University of California.
Liu, H. N., Zhang, Y. F., and Liu, H. D. (2019). Experimental study on active failure modes of slurryshield-driven tunnel faces in sand. Chin. J. Rock Mech. Eng., 572–581. March 2019).
Medley, E., and Goodman, R. E. (1994). Estimating the block volumetric proportions of melanges and similar block-in-matrix rocks (bimrocks). OnePetro. 1st North American Rock Mechanics Symposium.
Medley, E. W., and SanzRehermann, P. F. (2004). Characterization of bimrocks (rock/soil mixtures) with application to slope stability problems. Proc. EUROCK.
Mollon, G., and Zhao, J. (2012). Fourier-Voronoi-based generation of realistic samples for discrete modelling of granular materials. Granul. matter 14 (5), 621–638. doi:10.1007/s10035-012-0356-x
Napoli, M. L., Barbero, M., Ravera, E., and Scavia, C. (2018a). A stochastic approach to slope stability analysis in bimrocks. Int. J. Rock Mech. Min. Sci. 101, 41–49. doi:10.1016/j.ijrmms.2017.11.009
Napoli, M. L., Barbero, M., and Scavia, C. (2018b). Analyzing slope stability in bimrocks by means of a stochastic approach. ISRM, OnePetro.
Napoli, M. L., Barbero, M., and Scavia, C. (2021). Tunneling in heterogeneous rock masses with a block-in-matrix fabric. Int. J. Rock Mech. Min. Sci. 138, 104655. doi:10.1016/j.ijrmms.2021.104655
Qiao, J. L., Zhang, Y. T., and Gao, J. (2010). Application of strength reduction method to stability analysis of shield tunnel face. J. Tianjin Univ. 43 (1), 14–20.
Shiau, J., and Asadi, F. (2020). Stability analysis of twin circular tunnels using shear strength reduction method. Geotech. Lett. 10 (2), 311–319. doi:10.1680/jgele.19.00003
Ukritchon, B., and Keawsawasvong, S. (2019b). Design equations of uplift capacity of circular piles in sands. Appl. Ocean Res. 90, 101844. doi:10.1016/j.apor.2019.06.001
Ukritchon, B., and Keawsawasvong, S. (2019a). Lower bound solutions for undrained face stability of plane strain tunnel headings in anisotropic and non-homogeneous clays. Comput. Geotechnics 112, 204–217. doi:10.1016/j.compgeo.2019.04.018
Ukritchon, B., and Keawsawasvong, S. (2017). Three-dimensional undrained tunnel face stability in clay with a linearly increasing shear strength with depth. Comput. geotechnics 88, 146–151. doi:10.1016/j.compgeo.2017.03.013
Ukritchon, B., Yoang, S., and Keawsawasvong, S. (2019). Three-dimensional stability analysis of the collapse pressure on flexible pavements over rectangular trapdoors. Transp. Geotech. 21, 100277. doi:10.1016/j.trgeo.2019.100277
Wang, Y., Zhao, M., Li, S., and Wang, J. G. (2005). Stochastic structural model of rock and soil aggregates by continuum-based discrete element method. Sci. China Ser. E Eng. Mater. Sci. 48, 95–106.
Xia, C., Xu, C., and Zhao, X. (2012). Study of the strength reduction DDA method and its application to mountain tunnel. Int. J. Comput. Methods 9 (03), 1250041. doi:10.1142/s0219876212500417
Xing, C., and Jianlin, L. I. (2010). The strength reduction method based on ADINA, ANSYS and FLAC. Hydrogeology Eng. Geol. 37 (3), 69–73.
Xu, W. J., Zhang, H. Y., and Xu, Q. (2014). Numerical simulations of direct shear test with soil-rock mixture using discrete element method. Chin. J. Comput. Mech. 31 (2), 228–234.
Xue, Y., Huang, H., and Griffiths, D. V. (2012). Specimen reconstitution and uniaxial compressive strength testing of rock-soil mixtures. Adv. Ground Technol. Geo-Information 289.
Yang, X., and Huang, F. (2009). Stability analysis of shallow tunnels subjected to seepage with strength reduction theory. J. Central South Univ. Technol. 16 (6), 1001–1005. doi:10.1007/s11771-009-0166-4
Zhang, C., Han, K., and Zhang, D. (2015). Face stability analysis of shallow circular tunnels in cohesive–frictional soils. Tunn. Undergr. Space Technol. 50, 345–357. doi:10.1016/j.tust.2015.08.007
Zhang, L. M., Zheng, Y. R., and Wang, Z. Q. (2007). Application of strength reduction finite element method to road tunnels. Yantu Lixue (Rock Soil Mech. 28 (1), 97–101.
Zhang, S., Zeng, Y. W., and Xia, L. (2016). Numerical study on the influence of rock mass content on the stability of soil rock mixture slope. J. Yangtze River Sci. Res. Inst. 33 (5), 83–87.
Zhang, Y., Chen, G., Wang, Z., and Liu, D. (2023). Fracture evolution analysis of rock bridges in hard rock with nonparallel joints in true triaxial stress states. Rock Mech. Rock Eng. 56, 997–1023. doi:10.1007/s00603-022-03117-x
Zhang, Y. X., Hu, J. Y., and He, Q. Y. (2006). On rational clear spacing of tunnel with small clear spacing based on strength reduction technique. Hydrogeology Eng. Geol. (3), 64–67.
Zheng, Y. R., Qiu, C. Y., and Zhang, H. (2008). Exploration of stability analysis methods for surrounding rocks of soil tunnel. Chin. J. Rock Mech. Eng. 27 (10), 1968–1980.
Keywords: numerical simulation, sandy cobble stratum, stability of tunnel face, stone content, safety factor
Citation: Xue H, Wang H, Li L, Gong X, Zhao Y, Zhao J and Zhang Y (2023) Influence of stone content on face stability for tunnels in sandy cobble strata. Front. Earth Sci. 11:1200079. doi: 10.3389/feart.2023.1200079
Received: 04 April 2023; Accepted: 31 May 2023;
Published: 19 June 2023.
Edited by:
Yubing Liu, China University of Mining and Technology, ChinaReviewed by:
Xiangfeng Guo, National University of Singapore, SingaporeZhanping Song, Xi’an University of Architecture and Technology, China
Chen Dongfang, Wuhan University of Technology, China
Yan Zhang, Chengdu University of Technology, China
Copyright © 2023 Xue, Wang, Li, Gong, Zhao, Zhao and Zhang. This is an open-access article distributed under the terms of the Creative Commons Attribution License (CC BY). The use, distribution or reproduction in other forums is permitted, provided the original author(s) and the copyright owner(s) are credited and that the original publication in this journal is cited, in accordance with accepted academic practice. No use, distribution or reproduction is permitted which does not comply with these terms.
*Correspondence: Haoteng Wang, SXJvbmhvb2ticm90aGVyQGdtYWlsLmNvbQ==; Ying Zhao, Wmhhb3lpbjg1NkAxMjYuY29t