 Shu Ma1,2
 Shixing Fan
- 1School of Safety Engineering, China University of Mining and Technology, Xuzhou, China
- 2Guizhou Energy Industry Research Institute Co., Ltd., Guiyang, China
- 3College of Safety Science and Engineering, Xi’an University of Science and Technology, Xi’an, China
- 4China Railway Construction Co., Ltd. China Railway 17th Bureau Group, Taiyuan, China
To solve the construction ventilation problem of super long (length greater than 10000 m) tunnel passing through discrete lenticular gas bag tunnel under complex working conditions in carbonaceous shale stratum, relying on the construction of Banzhulin tunnel of the new Xuyong-Bijie Railway (Sichuan-Yunnan). Using the finite element analysis software, the flow field distribution of the tunnel return air flow in the case of simultaneous excavation of multiple working faces is simulated, and the formation position and influence range of the vortex area which is easy to form gas accumulation are analyzed. On this basis, the technical team developed the PLC uninterruptible self starting ventilation power supply control program. By comparing the changes in the time required for ventilation power supply failure before and after the adoption of this technology, and the comparison of the gas concentration in the return air flow within a relatively short time of the failure, it is proved that this technology reduces the fault response time to 15.74% of the original time, and can well avoid gas accumulation within the failure time, It provides some reference for similar engineering construction.
1 Introduction
With the continuous increase of the Chinese government’s investment in infrastructure construction, a number of typical and difficult projects began to appear in front of the world. Taking the construction of Sichuan-Tibet Railway Project (Ya’an-Lingchi) as an example, there are 198 tunnels with a length of 1,223.5 m 451 km, accounting for 70.5% of the total length of the line 1%, 46 extra long tunnels (railway tunnels with a length of more than 10 km) with a length of 724 441 km. At the same time, it is faced with complex geological coupling problems such as high intensity, high ground stress rock-burst, large deformation of soft rock, high ground mild active fault, toxic and harmful gas and so on. From this point of view, the efficient construction ventilation technology suitable for long and long tunnels under special geological conditions is not only a major problem faced by builders, but also a hot spot and focus of scientific research and technical personnel.
Researchers at home and abroad have carried out early research on the ventilation mode of single head tunneling in tunnel construction, the distribution law of air flow field, the diffusion and migration law of toxic and harmful gases in the tunnel. Through the design optimization and field verification of the location and diameter of the new shaft in the super long tunnel, it shows that the thermal potential difference has a great impact on the natural ventilation effect. Finally, the effect of energy saving and consumption reduction is achieved by reducing the number of jet fans in the original ventilation system (Zhang et al., 2018). When the tunnel construction passes through the complex stratum containing coal seams, the tunnel will often face the risk of gas accidents (Liu et al., 2023a; Liu et al., 2023b; Mi et al., 2023; Wen et al., 2023). Therefore, it is very important to choose the appropriate ventilation mode. A highway tunnel in Hunan, China has tested the distribution of air flow velocity and gas concentration under different ventilation modes. Different forms of vortex zones are formed by pressure ventilation, extraction ventilation and mixed ventilation. The gas concentration in the vortex zone is higher than that in the non-vortex zone, and the effect of mixed ventilation mode is the best among the three ventilation modes (Zhang et al., 2021). The air flow experiment at the intersection of the main tunnel and the inclined shaft of Zagros tunnel shows that the H2S gas concentration distribution at the main tunnel, the main tunnel and the inclined shaft fork is mainly affected by the length, slope and air inlet speed of the tunnel. The H2S gas concentration distribution decreases in the form of gradient along the tunnel to the tunnel outlet, and the greater the tunnel slope, the greater the H2S gas concentration at the bottom of the tunnel and the longer the tunnel, The more uniform the concentration distribution of H2S gas in the whole tunnel, increasing the air volume of fresh air flow in the tunnel will reduce the H2S gas concentration in the whole tunnel, but it has no effect on the gas concentration distribution law in the tunnel (Ahmadi and Hekmat, 2021). However, with the development and popularization of computer technology, many scholars and engineers have made more extensive and in-depth research on tunnel ventilation by using numerical simulation technology. The field test of Longgu No. 2 auxiliary tunnel analyzes the influence of different distances between the air duct outlet and the tunnel face on the distribution law of air flow and dust concentration in the tunnel under the condition of forced ventilation, and obtains the mathematical relationship between the different distances between the air duct outlet and the tunnel face as the independent variable and the distribution field of high concentration dust as the dependent variable, so as to provide theoretical guidance for tunnel construction ventilation and dust prevention (Liu et al., 2019). There are many geothermal anomaly zones near Hengduan Mountains in China. Tunnels constructed and operated in this area are facing the problem of high ground temperature. Based on this, a cross-sectional convection conduction model is established for longitudinally ventilated tunnels. In the process of numerical simulation and reduced size model test of Gaoligongshan tunnel, the effects of ventilation frequency and longitudinal wind speed on the ambient temperature in the tunnel are simulated and obtained the distribution laws of surrounding rock temperature field and air flow field in the tunnel (Zeng et al., 2020). When a fire occurs in the tunnel, different oxygen concentrations in the tunnel air will have different dynamic effects on the fire. The oxygen concentration in the tunnel is adjusted by mixing oxygen with inert gases such as nitrogen and carbon dioxide, and the reduced size tunnel is simulated by CFD fluid calculation software. The analytical expression describing the importance of oxygen content to tunnel fire dynamics is established. It is concluded that the maximum temperature of tunnel roof, the maximum heat flow of tunnel roof and floor can be controlled by adjusting the oxygen concentration Changes of parameters such as maximum heat release rate and fire growth rate (Khattri et al., 2019). It can be seen that the efficient ventilation system plays a good role in optimizing the air quality in the tunnel and reducing the concentration of harmful gases. Therefore, based on the original ventilation design of Zhongyuan tunnel, fluent software is used, relying on K-ε turbulence model, establish a three-dimensional model of the tunnel, simulate the operation effects of different combinations of four fans in the tunnel, and finally determine the new combination form of ventilation fans composed of a group of double parallel fans and two groups of single fans, which is 5.7% higher than the tunnel air flow velocity in the original ventilation design (Pei and Pan, 2014). In addition to the influence of the distance between the air outlet of the air duct and the tunnel face, the air flow field in the tunnel is also affected by other main influencing factors, such as the excavation mode of the tunnel face, the length and height of the steps when the step method is used for construction, etc. When optimizing the distribution of air flow field in a tunnel, the optimization parameters of improving ventilation efficiency and reducing energy consumption in the tunnel are obtained by using TOPSIS theory and CFD fluid simulation software (Wu et al., 2021). In order to ensure the accuracy of numerical simulation results, the distribution of air flow velocity in the tunnel is studied by using numerical simulation technology and field in-situ measurement method, focusing on the key factors that may affect the accuracy of numerical simulation results (Wen et al., 2022). Through the comparison of results, only a few points with large errors are observed near the tunnel wall, so as to ensure the accuracy and reliability of numerical simulation calculation (Krol et al., 2019).
It can be seen that scholars and engineering technicians at home and abroad have done a lot of work on long-distance tunnel ventilation, high gas tunnel ventilation, numerical simulation of air flow field distribution in the tunnel and gas concentration migration law in the tunnel, optimization of ventilation scheme, etc., but for the multi working faces facing horizontal and horizontal inclined shafts in the main tunnel, the research on construction ventilation of ‘special-shaped’ extra long high gas railway tunnel under the coupling effect of high-risk source of lenticular cystic gas, which is very difficult to detect, is very rare. Therefore, this study takes the construction ventilation of the Banzhulin Tunnel (as shown in Figure 1), a controlled engineering project along the newly built Xubi Railway (Sichuan Yunnan Section), as the engineering background. COMSOL Multiphysics, a multi physical field fluid calculation software, is used to simulate and calculate the transport law of return air flow in the tunnel under different working conditions such as double and multiple working faces, as well as the turbulent flow law of the “Y-shaped” fork, And together with project technicians, we developed a PLC dual power supply full time stable and self starting air supply control program, which greatly reduces the construction risk of unknown cystic gas sources in the tunnel transverse tunnel construction area, ensures construction progress and safety, and provides a theoretical and technical basis for similar tunnel construction in southwestern China.
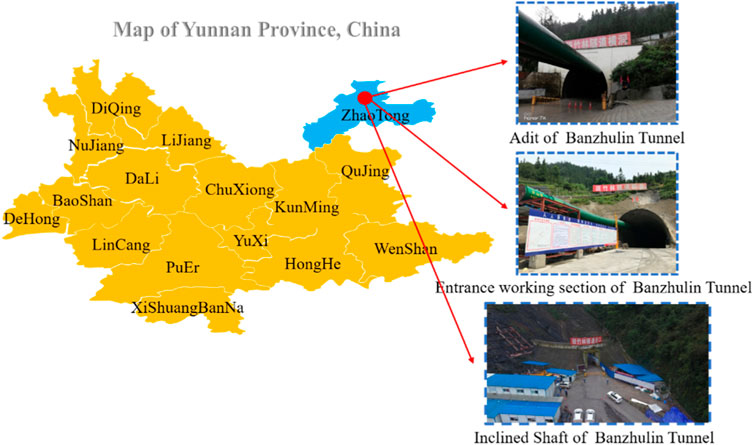
FIGURE 1. Banzhulin tunnel site.
2 Theory
2.1 Conditional hypothesis
The following assumptions are made for the air flow in the tunnel: ①Ignoring the friction and heat dissipation between the air flow and the tunnel wall during the movement, the whole air flow field is defined as a constant temperature flow field. The tunnel wall is in an isothermal state, and there is no chemical reaction during the air flow movement (Giuseppe and Massimo, 2001).②The wind flow can continuously fill the whole tunnel during movement, which will be regarded as continuous medium (Mats. 2000).③The air flow velocity in the tunnel is relatively slow and will not cause significant changes in temperature and pressure in the tunnel. The impact of changes in air flow density and volume on the final calculation results can be ignored, and the air flow is regarded as incompressible fluid (Wang et al., 2010).④The wind flow in the tunnel is regarded as steady-state turbulence, which has isotropic turbulent viscosity, and the aerodynamic viscosity coefficient is treated as a scalar (Du and Bian, 2018).
2.2 Governing equations
Tunnel air flow follows three basic laws: mass conservation, momentum conservation and energy conservation. In this simulation, the turbulence or eddy current of the return air flow at the “Y-shaped” fork under different working conditions is mainly studied. Therefore, on the basis of following the basic laws, the turbulent transport and eddy current conduction need to be considered. Therefore, when simulating the air flow in the tunnel, it is regarded as an incompressible stable turbulence. Using the model of
Where: η is the viscosity coefficient of fluid molecules; ηt is the turbulent viscosity coefficient; p is the fluid pressure, Pa;ρis the density of air, kg/m3; c1 and c2 are constants; τε is eddy current shear stress (Reynolds stress), Pa; ε is eddy viscosity, m2/s.
In the above equation, Eqs. 1-1, 1-2, 1-3 are the specific expressions of SA in Eq. 1 respectively, Eq. 2 is the continuity equation and Eq. 3 is the fluid eddy current momentum flux, u/v/w represent the velocity components in x/y/z directions respectively. When A is equal to u/v/w Eq. 1 represents the momentum equation, and SA of equation 1-1) represents Su, Sv and Sw respectively. When A is equal to k, Eq. 1 represents the turbulent k-equation and Eq. 1-2 represents Sk. When A is equal to ε, Eq. 1 represents the equation of turbulent kinetic energy dissipation rate ε, and Eq. 1-3 represents Sε.
3 Numerical simulation
3.1 Model establishment
The main tunnel of Banzhulin tunnel has a total length of 12758 m and a maximum buried depth of 570 m. It is divided into three work areas: main tunnel (5848 m), adit (3500 m) and inclined shaft (3410 m). The adit work area includes flat guide tunnel (3,641.3 m) and transverse passage (spacing 420 m). In the process of numerical simulation, there have been a lot of previous studies on the flow field distribution in single head forced ventilation, which will not be repeated here. This study focuses on the simulation and calculation of the return air flow field distribution in the first, second and third stages of ventilation in the cross tunnel work area. The layout of ventilation stages and ventilation equipment in each construction is shown in Figure 2.
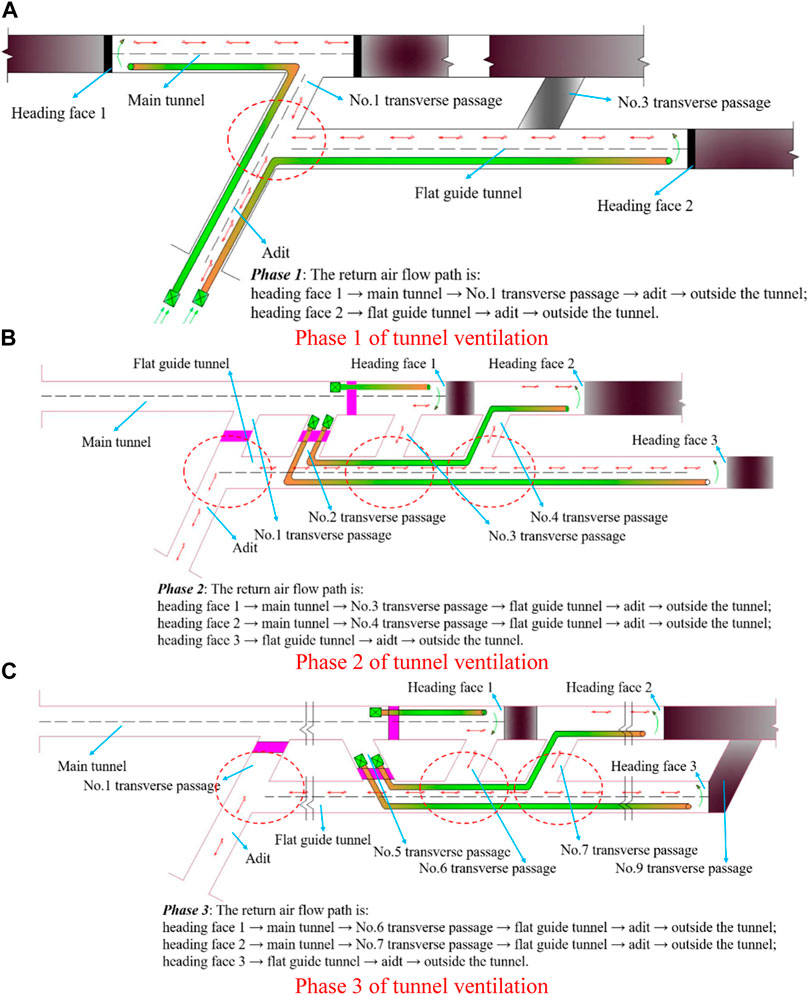
FIGURE 2. Ventilation and equipment layout in different phases. (A) Phase 1 of tunnel ventilation. (B) Phase 2 of tunnel ventilation. (C) Phase 3 of tunnel ventilation.
The physical model is established according to the actual situation of Banzhulin tunnel, and the three working conditions in Figure 2 are analyzed respectively. The dimensions are set according to the actual dimensions of the tunnel, as shown in Table 1. The advancing direction of the tunnel heading face is the negative direction of the Z-axis. The heading face is on the X-Y plane, and the diameter of the air duct in the main tunnel is 1.5m, and the diameter of the air duct in the flat guide tunnel is 1.6 m.
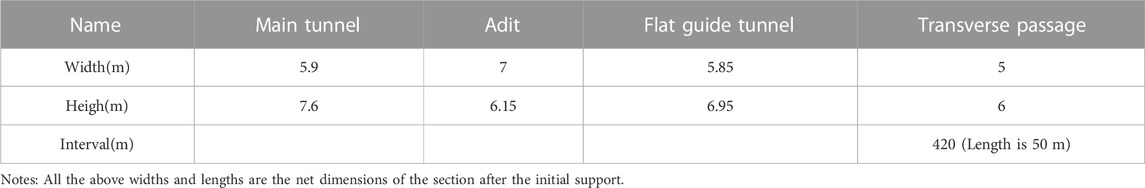
TABLE 1. Physical model size.
3.2 Parameter selection and boundary condition setting
The air outlet of the air duct is selected as the speed inlet in different stages. The inlet wind speed is different according to the ventilation distance, as shown in Table 2. The adit inlet is selected as the pressure outlet of total return air flow, and the relative pressure is set as 0Pa. All walls in the tunnel are defined as fixed walls, which are non-slip and insulated. The parameter selection of the model is shown in Table 3.
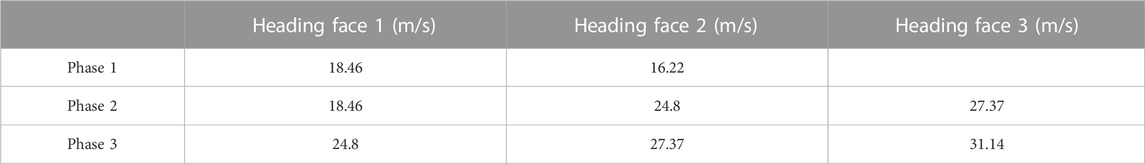
TABLE 2. Inlet wind speed at different phases.

TABLE 3. Model parameter setting.
3.3. Analysis of gas accumulation position in return air flow
It can be seen from Figure 2 that the return air flow of ventilation in each stage converges to the cross tunnel from everywhere and then is discharged out of the tunnel. At the same time, according to the previous deep hole exploration data, irregular lenticular cystic gas sources are distributed in the surrounding rock of the adit and flat guide tunnel. In this study, we focus on the velocity (Figure 3), pressure (Figure 4), shear rate (Figure 5), eddy current (Figure 6) of the return air flow which are located at the “Y-shaped” turnout of the adit and flat guide tunnel, and at the fork of the flat guide tunnel and transverse passage, as follows.
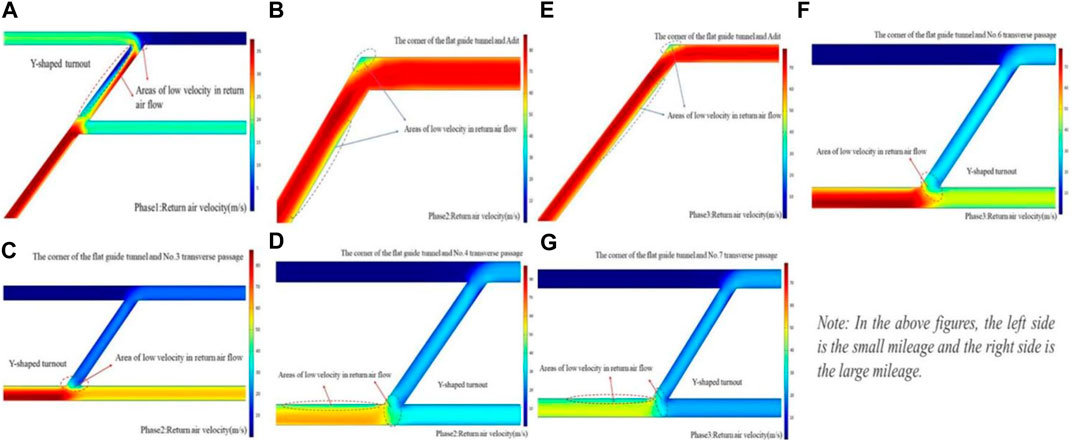
FIGURE 3. Areas with low wind speed in return air flow at each phase.
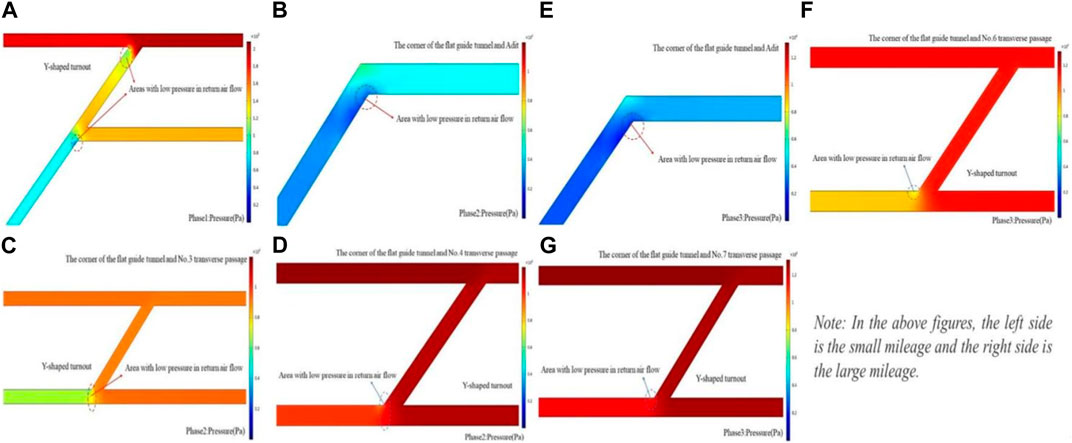
FIGURE 4. Areas with low pressure in return air flow at each phase.
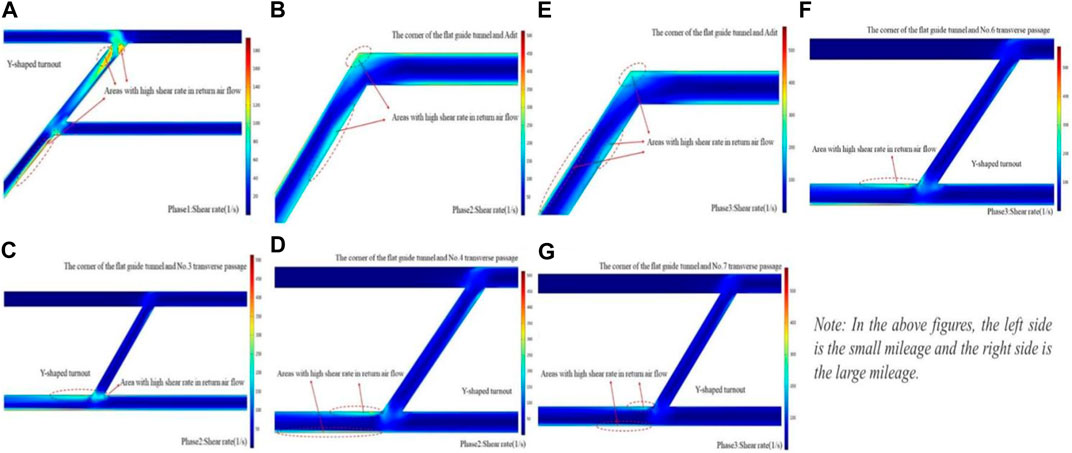
FIGURE 5. The areas with high shear rate in the return air flow at each stage.
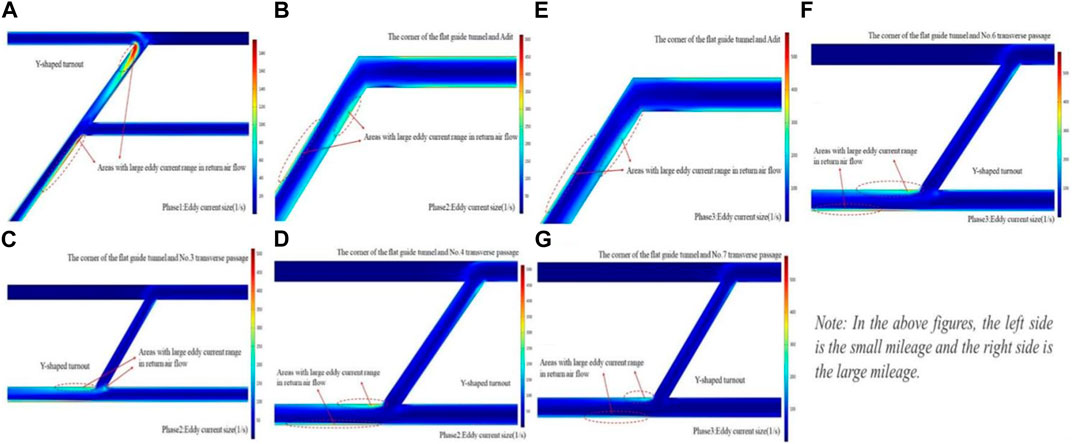
FIGURE 6. Vortex size in return air flow at each stage.
Figure 3 shows the area with small wind speed in the return air flow of three different ventilation phases. In phase 1, as shown in Figure 3A, the areas with low wind speed are mainly concentrated in the following positions: the corner of main tunnel and adit (large mileage side); Half of the space of the adit (small mileage side), with a length of about 38 m. In phase 2, as shown in Figures 3B–D, the areas with small wind speed are mainly concentrated in the following positions: the corner of flat guide tunnel and adit (small mileage side); The wall attached strip area (large mileage side) in adit is about 200 m; The intersection of flat guide tunnel and transverse passages of No. 3 and No. 4 respectively; The wall attached strip area near No.4 transverse passage in flat guide tunnel (main tunnel side) is about 140 m. In phase 3, as shown in Figures 3E–G, the areas with low wind speed are mainly concentrated in the following positions: the corner of flat guide tunnel and adit (small mileage side); The wall attached strip area (large mileage side) in adit is about 200 m; The corners of the flat guide tunnel and transverse passages of No. 6 and No. 7 respectively; The wall attached strip area near the transverse passage of No. 7, and on the side of the main tunnel in the flat guide tunnel is about 140 m.
The figures in Figure 4 show the areas with low pressure in the return air flow. In phase 1, as shown in Figure 4A, the areas with low pressure are mainly at the following positions: the corner of adit and main tunnel (small mileage side); The corner of adit and flat guide tunnel (large mileage side). In phase 2, as shown in Figures 4B–D, the areas with low pressure are mainly concentrated in the following positions: the corner of flat guide tunnel and adit (large mileage side); The intersection of flat guide tunnel and No. 3 transverse passage and No. 4 transverse passage. In phase 3, as shown in Figures 4E–G, the low pressure areas are mainly concentrated at the corner of flat guide tunnel and adit (large mileage side), and the intersection of flat guide tunnel and No. 3, No. 4 transverse passage.
Figure 5 shows the area with large shear rate in the return air flow in different ventilation stages. The shear rate of return air flow in a tunnel refers to the velocity at which the fluid decreases at right angles. The greater the shear rate, the more the smaller the velocity at this position, and the smaller the wind speed, the easier it is to form gas accumulation. In phase 1, as shown in Figure 5A, the areas with large shear rate are mainly concentrated in adit near the main tunnel (middle of the tunnel and large mileage side), and the wall attached strip area near the flat guide tunnel of adit (large mileage side), with a length of about 60 m. In phase 2, as shown in Figures 5B–D, the areas with large shear rate are concentrated in the following positions: the corner of transverse passage and flat guide tunnel (small mileage side); The wall attached strip area near the corner in adit (large mileage side), with a length of about 60 m; The wall attached strip area near No. 3, No. 4 transverse passage corners in the flat guide tunnel (both sides of the wall exist), with a length of about 43 m. In phase 3, as shown in Figures 5E–G, the areas with large shear rate are basically the same as that in phase 2. Due to the different wind speeds at the air outlet of heading faces, a wall attached strip area (small mileage side) is added in adit, which is more close to the return air outlet, with a length of about 108 m.
Figure 6 shows the sizes of vortex area in different ventilation stages. Unlike Figures 3, 4, 5, which confirm the vortex position from wind speed, pressure and shear rate respectively, the expression of vortex size in the whole return air flow channel in Figure 6 is more intuitive and clear. In phase 1, as shown in Figure 6A, the eddy current range is the largest at the corner of the main tunnel and the adit near the tunnel center line, and at the wall attached strip area (large mileage side) near the flat guide corner in adit, with a length of about 10 m. In phase 2, as shown in Figures 6B–D, the eddy current is the largest in the wall attached strip area near the corner of the flat guide tunnel (both the large mileage side and the small mileage side) in adit and the wall attached strip area near transverse passages of No. 3 and No. 4 in the flat guide tunnel. In phase 3, as shown in Figures 6E–G, the positions of the area with large eddy current are the same as that in phase 2. The length of the eddy current region is basically consistent with that of the region with large shear rate.
To sum up, the wind speed, pressure and shear rate of return air flow can reflect the position where vortex is easy to occur in the return air flow channel. According to the statements in Figures 3, 4, 5, combined with the situation that there are irregularly distributed bladder gas sources in the adit and flat guide tunnel surrounding rock of Banzhulin tunnel, and they escape into the tunnel through the cracks of surrounding rock and tunnel bottom. In adit: the key parts include the corner positions on both sides at the intersection of the main tunnel, the wall attached strip area on both sides, the corner positions on both sides at the flat guide corner and the wall attached strip area on the side of large mileage. In the flat guide tunnel, the key parts include the air flow intersection at the corner of each transverse passage and adit, the corner position on the obtuse angle side and the wall attached strip area near the main tunnel on the small mileage side. The position and size of vortex obtained in different ventilation stages are basically the same. The greater the shear rate at the corner in the return air flow channel, the smaller the wind speed and wind pressure. Such parts are easy to form vortex areas, resulting in gas accumulation (Huang. 1999; Wang et al., 1999; Wang. 2009; Park et al., 2018; Ren et al., 2018). The expression of the eddy current size formed in the return air flow channel under different ventilation conditions in Figure 6 confirms with the expression of the eddy current occurrence position determined in Figures 3, 4, 5.
4 Field measurement and technical measures
4.1 Filed measurement
Because the Banzhulin Tunnel is located in the mountainous area, the construction electricity is supplied by non-permanent lines, and sometimes the main power supply is cut off. The transverse tunnel of Banzhulin tunnel is a high gas area and the unknown parts of surrounding rock continue to diffuse gas into the tunnel, which is easy to cause gas accumulation in the tunnel and seriously affect the construction safety. Therefore, multi-parameter gas real-time sensor is arranged in the vault of tunneling working face, in front of the excavation bench, at each corner of the tunnel and in front of the secondary lining trolley. These sensors transmit real-time data to the centralized control center outside the tunnel through the explosion-proof wire, as shown in Figure 7.
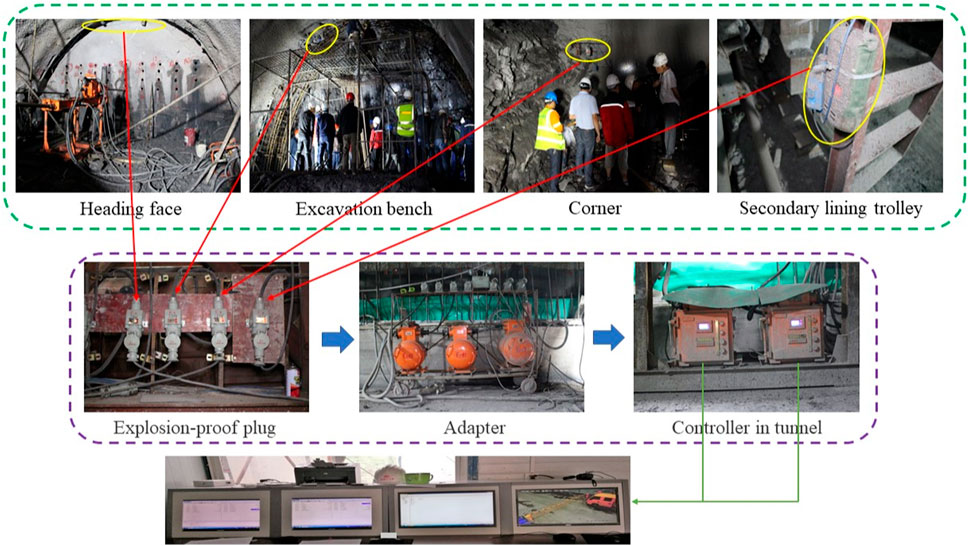
FIGURE 7. Multi parameter gas real-time monitoring system.
In this study, the change of gas concentration in the total return air flow monitored after the main power supply was cut off during a normal construction period was selected. The gas concentration measured by the gas monitor at the secondary lining trolley was used as the gas concentration in the total return air flow, as shown in Figure 8.
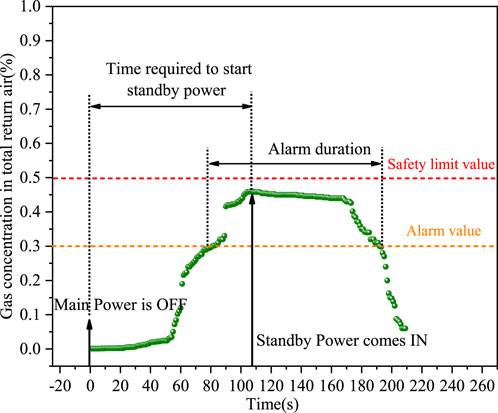
FIGURE 8. Change of gas concentration in total return air flow after power failure of main power supply.
It can be seen that after power outage, the gas concentration in the tunnel accumulates rapidly, and the gas concentration in the total return air flow exceeds 0.3% within 81 s. After the standby power supply was started, the gas concentration in the total return air flow began to decrease at 108 s, and the period from 108 s to 175 s was the process of fresh air flow being sent from the tunnel entrance through the air duct to the tunneling work and the dirty air being discharged. The gas concentration from the standby power to the total return air flow is reduced to less than 0.3%, which takes 111 s, while the standby power needs to be manually started, which takes 108 s. Therefore, through this case, it can be concluded that when the main power supply fails, the use of manual start-up of standby power is time-consuming and inefficient, and the gas concentration is easy to alarm or even exceed the limit, which is easy to cause safety hazards. Therefore, ensuring 24-h uninterrupted ventilation has become the main measure to prevent the risk of gas accumulation.
4.2 Self-starting uninterrupted ventilation power supply system
According to the actual situation on site, the project technical team developed the PLC air supply control program (Niu et al., 2019), which is mainly used to seamlessly connect the main power supply and standby power supply. If the main power supply is powered off, the program can immediately and automatically start the standby power supply, and the fan does not have to be shut down and restarted to ensure continuous and uninterrupted air supply (Luo and Song, 2016). The flow chart of main power outage and power restoration is shown in Figure 9.
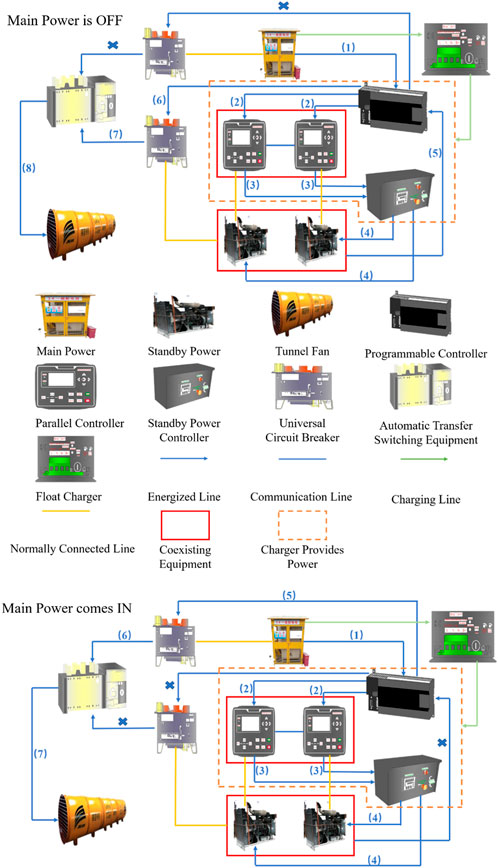
FIGURE 9. Flow chart of air supply control procedure.
In Figure 9, (1), (2), (3), (4), (5), (6), (7), and (8) represent the equipment operation sequence and process. No. 1 parallel controller and No. 2 parallel controller are normally connected with No. 1 standby power supply and No. 2 standby power supply respectively, and automatic parallel communication is connected between No. 1 and No. 2 parallel controllers; The main power supply and standby power supply units are normally connected with their corresponding universal circuit breakers. After the active source fails, the float charger changes the input to the output to provide electric energy for the programmable controller, parallel controller and standby power controller. After the programmable controller fails to receive the electric energy provided by the main power distribution box, it will automatically start the preset program and send the signal that the main power supply has been cut off to the parallel controller, The paralleling controller sends a start command to the corresponding standby power supply respectively, and paralleling is carried out after judging that No. 1, No. 2 standby power supply meets the paralleling conditions. After receiving the electric energy output by the standby power supply after parallel operation, the programmable controller sends a disconnection command to the universal circuit breaker in the main power supply line and a closing command to the universal circuit breaker in the standby power supply line; The dual power automatic transfer switchgear connected to the fan automatically switches the switch to the standby power supply line. So far, the standby power supply line forms a closed loop to supply power to the fan for uninterrupted air supply.
When the main power supply is restored, the programmable controller receives the current signal from the distribution box of the independent power supply, sends the command of power-off of the standby power supply to the parallel controller, and the parallel controller sends the power-off command to the standby power controller, and the standby power controller immediately stops the standby power supply, After receiving the signal that the standby power supply has been powered off (that is, after the programmable controller cannot receive the electric energy output by the standby power supply), the programmable controller feeds back the disconnection command to the universal circuit breaker of the standby power supply line, and sends the closing command to the universal circuit breaker of the main power supply line at the same time, The dual power automatic transfer switch equipment automatically switches the switch to the main power line after receiving the feedback from the universal circuit breaker. So far, the main power supply is restored to normal power supply, and the fan provides uninterrupted air supply.
4.3 Comparative analysis of effect
According to the above content, the operation reliability and operation effect are tested after the start-up of the dynamic uninterrupted power supply ventilation program is designed. The test results are shown in Figure 10.
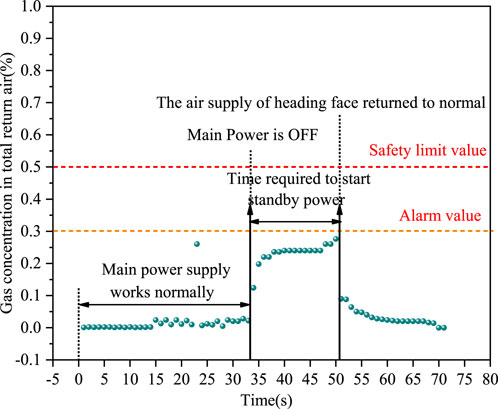
FIGURE 10. After adopting uninterrupted power supply ventilation technology, the gas concentration in the total return air flow changes after the main power supply is cut off.
It can be seen that under normal ventilation, the gas concentration in the total return air flow is low and the variation range is small. At the 34 s, the main power supply is powered off, and the gas concentration in the total return air flow increases rapidly and continuously. At the 51 s, the air supply is restored, and the gas concentration in the total return air flow decreases rapidly to the normal value. It takes 17 s to restore ventilation from the main power supply to the heading face, which is only 15.74% of the time required before the measures are taken. During this period, the switching between the main power supply and the standby power supply is instantaneous, and the time-consuming can be ignored. The time is the time required for the fresh air flow from the outside of the tunnel to the heading face through the air duct and the accumulated gas is wrapped up in the path of the multi-parameter gas monitor passing through the secondary lining trolley.
Most importantly, after adopting the self-starting uninterrupted power supply ventilation technology, the gas concentration in the total return air flow did not alarm during the power supply switching process, which proved that the technology was rapid, stable and reliable.
5 Conclusion
In this study, combined with the practical problems of ventilation in multiple heading faces of extra long railway tunnel under different working conditions under complex geological conditions, the numerical simulation calculation and practical technical improvement research are carried out, and the following conclusions are drawn.
(1) In the numerical calculation results obtained in different ventilation stages, the vortex position and vortex range are basically the same. The total return air channel length and the air outlet velocity of the air duct in the heading face have a certain impact on it, but the results are roughly the same. The position of the vortex can be determined by the wind speed and pressure of the return air flow, as well as the shear rate of the return air flow.
(2) This study focuses on the location and scope of cross tunnel and flat guide where gas in surrounding rock is easy to escape into the tunnel, and vortex is easy to occur in the path of return air flow, which is easy to form local accumulation of gas. Based on the calculation results of various ventilation stages, it is easy to generate eddy currents at the corners of the tunnel in the horizontal tunnel and the horizontal guide, and the eddy currents are mostly strip shaped areas attached to the tunnel wall.
(3) In addition to adding necessary gas monitoring instruments in the return air flow channel, good ventilation effect is an important means to solve the local accumulation of gas. Therefore, the project technical team has developed the PLC air supply and power supply program to ensure the uninterrupted ventilation of the fan for 24 h, so as to ensure better dilution and entrainment effect in case of gas accumulation. The ventilation power supply program solves the problem of manually starting the standby power supply and restarting the fan after the main power supply of the fan is powered off. All operation instructions are programmed in advance and preset in the programmable controller to achieve the purpose of automatic power switching. By analyzing the change of gas concentration in the total return air flow after the main power supply is cut off and the time interval between the start-up and supply of the standby power supply before and after the measures are taken, it can be seen that the recovery time after the measures is shortened to 15.74% of the original time, and the concentration is not exceeded. It shortens the time of restarting the fan and effectively reduces the risk of gas accumulation and overrun, which has good practical significance.
Data availability statement
The original contributions presented in the study are included in the article/supplementary material, further inquiries can be directed to the corresponding author.
Author contributions
SM wrote the original draft. WM and SF conducted data curation and technical support for numerical simulation. RQ and GN conducted an investigation. All authors contributed to the article and approved the submitted version.
Funding
This work was supported by Guizhou Provincial Science and technology plan project: Guizhou science and technology cooperation strategic prospecting [approval No. (2022)ZD001], the Guizhou Kehe basic project [approval No. (2019)1189] and the Guiyang science and technology planning project (zhukehe) [approval No. (2021)45-2].
Acknowledgments
We are very grateful to the technical team of the project management department of Xubi Railway (Sichuan Yunnan section) of the first Engineering Co., Ltd. of China Railway 17th Bureau Group Co., Ltd. for the development and upgrading of PLC ventilation power supply program has made the technology better applied in practical work.
Conflict of interest
SM was employed by Guizhou Energy Industry Research Institute Co., Ltd. RQ and GN were employed by China Railway Construction Co., Ltd. China Railway 17th Bureau Group.
The remaining authors declare that the research was conducted in the absence of any commercial or financial relationships that could be construed as a potential conflict of interest.
Publisher’s note
All claims expressed in this article are solely those of the authors and do not necessarily represent those of their affiliated organizations, or those of the publisher, the editors and the reviewers. Any product that may be evaluated in this article, or claim that may be made by its manufacturer, is not guaranteed or endorsed by the publisher.
References
Ahmadi, M. H., and Hekmat, M. H. (2021). Numerical and experimental investigation of air flow behavior and H2S gas emission through an inclined traversed tunnel. J. Braz. Soc. Mech. Sci. Eng. 43 (10), 448. doi:10.1007/s40430-021-03173-4
Castellano, S., Starace, G., De Pascalis, L., Lippolis, M., and Mugnozza, G. S. (2016). Test results and empirical correlations to account for air permeability of agricultural nets. Biosyst. Eng. 150, 131–141. doi:10.1016/j.biosystemseng.2016.07.007
Chang, X. K., Chai, J. R., Liu, Z., Qin, Y., and Xu, Z. G. (2019). Comparison of ventilation methods used during tunnel construction. Eng. Appl. Comput. Fluid Mech. 14 (1), 107–121. doi:10.1080/19942060.2019.1686427
Du, C. F., and Bian, M. L. (2018). Numerical simulation of fluid solid coupling heat transfer in tunnel. Case Stud. Therm. Eng. 12, 117–125. doi:10.1016/j.csite.2018.03.007
Giuseppe, Q., and Massimo, S. (2001). Air suspension dimensionless analysis and design procedure. Veh. Syst. Dyn. 35 (6), 443–475. doi:10.1076/vesd.35.6.443.2040
Hisashi, O., Atsumu, O., Ralph, D. L., and Toni, P. (2003). The second law of thermodynamics and the global climate system: A review of the maximum entropy production principle. Rev. Geophys. 41 (4), 248. doi:10.1029/2002RG000113
Huang, Y. P. (1999). Mine ventilation(in Chinese). Xuzhou, China: China University of Mining and Technology Press.
Khattri, S. K., Log, T., and Kraaijeveld, A. (2019). Tunnel fire dynamics as a function of longitudinal ventilation air oxygen content. Sustainability 11 (1), 203. doi:10.3390/su11010203
Krol, A., Krol, M., Koper, P., and Wrona, P. (2019). Numerical modeling of air velocity distribution in a road tunnel with a longitudinal ventilation system. Tunn. Undergr. Space Technol. 91, 103003. doi:10.1016/j.tust.2019.103003
Li, B. (2014). “Optimization simulation of construction ventilation for highway gas tunnel(in Chinese),”. Master's thesis (Changsha, China: Central South University).
Liu, Q., Nie, W., Hua, Y., Peng, H. T., Ma, H., Yin, S., et al. (2019). Long-duct forced and short-duct exhaust ventilation system in tunnels. Formation and dust control analysis of pressure ventilation air curtain. Process Saf. Environ. Prot. 132, 367–377. doi:10.1016/j.psep.2019.10.012
Liu, Y. B., Wang, E. Y., Jiang, C. B., Zhang, D. M., Li, M. H., Yu, B. C., et al. (2023a). True triaxial experimental study of anisotropic mechanical behavior and permeability evolution of initially fractured coal. Nat. Resour. Res. 32, 567–585. doi:10.1007/s11053-022-10150-8
Liu, Y. B., Wang, E. Y., Li, M., Song, Z., Zhang, L., and Zhao, D. (2023b). Mechanical response and gas flow characteristics of pre-drilled coal subjected to true triaxial stresses. Gas Sci. Eng. 111, 204927. doi:10.1016/j.jgsce.2023.204927
Liu, Z. Z., Chen, C., Liu, M., Wang, S., and Liu, Y. Z. (2021). Numerical simulations on the extinguishing effect of water mist system with different parameters of longitudinal ventilation in curve tunnel fire. Adv. Civ. Eng. 2021, 1–13. doi:10.1155/2021/7373685
Luo, N. N., and Song, G. N. (2016). Long distance automatic intelligent construction ventilation technology for long tunnel(In Chinese). Enterp. Technol. Dev. 35 (25), 11–15. doi:10.14165/j.cnki.hunansci.2016.31.003
Mats, B. (2000). A three–dimensional airspring model with friction and orifice damping. Veh. Syst. Dyn. 33 (1), 528–539. doi:10.1080/00423114.1999.12063109
Mi, W. S., Wen, H., Fan, S. X., Wang, S. B., Wu, X. M., Wei, G. M., et al. (2023). Correlation analysis of injection parameters for low-medium pressure injection of liquid CO2 for CH4 displacement in coal seams. Energy 278, 127760. doi:10.1016/j.energy.2023.127760
Niu, G. Q. S., Chen, R., Cheng, Z. G., He, Z. P., and Zhang, H. Y. (2019). China, shanxi: China. Patent No.1,094,416,50A.
Park, J., Jo, Y., and Park, G. (2018). Flow characteristics of fresh air discharged from a ventilation duct for mine ventilation. J. Mech. Sci. Technol. 32 (3), 1187–1194. doi:10.1007/s12206-018-0222-9
Pei, G. H., and Pan, J. (2014). Numerical study on different series modes of jet fan in a longitudinal tunnel ventilation system. Math. Problems Eng. 2014, 1–9. doi:10.1155/2014/194125
Ren, R., Xu, S. S., Ren, Z. D., Zhang, S. Z., Wang, H., Wang, X. L., et al. (2018). Numerical investigation of particle concentration distribution characteristics in twin-tunnel complementary ventilation system. Math. Problems Eng. 2018, 1–13. doi:10.1155/2018/1329187
Shi, H. (2019). “Numerical simulation of Ventilation and smoke exhaust of special long highway tunnel based on CFD(In Chinese),”. Master's thesis (Xi'an, China: Chang’an University).
Vasilyev, G. P., Peskov, N. V., and Lysak, T. M. (2021). Heat balance model for long-term prediction of the average temperature in a subway tunnel and surrounding soil. Int. J. Therm. Sci. 172 (B), 107344. doi:10.1016/j.ijthermalsci.2021.107344
Wang, C., Wu, S. P., and Wen, B. (2010). “Notice of Retraction: Effects of the wheels on train's aerodynamic characteristics under cross wind conditions,” in Proceedings of 2010 International Conference on Computer (2010), Control and Electronic Engineering, Changchun, China, August 24-26, 2010, 291–294.
Wang, D. M. (2009). Mine ventilation & safety(in Chinese). Xuzhou, China: China University of Mining and Technology Press.
Wang, J., Cheng, W. Y., and Gao, K. (1999). Theory & prediction technology of mine gas emission(in Chinese). Beijing, China: China Coal Industry Publishing House Press.
Wen, H., Mi, W. S., Fan, S. X., Liu, M. Y., Cheng, X. J., and Wang, H. (2023). Determining the reasonable volume required to inject liquid CO2 into a single hole and displace CH4 within the coal seam in bedding boreholes: Case study of SangShuPing coal mine. Energy 266, 126522. doi:10.1016/j.energy.2022.126522
Wen, H., Mi, W. S., Fan, S. X., Xu, Y., and Cheng, X. J. (2022). Simulation study on crucial parameters of long-compressive and short-suction ventilation in large section roadway excavation of LongWangGou coal mine. Environ. Sci. Pollut. Res. 30, 6435–6453. doi:10.1007/s11356-022-22568-x
Wu, B., Chen, H. H., and Huang, W. (2021). Optimization principle and application of forced ventilation in railway tunnels based on improved TOPSIS theory and CFD simulations. Adv. Mech. Eng. 13 (5), 168781402110176. doi:10.1177/16878140211017613
Xin, Y. (2016). “Study of key ventilation technology of extra-long highway tunnel construction at high altitude(in Chinese),”. Master's thesis (Chongqing, China: Chongqing Jiaotong University).
Yuan, S. (2017). Optimization and security control technology of construction ventilation for extra-long railway tunnel with gas(In Chinese). Chengdu, China: Southwest Jiaotong University.
Zeng, Y. H., Tao, L. L., Ye, X. Q., Zhou, X. H., Fang, Y., Fan, L., et al. (2020). Temperature reduction for extra-long railway tunnel with high geotemperature by longitudinal ventilation. Tunn. Undergr. Space Technol. 99, 103381. doi:10.1016/j.tust.2020.103381
Zhang, J. H., Dong, Y., Chen, Y. D., Sun, H. S., Wu, J. K., Liu, W. L., et al. (2021). Numerical simulation of gas ventilation mode in highway gas tunnel. Geofluids 2021, 1–9. doi:10.1155/2021/5549168
Zhang, L. (2016). “Numerical simulation of flow flied research on the anti liquid vortex device of the ground gas transmission pipeline(In Chinese),” Master's thesis (Xi'an, China: Xi’an Shiyou University).
Keywords: self-starting power supply ventilation, high gas tunnel, special-shaped structure, prevention and control technology, gas acumulation
Citation: Ma S, Mi W, Fan S, Qiu R and Niu G (2023) Numerical analysis and control technology of gas accumulation in a large-scale specially-shaped tunnel passing through coal bearing strata. Front. Earth Sci. 11:1201492. doi: 10.3389/feart.2023.1201492
Received: 06 April 2023; Accepted: 02 June 2023;
Published: 22 June 2023.
Edited by:
Yihuai Zhang, University of Glasgow, United KingdomReviewed by:
Wendong Zhou, Nanjing University of Information Science and Technology, ChinaYu Xu, Central South University, China
Copyright © 2023 Ma, Mi, Fan, Qiu and Niu. This is an open-access article distributed under the terms of the Creative Commons Attribution License (CC BY). The use, distribution or reproduction in other forums is permitted, provided the original author(s) and the copyright owner(s) are credited and that the original publication in this journal is cited, in accordance with accepted academic practice. No use, distribution or reproduction is permitted which does not comply with these terms.
*Correspondence: Shixing Fan, ZmFueHVzdEB5ZWFoLm5ldA==