 Hedi Ma
 Ruili Wang3*
 Xing Li
- 1China Meteorological Administration Basin Heavy Rainfall Key Laboratory, Hubei Key Laboratory for Heavy Rain Monitoring and Warning Research, Institute of Heavy Rain, China Meteorological Administration, Wuhan, China
- 2Key Laboratory of Meteorological Disaster (KLME), Ministry of Education and Collaborative Innovation Center on Forecast and Evaluation of Meteorological Disasters(CIC-FEMD), Nanjing University of Information Science and Technology, Nanjing, China
- 3Wuhan Meteorological Observatory, Wuhan, China
- 4Plateau Atmosphere and Environment Key Laboratory of Sichuan Province, College of Atmospheric Science, Chengdu University of Information Technology, Chengdu, China
The South Asian jet leading wave train (SAJLWT) is a zonally elongated and equivalently barotropic stationary Rossby wave train along the wintertime South Asian subtropical jet, which stands out as the leading empirical orthogonal function mode of monthly meridional winds at the upper troposphere over southern Eurasia. The SAJLWT is closely related to weather and climate extremes over southern Eurasia, but up to now, the mechanisms of SAJLWT variability are still not fully understood. The present study reveals a significant 11-year solar cycle (SC) influence on the SAJLWT variability in late winter (January–March). The in-phase correlation between the SC and the SAJLWT is not only statistically significant but also consistent over time. Associated with the solar-induced SAJLWT anomalies, significant surface cooling exists over northeastern Africa and Middle East, while significant positive precipitation anomalies appear over southern China. Two routes of mechanisms are presented to clarify the SC–SAJLWT linkage. One is due to the solar-induced northwest–southeast tilted North Atlantic Oscillation (TNAO) pattern, which may reflect a “top–down” solar forcing and the ocean–atmosphere couplings in the North Atlantic Ocean. This TNAO pattern would trigger southeastward wave activity fluxes toward the SAJ, thus significantly impacting the upstream portions of the SAJLWT pattern. The other mechanism involves weakened convection over the Maritime Continent (MC) region, reflecting solar-induced weakening of Pacific Walker Circulation via “bottom–up” processes. The MC convection anomaly would also excite a SAJLWT-like circulation pattern. Our analysis highlights that the solar “top–down” and “bottom–up” mechanisms may act in concert to exert a significant impact on the SAJLWT and indicates that the SC forcing is an appreciable source of decadal predictability in southern Eurasia.
1 Introduction
In wintertime, the Asian subtropical westerly jet shifts southward to around 25°N, extending from Middle East to North Pacific, known as the South Asian jet (SAJ, Yang et al., 2004) stream. It acts as a waveguide for quasi-stationary waves that promote upstream disturbances to propagate efficiently to East Asia (Branstator, 2002; Watanabe, 2004). Particularly, in the recent decade, growing interest had been focused on a zonally elongated and equivalently barotropic stationary Rossby wave train along the SAJ, which stands out as the leading empirical orthogonal function (EOF) mode of wintertime monthly meridional winds at the upper troposphere over southern Eurasia (Li et al., 2017; Li et al., 2020; Hu et al., 2018). It originates in the North Atlantic, propagates southeastward to the Arabian Sea, and then turns eastward along the SAJ toward East Asia (EA). This SAJ leading wave train (SAJLWT) features variabilities on a wide range of time scales and exerts substantial impacts on weather and climate over EA. Some extreme wintertime rainfalls, snowfalls, and temperature anomalies in EA are associated with this wave pattern (Wen et al., 2009; Ding and Li, 2017; Shen et al., 2019). Hence, it is important to discover the physical processes driving the variations of the SAJLWT.
A number of studies have investigated the triggering and maintaining mechanism of the SAJLWT. The results demonstrate it is an atmospheric internal mode, which can be triggered and sustained through wave–mean flow interactions (Wirth et al., 2018; Li, 2021). The causes of interannual and decadal variations of this wave pattern had also extracted much attention, and two types of drivers had been identified. One is the circulation patterns over the North Atlantic and European (NAE) region. Among them, the North Atlantic Oscillation (NAO) anomaly was found to be closely linked to this wave train (Song et al., 2014). In addition, the wave train can also be stimulated by quasi-zonally elongated cyclonic or anticyclonic anomalies over mid-high latitudes of the NAE region without the NAO. These NAE circulation disturbances would propagate eastward toward East Asia and North Pacific after being injected into the SAJ, due to the waveguide effect (Huang et al., 2020). On the other hand, tropical processes occurring along the wave path can also fuel this wave train. In general, the SAJLWT is associated with El Niño–Southern Oscillation (ENSO)-like patterns. Through the Gill–Matsuno mechanism, sea surface temperature (SST) and convection anomalies in the tropical eastern Pacific (EP), western Pacific (WP), and Indian Ocean (IO) were found to excite circulation anomalies along the SAJ (Leung et al., 2017; Hu et al., 2018; Wei et al., 2022). However, whether the SAJLWT can be driven by external forcing factors remains unclear. Thus, further analysis should be carried out to identify the external factors of this wave train as it is useful for predicting the EA climate anomalies.
As an important natural external forcing factor of the climate system, the 11-year solar cycle (SC) may exert non-negligible influences on regional climate (Gray et al., 2010). Recent studies identify several particularly strong SC influences on the troposphere at different regions. Particularly, increasing observational and modeling evidence supports the presence of SC impacts on NAE circulation anomalies (Ineson et al., 2011; Chen et al., 2015). Generally, enhanced solar activity tends to exert a positive NAO-like pattern in wintertime, but the SC signal exhibits substantial subseasonal variations (Gray et al., 2013; Gray et al., 2016; Ma et al., 2018). There are two crucial differences between the early and late winter SC signals. One is the issue of timing. In early winter, the positive NAO-like pattern emerges 2–4 years after SC maximum, while the late winter response tends to synchronize with the SC. The other is the difference in spatial patterns. The early winter response exhibits the north–south dipole that highly resembles the canonical NAO but with more statistical significance in the Azores region (i.e., the southern lobe). The late winter response exhibits a northwest–southeast tilted dipole structure, which contains an Icelandic low-pressure anomaly and a European high-pressure anomaly, a pattern that is somewhat distinct with the canonical NAO pattern (Brugnara et al., 2013). The lagged response in early winter is dominated by the ocean feedback in the Atlantic, and the synchronized late winter response may be jointly influenced by the “top-down” forcing from the stratosphere and the ocean–atmosphere coupling in the Atlantic (Scaife et al., 2013; Thiéblemont et al., 2015). The Indo-Pacific sector is also a hotspot of solar influence. Many previous studies identified cooling in the eastern/western Pacific and warming in the central Pacific in SC maximum years, resembling the CP type of El Niño (Roy and Haigh, 2010; Zhou and Tung, 2010; Hood et al., 2013; Kodera et al., 2016; Huo and Xiao, 2017). Correspondingly, the Pacific Walker Circulation is weakened (Misios et al., 2016). These SST and circulation anomalies may be attributed to a “bottom–up” mechanism, which involves changed hydrology or ocean dynamics in response to a warmer surface associated with the increase in the total solar irradiance (Misios et al., 2016; Misios et al., 2019; Huo et al., 2021).
As mentioned previously, both of these flavors of solar signals have the potential to impact the SAJLWT. Therefore, it comes naturally to ask whether there is an SC signal in the SAJLWT. In addition, what are the physical mechanisms lying behind? Particularly, interactive processes among the SAJ variability and the two types of solar signals deserve further discussion. Section 2 contains a description of the data and methods used. Section 3 presents a robust and significant connection between the SC and the SAJLWT. Section 4 provides the combined effects of solar-induced NAE circulation anomalies and solar-related tropical forcing on the SAJLWT. The discussion and summary are presented in Sections 5.
2 Data and methods
2.1 Datasets
In this study, we employ the European Centre for Medium-Range Weather Forecasts (ECMWF) 20th century reanalysis (ERA-20C) dataset with a horizontal resolution of 2.5° for the 1901–2010 period (Poli et al., 2016). We also employed the Hadley Centre Sea Ice and Sea Surface Temperature (HadISST) dataset (Rayner et al., 2003). The present study employed Climatic Research Unit (CRU) TS v4.01 temperature and precipitation data with a horizontal resolution of 0.5° (Harris et al., 2014). The monthly precipitation reconstruction released by the National Oceanic and Atmospheric Administration (NOAA) was also used (Chen et al., 2002), which has a horizontal resolution of 2.5°. To investigate the vertical structure of the solar signal and the stratospheric impact, the monthly mean European Centre for Medium-Range Weather Forecasts Interim reanalysis (ERA-Interim) data were employed (Dee et al., 2011). In this study, monthly sunspot numbers (SSNs) are used to quantify the solar activity, which can be downloaded at http://www.esrl.noaa.gov/psd/gcos_wgsp/Timeseries/SUNSPOT/. In order to characterize the impacts from the major volcanic eruptions, the Northern Hemisphere-averaged stratospheric aerosol optical depth (AOD) is used, which can be downloaded from https://data.giss.nasa.gov/modelforce/strataer/.
2.2 Methods
It is challenging to isolate the SC signal from various sources of internal variability and external forcing. To address this issue, many previous studies of solar-climate linkage employ the multiple linear regression (MLR) method, which had been regarded as an effective way of separating SC influences (Lean and Rind, 2008; Frame and Gray, 2010; Roy and Haigh, 2010; Ma et al., 2018). Commonly, in these studies, four climate factors are considered, namely, solar forcing, volcanic forcing, ENSO, and anthropogenic forcing. Following these studies, we obtain the response of a climate variable
The four indices employed in the MLR (Eq. 1) are as follows: 1) SSN: the January–February–March (JFM) mean SSN at l-year lag (Note that time variations greater than 15 years were subtracted from the SSN time series by applying a low-pass filter technique to ensure that we only extract the quasi-11-year SC signal); 2) VOLC: the JFM mean Northern Hemisphere-averaged stratospheric AOD that characterizes volcanic influences; 3) ENSO, characterized by the JFM mean SST anomalies over the region 5°N–5°S and 180–90°W; and 4) TREND, a linear trend term that approximately represents the anthropogenic forcing.
To describe the upper tropospheric Rossby wave activity, the phase-independent wave activity flux (WAF; Takaya and Nakamura, 2001) was calculated. The WAF can be expressed as follows:
Here,
3 Robust and significant solar signatures in wintertime SAJ variability
To show solar signatures in the upper tropospheric circulation, Figure 1A displays the SC signal in the 250-hPa GPH and vector wind anomalies. It is seen that the solar signal exhibits a marked Rossby wave train extending from the North Atlantic to the North Pacific Ocean traveling along the subtropical jet. The wave-like structure consists of six geographically fixed lobes with centers being located over Iceland, southern Europe, Egypt, Arabian Sea, southern China, and the Japan Sea. Statistical significant GPH anomalies mainly exist in the upstream nodes of this wave train, i.e., Iceland, southern Europe, and the Middle East, whereas the downstream nodes of the GPH anomalies, i.e., the negative GPH anomalies around southwest China and the positive GPH anomalies over the Japan Sea, are with limited statistical significance. However, due to the enhanced pressure gradient between them, significant southerly anomalies can still be found over central-eastern China (Figure 1B).
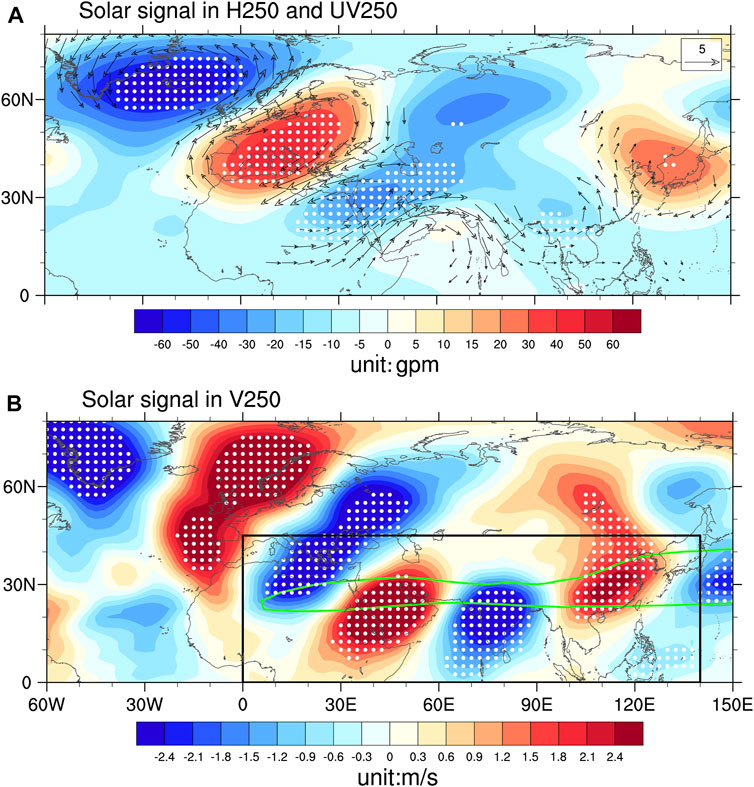
FIGURE 1. SC signals in upper tropospheric circulation anomalies. The SC signals are defined as the regression coefficients of SSN (derived from MLR Eq. 1) multiplied by the maximum peak-to-trough SSN, which can approximately represent the maximum likely atmospheric responses to the SC. (A) Spatial distributions of SC signals in GPH (shaded, unit: gpm) and wind anomalies (vector, unit: m/s) at 250 hPa for JFM. (B) SC signals in meridional wind (shaded, unit: m/s) at 250 hPa for January–March. Solid white dots denote regions where the SC signals are statistically significant at the 5% level (i.e., p<0.05) after prewhitening and a 1000-trial bootstrap resampling test. Only the wind vector that is significant at the 5% level is shown. In (B), the green contour represents climatological jet stream (40 m/s of zonal wind), and the black rectangle is consistent with the area of EOF analysis in Figure 2A. The SC signals are obtained from MLR (Eq. 1).
This derived solar pattern bears high resemblance with the SAJLWT pattern revealed by previous studies (Hu et al., 2018, see their Figure 3A). To verify this, follow Hu et al. (2018); we first obtain the SAJLWT pattern by calculating the EOF leading mode based on monthly v anomalies at 250 hPa in the domain of 0–45°N and 0–140°E during JFM of 1901–2010 (Figure 2A), which represents the dominant mode of the quasi-stationary Rossby wave along the SAJ. It should be pointed out that the chosen domain is confined in mid-lower latitudes in order to distinguish the wave train propagating along the SAJ with the waves traveling along the polar jet. This does not mean the significant solar signal is solely located over the low latitude but because we focus on the relationship between solar activity and the SAJLWT.
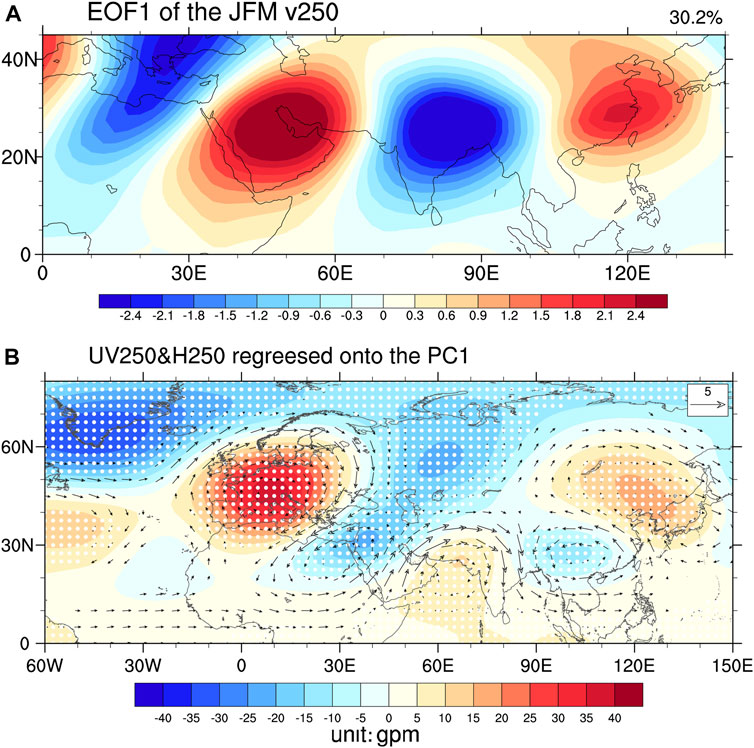
FIGURE 2. (A) First EOF mode of JFM mean meridional wind at 250 hPa for 1901–2010 over 0–45°N, 0–140°E. (B) Regressions of GPH (shaded, unit: gpm) and wind anomaly (vector, unit: m/s) at 250-hPa on the PC1. Solid white dots denote that the regression coefficients of GPH are statistically significant at the 5% level (i.e., p<0.05), and only the wind vector that is significant at the 5% level is shown.
Here, we use the PC1 of the EOF analysis on 250-hPa v anomalies in this domain (0–45°N,0–140°E) to characterize SAJLWT variability. Then, the regressed 250 hPa GPH and vector wind anomalies onto the JFM mean PC1 are shown in Figure 2B. Comparing Figure 1 and Figure 2, it is found the solar and the SAJLWT patterns are quite similar. In this study, we use the PC1 of the EOF1 mode to characterize the SAJLWT variability. As shown in Figure 3A, the time series of PC1 is significantly correlated with the SSN (r = 0.362, p<0.01), suggesting the significant influence of SC on the SAJLWT.
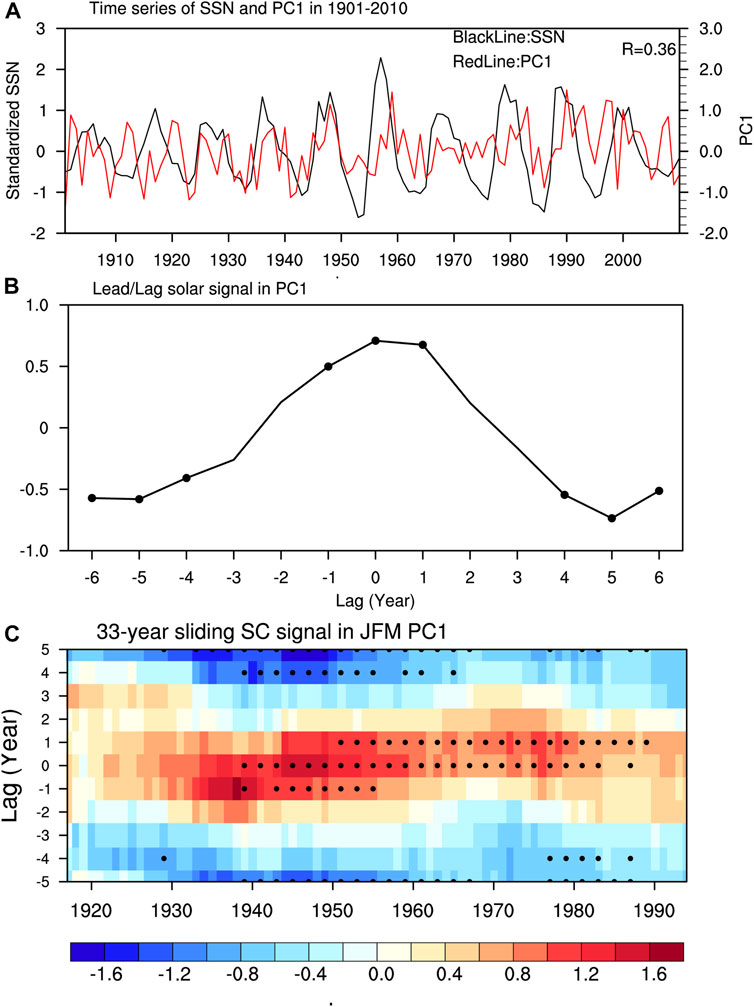
FIGURE 3. (A) Standardized time series of SSN and PC1. (B) SC signals in JFM PC1 at various lags (from −5 to +5 years) over the time period 1901–2010. (C) 33-year sliding SC signals in JFM PC1 at various lags (from −5 to +5 years). The x-axis, year, is labeled according to the central year of the 33-year window, which means that at a given year N, the MLR analysis is performed using datasets from year N-16 to year N+16. The y-axis shows the number of years that the PC1 lagging the SSN index in MLR (Eq. 1). The SC signals in (B) and (C) are obtained from MLR (Eq. 1). To determine the statistical significance, we first employed a prewhitening procedure to eliminate the potential autocorrelation in the residual term, following Chen et al. (2015). Subsequently, we used a 1000-trial bootstrap resampling test to determine the statistical significance level of the solar regression coefficients, following Ma et al. (2018). Solid black dots in (B) and (C) denote that the SC signals are statistically significant at the 5% level (i.e., p<0.05).
Next, we investigate the lead/lag nature of the solar–SAJLWT relationship. Figure 3B shows the lead/lag solar signal in PC1 estimated from the MLR analysis over the time period 1901–2010. Notably, the solar index here had been employed at different lead/lag times between 0 and 5 years. Considering the SC has quasi-11-year period, the lead/lag of zero years indicates the SC maximum (SCmax) and the lead/lag of 5 years represents SC minimum (SCmin). A maximum positive response at lag zero represents a signal whose maximum value coincides with the SCmax. As is seen, the maximum PC1 response appears at lag zero (corresponding to the SCmax phase), while the minimum PC1 response appears at lag 5 years and lead 5 years (corresponding to the SCmin phase). The significant (p<0.05) signals also appear around the SCmax and SCmin phases. These results suggest the wave train response is significant and generally synchronous to the SC. To further investigate the robustness of this solar signal, Figure 3C shows the 33-year sliding solar signal in PC1 over the time period 1901–2010. The year in the x-axis denotes the central year of the 33-year rolling window, while the year in the y-axis is labeled according to the lead/lag time employed. The results show positive PC1 response generally maximizing at zero lag for most of the time intervals, with significant (p < 0.05) signals mainly detected during 1940s–1990s, suggesting the wave train response is generally consistent over time. On the other hand, although the SC signal is relatively stable over time, a slight multidecadal drift still exists. Interestingly, we notice sometimes the strongest PC1 response occurs at 1 year, leading the Smax (e.g., 1940–1960). These slight drifts may be caused due to contamination from internal noises (Gray et al., 2016; Ma et al., 2018).
We note that SC affects not only the SAJLWT but also the SAJ itself. Figure 4 shows the solar signal in 250-hPa zonal wind. As is seen, significant strengthening of westerlies appear over the Arabian peninsula and Iranian plateau, while westerlies over the Mediterranean are significantly weakened, which is consistent with the negative GPH anomalies that exist from western Russia to the Middle East. Considering the western part of the SAJ (known as the Middle East jet stream, MEJ) is climatologically located over northern Egypt and Saudi Arabia (the green contour in Figure 4), the zonal wind pattern suggests enhanced solar activity tends to significantly shift the MEJ southeastward.
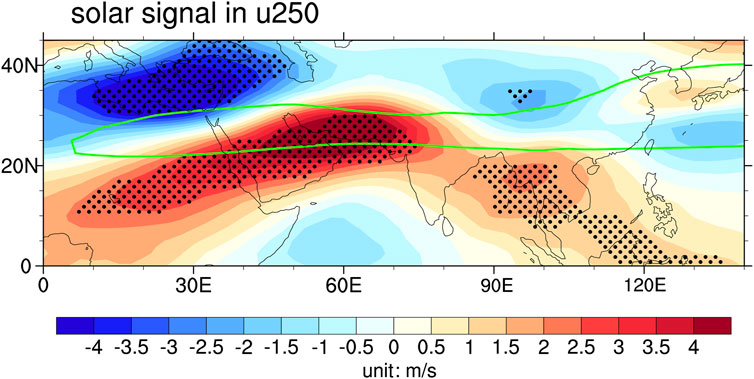
FIGURE 4. SC signals in 250-hPa zonal wind anomalies (shaded, unit: m/s); the definition of the SC signal here is same as Figure 1. Solid black dots denote that the SC signals are statistically significant at the 5% level (i.e., p<0.05) after prewhitening and a 1000-trial bootstrap resampling test. The green contour represents the climatological jet stream (40 m/s of zonal wind). The SC signals are obtained from MLR (Eq. 1).
It is reasonable to anticipate that the significant solar-related circulation anomalies analyzed previously are accompanied by corresponding changes in the surface air temperature and precipitation field. Figures 5A, B show solar signals in JFM temperature and precipitation anomalies, respectively. Accompanied with southeastward movement of the MEJ, the positive GPH anomaly appears over Europe and the negative GPH anomaly appears over Middle East and northeastern Africa (Figure 1A). As is known, the positive (negative) GPH anomaly at the upper troposphere means active warm ridge (cold trough), which typically corresponds to surface warming (cooling). Therefore, significant warming is seen in Europe, while significant cooling is detected in Middle East and northeastern Africa (Figure 5A). On the other hand, significant positive precipitation anomalies appear over southern China, consistent with the finding of Ma et al. (2019). We may infer that SC influences southern China precipitation anomalies through modulating the SAJLWT since the correlation between PC1 and southern China precipitation anomalies (defined as CRU precipitation anomalies averaged over 22–32°N, 110–120°E) reaches 0.41 for 1901–2010 (p < 0.01). According to Hu et al. (2018), the rainfall could be affected by the wave train-induced upward motions and the low-tropospheric moisture vapor convergence induced by anomalous wind from tropical oceans as the India–Burma trough is intensified.
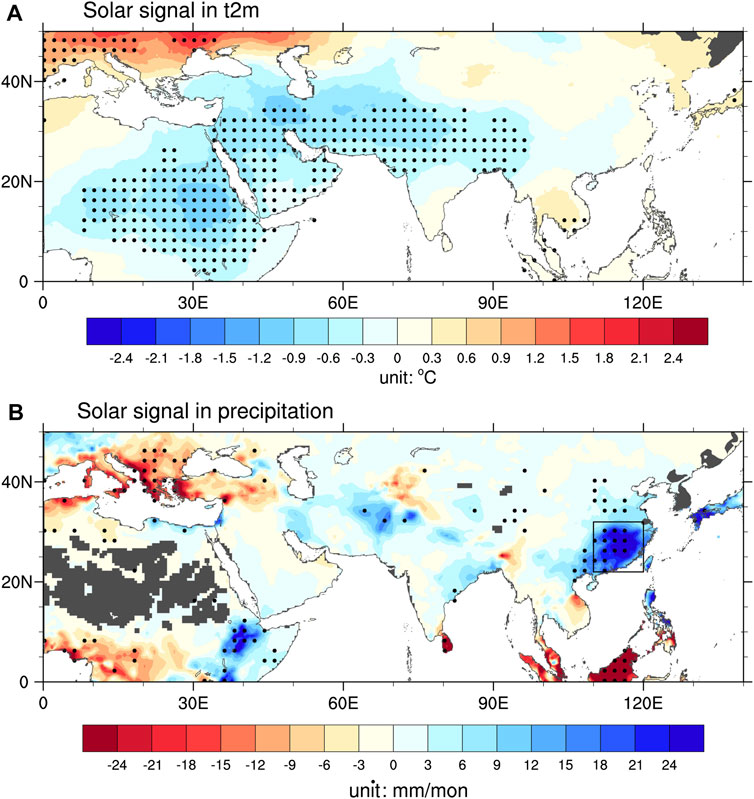
FIGURE 5. Same as Figure 4 but for SC signals in surface air temperature (A) and precipitation (B).
4 Possible mechanisms for the solar–SAJ linkage
As revealed previously, during late winter (JFM), there exists a robust and significant synchronized correlation between the SC and the SAJLWT. Over the southern Eurasian region, the solar signal also appears to significantly manifest in surface climate anomalies, including cooling in northeastern Africa and Middle East, and wet anomalies over southern China. In this section, we aimed to provide a possible explanation for these robust solar signals.
Previous studies have found that the SAJLWT pattern is closely associated with the upstream circulation patterns over the NAE region, as well as SST and convection anomalies over the tropical Indo-Pacific region (Wei et al., 2022). Coincidentally, significant solar signals exist in two regions, including a NAO-like pattern in the NAE region and a weakened Walker Circulation in the Indo-Pacific region. Therefore, both of these solar signals may impact the SAJ variability. In this section, the two routes of mechanisms are presented to clarify why the solar signal particularly manifests in the SAJLWT.
4.1 The NAE pathway of the solar modulation
In JFM, the solar pattern features a northwest–southeast dipole over the NAE region, including a significant negative (positive) GPH anomaly over the Iceland (Europe) region, consistent with the finding of Brugnara et al. (2013). To investigate the possible causes, Figure 6 shows the bi-month (November-December, December-January, January-February, and February-March, short for ND, DJ, JF, and FM, respectively) evolution of solar signals in zonal mean zonal wind averaged over the Atlantic sector (60–-0°W). As is seen, a significant positive zonal wind signal appears at around 60–80°N at 150–10 hPa in DJ, corresponding to an intensified stratospheric polar vortex. As had been suggested by many previous studies, this positive zonal wind anomaly is associated with the enlarged meridional temperature gradient in the stratosphere, which is related to variations in UV absorption and changes of ozone levels in the stratosphere. As season evolves, this stratospheric zonal wind anomaly exhibits clear downward propagation toward the troposphere. In JF and FM, the significant positive zonal wind reaches at around 60°N, physically consistent with the circulation pattern shown in Figure 1A. Therefore, our analysis suggests the observed circulation pattern over the NAE region may largely reflect a “top–down” solar forcing, consistent with the findings of previous studies (Ineson et al., 2011; Chen et al., 2015). Notably, several studies suggest the local ocean–atmosphere process also acts to shape the solar pattern over the NAE region (Gray et al., 2016).
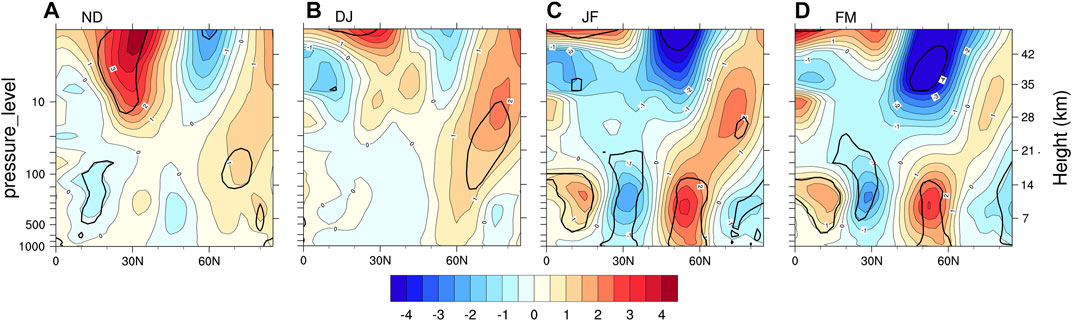
FIGURE 6. Latitude-height cross-sections of SC signals in zonal mean zonal wind (m/s) over the Atlantic sector (60-0°W) using the MLR Eq. 1 during (A) November-December (ND), (B) December-January (DJ), (C) January-February (JF) and (D) February-March (FM). Black contours denote regions statistical significant at the 10% level. This figure is based on ERA-Interim reanalysis covering winter 1979/1980-2009/2010.
Several recent studies had demonstrated this circulation pattern could excite the SAJLWT pattern through downstream propagation of the Rossby wave train (e.g., Huang et al., 2020). Thus, it is reasonable to speculate that the NAE solar pattern could trigger the SAJLWT through Rossby wave energy propagation. Figure 7 displays solar signals in 250-hPa GPH anomalies and the WAFs. The source of the solar wave train originates from the mid-high latitudes of the North Atlantic Ocean. The 250-hPa WAFs start from the Gulf stream region propagating eastward, and then intensify and turn southeastward over Europe. Afterward, the wave energy is injected into the entrance of the SAJ, which causes cyclonic anomalies over the Middle East and a southeastward shift of the MEJ (western part of the SAJ). Such clear and evident WAFs allow us to interpret these upstream lobes of the solar wave pattern, including circulation anomalies over the NAE region and the Middle East region, as stationary Rossby waves propagating southeastward from the North Atlantic Ocean. However, we note that the WAFs toward EA are less clear and evident than those in the NAE region.
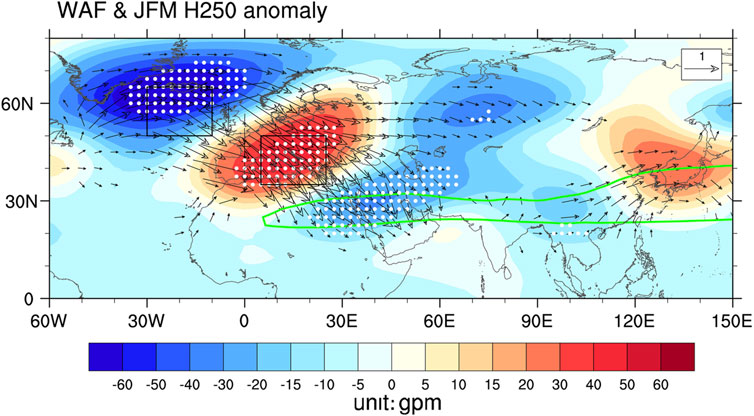
FIGURE 7. SC signals in the JFM 250-hPa GPH (unit: gpm); solid white dots denote statistical significance at the 5% level, and the vectors denote wave activity flux (Takaya & Nakamura, 2001) at 250 hPa (unit:
Considering the solar signal over the NAE region resembles a northwest–southeast tilted NAO (TNAO) pattern, here, we construct a TNAO index (TNAOI) to quantify the solar impact over the NAE region. The TNAOI is defined as the standardized difference of area averaged GPH anomalies over 35–50°N, 5–25°E and 50–65°N, 30–10°W regions, representing the strength of the northwest–southeast dipole anomaly over this region. The correlation between TNAOI and PC1 is 0.42 (p < 0.01), suggesting the TNAO pattern may bridge the SC–SAJLWT relationship. Figure 8 displays the TNAOI-associated circulation anomalies. By comparing Figure 8 and Figure 1, it is seen that the TNAO and solar patterns are generally consistent over the NAE region, the Middle East, and India, indicating the solar-associated TNAO pattern play an important role in the upstream portions of the SAJLWT. However, the TNAO impact is relatively weak over EA, thus suggesting the TNAO pattern may only partly explain the observed EA circulation anomalies. On the other hand, we also note that northeastward WAFs prevail between the South China Sea and Northeast Asia (Figure 7), hinting a remote influence of tropical convection to the EA circulation anomalies.
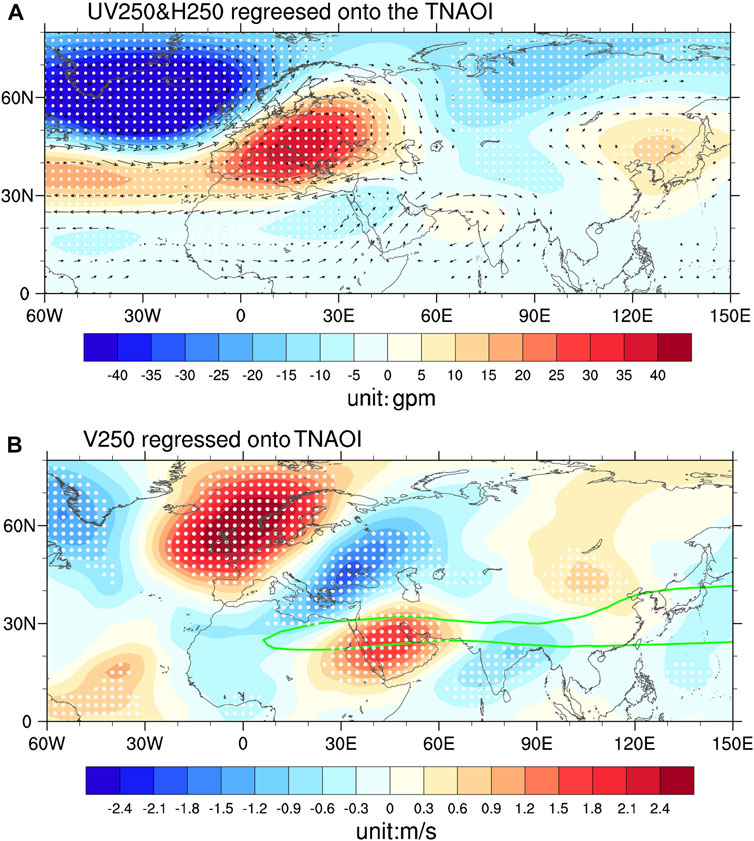
FIGURE 8. (A) Regressions of GPH (shaded, unit: gpm) and wind anomaly (vector, unit: m/s) at 250-hPa on TNAOI. (B) Regressions of meridional wind (shaded, unit: m/s) at 250 hPa on TNAOI. Solid black dots denote that the regression coefficients are statistically significant at the 5% level (i.e., p<0.05); only the wind vector that is statistically significant at the 5% level is shown. The green contour represents the climatological jet stream (40 m/s of zonal wind).
4.2 The Indo-Pacific pathway of solar modulation
Previous studies suggested that the SAJLWT pattern can be modulated by SST and convection anomalies over the Indo-Pacific sector (Hu et al., 2018; Wei et al., 2022). To demonstrate this, Figure 9 shows regressed SST, precipitation, and 850-hPa wind anomalies onto PC1. As is shown in Figure 9A, associated with the positive phase of the PC1, the SST anomaly resembles the El Niño pattern, with significant warming appearing over tropical EP and IO, while cooling exists over WP. Correspondingly, significant positive precipitation anomalies appear over tropical EP and IO, whereas significant negative precipitation anomalies are detected over the MC region (Figure 9B). The low-level easterly anomaly exists over MC and IO, and the westerly anomaly appears over CP and WP, indicative of a weakened Walker Circulation. These features are generally consistent with previous findings, which also demonstrate positive PC1 is associated with El Niño-like rainfall/convection anomalies in the tropics (Hu et al., 2018).
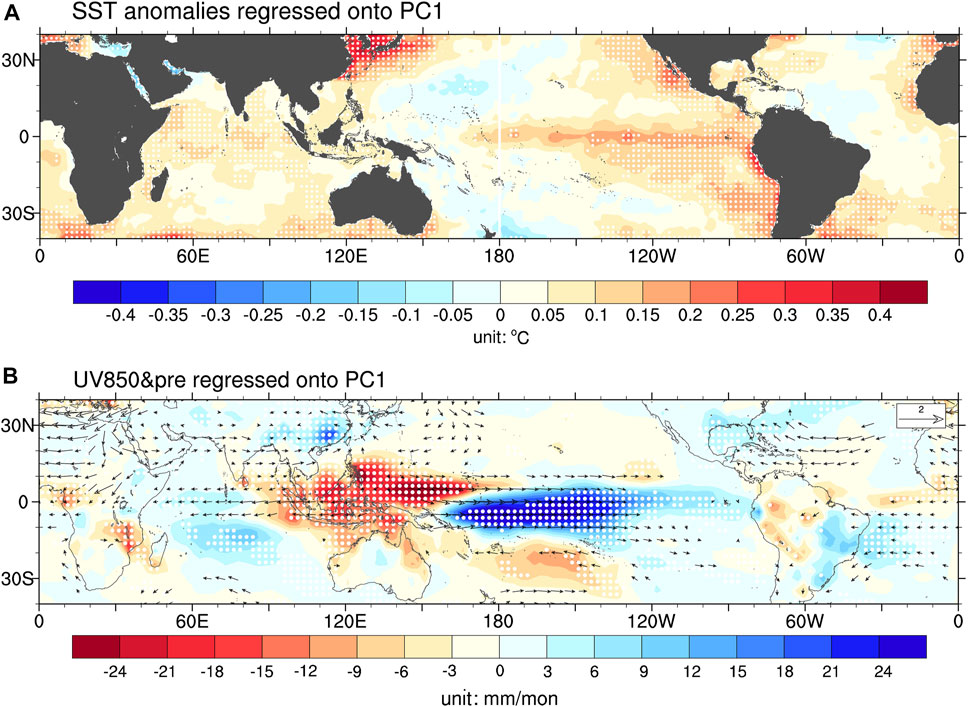
FIGURE 9. (A) Regression map of the SST anomaly (shading, unit: °C) against the PC1 in JFM for the period of 1901–2010. (B) Regressions of precipitation anomalies (shaded, unit: gpm) and wind anomaly (vector, unit: m/s) at 850-hPa on the PC1. Solid black dots denote that the regression coefficients of precipitation anomalies are statistically significant at the 5% level (i.e., p<0.05), and only the wind vector that is significant at the 5% level is shown.
We then display the solar signal in tropical SST, precipitation, and 850-hPa wind anomalies, as shown in Figure 10. We note that the solar SST pattern (Figure 10A) across the tropics is distinct with the PC1-associated SST pattern. It dislikes the El Niño pattern, particularly over EP (Figure 10A). However, the SST distribution from CP to IO still bears some resemblance with El Niño. The CP and IO show warming, while WP shows cooling. Such an SST pattern would drive positive precipitation anomalies in tropical CP and IO, and negative significant precipitation anomalies over the MC region (Figure 10B). The correlation coefficient between the SSN and the MC precipitation index (MCPI), defined as the domain average of precipitation anomalies over the 10°S–10°N and 100–150°E region, is −0.32, exceeding the 0.01 significance level. In addition, the significant 850-hPa westerly anomaly appears at equatorial central-western Pacific Ocean. Therefore, enhanced solar activity is also associated with suppressed convection around over the MC and a weakened Walker Circulation, generally consistent with the previous finding of Misios et al. (2019).
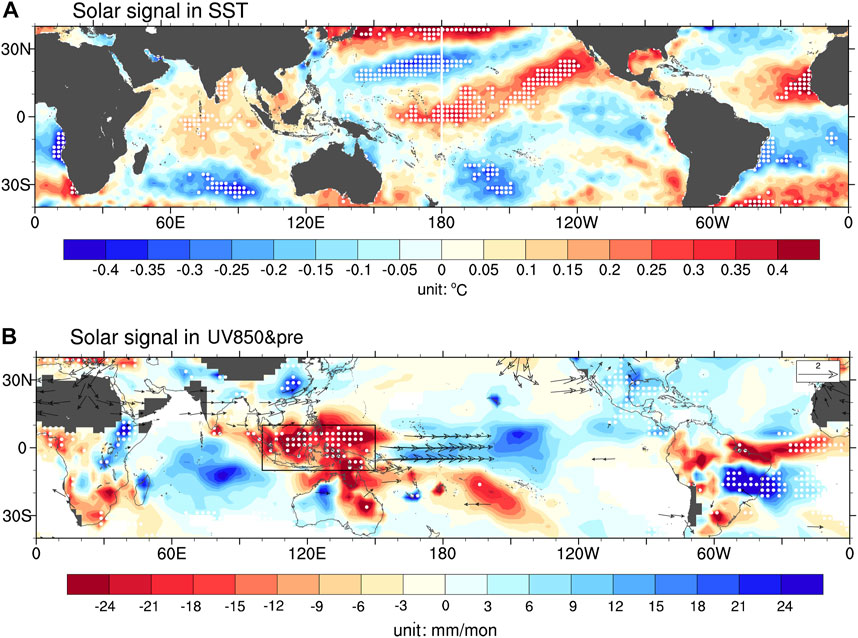
FIGURE 10. (A) SC signals in tropical SST (shading, unit: °C). (B) SC signals in precipitation anomalies (shaded, unit: gpm) and wind anomaly (vector, unit: m/s) at 850-hPa; the definition of the SC signal here is the same as Figure 1. Solid black dots denote regions where the SC signals are statistically significant at the 5% level (i.e., p<0.05) after prewhitening and a 1000-trial bootstrap resampling test. Only the wind vector that is statistically significant at the 5% level is shown. The black rectangle is consistent with the area of MCPI definition. The SC signals are obtained from MLR (Eq. 1).
As revealed previously, SC weakens the Walker Circulation and induces significant dry anomalies over the MC region. We, thus, hypothesized that the close relationship between the SC and the SAJLWT pattern could also be partly established via solar impact on the MC convection anomalies. To support this hypothesis, we compute regressed 250-hPa circulation anomalies onto MCPI, as shown in Figure 11. The GPH/wind field bears high resemblance for the downstream portions of the solar-associated wave pattern (Figure 1), suggesting MC convection anomalies may play a role in the solar–SAJLWT relationship.
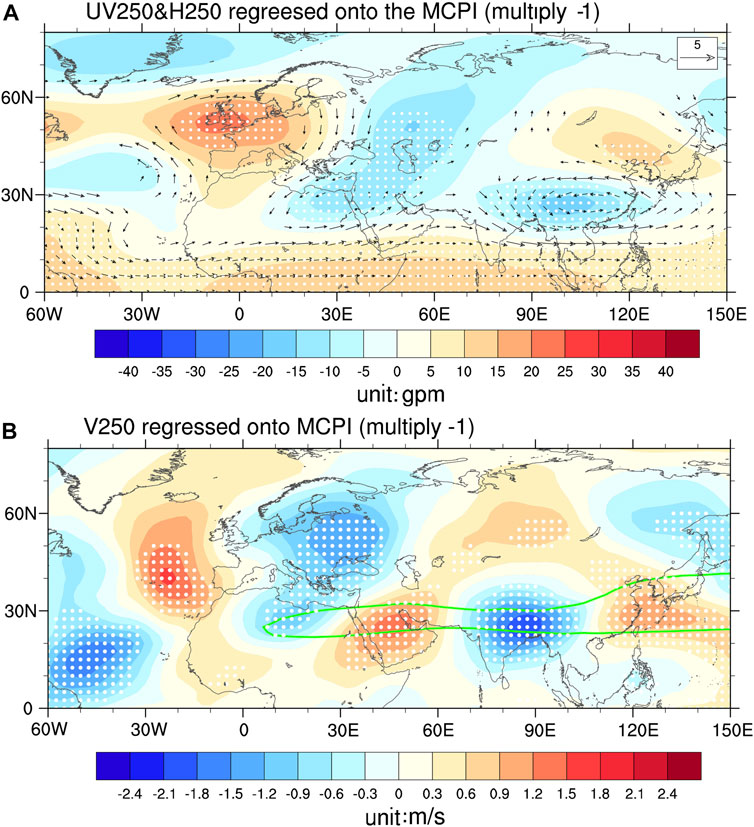
FIGURE 11. The same as Figure 8, but for regressions of (A) GPH (shaded, unit: gpm) and wind anomaly (vector, unit: m/s) at 250-hPa and (B) meridional wind (shaded, unit: m/s) at 250 hPa onto the MCPI.
Previous observational and modeling studies had pointed out that suppressed convection over the MC would reduce local latent heat release in the mid troposphere, which excites a Gill-type response with a cyclonic anomaly in the upper troposphere of the Indo-China Peninsula and southern China. Then, a northeastward anomalous Rossby wave train is triggered, resulting in a positive center of the GPH anomaly over the Japan Sea (Sakai and Kawamura, 2009; Leung et al., 2017). We note that Figure 11A shows a similar northeastward Rossby wave train over EA, physically consistent with these previous findings. The MC convection-induced GPH pattern would also determine v anomalies over India and the East China Sea, coinciding with the downstream nodes of the SAJLWT. However, notably, Figures 11A, B also show wave-like circulation anomalies over Europe and Middle East, which is beyond the scope of MC convection-induced Rossby wave train. One possible explanation is the close correlation between MC convection and IO convection, and the latter had been demonstrated to be significantly linked to wave patterns over Europe and Middle East (Wei et al., 2022). Although the linear regression approach cannot well separate the effects of two closely dependent phenomena, therefore, we may infer that the MC convection mainly impacts the downstream parts of the SAJLWT over Asia.
It is necessary to further point out the TNAO pattern and the MC convection anomalies seem to be two independent solar signals. On one hand, according to a previous literature report, they have different driving mechanisms corresponding to “top–down” and “bottom–up” solar forcing (Kodera et al., 2016). On the other hand, the correlation between TNAOI and MCPI is weak (r = 0.07). Moreover, we had also examined the 250-hPa solar signal over the Pacific–North America sector (not shown) and ruled out the possibility that the NAE circulation pattern is induced by Rossby wave propagation from the Indo-Pacific domain. These aforementioned analyses demonstrate two independent solar signals in NAE and Indo-Pacific sectors that act in concert to exert significant impacts on the SAJLWT.
5 Summary and discussion
In wintertime, the SAJ plays a very important role in weather and climate variations over the southern part of the Eurasian continent. Particularly, in the recent decade, growing interest had been focused on the SAJLWT mode since some extreme wintertime rainfalls, snowfalls, and temperature anomalies are closely associated with this pattern (Wen et al., 2009). Thus, it is important to discover the physical processes that drive the SAJLWT. However, as an important source of regional decadal climate variability, the role of SC in SAJLWT variability remains unclear.
The present study reveals a robust and significant SC influence on the SAJLWT in late winter (January–March). Our analysis suggests that the in-phase correlation between SC and the SAJLWT is not only statistically significant but also consistent over time. Associated with the solar-induced SAJ anomalies, significant cooling exists over northeastern Africa and the Middle East, while significant positive precipitation anomalies appear over southern China. Two routes of mechanisms are presented to clarify why a solar signal particularly manifests in the SAJLWT pattern. One is due to the solar-induced TNAO pattern over the NAE region, which may reflect a “top–down” solar forcing and the ocean–atmosphere coupling in the North Atlantic Ocean. This TNAO pattern can trigger downstream WAFs along the SAJ, thus forming the SAJLWT pattern. Notably, the TNAO-induced WAFs are more closely linked to the upstream portions of the SAJLWT while exerting relatively weaker impact on circulation anomalies over EA. The other mechanism involves weakened convection over the MC region, which reflects solar-induced weakened PWC via “bottom–up” processes. The MC convection anomaly associated with the weakened PWC would also excite a SAJLWT-like circulation pattern. Our analysis demonstrates two independent solar signals, namely, the TNAO pattern in the NAE region and the MC convection anomalies in the Indo-Pacific sectors, that act jointly to exert a significant impact on the SAJLWT.
In recent decades, much effort had been focused on two different groups of solar signals. One is the NAO-like pattern in the NH winter, which is dominated by the “top–down” solar forcing. The other is the CP ENSO-like pattern in the Indo-Pacific sector dominated by the “bottom–up” mechanism (Gray et al., 2010; Kodera et al., 2016). However, less attention had been paid on the potential combining effects of these two solar signals, particularly for the Eurasia continent, which receive remote forcing from both the NAE and the Indo-Pacific sector. The present study demonstrates these two different solar signals may work jointly to produce significant climate effects over southern Eurasia. Our results highlight that SC forcing is an appreciable source of SAJ decadal variability, which shows potential in improving decadal predictability in southern Eurasia. Although our analysis underlines the role of NAE circulation anomalies and the MC convection anomalies in controlling the SAJ responses, the current observational analysis does not allow us to determine their relative contributions quantitatively. Further modeling studies in future are required to achieve a comprehensive understanding on this issue.
Data availability statement
Publicly available datasets were analyzed in this study. These data can be found here: in this study, monthly sunspot numbers (SSNs) are used to quantify the solar activity, which can be downloaded at http://www.esrl.noaa.gov/psd/gcos_wgsp/Timeseries/SUNSPOT/. In order to characterize the impacts from the major volcanic eruptions, the Northern Hemisphere-averaged stratospheric aerosol optical depth (AOD) is used, which can be downloaded from https://data.giss.nasa.gov/modelforce/strataer/.
Author contributions
HM and RW contributed to the conception and design of the study. XnL, XaL, and AL organized the database. XnL and XaL performed the statistical analysis. HM wrote the first draft of the manuscript. RW and XnL wrote sections of the manuscript. All authors contributed to the article and approved the submitted version.
Funding
This study was jointly supported by the Natural Science Foundation of Hubei Province (2022CFB983), Joint Open Project of KLME & CIC-FEMD, NUIST (KLME202101), Basic Research Fund of WHIHR (202311), Hubei Meteorological Administration Scientific Project (2023Q03), the Scientific Research Foundation of CUIT (KYTZ202124, KYTZ202123, and KYQN202201).
Conflict of interest
The authors declare that the research was conducted in the absence of any commercial or financial relationships that could be construed as a potential conflict of interest.
Publisher’s note
All claims expressed in this article are solely those of the authors and do not necessarily represent those of their affiliated organizations, or those of the publisher, the editors, and the reviewers. Any product that may be evaluated in this article, or claim that may be made by its manufacturer, is not guaranteed or endorsed by the publisher.
References
Branstator, G. (2002). Circumglobal teleconnections, the jet stream waveguide, and the North Atlantic Oscillation. J. Clim. 15, 1893–1910. doi:10.1175/1520-0442(2002)015<1893:cttjsw>2.0.co;2
Brugnara, Y., Brönnimann, S., Luterbacher, J., and Rozanov, E. (2013). Influence of the sunspot cycle on the Northern Hemisphere wintertime circulation from long upper-air data sets. Atmos. Chem. Phys. 13, 6275–6288. doi:10.5194/acp-13-6275-2013
Chen, M., Xie, P., Janowiak, J., and Arkin, P. (2002). Global land precipitation: A 50-yr monthly analysis based on gauge observations. J. Hydrometeorol. 3, 249–266. doi:10.1175/1525-7541(2002)003<0249:glpaym>2.0.co;2
Chen, H., Ma, H., Li, X., and Sun, S. (2015). Solar influences on spatial patterns of Eurasian winter temperature and atmospheric general circulation anomalies. J. Geophys. Res. Atmos. 120, 8642–8657. doi:10.1002/2015jd023415
Dee, D., Uppala, S., Simmons, A., Berrisford, P., Poli, P., Kobayashi, S., et al. (2011). The ERA-interim reanalysis: Configuration and performance of the data assimilation system. Q. J. R. Meteorol. Soc. 137, 553–597. doi:10.1002/qj.828
Ding, F., and Li, C. (2017). Subtropical westerly jet waveguide and winter persistent heavy rainfall in South China. J. Geophys. Res. Atmos. 122, 7385–7400. doi:10.1002/2017jd026530
Frame, T., and Gray, L. (2010). The 11-yr solar cycle in ERA-40 data: An update to 2008. J. Clim. 23, 2213–2222. doi:10.1175/2009jcli3150.1
Gray, L. J., Beer, J., Geller, M., Haigh, J. D., Lockwood, M., Matthes, K., et al. (2010). Solar influences on climate. Rev. Geophys. 48, RG4001. doi:10.1029/2009RG000282
Gray, L., Scaife, A., Mitchell, D., Osprey, S., Ineson, S., Hardiman, S., et al. (2013). A lagged response to the 11 year solar cycle in observed winter Atlantic/European weather patterns. J. Geophys. Res. Atmos. 118, 13,405–13,420. doi:10.1002/2013jd020062
Gray, L., Woollings, T., Andrews, M., and Knight, J. (2016). Eleven-year solar cycle signal in the NAO and Atlantic/European blocking. Q. J. R. Meteorol. Soc. 142, 1890–1903. doi:10.1002/qj.2782
Harris, I., Jones, P., Osborn, T., and Lister, D. (2014). Updated high-resolution grids of monthly climatic observations–the CRU TS3. 10 Dataset Int. J. Climatol. 34 (3), 623–642. doi:10.1002/joc.3711
Hood, L., Schimanke, S., Spangehl, T., Bal, S., and Cubasch, U. (2013). The surface climate response to 11-yr solar forcing during northern winter: Observational analyses and comparisons with GCM simulations. J. Clim. 26, 7489–7506. doi:10.1175/JCLI-D-12-00843.1
Hu, K., Huang, G., Wu, R., and Wang, L. (2018). Structure and dynamics of a wave train along the wintertime Asian jet and its impact on East Asian climate. Clim. Dyn. 51, 4123–4137. doi:10.1007/s00382-017-3674-1
Huang, S., Li, X., and Wen, Z. (2020). Characteristics and possible sources of the intraseasonal South Asian jet wave train in boreal winter. J. Clim. 33, 10523–10537. doi:10.1175/JCLI-D-20-0125.1
Huo, W., and Xiao, Z. (2017). Modulations of solar activity on El niño modoki and possible mechanisms. J. Atmos. Solar-Terrestrial Phys. 160, 34–47. doi:10.1016/j.jastp.2017.05.008
Huo, W., Xiao, Z., Wang, X., and Zhao, L. (2021). Lagged responses of the tropical Pacific to the 11-yr solar cycle forcing and possible mechanisms. J. Meteor. Res. 35 (3), 444–459. doi:10.1007/s13351-021-0137-8
Ineson, S., Scaife, A., Knight, J., Manners, J., Dunstone, N., Gray, L., et al. (2011). Solar forcing of winter climate variability in the Northern Hemisphere. Nat. Geosci. 4, 753–757. doi:10.1038/ngeo1282
Kodera, K., Thieblemont, R., Yukimoto, S., and Matthes, K. (2016). How can we understand the solar cycle signal on the Earth's surface? Atmos. Chem. Phys. 138, 12925–12944. doi:10.5194/acp-16-12925-2016
Lean, J., and Rind, D. (2008). How natural and anthropogenic influences alter global and regional surface temperatures: 1889 to 2006. Geophys. Res. Lett. 35, L18701. doi:10.1029/2008gl034864
Leung, M., Cheung, H., and Zhou, W. (2017). Meridional displacement of the East Asian trough and its response to the ENSO forcing. Clim. Dyn. 48, 335–352. doi:10.1007/s00382-016-3077-8
Li, X., Chen, Y., and Zhou, W. (2017). Response of winter moisture circulation to the India-Burma trough and its modulation by the South Asian waveguide. J. Clim. 30, 1197–1210. doi:10.1175/JCLI-D-16-0111.1
Li, X., Wen, Z., and Huang, W. R. (2020). Modulation of South Asian jet wave train on the extreme winter precipitation over southeast China: Comparison between 2015/16 and 2018/19. J. Clim. 33, 4065–4081. doi:10.1175/JCLI-D-19-0678.1
Li, X. (2021). Maintenance of the South Asian jet wave train: eddy kinetic energy balance. Clim. Dyn. 57 (3-4), 687–700. doi:10.1007/s00382-021-05735-7
Ma, H., Chen, H., Gray, L., Zhou, L., Li, X., Wang, R., et al. (2018). Changing response of the North Atlantic/European winter climate to the 11 year solar cycle. Environ. Res. Lett. 13 (3), 034007. doi:10.1088/1748-9326/aa9e94
Ma, H., Chen, H., Lai, A., Li, X., Wang, R., and Gao, C. (2019). Robust solar signature in late winter precipitation over southern China. Geophys. Res. Lett. 46, 9940–9948. doi:10.1029/2019GL084083
Misios, S., Mitchell, D. M., Gray, L. J., Tourpali, K., Matthes, K., Hood, L., et al. (2016). Solar signals in CMIP-5 simulations: Effects of atmosphere-ocean coupling. Q. J. R. Meteorol. Soc. 142, 928–941. doi:10.1002/qj.2695
Misios, S., Gray, L. J., Knudsen, M. F., Karoff, C., Schmidt, H., and Haigh, J. D. (2019). Slowdown of the Walker circulation at solar cycle maximum. Proc. Natl. Acad. Sci. 116 (15), 7186–7191. doi:10.1073/pnas.1815060116
Poli, P., Hersbach, H., Dee, D., Berrisford, P., Simmons, A., Vitart, F., et al. (2016). ERA-20C: An atmospheric reanalysis of the twentieth century. J. Clim. 29 (11), 4083–4097. doi:10.1175/JCLI-D-15-0556.1
Rayner, N., Parker, D., Horton, E., Folland, C., Alexander, L., Rowell, D., et al. (2003). Global analyses of sea surface temperature, sea ice, and night marine air temperature since the late nineteenth century. J. Geophys. Res. Atmos. 108, 4407. doi:10.1029/2002JD002670
Roy, I., and Haigh, J. (2010). Solar cycle signals in sea level pressure and sea surface temperature. Atmos. Chem. Phys. 10, 3147–3153. doi:10.5194/acp-10-3147-2010
Sakai, K., and Kawamura, R. (2009). Remote response of the East Asian winter monsoon to tropical forcing related to El Nin˜o–Southern Oscillation. J. Geophys. Res. 114, D06105. doi:10.1029/2008JD010824
Scaife, A., Ineson, S., Knight, J., Gray, L., Kodera, K., and Smith, D. (2013). A mechanism for lagged North Atlantic climate response to solar variability. Geophys. Res. Lett. 40 (2), 434–439. doi:10.1002/grl.50099
Shen, X., Zhou, N., Yang, S., and Miao, R. (2019). Analysis of two extreme precipitation events and circulation anomalies in Yunnan province in winter of 2015. Torrential Rain Disasters 38, 380–385. (in Chinese). doi:10.3969/j.issn.1004-9045.2019.04.011
Song, J., Li, C., and Zhou, W. (2014). High and low latitude types of the downstream influences of the North Atlantic Oscillation. Clim. Dyn. 42, 1097–1111. doi:10.1007/s00382-013-1844-3
Takaya, K., and Nakamura, H. (2001). A formulation of a phase-independent wave-activity flux for stationary and migratory quasigeostrophic eddies on a zonally varying basic flow. J. Atmos. Sci. 58, 608–627. doi:10.1175/1520-0469(2001)058<0608:AFOAPI>2.0.CO;2
Thiéblemont, R., Matthes, K., Omrani, N., Kodera, K., and Hansen, F. (2015). Solar forcing synchronizes decadal North Atlantic climate variability. Nat. Commun. 6, 8268. doi:10.1038/ncomms9268
Watanabe, M. (2004). Asian jet waveguide and a downstream extension of the North Atlantic oscillation. J. Clim. 17, 4674–4691. doi:10.1175/JCLI-3228.1
Wei, W., Ren, Q., Lu, M., and Yang, S. (2022). Zonal extension of the Middle East jet stream and its Influence on the Asian monsoon. J. Clim. 35 (14), 4741–4751. doi:10.1175/JCLI-D-21-0697.1
Wen, M., Yang, S., Kumar, A., and Zhang, P. (2009). An analysis of the large-scale climate anomalies associated with the snowstorms affecting China in January 2008. Mon. Wea. Rev. 137, 1111–1131. doi:10.1175/2008MWR2638.1
Wirth, V., Riemer, M., Chang, E., and Martius, O. (2018). Rossby wave packets on the mid-latitude waveguide: A review. Mon. Wea. Rev. 146, 1965–2001. doi:10.1175/MWR-D-16-0483.1
Yang, S., Lau, K., Yoo, S., Kinter, J., Miyakoda, K., and Ho, C. (2004). Upstream subtropical signals preceding the Asian summer monsoon circulation. J. Clim. 17 (21), 4213–4229. doi:10.1175/JCLI3192.1
Keywords: 11-year solar cycle, South Asian jet, wave train, sea surface temperature, tropical convection
Citation: Ma H, Wang R, Li X, Lai A and Li X (2023) 11-year solar cycle influences on the late-wintertime South Asian jet variability. Front. Earth Sci. 11:1203954. doi: 10.3389/feart.2023.1203954
Received: 11 April 2023; Accepted: 26 June 2023;
Published: 13 July 2023.
Edited by:
Liang Zhao, Chinese Academy of Sciences (CAS), ChinaReviewed by:
Chunhan Jin, Xinjiang University, ChinaHui Li, Chinese Academy of Sciences (CAS), China
Copyright © 2023 Ma, Wang, Li, Lai and Li. This is an open-access article distributed under the terms of the Creative Commons Attribution License (CC BY). The use, distribution or reproduction in other forums is permitted, provided the original author(s) and the copyright owner(s) are credited and that the original publication in this journal is cited, in accordance with accepted academic practice. No use, distribution or reproduction is permitted which does not comply with these terms.
*Correspondence: Ruili Wang, d2FuZ3JsXzA2QDE2My5jb20=