 Jiangfan Gu
 Sheng Jin1,2*
 Hao Dong
 Gaofeng Ye
 Letian Zhang
- 1School of Geophysics and Information Technology, China University of Geosciences, Beijing, China
- 2State Key Laboratory of Geological Processes and Mineral Resources, China University of Geosciences, Beijing, China
Located in the central part of the Tibetan Plateau, the Qiangtang terrane preserves important record of the uplift and deformation history of the Plateau, and therefore remains an attractive area of research. However, deep geophysical investigations of its western part are still limited. To further understand the deep structure of the western Qiangtang terrane and its surroundings, we use magnetotelluric array data to generate a 3D electrical structure. It reveals high resistivity anomalies in the upper crust and scattered high conductivity anomalies in the mid-lower crust. The electrical structure also suggests that the Longmu Co-Gozha Co fault once believed to be a major regional deformation boundary, may not have cut through the crust. The melt content and rheological parameters derived from the electrical structures show dominant ductile-type deformation in most of the study area, which contributes to block extrusion along the slip faults. Viscous deformation regions formed by mantle melt upwelling in the mid-lower crust may contribute to the formation of the N-S directed normal faults on the surface.
1 Introduction
The western Qiangtang terrane is located in the northwest part of the Tibetan Plateau, with the Bangong Co-Nujiang suture (BNS) in the south, the Longmu-Gozha Co slip fault (LGCF) in the north, and the Karakorum slip fault (KF) in the west forming the triangle-like borders of the region (Figure 1). This triangle-shaped tectonic formation of the western Qiangtang terrane differs from that of the central and eastern part of the plateau. This area lies on the western boundary of the V-sharp conjugate strike-slip fault zone (Yin and Taylor, 2011), in close proximity to the Plateau’s western boundary. Along with the strike-slip faults, a series of normal faults are distributed across this region, indicating the complicated crustal deformation that contributes to the formation of the plateau. The earthquakes were mostly concentrated in the upper-mid-crust, and most of them were normal and strike-slip faulting earthquakes (Dziewonski and Anderson, 1981; Ekström et al., 2012). InSAR and GPS data show that the strain rates within the western Qiangtang terrane are relatively high (Wang et al., 2019). The contractional stress mainly occurs inside the western Qiangtang terrane, while strike-slip stress occurs in the boundary of the terrane (Kreemer et al., 2014). On the other hand, the surface velocity of the region exhibits little eastward motion and a comparatively lower northward component compared to that of the south-central Tibetan Plateau (Wright et al., 2004). Consequently, the deep structure and deformation mechanism within this area may be distinctly different from that of the south-central part of the plateau, making them an attractive subject of research (Zhao et al., 2020). However, as previous geophysical surveys and numerical geodynamic models in this area remain relatively limited, the deep three-dimensional structure and rheological state are still poorly understood.
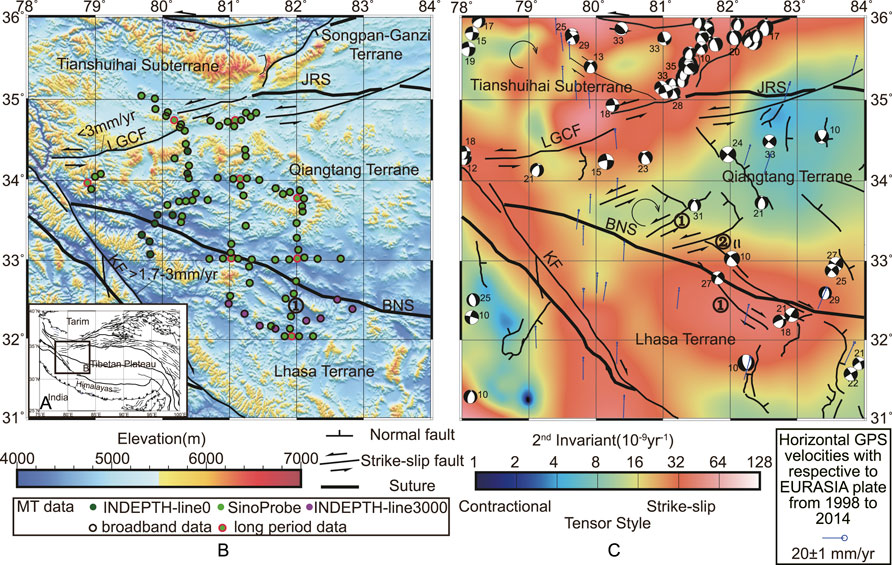
FIGURE 1. (A) Relative position of the area of MT survey (black box) in the Tibetan Plateau. (B) Topography relief map of the western Qiangtang terrane and its surroundings with major tectonic features indicated. The fault slip rates of the KF(Chevalier et al., 2016) and LGCF(Chevalier et al., 2017) are labeled. (C) Strain rate field in the western Qiangtang terrane and its surroundings (Kreemer et al., 2014). Focal depth and mechanisms for earthquakes in the research area (Dziewonski and Anderson, 1981; Ekström et al., 2012). Blue vectors indicate horizontal GPS velocities with respect to the EURASIA plate from 1998 to 2014 (Zhao et al., 2015). The blue arrows represent rotational directions (Chevalier et al., 2017). BNS: Bangong Co-Nujiang suture; KF: Karakorum fault; LGCF: Longmu Co-Gozha Co fault; JRS: Jinsha River suture; ①: Bue Co conjugate faults; and ②: Aishui Co conjugate faults.
Magnetotellurics (MT) is an important geophysical method to study the deep electrical structural features of the lithosphere, which allows the estimation of rheological conditions based on the conductivity model to provide evidence for regional evolutionary processes (Bai et al., 2010; Rippe and Unsworth, 2010; Unsworth, 2010; Dong et al., 2020). In this study, we first use the MT data to obtain a three-dimensional crustal electrical structure of the western Qiangtang terrane and its surrounding areas. We then use an experimentally calibrated relationship between electrical conductivity and melt fraction to investigate the possible melt distribution and the rheological properties of the mid-lower crust. Lastly, we discuss the model of potential deformation mechanisms based on the inferred deep rheological structure and the surface responses of the active tectonics in this area.
2 Magnetotelluric data and analysis
2.1 Magnetotelluric data
Our study area includes most parts of the western Qiangtang terrane, the west end of the BNS, and the northern part of the western Lhasa terrane. We used 97 MT stations (Figure 1), including eight long-period MT data and 89 broadband MT data, collected by the SinoProbe (Dong et al., 2013) and INDEPTH-MT projects (Jin et al., 2007). The SinoProbe broadband MT (BBMT) data were collected using the Phoenix MTU-5 system, while the INDEPTH-MT BBMT data were collected using both the Phoenix MTU-5 system and the EMI MT24 system for more than 24 h. The long-period MT (LMT) data were collected using the LVIV Lemi-417 system for more than 7 days per site. All data were collected using at least two electric channels and three magnetic channels.
Time series were analyzed and processed using robust statistic methods (BBMT: (Egbert and Booker, 1986; Egbert, 1997); LMT (Varentsov et al., 2003)) to estimate the MT transfer functions of BBMT data with a period range of 0.01–3,000 s and LMT data with a period range of 0.01–10,000 s. Because of the lack of human activity around the stations, the data quality of most stations was pretty good.
To date, only one other 2D MT study involved in the western Qiangtang terrane has been published (Jin et al., 2007), and this prior study focused on the electrical structure of the BNS. The dataset presented in this paper will provide the first 3D electrical structure focused on the western Qiangtang terrane and its surrounding areas.
2.2 Dimensional analysis
As the inversion of MT data is greatly simplified when applying a 2D assumption, it is necessary to get an overview of the MT data with its dimensionality. The phase tensors are calculated by using the algorithm given by Caldwell et al. (2004) in different frequencies (in Figure 2). In 1D configurations, the phase tensor ellipse is a circle. In 2D, the major axis direction of the phase tensor ellipse may be parallel or perpendicular to the electrical major axis direction. The filled color in the ellipse shows the 2D deviation angle β. If |β| > ±3°, it indicates significant 3D tectonic features (Booker, 2014).
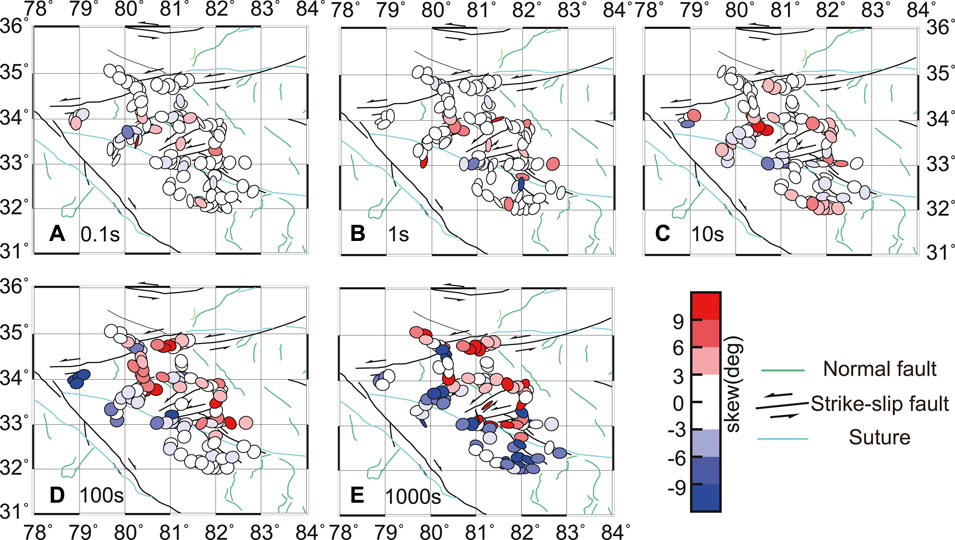
FIGURE 2. Results of phase tensor analysis for all stations with periods of (A) 0.1 s, (B) 1 s, (C) 10 s, (D) 100 s, and (E) 1,000 s.
In the period of 0.1–1 s, most of the data have a 2D deviation angle |β| = 0 and the ellipses have unequal lengths of the long and short axes, indicating a 2D tectonic feature. The data with a 2D deviation angle |β| > 3 are mainly distributed near the suture zone, indicating inhomogeneous electrical characteristics within the suture zone. In the period of 10–100 s, there is an increase in the amount of data with a 2D deviation angle of |β| > 9, and the length of the long and short axes of the ellipse is unequal. The direction of the long axis of the polarized ellipse of the data located at the tectonic boundary is consistent with the area’s direction. The closer to the boundary, the larger |β|, the larger it is. 3D tectonic features are evident in the moderately deep region of the study area. In the period of 1,000 s, most of the data have a 2D deviation angle |β| > 9, indicating strong 3D features in the deeper part of the study area. Therefore, the data in the study area require 3D inversion to establish the electrical structure of the area.
3 3D inversion of the MT data
3.1 Inversion settings
The 3D inversion code package named ModEM (Kelbert et al., 2014) with the L-BFGS algorithm (Dong and Egbert, 2019) was carried out with the 117 full-impedance tensor MT data. Error floors of them were set to 5% of |Zxy×Zyx|0.5. To obtain further details of the deeper structure, we chose four frequency points between 0.1 and 1 s and 25 frequency points between 1 and 10,000 s evenly. The “core” area was discretized into a 10 km mesh in the north–south (x) and east–west (y) directions and a 50 m-thick uppermost layer with a step factor of 1.1. Therefore, a 60 × 63 × 66 mesh was finally formed. The start and initial models are uniform half-spaces of 100 Ω•m.
The preferred model was obtained after 209 iterations with the overall normalized-root-mean-squared (nRMS) misfit of 2.12, which has an initial nRMS misfit of 23.94. The distribution of the nRMS misfits of each station is illustrated in Figure 3. Overall, the data are fitted well, indicating that our preferred model is well-constrained and described satisfactorily by the observed data. For the impedance tensor, all the main features of the observed data are well reproduced by the calculated data by using our preferred model. A detailed comparison between the observed and calculated data can be found in Supplemental Material.
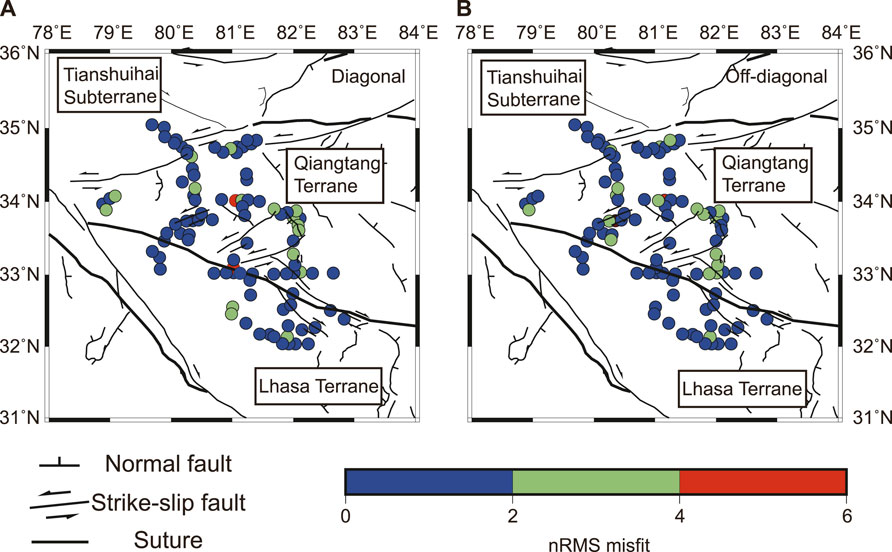
FIGURE 3. Distribution of nRMS misfits of 3-D inversion of diagonal and off-diagonal components. (A) Diagonal and (B) off-diagonal.
3.2 Preferred resistivity model
As the previous 2D result has shown (Jin et al., 2007), our preferred model also finds resistivity anomalies in the upper crust and conductivity anomalies in the mid-lower crust. The horizontal resistivity maps reveal a more intricate and complex geometry. To avoid potential false displays caused by site location and regularization mechanisms, we determined the confidence region at every depth to be circular, centered on each station’s location with a radius equal to the depth (opacity). The remaining regions are included for reference only (sub-transparent). According to the sensitivity test, the model is considered reliable for depths above 85 km (see Supplemental Material).
The main features of the resistivity model are the two conductivity anomalies in the mid-north of the Qiangtang terrane (C1) and the Lhasa terrane (C3), which are separated by resistivity anomaly under the BNS and south of the Qiangtang terrane (R) as shown in the longitude (N-S) resistivity section (Figures 4E–G). C1 and C3 extend from 20 km to the Moho (Zhang et al., 2014; Gilligan et al., 2015), with C1 extending deeper and C3 reaching some areas beneath the BNS. C1 is continuous only in the Qiangtang terrane’s northern region, while C3 is discontinuous in an east–west direction under the BNS. West of C1 and C3, there is a conductivity anomaly C2 in the junction of the KF, BNS, and LGCF (Figures 4A–C). The figure illustrates that the high conductivity anomaly C2 is closer to the normal faults rather than the strike-slip faults on the surface.
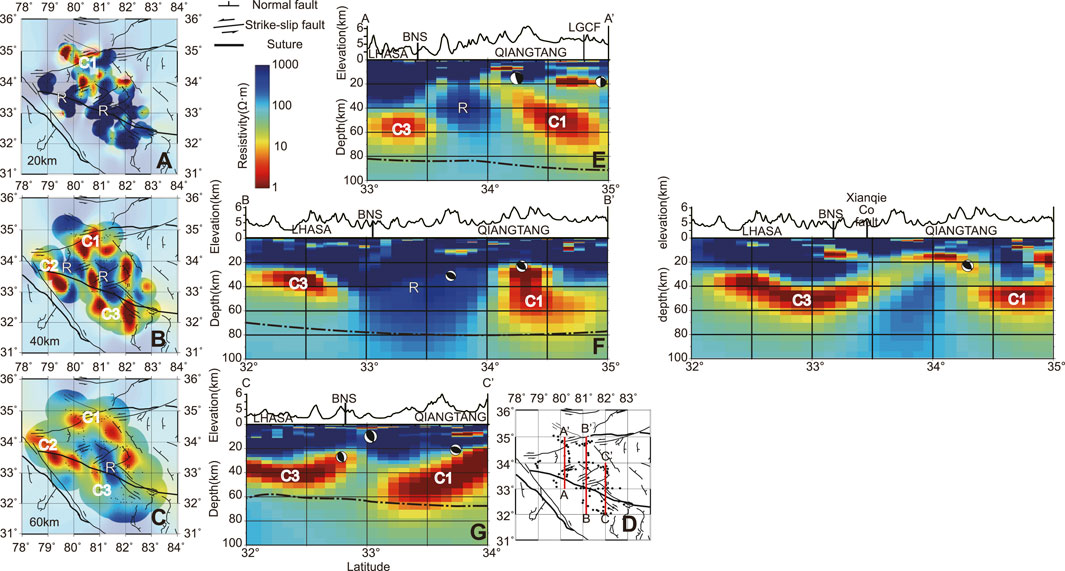
FIGURE 4. (A–C) Resistivity maps at depths of 20 km, 40 km, and 60 km. The black dots show the location of the MT sites. The confidence regions at each station’s location are circled with a radius equal to the depth, while the remaining regions are sub-transparent for reference only. See Figure 1 for the descriptions of the surface structures superimposed. (D) Red lines show the location of vertical slices (E–G). (E–G) Longitude (N–S) resistivity section of the preferred inversion model at ∼80°E (A–A′), ∼81°E (B–B′), and ∼82°E (C–C′). The beach balls show the focal earthquake mechanism in the research area (Dziewonski and Anderson, 1981; Ekström et al., 2012). The black dotted lines (E–G) indicate the Moho discontinuity surface (Zhang et al., 2014; Gilligan et al., 2015). BNS: Bangong Co-Nujiang suture; LGCF: Longmu Co-Gozha Co fault.
Our results reveal, for the first time, the electrical structure beneath the LGCF, which is believed to be the western extension of the Altyn Tagh fault and the western boundary of the eastward material movement. The sensitivity test identified a discontinuity between C1 and C2 beneath the LGCF (see Supplemental Material). Previous research using aeromagnetic (Xiong et al., 2016) and gravity data (Yin and Xu, 2017) found no clear boundary between the Tianshuihai subterrane and the Qiangtang terrane. The seismic result also suggests no significant discontinuity along the Moho surface beneath the LGCF, and the Vp/Vs result exhibits no significant variation between either side of the fault (Priestley et al., 2008; Wang et al., 2015). These findings suggest that the LGCF may not cut the entire crust.
The presence of high resistivity anomalies in the deep is indicative of the crystalline basement. The occurrence of a low-velocity or high-conductivity zone in the Tibetan Plateau crust is generally attributed to the presence of melt or salt-bearing fluids, which can significantly weaken the crust. In fact, most earthquakes occur within highly resistant bodies or at the boundary between highly resistant and low-resistant bodies (Figures 4E–G). The highly conductive Qiangtang mid-lower crust exhibits almost no seismic activity, suggesting the rocks in this region may be too weak for brittle damage. Conversely, earthquakes occurring near the BNS exhibit deeper focal depths, implying that the rocks are characterized by a higher strength profile in comparison to the Qiangtang terrane. This distinctive contrast in mechanical properties may potentially be linked to the distribution of ophiolites within the BNS (Wang et al., 2016). Seismicity is notably scarce below 40 km, suggesting that the rocks at this depth lack the ability to undergo brittle deformation.
The conductivity of the deep crust has been used to estimate fluid fraction and viscosity based on laboratory experiments in calibrating internal relationships. Our discussions below will focus on using the high conductivity zone (especially C1 in the Qiangtang terrane) to constrain the rheology of the crust, which can further help to understand surface deformation in the western Qiangtang terrane and its surrounding areas.
4 Discussion
4.1 Bridging the conductance and rheology properties
Similar to other regularized geophysical inversions, the ModEM MT inversion method aims to find a model that fits the data, while also maintaining smooth spatial variations between different layers, which is accomplished through the use of a smooth prior model and regularization to that prior (Kelbert et al., 2014; Dong and Egbert, 2019). Therefore, it is better to use the vertical conductance describing a conductor than the individual thickness and conductivities (Bai et al., 2010; Unsworth, 2010). Here, we integrate the vertical conductance values from depths of 20–75 km, which show that the conductance of C1 ranges from 5,500 to 16,500 S with 55 km thickness (Figure 5). In other words, the effective conductivity of C1 ranges from 0.1 to 0.3 S/m.
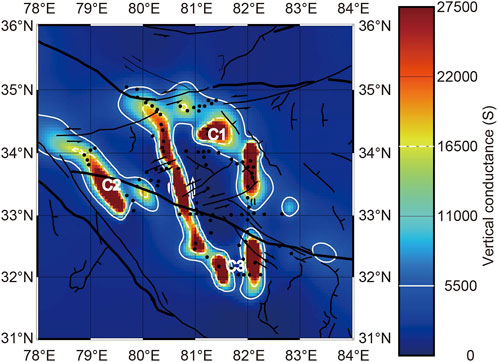
FIGURE 5. Vertical conductance map for depth from 20 to 75 km calculated by using the preferred resistivity model, where C1, C2, and C3 are labeled. The white line is the 5500 S contour line. The white dotted line is the 16,500 S contour line.
The high-conductivity zones observed in the mid-lower crust of the Tibetan Plateau, particularly when coinciding with low-velocity zones, are often interpreted as indicative of partial melt (Zeng et al., 2015; Li et al., 2020). Although the relationship between the high-conductivity zone and melt existence is still debated, it is worth considering for our study area, as volcanic activity has been found in the northern Qiangtang terrane from 5 Ma to near 1 Ma (Williams et al., 2004). Thus, we assume that C1 in our study area is indicative of the presence of melt.
To determine conductivity in partial melting zones, the region can be treated as a two-phase medium with solid and liquid phases, and conductivity can be estimated using the Modified Archie’s law empirical formula (Glover et al., 2000):
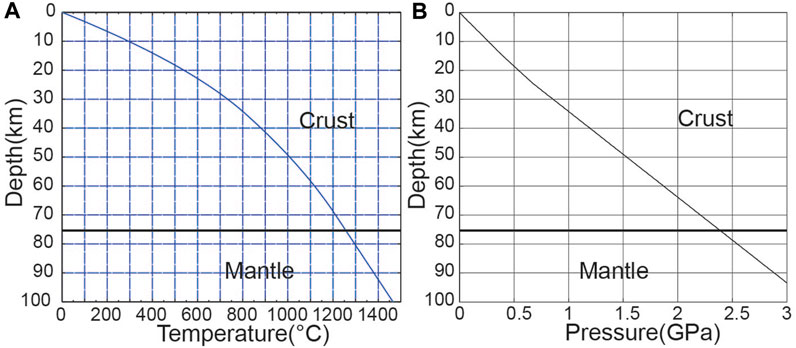
FIGURE 6. (A) Relationship between temperature and depth used in this paper; (B) relationship between pressure and depth used in this paper.
At this temperature and pressure condition, rock matrix conductivity can be estimated (Hashim et al., 2013). Pure melt conductivity (Guo et al., 2017) is determined from the latest volcanic composition, which is medium-acidic trachyandesite in this area (Wei et al., 2017). Water content can affect melt fraction estimates (Guo et al., 2017). The highest recorded water content in the western Qiangtang terrane is ∼6% (Williams et al., 2004). Due to the recent volcanic activities (<5 Ma) in the study area (Williams et al., 2004), we assume the melts are highly interconnected in the mid-lower crust. Thus, the relationship between melt fraction and conductivity at different depths was established using this water content (Figure 7A).
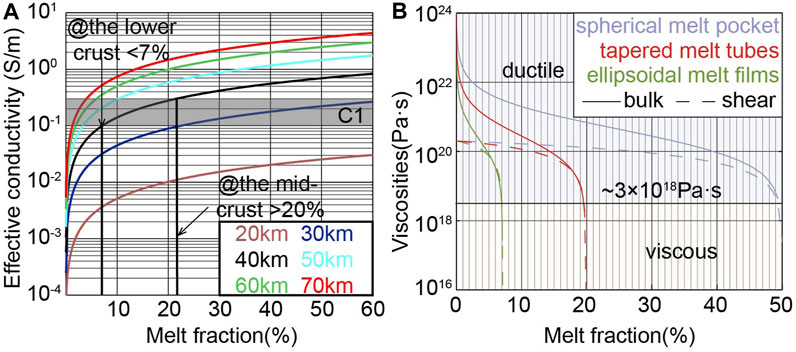
FIGURE 7. (A) Melt fraction with hydrous andesite melts, whose water content is approximately 6wt%, when the melt is interconnected; (B) relationship between melt fraction and bulk/shear viscosities in different melt distributions.
Estimations (Figure 7A) show that if the depth is larger, the melt fraction is lower for achieving a specific effective conductivity. At depths below 40 km, the estimated melt fraction is approximately 1%–7% for an effective conductivity of 0.1 S/m and approximately 4%–20% for an effective conductivity of 0.3 S/m. At 30 km depth, 0.1 S/m conductivity yields >20% melt, while higher conductivity requires more melt. Shallower depths need more melt for 0.1 S/m conductivity. Combined with the vertical profile, this estimate may indicate a low melt fraction (<7%) in the lower crust and a region of very high melt fraction (>20%) in the middle crust.
Our result suggests a higher estimate of melt fraction in the mid-lower crust compared to the previous seismic result (<3%) (Li et al., 2020). It should be noted that the previous study estimated the melt fraction of the entire crust, resulting in an average value. In contrast, our study provides a more detailed description of the melt distribution. The previous seismic result (Li et al., 2020) also indicated the presence of lower Vs in the mid-crust, implying a higher melt fraction in that region, which is consistent with our result.
Moreover, the extrusive igneous rocks in the northern part of the Qiangtang terrane are relatively young, with ages less than 5 Ma and some even younger than 0.3 Ma (Williams et al., 2004), indicating that C1 in the Qiangtang mid-crust could potentially be a high melt fraction zone, as previous studies proposed chambers at 10–25 km depth in this region (Yu et al., 2014). While it is possible that other volatile fractions may exist that could produce the same electrical conductivity anomalies with lower melt fractions (Hacker et al., 2014), this aspect is beyond the scope of this paper and will be investigated in future research. To estimate the rheology of the region, the current estimates are adequate.
The estimated melt fraction provides a qualitative understanding of the rheological properties of the region. Experimental studies have indicated that a melt fraction of more than 10% will significantly reduce the crustal strength (Rosenberg and Handy, 2005; Costa, 2021). The mid-lower crust’s shear viscosity can now be estimated based on the melt fraction using the pore elasticity equation (Schmeling, 1986; 1985; Schmeling et al., 2012) and an average viscosity of 2.0×10²⁰ Pa•s (Shinevar et al., 2015), assuming that the melt occurs in spherical or tubular inclusions (Figure 7B). Depending on the assumed melt geometry, both bulk and shear viscosity may be lower than 3×10¹⁸ Pa•s at different melt fractions: ∼50% for spherical molten pockets, ∼20% for tapered molten tubes, or 7% for ellipsoidal molten films. In other words, areas where the melt fraction is less than 7% are unlikely to exhibit viscous flow behavior. Therefore, C1 in the lower crust mainly deforms ductility and retains strength, with some patchy areas beneath the BNS and north of the Qiangtang terrane exhibiting viscous deformation. The mid-crust’s high-conductivity zone weakens and deforms viscously, while the rest of the crust deforms through ductility.
4.2 Regional deformation mechanisms
Based on the analysis from the previous section, the viscosity surpasses 3×10¹⁸ Pa s, in most of the western Qiangtang terrane. Therefore we believe that the primary deformation type for the regional crust should be ductile, except for the scattered high-conductivity anomalies representing viscosities below 3 × 10¹⁸ Pa•s. Moreover, the electrical model shows that LGCF does not fully cut through the crust, which indicates that the western Qiangtang and the Tianshuihai subterrane may remain connected in the deep crust (Chevalier et al., 2012). This also correlates with the GPS results showing consistent rotation directions for the two blocks (Wang and Shen, 2020). However, it is not easy to relate the rheology structure of the western Qiangtang terrane to the complex surface major tectonic distribution.
Unlike the situation in the central plateau, the craton-like Tarim Basin in the study area serves as an oblique boundary condition, owing to its angled orientation with respect to the northward subduction of the Indian plate (Wang and Shen, 2020). On the surface, the distributions of the strike-slip and north–south normal faults in the western Qiangtang terrane are much closer to each other compared to their distance in the central plateau (Taylor et al., 2003). The V-shaped conjugate strike-slip faults, such as Bue Co conjugate faults and Aishui Co conjugate faults, as well as KF and LGCF (Taylor et al., 2003) all exhibit an east-facing “<” orientation, indicating the occurrence of eastward motion in the region. However, the strike-slip motions of the KF and LGCF are less than 3 mm/yr (Wright et al., 2004; Raterman et al., 2007; Chevalier et al., 2017; 2016), while Aishui Co and Bue Co conjugate faults exhibit strike-slip rates ranging from 2.1–4.1 mm/yr (Taylor and Peltzer, 2006). These velocities are much lower than the strike-slip rates in the central Tibet Plateau (e.g., 6–11 mm/yr for Dong Co faults) (Taylor and Peltzer, 2006) and lower than the northward motion rate of the Indian plate (40 mm/yr) (Wang and Shen, 2020). This may imply that the strike-slip faults have limited contribution to the regional deformation in the study region, which further suggests that the surface deformation may be associated with the deep structures in the region.
Comparing surface deformation and deep rheological structures derived from electrical structures, it is observed that the weak, viscous zones in the mid-crust scattered inside the Qiangtang terrane correlate with the location of the normal faults on the surface (Figure 8). Previous petrographic analyses indicated that the melt responsible for the crustal weakening of the area may be linked to mantle upwelling (Guo et al., 2014; 2006; Wei et al., 2017). Therefore, the mid-lower crust of the western Qiangtang terrane may be divided into a series of small, dispersed ductile blocks separated by N–S directed viscous deformation areas. As the Indian Plate continues its northward subduction, the oblique compressional stress between the Tarim and Lhasa terranes would certainly lead to the eastward extrusion of the triangle-shaped west Qiangtang. Apart from the E–W expansion of the weak/viscous mid-lower crust material that contributes to the formation of the NW–SE-directed normal faults, the viscous region may also act as weak boundaries that allow the individual clockwise rotation of the ductile blocks in between. Indeed, these clockwise rotations may help facilitate the sinistral strike-slip faults in the north and south boundaries of the west Qiangtang terrane (Li et al., 2021). The combination of the extensional and rotational deformation may also explain the enigmatic combination of sinistral strike-slip and extensional earthquake focal mechanisms in the western Qiangtang terrane.
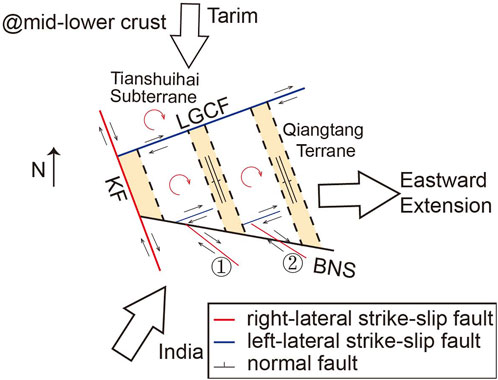
FIGURE 8. Schematic illustration of regional deformation at the mid-lower crust of the western Qiangtang terrane. The viscous deformation areas (orange) divide the mid-lower crust into scattered ductile blocks. During the Indian Plate’s northward subduction, the oblique compressional stress between the Tarim and Lhasa terranes may lead to the eastward extrusion, which contributes to the individual ductile blocks rotating clockwise. BNS: Bangong Co-Nujiang suture; KF: Karakorum fault; LGCF: Longmu Co-Gozha Co fault; ①: Bue Co conjugate faults; and ②: Aishui Co conjugate faults.
5 Conclusion
We used MT data to generate the first 3D electrical structure focusing on the western Qiangtang terrane and its surrounding areas, revealing scattered N-S-directed high-conductivity anomalies within the mid-lower crust of this area, which showed a scattered N–S-directed high-conductivity anomaly inside of the mid-lower crust of the western Qiangtang terrane. Based on this structure, we estimated melt fraction and rheological parameters using the previous experimental data. Our estimations indicate that ductile deformation dominates the western Qiangtang terrane and its surrounding areas, with N–S-directed viscous deformation zones dividing the ductile region into a few individual blocks. The viscous region may be formed by mantle upwelling in the mid-lower crust, which contributes to the regional development of surface normal faults. On the other hand, the extrusion and rotation of the ductile blocks under the N–S oblique stress may lead to the formation of a series of sinistral strike-slip faults on the north and south boundaries of the west Qiangtang terrane. Our results have clearly indicated that the analysis of the rheological structure through the deep geophysical structure can provide important insights into the mechanisms beneath the surface deformation. However, the coverage of MT data is limited due to the extreme topography and road conditions hindering a more detailed modeling of the region. High-resolution data acquisition and the introduction of quantitate geodynamic modeling are needed to provide further understanding of the complex deformation mechanisms in the western Qiangtang terrane.
Data availability statement
The datasets presented in this study can be found in online repositories. The names of the repository/repositories and accession number(s) can be found at: gu, jiangfan (2023), “Supplemental Data files for: The deformation mechanism in the western Qiangtang block and its surroundings: evidence form magnetotellurics data”, Mendeley Data, V1, doi: 10.17632/cv6zbs4zrg.1
Author contributions
JG: data curation, methodology, visualization, software, and writing—original draft. SJ and HD: writing - review and editing, project administration, and funding acquisition. HD, WW, GY, and LZ: writing—review and editing. All authors contributed to the article and approved the submitted version.
Funding
This study was funded by the Second Tibetan Plateau Scientific Expedition and Research Program (2019QZKK0701), project SINOPROBE, and National Nature Science Foundation of China (4212100033).
Acknowledgments
The authors thank Alan Jones and Gary McNeice for their tensor decomposition code. They used the GMT software package (Wessel and Smith, 1998) to produce figures.
Conflict of interest
The authors declare that the research was conducted in the absence of any commercial or financial relationships that could be construed as a potential conflict of interest.
Publisher’s note
All claims expressed in this article are solely those of the authors and do not necessarily represent those of their affiliated organizations, or those of the publisher, the editors, and the reviewers. Any product that may be evaluated in this article, or claim that may be made by its manufacturer, is not guaranteed or endorsed by the publisher.
Supplementary material
The Supplementary Material for this article can be found online at: https://www.frontiersin.org/articles/10.3389/feart.2023.1207150/full#supplementary-material
References
Bai, D., Unsworth, M. J., Meju, M. A., Ma, X., Teng, J., Kong, X., et al. (2010). Crustal deformation of the eastern Tibetan plateau revealed by magnetotelluric imaging. Nat. Geosci. 3, 358–362. doi:10.1038/ngeo830
Booker, J. R. (2014). The Magnetotelluric Phase Tensor: A Critical Review. Surv. Geophys. doi:10.1007/s10712-013-9234-2
Caldwell, T. G., Bibby, H. M., and Brown, C. (2004). The magnetotelluric phase tensor. Geophys. J. Int. 158, 457–469. doi:10.1111/j.1365-246X.2004.02281.x
Chevalier, M. L., Tapponnier, P., Van der Woerd, J., Ryerson, F. J., Finkel, R. C., and Li, H. (2012). Spatially constant slip rate along the southern segment of the Karakorum fault since 200ka. Tectonophysics 530–531, 152–179. doi:10.1016/j.tecto.2011.12.014
Chevalier, M. L., Woerd, J. V. D., Tapponnier, P., Li, H., Ryerson, F. J., and Finkel, R. C. (2016). Late quaternary slip-rate along the central bangong-chaxikang segment of the Karakorum fault, Western tibet. Bull. Geol. Soc. Am. 128, 284–314. doi:10.1130/B31269.1
Chevalier, M. L., Pan, J., Li, H., Sun, Z., Liu, D., Pei, J., et al. (2017). First tectonic-geomorphology study along the longmu–gozha Co fault system, western tibet. Gondwana Res. 41, 411–424. doi:10.1016/j.gr.2015.03.008
Costa, F. (2021). Clocks in magmatic rocks. Annu. Rev. Earth Planet. Sci. 49, 231–252. doi:10.1146/annurev-earth-080320-060708
Dong, H., and Egbert, G. D. (2019). Divergence-free solutions to electromagnetic forward and adjoint problems: A regularization approach. Geophys. J. Int. 216, 906–918. doi:10.1093/gji/ggy462
Dong, S. W., Li, T. D., Lü, Q. T., Gao, R., Yang, J. S., Chen, X. H., et al. (2013). Progress in deep lithospheric exploration of the continental China: A review of the sinoprobe. Tectonophysics 606, 1–13. doi:10.1016/j.tecto.2013.05.038
Dong, H., Wei, W., Jin, S., Ye, G., Jones, A. G., Zhang, L., et al. (2020). Shaping the surface deformation of central and south Tibetan plateau: Insights from magnetotelluric array data. J. Geophys. Res. Solid Earth 125, 1–20. doi:10.1007/s00262-019-02436-3
Dziewonski, A. M., and Anderson, D. L. (1981). Preliminary reference Earth model. Phys. Earth Planet. Inter. 25, 297–356. doi:10.1016/0031-9201(81)90046-7
Egbert, G. D., and Booker, J. R. (1986). Robust estimation of geomagnetic transfer functions. Geophys. J. Int. 87, 173–194. doi:10.1111/j.1365-246X.1986.tb04552.x
Egbert, G. D. (1997). Robust multiple-station magnetotelluric data processing. Geophys. J. Int. 130, 475–496. doi:10.1111/j.1365-246X.1997.tb05663.x
Ekström, G., Nettles, M., and Dziewoński, A. M. (2012). The global CMT project 2004-2010: Centroid-moment tensors for 13,017 earthquakes. Phys. Earth Planet. Inter. 200–201, 1–9. doi:10.1016/j.pepi.2012.04.002
Gilligan, A., Priestley, K. F., Roecker, S. W., Levin, V., and Rai, S. S. (2015). The crustal structure of the Western Himalayas and Tibet. J. Geophys. Res. Solid Earth 120, 3946–3964. doi:10.1002/2015JB011891
Glover, P. W. J., Hole, M. J., and Pous, J. (2000). A modified Archie’s law for two conducting phases. Earth Planet. Sci. Lett. 180, 369–383. doi:10.1016/S0012-821X(00)00168-0
Guo, Z., Wilson, M., Liu, J., and Mao, Q. (2006). Post-collisional, potassic and ultrapotassic magmatism of the Northern Tibetan Plateau: Constraints on characteristics of the mantle source, geodynamic setting and uplift mechanisms. J. Petrol. 47, 1177–1220. doi:10.1093/petrology/egl007
Guo, Z., Wilson, M., Zhang, L., Zhang, M., Cheng, Z., and Liu, J. (2014). The role of subduction channel mélanges and convergent subduction systems in the petrogenesis of post-collisional K-rich mafic magmatism in NW Tibet. Lithos 198–199, 184–201. doi:10.1016/j.lithos.2014.03.020
Guo, X., Li, B., Ni, H., and Mao, Z. (2017). Electrical conductivity of hydrous andesitic melts pertinent to subduction zones. J. Geophys. Res. Solid Earth 122, 1777–1788. doi:10.1002/2016JB013524
Hacker, B. R., Ritzwoller, M. H., and Xie, J. (2014). Partially melted, mica-bearing crust in central tibet. Tectonics 33, 1408–1424. doi:10.1002/2014TC003545
Hashim, L., Gaillard, F., Champallier, R., Le Breton, N., Arbaret, L., and Scaillet, B. (2013). Experimental assessment of the relationships between electrical resistivity, crustal melting and strain localization beneath the Himalayan-Tibetan Belt. Earth Planet. Sci. Lett. 373, 20–30. doi:10.1016/j.epsl.2013.04.026
Jin, S., Ye, G., Wei, W., Deng, M., and Jing, J. (2007). Electrical structure and fault features of crust and upper mantle beneath the western margin of the qinghai-tibet plateau: Evidence from the magnetotelluric survey along zhada-quanshui lake profile. J. China Univ. Geosci. 18, 326–333. doi:10.1016/S1002-0705(08)60013-8
Kelbert, A., Meqbel, N., Egbert, G. D., and Tandon, K. (2014). ModEM: A modular system for inversion of electromagnetic geophysical data. Comput. Geosci. 66, 40–53. doi:10.1016/j.cageo.2014.01.010
Kreemer, C., Blewitt, G., and Klein, E. C. (2014). A geodetic plate motion and global strain rate model. Geochem. Geophys. Geosystems 15, 3849–3889. doi:10.1002/2014GC005407
Li, L., Murphy, M. A., and Gao, R. (2020). Subduction of the Indian plate and the nature of the crust beneath western tibet: Insights from seismic imaging. J. Geophys. Res. Solid Earth 125. doi:10.1029/2020JB019684
Li, H., Chevalier, M. L., Tapponnier, P., Pan, J., Van der Woerd, J., Mériaux, A. S., et al. (2021). Block tectonics across western tibet and multi-millennial recurrence of great earthquakes on the karakax fault. J. Geophys. Res. Solid Earth 126. doi:10.1029/2021JB022033
Priestley, K., James, J., and Mckenzie, D. (2008). Lithospheric structure and deep earthquakes beneath India, the Himalaya and southern Tibet. Geophys. J. Int. 172, 345–362. doi:10.1111/j.1365-246X.2007.03636.x
Raterman, N. S., Cowgill, E., and Lin, D. (2007). Variable structural style along the Karakoram fault explained using triple-junction analysis of intersecting faults. Geosphere 3, 71–85. doi:10.1130/GES00067.1
Rippe, D., and Unsworth, M. (2010). Quantifying crustal flow in Tibet with magnetotelluric data. Phys. Earth Planet. Inter. 179, 107–121. doi:10.1016/j.pepi.2010.01.009
Rosenberg, C. L., and Handy, M. R. (2005). Experimental deformation of partially melted granite revisited: Implications for the continental crust. J. Metamorph. Geol. 23, 19–28. doi:10.1111/j.1525-1314.2005.00555.x
Schmeling, H., Kruse, J. P., and Richard, G. (2012). Effective shear and bulk viscosity of partially molten rock based on elastic moduli theory of a fluid filled poroelastic medium. Geophys. J. Int. 190, 1571–1578. doi:10.1111/j.1365-246X.2012.05596.x
Schmeling, H. (1985). Numerical models on the influence of partial melt on elastic, anelastic and electric properties of rocks. Part I: Elasticity and anelasticity. Phys. Earth Planet. Inter. 41, 34–57. doi:10.1016/0031-9201(85)90100-1
Schmeling, H. (1986). Numerical models on the influence of partial melt on elastic, anelastic and electrical properties of rocks. Part II: Electrical conductivity. Phys. Earth Planet. Inter. 43, 123–136. doi:10.1016/0031-9201(86)90080-4
Shen, X. (1991). “Crust and upper mantle thermal structure of xizang (tibet) inferred from the mechanism of high heat flow observed in south tibet,” in Terrestrial heat flow and the lithosphere structure, 293–307. doi:10.1007/978-3-642-75582-8_14
Shinevar, W. J., Behn, M. D., and Hirth, G. (2015). Compositional dependence of lower crustal viscosity. Geophys. Res. Lett. 42, 8333–8340. doi:10.1002/2015GL065459
Taylor, M., and Peltzer, G. (2006). Current slip rates on conjugate strike-slip faults in central Tibet using synthetic aperture radar interferometry. J. Geophys. Res. Solid Earth 111. doi:10.1029/2005JB004014
Taylor, M., Yin, A., Ryerson, F. J., Kapp, P., and Ding, L. (2003). Conjugate strike-slip faulting along the Bangong-Nujiang suture zone accommodates coeval east-west extension and north-south shortening in the interior of the Tibetan Plateau. Tectonics 22. doi:10.1029/2002tc001361
Unsworth, M. (2010). Magnetotelluric studies of active continent–continent collisions. Surv. Geophys. 31, 137–161. doi:10.1007/s10712-009-9086-y
Varentsov, I. M., Sokolova, E. Y., Martanus, E. R., and Nalivaiko, K. V. (2003). System of electromagnetic field transfer operators for the BEAR array of simultaneous soundings: Methods and results. Izv. Phys. Solid Earth 39, 118–148.
Wang, M., and Shen, Z. K. (2020). Present-day crustal deformation of continental China derived from GPS and its tectonic implications. J. Geophys. Res. Solid Earth 125. doi:10.1029/2019JB018774
Wang, X., Zhou, X. P., Zhang, X. Y., Bai, Z. M., and Teng, J. W. (2015). Tomographic imaging of velocity structure in upper crust based on correlated inversion of VP and VS. Acta geophys. Sin. 58, 3553–3570. doi:10.6038/cjg20151011
Wang, B. D., Wang, L. Q., Chung, S. L., Chen, J. L., Yin, F. G., Liu, H., et al. (2016). Evolution of the Bangong-Nujiang Tethyan ocean: Insights from the geochronology and geochemistry of mafic rocks within ophiolites. Lithos 245, 18–33. doi:10.1016/j.lithos.2015.07.016
Wang, H., Wright, T. J., Liu-Zeng, J., and Peng, L. (2019). Strain rate distribution in south-central tibet from two decades of InSAR and GPS. Geophys. Res. Lett. 46, 5170–5179. doi:10.1029/2019GL081916
Wei, F., Prytulak, J., Xu, J., Wei, W., Hammond, J. O. S., and Zhao, B. (2017). The cause and source of melting for the most recent volcanism in tibet: A combined geochemical and geophysical perspective. Lithos 288–289, 175–190. doi:10.1016/j.lithos.2017.07.003
Williams, H. M., Turner, S. P., Pearce, J. A., Kelley, S. P., and Harris, N. B. W. (2004). Nature of the source regions for post-collisional, potassic magmatism in southern and northern Tibet from geochemical variations and inverse trace element modelling. J. Petrol. 45, 555–607. doi:10.1093/petrology/egg094
Wright, T. J., Parsons, B., England, P. C., and Fielding, E. J. (2004). InSAR observations of low slip rates on the major faults of Western Tibet. Science 305, 236–239. doi:10.1126/science.1096388
Xiong, S. Q., Tong, J., Ding, Y. Y., and Li, Z. K. (2016). Aeromagnetic data and geological structure of continental China: A review. Appl. Geophys. 13, 227–237. doi:10.1007/s11770-016-0552-2
Yin, A., and Taylor, M. H. (2011). Mechanics of V-shaped conjugate strike-slip faults and the corresponding continuum mode of continental deformation. Bull. Geol. Soc. Am. 123, 1798–1821. doi:10.1130/B30159.1
Yin, Z., and Xu, C. (2017). Estimating gravity changes caused by crustal strain: Application to the Tibetan Plateau. Geophys. J. Int. 210, 1191–1205. doi:10.1093/gji/ggx231
Yu, H., Xu, J., Zhao, B., Shen, H., and Lin, C. (2014). Magmatic processes of ashi volcano, western kunlun mountains, China. Acta Geol. Sin. Engl. Ed. 88, 530–543. doi:10.1111/1755-6724.12212
Zeng, S., Hu, X., Li, J., Xu, S., Fang, H., and Cai, J. (2015). Detection of the deep crustal structure of the Qiangtang terrane using magnetotelluric imaging. Tectonophysics 661, 180–189. doi:10.1016/j.tecto.2015.08.038
Zhang, Z., Wang, Y., Houseman, G. A., Xu, T., Wu, Z., Yuan, X., et al. (2014). The Moho beneath Western Tibet: Shear zones and eclogitization in the lower crust. Earth Planet. Sci. Lett. 408, 370–377. doi:10.1016/j.epsl.2014.10.022
Zhao, B., Huang, Y., Zhang, C., Wang, W., Tan, K., and Du, R. (2015). Crustal deformation on the Chinese mainland during 1998–2014 based on GPS data. Geod. Geodyn. 6, 7–15. doi:10.1016/j.geog.2014.12.006
Keywords: magnetotelluric, Tibetan Plateau, resistivity structure, SinoProbe-deep exploration in China, Qiangtang terrane
Citation: Gu J, Jin S, Dong H, Wei W, Ye G and Zhang L (2023) The deformation mechanism in the western Qiangtang terrane and its surroundings: evidence from magnetotelluric data. Front. Earth Sci. 11:1207150. doi: 10.3389/feart.2023.1207150
Received: 17 April 2023; Accepted: 31 May 2023;
Published: 16 June 2023.
Edited by:
Zhanwu Lu, Chinese Academy of Geological Sciences, ChinaCopyright © 2023 Gu, Jin, Dong, Wei, Ye and Zhang. This is an open-access article distributed under the terms of the Creative Commons Attribution License (CC BY). The use, distribution or reproduction in other forums is permitted, provided the original author(s) and the copyright owner(s) are credited and that the original publication in this journal is cited, in accordance with accepted academic practice. No use, distribution or reproduction is permitted which does not comply with these terms.
*Correspondence: Sheng Jin, MTk5MzAxMDgzMEBjdWdiLmVkdS5jbg==; Hao Dong, ZG9uZ2hhb0BjdWdiLmVkdS5jbg==