 Shujian Li1
 Chongyang Wang
 Dongming Zhang
- 1Yunnan Phosphate Chemical Group Co., Ltd., Kunming, China
- 2College of Mathematics and Statistics, Chongqing University, Chongqing, China
- 3State Key Laboratory of Coal Mine Disaster Dynamics and Control, Chongqing University, Chongqing, China
- 4School of Resources and Safety Engineering, Chongqing University, Chongqing, China
Introduction: To explore the influence of seismic disturbance and saturation on the mechanical properties of phosphate rock, the paper divided phosphorus rock into natural group, water-saturated Group and “earthquake and water-saturated” group.
Methods: Fatigue loading and conventional triaxial compression tests were carried out to study the physical characteristics, degeneration characteristics, strength characteristics and failure characteristics of the samples.
Results: The conclusions are as follows: The average wave velocity of samples of water-saturated group and “earthquake and saturation” group is 29.7% and 52.9% lower than that in natural group, respectively, and the average peak strength under various confining pressure conditions is 32.2% and 48.3% lower than that in natural group, respectively, indicating that both seismic stress loading and saturation have deterioration effects on the samples.
Discussion: Compared with natural group and watersaturated group, after simulated seismic stress loading, the stress-strain curve of “earthquake and water-saturated” group shakes obviously after the peak, and the steps appear frequently, showing obvious plastic characteristics. Due to the different deterioration degree of the samples, the samples of the natural group were in the overall state of compression during the triaxial test, while the samples of the water-saturated group were compressed before failure and expanded after failure. The sample of earthquake and water-saturated group is in the whole state of expansion. The failure characteristics of natural samples and water-saturated samples are shear or shear failure. The shear plane starts from the edge of sample end face and presents typical diagonal shear failure. The failure characteristics of “earthquake and water-saturated” group samples are heavy shear and through failure. There are several fracture zones extending inward from the end of the sample, resulting in obvious transverse expansion.
1 Introduction
The Yunnan phosphate mine is situated in close proximity to the Xiaojiang fault zone, known for its frequent and persistent seismic activity, with nearly 70 recorded felt earthquakes and destructive seismic events dating back to 1500. These earthquakes have resulted in varying degrees of structural damage and casualties. Additionally, the Yunnan phosphate mine is characterized by abundant underground water, often resulting in water inflow during tunneling, leading to saturation and waterlogging of the rock mass. This saturation further deteriorates the mechanical properties of the rock mass and poses challenges for tunneling and support. Therefore, investigating the patterns of seismic stress disturbance and mechanical characteristics of phosphorite rock under saturated conditions is of significant importance.
The influence of water saturation on the mechanical properties of rocks has been widely studied in seismology and geology. Rocks saturated with water have higher porosity and permeability due to the presence of a large amount of water. Water content significantly affects the strength, deformation, and fracturing properties of rocks (Zhu et al, 2022). Many scholars at home and abroad have conducted extensive research on this topic. Zheng et al (2017) conducted dynamic and static compression tests on red sandstone under four different water saturation levels, based on a φ100 mm Split Hopkinson Pressure Bar test platform and a hydraulic servo testing machine. The study investigated the influence of water saturation on rock strength, peak strain, peak modulus, and strain rate effect. The results show that there is a critical value of the influence of saturation degree on rock strength. When saturation degree is less than the critical value, the strength decreases linearly with the increase of saturation degree. Liu et al (2022) studied the influence of water saturation on the mechanical properties of rocks in the red bed area. They conducted water absorption rate determination, Brazilian split, uniaxial and triaxial compression tests on sandstone, mudstone, and shale, and found that the Poisson’s ratio of the three types of rocks increased to a certain extent after saturation, and the radial deformation was more sensitive than the axial deformation, with more significant volumetric expansion. After saturation, the tensile strength, uniaxial and triaxial compressive strength of rocks showed varying degrees of attenuation. Luo et al (2022) studied the influence of saturation time on the mechanical behavior and acoustic emission characteristics of clay mineral-containing rocks, and conducted uniaxial compression and acoustic emission tests on montmorillonite-containing sandstone under dry, saturated, and different immersion time conditions. Wang et al (2001) studied the influence of water saturation on rock mechanical parameters by using artificial rock samples, and conducted experimental research on the changes in elastic modulus, Poisson’s ratio, compressive strength, and other parameters of formations with varying water saturation. The study showed that with the increase of water saturation, the elastic modulus decreases, and the variation of Poisson’s ratio is not very obvious, while the tensile strength decreases. Li H. et al. (2023) conducted research on the influence of water on the mechanical properties of rock materials by pre-treating sandstone with different numbers of wet-dry cycles (0–15 cycles). The pore characteristics of the sandstone were characterized using Low-Field Nuclear Magnetic Resonance and Scanning Electron Microscopy methods. Li et al (2012) studied the effects of moisture content and anisotropy on the strength and deformability of two types of metamorphic sedimentary rocks using triaxial compression tests. The experimental research showed that the anisotropy related to bedding planes weakened the triaxial compressive strength of both types of rocks, with a more severe effect observed in fine-grained sandstone. Caselle et al (2022) conducted experiments on nominally dry, oil-saturated, and water-saturated samples to quantify the weakening effect of water on the gypsum phase in Monferrato (Italy). Uniaxial and conventional triaxial tests showed that gypsum exhibited significant weakening due to water, but the weakening effect was not significantly higher compared to other rocks when water-saturated.
The influence of seismic stress on rock mechanical properties is also a research hotspot. Under seismic action, the stress experienced by rocks changes dramatically from static stress to dynamic stress, which significantly affects the strength, fracture, and deformation characteristics of rocks (Du et al., 2021; Du et al., 2020; Liu Y. et al., 2022; Liu et al., 2023a; Liu et al., 2023b). The deformation and fracturing behavior of rocks under seismic stress exhibit nonlinear and dynamic properties, thus affecting the propagation velocity, amplitude, and frequency of seismic waves (Wang et al., 2022a). Zhao et al. (2021) conducted experimental studies on the damage and fracture process of sandstone under different upper and lower limit stress ratios. The results showed that under fatigue loading, the hysteresis loop in the damage-failure curve of rocks evolves in a ‘loose-dense-loose’ pattern, and the crack development curve shows an upward convex shape with deceleration at the initial stage of loading, followed by stable development, and finally a downward convex shape with accelerated rise until failure, exhibiting an overall stepped growth pattern. Xi et al (2001) conducted fatigue loading experiments on sandstone using MTS to study the influence of fatigue load on rock physical and mechanical properties. It was found that Saturated granite exhibited significant stress amplitude effect and frequency effect, as well as anisotropy, with stress amplitude having a greater influence on granite properties than frequency. Sui et al (2020) used the discrete element method to establish a true triaxial numerical model of rock cores to study the issue of fatigue damage to rocks in gas storage reservoirs during the cyclic injection and production process. The numerical model parameters were calibrated based on indoor experiments, and the effects of cyclic stress on the microscopic structure and mechanical properties of rocks were investigated. Li Z. et al. (2023b) conducted uniaxial and triaxial gradient creep fatigue tests on rock salt under representative conditions, combined with actual gas pressure during compressed air energy storage (CAES) facility operation, and analyzed the mechanical properties and acoustic emission characteristics of rock salt. Liu Z. et al. (2022b) performed multi-axial multi-stage cyclic loading and unloading tests to investigate the influence of unloading rate on deformation behavior, energy evolution, and damage characteristics of rock-like materials. Wang et al (2022b) conducted multi-stage intermittent cyclic loading tests on red sandstone with pre-existing cracks at different angles and found that during the initial stage of loading, deformation parameters increased first and then stabilized, while plastic strain accumulated rapidly and elastic modulus and deformation modulus decreased as the rock samples approached failure. The fatigue damage exhibited a characteristic of initial deceleration, followed by stable accumulation, and finally accelerated development.
Although the influence of saturation and seismic stress on the mechanical properties of rocks has been widely studied, there are still many unresolved issues. Firstly, there may be differences in the mechanical response of rocks under seismic stress in different rock types and saturation states, which require further in-depth research on the changes in rock mechanical properties under different conditions. Secondly, the coupling effects of saturation and seismic stress on rock mechanical properties are not yet clear and need to be further explored through comprehensive experiments and numerical simulations. In addition, in practical engineering applications, how to reasonably consider the influence of saturation and seismic stress on rock mechanical properties and apply them to rock engineering design and construction needs further research and exploration. Therefore, taking the phosphate rock strata in Yunnan Province as an example, this study processed the samples into three groups: Natural group, Water-saturated group, and “earthquake and water-saturated” group, and conducted in-depth research on the mechanical properties of the samples through triaxial compression tests, fatigue loading tests, ultrasonic wave tests, and other methods. Based on this, the variation patterns of rock mass mechanical characteristics under seismic stress disturbance and saturation conditions were explored, aiming to provide theoretical references for the stability research of water-rich tunnels under stress disturbance.
2 Sample and methods
2.1 Specimen preparation
Yunnan Phosphate Mines, located in Yunnan Province, China, is a rich phosphate resource production area (Figure 1), mainly including phosphorite, phosphorite rock, and phosphorus iron ore. Its phosphate ore reserves rank first in China, with approximately 9 billion tons, accounting for over 70% of China’s total phosphate ore reserves. The development and utilization of phosphate resources are mainly focused on the agricultural production sector, playing an important supporting role in Chinese and global agricultural production. At the same time, Yunnan Phosphate Mines have also achieved a series of achievements in technological innovation and environmental protection, realizing the transformation and upgrading from traditional mines to modern mines. In the future, Yunnan Phosphate Mines have broad prospects for development. With increasing population and growing demand for global agricultural production, phosphate fertilizer, as an essential nutrient for farmland, will continue to have high demand. (Xiao et al, 2022; Zhang et al, 2022).
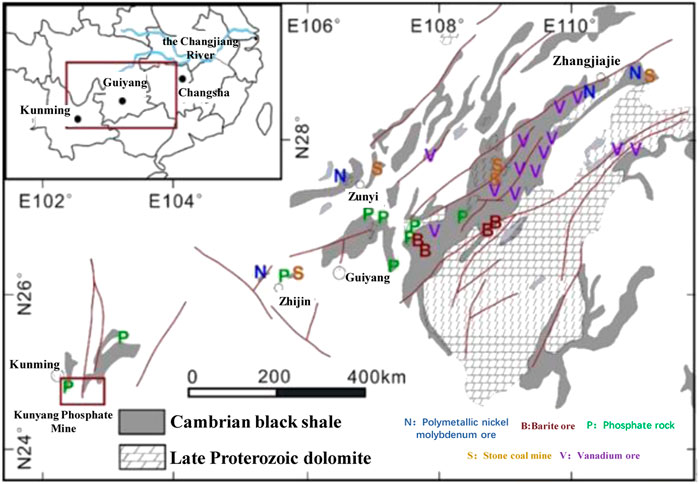
FIGURE 1. Scope of Yunnan phosphorus miner area.
The rock sample in this paper is taken from the phosphorus block rock in the upper layer of phosphate mine roadway in Yunnan. The selected rock sample was cut and polished to make a standard cylindrical sample with diameter of 50 mm and height of 100 mm. Meanwhile, in order to avoid the influence of the end friction effect on the test, the flatness of the end face was controlled within 0.02 mm, the surface of the specimen was smooth without obvious joints and cracks, and the cylindrical specimen was manufactured in strict accordance with the standards of the International Society of Rock Mechanics, as shown in Figure 2.
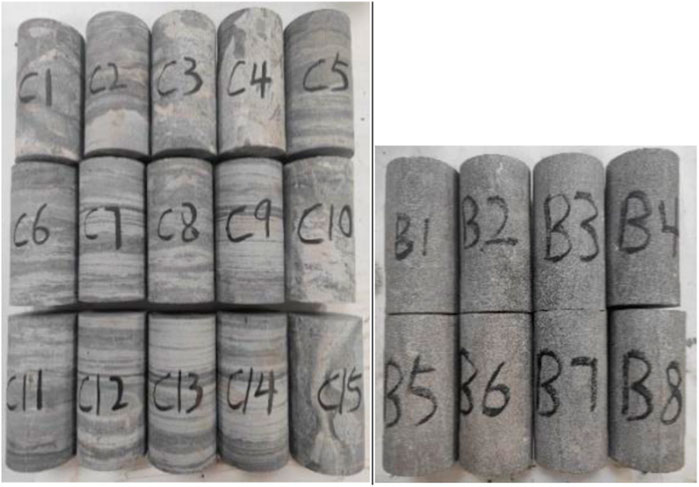
FIGURE 2. Sample.
2.2 Testing device
1) Ultrasound Testing Device.The longitudinal wave velocity was carried out by the UTA-2000A intelligent ultra-sonic monitor (as shown in Figure 3A). The sampling frequency is 10 MHz; sensor frequency is 35 kHz, ac-curacy is 0.1 µs, and Vaseline cream as coupling agent is used between the sample and sensors.Measure the travel time t of the sound wave, and calculate the wave velocity v, of the rock ultrasonic wave according to the following formula:
where,
2) Fatigue loading test and triaxial compression test were carried out on a QKX-YD-1000 electro-hydraulic servo rock dynamic fatigue test machine, which was produced by Qingdao Qiankunxing Intelligent Technology Co., Ltd., Qingdao, Shandong Province. As shown in Figures 3B, C. The maximum axial load of the system is 800 kN, the maximum loading speed is 800 mm/min, the fatigue frequency range is 0.5–50 Hz, and the maximum displacement is 50 mm (Wang, 2021).
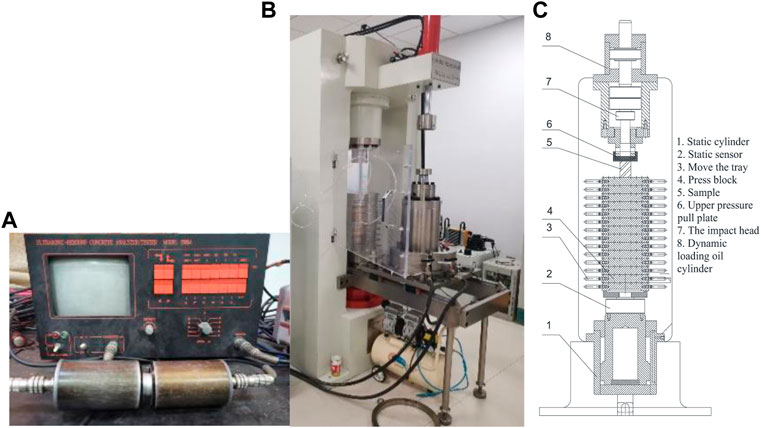
FIGURE 3. Testing device. (A) UTA 2001A ultrasonic inspection monitor. (B) QKX-YD-1000 electro-hydraulic servo rock dynamic fatigue test machine. (C) Test schematic diagram.
2.3 Test methods
1) Grouping: The specimens are divided into three groups, labeled as Group A, Group B, and Group C, with 8 specimens in each group. Group A specimens undergo no treatment and are labeled as the natural group. Group B specimens are subjected to forced saturation in a vacuum saturation apparatus, and then sealed with plastic wrap, labeled as the saturated group. Group C specimens are first subjected to seismic wave simulation disturbance, and then subjected to forced saturation in a vacuum saturation apparatus, labeled as the post-seismic saturated group.
2) Measurement of physical properties: Calipers and an electronic balance are used to measure the dimensions and mass of the specimens, and calculate the density. The UTA-2000A Intelligent Ultrasonic Monitoring Instrument (Figure 3A) is used to conduct ultrasonic testing on the specimens. Based on the density and ultrasonic testing results, homogeneous specimens (density and wave velocity are both similar) are selected for further testing.
3) Fatigue loading test: Disturbance of seismic stress is applied to Group C specimens to simulate seismic loading. As seismic stress typically has a large initial amplitude and low frequency, followed by small amplitude and high frequency, a disturbance scheme with a reference of 0.5σc is developed as shown in Figure 4 (Fu, 2020; Pan et al, 2022). It is found through experiments that the uniaxial strength of the specimens used in this study is 92.4 MPa. As shown in Figure 4, the axial stress of the specimens is first loaded to 86 MPa, and then subjected to fatigue loading. The fatigue loading parameters are:
where, A represents the loading amplitude, and f represents the loading frequency.
4) Conventional triaxial tests: Conduct conventional triaxial tests on the A, B, and C groups of specimens to measure mechanical parameters such as peak strength (σ1), peak strain (εc), elastic modulus (E), cohesion (c), and angle of internal friction (f). In this experiment, the confining pressure for the three groups of specimens is set at 4, 6, 8, 10, and 12 MPa.
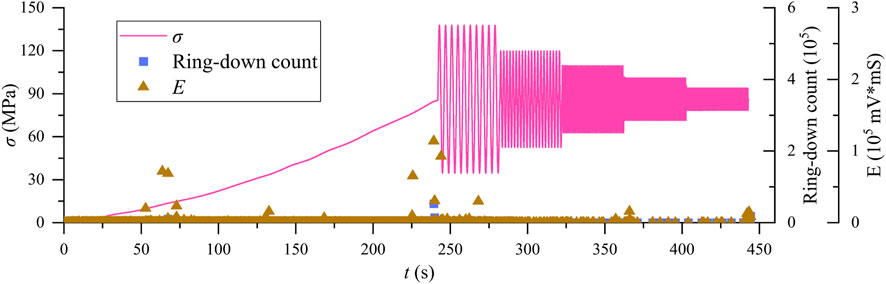
FIGURE 4. Fatigue loading stress path.
3 Test results and analysis
3.1 Sample characteristics
When the rock is saturation or loaded, cracks will occur. When the ultrasonic wave encounters cracks and defects in the propagation process, refraction, diffraction and other phenomena will occur. A decrease in waveguide performance and an increase in energy attenuation will lead to a decrease in P-wave velocity. Therefore, the mechanical deterioration characteristics of samples after saturation or loading can be indirectly reflected by ultrasonic testing of samples (Wei, 2020). Figure 5 shows the density and ultrasonic test results of the three groups of samples.
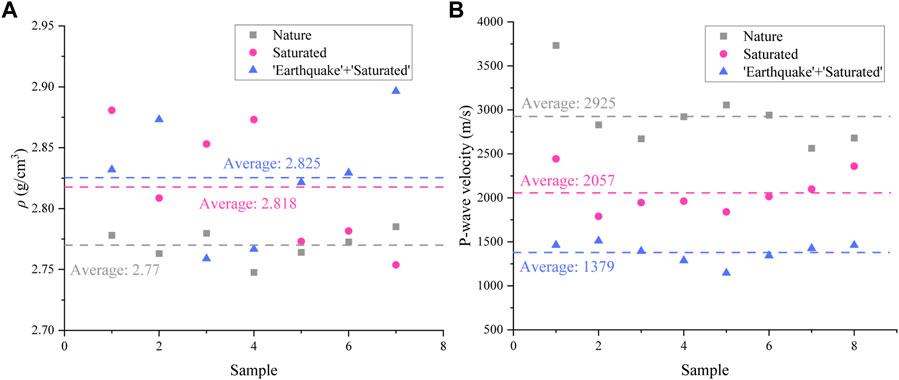
FIGURE 5. Physical properties. (A) ρ. (B) P-wave velocity.
As can be seen from Figure 5, the average apparent density of 8 natural samples (Group A) is 2.77 g/cm3, and the average longitudinal wave velocity is 3093 m/s. After 48 h of saturation, the average density of 8 samples in Group B was 2.818 g/cm3, and the average P-wave velocity was 2056 m/s, which increased by 1.72% and −29.7% compared with Group A, respectively. After simulated seismic stress loading and water saturation twice, the average density and p-wave velocity of 8 samples in Group C are 2.825 g/cm3 and 1379 m/s, respectively, which are reduced by 2.00% and −52.9% compared with Group A.
It can be seen from the above analysis that the average density of Group C samples under simulated seismic stress loading and saturated water treatment is the highest, and the average P-wave velocity is the lowest. This is because, compared with the natural group, due to the vacuum forced water saturation, water molecules enter the samples and fill the primary cracks and bedding, thus reducing the propagation velocity of longitudinal waves in the samples. The samples of Group C underwent simulated seismic stress loading first, and many new cracks were generated inside the samples. After being saturated with water, more water molecules entered into the samples, resulting in a further increase in the sample density compared with Group B, and a further decrease in the propagation velocity of P-wave. When ultrasonic wave meets water, cracks and defects in the propagation process, it has to undergo refraction and diffraction, and the weakening of waveguide property and the increase of energy attenuation will lead to the decrease of P-wave velocity. Therefore, density and ultrasonic testing of samples can not only eliminate abnormal samples and reduce the influence of rock anisotropy on mechanical test results, but also indirectly reverse simulate the seismic stress and mechanical deterioration characteristics of samples after saturation.
3.2 Deformation characteristics
Figure 6 shows the stress-strain curves of the samples in the conventional triaxial compression test. As can be seen from Figure 6, the variation law of stress-strain curve under conventional triaxial compression of samples of each group roughly went through four stages: compaction, elasticity, yield and failure. 1) Compaction stage. The original pores and cracks in the sample are slowly compressed, and the stress-strain curve is concave. 2) Elastic stage. The stress-strain curve is basically linear and follows Hooke’s law. 3) yield stage. As the axial stress continues to load, the material with low strength inside the sample first enters the yield failure stage, and the increase rate of axial stress decreases gradually. 4) failure stage. When the ultimate strength of the specimen is reached, macroscopic slip occurs along a fracture surface inside the specimen, and the bearing capacity of the specimen decreases rapidly with the increase of deformation.
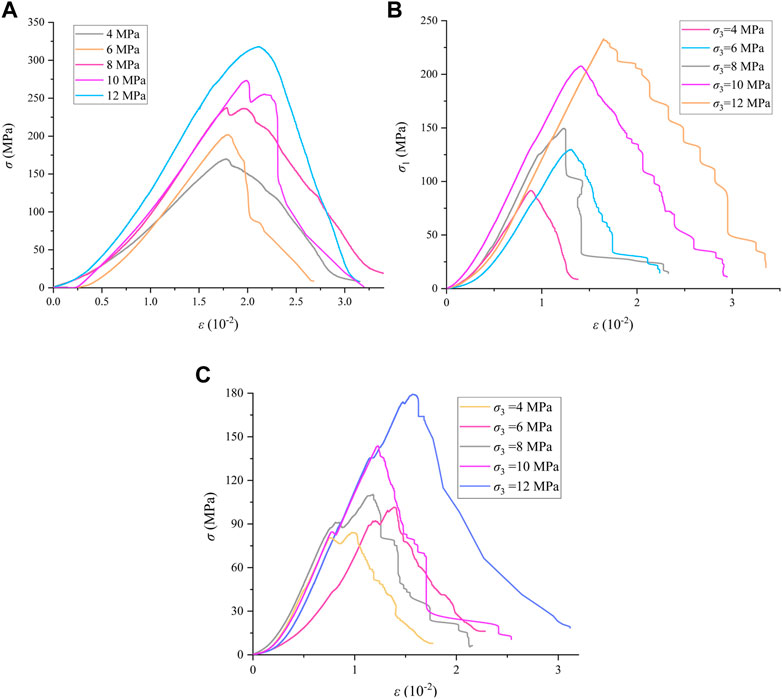
FIGURE 6. Stress-strain curve of triaxial compression. (A) Nature group. (B) Water-Saturated group. (C) “Earthquake and water-saturated” group.
Among them, the stress-strain curves of Groups A and B showed good linear characteristics before the peak, with obvious peak points, but less jitter after the peak, showing no obvious plastic characteristics. After simulated seismic stress loading, the samples of Group C show obvious plastic characteristics, and the stress-strain curve jitter obviously after the peak, showing multiple steps, which is the result of crack dislocation and closure.
To further analyze the deformation characteristics of samples in each group, the circumferential strain and volume strain-stress curves of typical samples (σ3=4 MPa) in each group were plotted, as shown in Figure 7. As can be seen from Figure 7, during the loading process, the variation trend of the volume strain of the three groups of samples is quite different, and this difference is mainly determined by the circumferential deformation. At the initial stage of loading, the circumferential strain of Group A was almost zero, and the circumferential deformation did not begin to increase until the end of the elastic stage. After the specimen was broken, the increase rate of circumferential deformation began to increase, but it was still not much faster than the axial deformation at the same period. As a result, although the specimen showed signs of slight expansion within a period of time after the specimen was broken, it still showed a state of continuous compression on the whole.
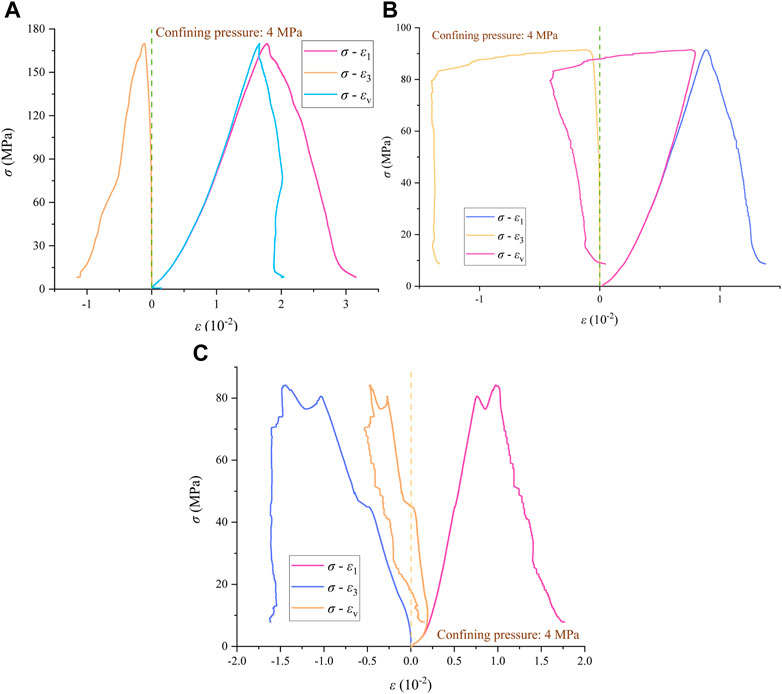
FIGURE 7. Axial stress-volume strain curves of typical samples. (A) Nature group. (B) Water-Saturated group. (C) “Earthquake and water-saturated” group.
Sample B is similar to sample A in the initial loading stage, with small circumferential deformation. However, after the fracture of the sample, the annular deformation of Group B samples showed an explosive increase, and the volume of the sample rapidly changed from compression to expansion. After specimen fracture, the axial strain continues to increase, but with the rapid drop of axial stress, under the action of confining pressure, the increase trend of the circumferential strain of the specimen is restrained. The volume variation of the sample tends to be stable.
The deformation of the samples in Group C is significantly different from that in Groups A and B. The mechanical properties of the samples in Group C have deteriorated due to the influence of fatigue stress before loading, resulting in relatively large transverse deformation of the samples in the initial loading stage, and the growth rate of the transverse deformation gradually increases with the extension of time. After the compaction stage, the growth rate of the circumferential strain exceeds the axial deformation. In the elastic stage, the sample has entered the whole expansion stage until the sample cracks.
The above analysis shows that water saturation and fatigue stress loading have great influence on the deformation characteristics of the sample. The samples of the natural group were in the overall state of compression during the experiment, the samples of the water-saturated group were first compressed and then expanded, and the samples of the seismic stress disturbance and then saturated were in the overall state of expansion.
3.3 Strength characteristics
Observe the peak stress of samples in each group in Figure 6. For Group A, the peak strength of sample is 169.9 MPa when the confining pressure is 4 MPa. When the confining pressure is 6, 8, 10, and 12 MPa, the peak strength of each sample increases by 18.7%, 38.1%, 60.9%, and 87.1%, respectively. For the samples of Group B, the peak strength of the samples under the confining pressure of 4 is 91.5 MPa. Compared with that under the confining pressure of 4 MPa, the peak strength of the samples under the confining pressure of 6, 8, 10, and 12 MPa increases by 41.93%, 63.30%, 127.0%, and 154.7%, respectively. For the samples of Group C, the peak strength of the samples at the confining pressure of 4 is 84.17 MPa. Compared with that at the confining pressure of 4 MPa, the peak strength of the samples at the confining pressure of 6, 8, 10 MPa, and 12 MPa increases by 20.7%, 31.1%, 70.7%, and 113.0%, respectively. It can be seen that the peak strength of samples increases gradually with the increase of confining pressure, but the influence of confining pressure on the peak strength of samples varies greatly among all groups.
Meanwhile, the transverse comparison of samples of each group shows that the peak strength of samples of Group A is the largest, and the average peak strength of samples of Groups B and C under various confining pressure conditions is 32.2% and 48.3% lower than that of Group A, respectively, indicating that saturation water and simulated seismic stress loading have obvious deterioration effects on samples. The strength of the sample after seismic stress disturbance is lower, because the long-term fatigue loading promotes the expansion of the primary cracks and the initiation of new cracks in the sample, and the vacuum saturation after fatigue loading promotes the water molecules to enter these new cracks, causing secondary damage to the sample, leading to substantial deterioration of the mechanical properties of the sample.
The peak strength of samples under various confining pressures was plotted, as shown in the figure, from which it can be found that the approximate linear relationship between the two was in line with Coulomb strength criterion. According to Coulomb strength criterion, the maximum shear stress the sample can bear is determined by cohesion and internal friction Angle, which can be expressed as:
where, c is cohesion;
where, σ1 is the peak strength; k and Q are material strength parameters, and the relationship between their value and the strength parameter (c, f) of the material is:
According to Eq. 4, the relationship between peak strength and confining pressure of samples was obtained by regression, as shown in Table 1; Figure 8.
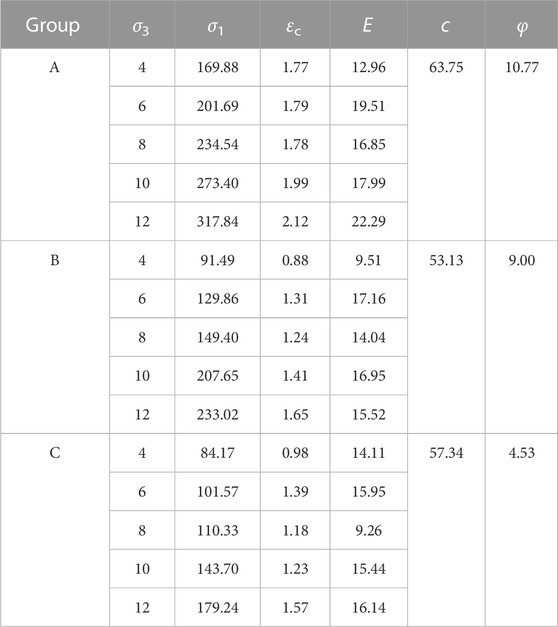
TABLE 1. Results of triaxial compression test.
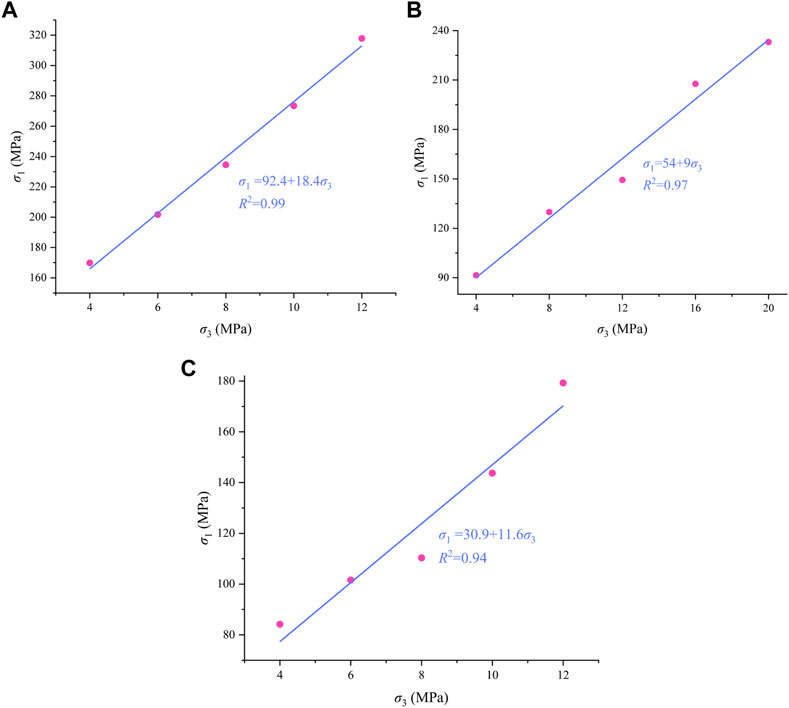
FIGURE 8. Relationship curve between peak strength and confining pressure of each group of samples under triaxial compression. (A) Nature group. (B) Water-Saturated group. (C) “Earthquake and water-saturated” group.
It can be seen that the influence coefficients of confining pressure of the samples are roughly 9–18.4, and the correlation coefficients are all greater than 0.94, indicating that the peak strength of triaxial compression of the samples of each group has a good correlation with the confining pressure, in line with the Coulomb strength criterion. According to Formula 5, 6, the cohesion and internal friction Angle of each group of samples are obtained, as shown in Table 1.
3.4 Failure characteristics
In order to explore the deterioration of samples caused by saturation water and seismic stress disturbance, CT scanning was performed on typical samples from Groups B and C. Figure 9 shows the failure morphology of samples under triaxial compression (Bohloli et al, 2007; Wood, 2015; Wang et al, 2023). Since the failure patterns of Groups A and B are similar, only the fracture scanning maps of Group B samples are listed to save space.
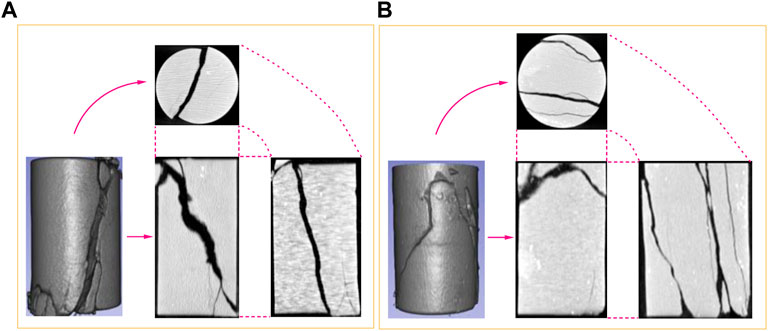
FIGURE 9. CT scanning and remapping of sample. (A) Group B. (B) Group C.
As can be seen from Figure 9, the failure characteristics of water-saturated samples are similar to those of traditional natural samples, showing shear failure. The shear plane starts from the edge of the sample end face and presents typical diagonal shear failure, and some powdery failure occurs at the junction of the failure plane and the bottom end face.
The failure characteristics of the samples disturbed by seismic stress are obviously different from those of the traditional samples. There are multiple fracture zones extending inward from the end of the sample, and multiple fracture zones extending inward from the side surface of the sample. From the side view, it can be seen that the sample has obvious transverse expansion, which is consistent with the analysis results of the bulk strain. This is because after the sample of this group experienced seismic stress disturbance, the primary cracks continued to develop and expand, and even produced new cracks. These cracks were saturated by vacuum water, resulting in secondary failure. The internal damage of the sample was significantly increased compared with that of the sample of this group. When triaxial compression test is carried out, it can still produce certain resistance to deformation under confining pressure. When the specimen is broken and the confining pressure is gradually discharged, the specimen will produce heavy shear and penetrating failure due to the fracture penetration, and then appear large transverse deformation.
4 Conclusion
In this paper, fatigue loading and conventional triaxial compression tests of natural samples, saturated samples and post-earthquake saturated samples was carried out, and the physical characteristics, degeneration characteristics, strength characteristics and failure characteristics were studied. The conclusions were as follows:
1) The average wave velocity of samples in water-saturated Group and ‘earthquake and water-saturated’ group is 29.7% and 52.9% lower than that in natural group, respectively, and the average peak strength under various confining pressure conditions is 32.2% and 48.3% lower than that in natural group, respectively, indicating that both seismic stress loading and saturation have deterioration effects on samples.
2) Continuous fatigue loading will lead to the expansion of original cracks and the initiation of new cracks in the sample, and a long time of vacuum water saturation will promote water molecules to enter these cracks. As a result, after the simulated seismic stress loading, the stress-strain curve of the “earthquake and water-saturated” group shakes obviously after the peak, and the steps appear frequently, showing obvious plastic characteristics.
3) Due to the different deterioration degrees of the samples, the samples of the natural group were in the overall state of compression during the triaxial test, while the samples of the water-saturated group were compressed before failure and expanded after failure. The sample of “earthquake and water-saturated” group is in the whole state of expansion.
4) The failure characteristics of natural samples and water-saturated samples are shear failure, and the shear plane starts from the edge of sample end face and presents a typical diagonal shear failure. The failure characteristics of “earthquake and water-saturated” samples are heavy shear and through failure. There are several fracture zones extending inward from the end of the sample, resulting in obvious transverse expansion.
Data availability statement
The original contributions presented in the study are included in the article/supplementary material, further inquiries can be directed to the corresponding author.
Author contributions
CW supervised the research and proposed the research direction. SL was responsible for report analysis and paper writing. HW, BZ, and DZ were responsible for data processing. All authors contributed to the article and approved the submitted version.
Funding
Study on Fracture mechanism of surrounding rock in the second mine of Kunyang Phosphate Mine under seismic load. Number: NECP 2022-05.
Conflict of interest
Author SL and BZ were employed by the company Yunnan Phosphate Chemical Group Co., Ltd.
The authors declare that this study received funding from Yunnan Phosphate Chemical Group Co., Ltd. The funder had the following involvement in the study: data analysis and the writing of the paper.
The remaining authors declare that the research was conducted in the absence of any commercial or financial relationships that could be construed as a potential conflict of interest.
Publisher’s note
All claims expressed in this article are solely those of the authors and do not necessarily represent those of their affiliated organizations, or those of the publisher, the editors and the reviewers. Any product that may be evaluated in this article, or claim that may be made by its manufacturer, is not guaranteed or endorsed by the publisher.
References
Bohloli, B., and Hoven, E. (2007). A laboratory and full-scale study on the fragmentation behavior of rocks. Eng. Geol. 89 (1-2), 1–8. doi:10.1016/j.enggeo.2006.05.010
Caselle, C., Baud, P., Kushnir, A., Reuschlé, T., and Bonetto, S. (2022). Influence of water on deformation and failure of gypsum rock. J. Struct. Geol. 163, 104722. doi:10.1016/j.jsg.2022.104722
Du, K., Li, X., Yang, C., Zhou, J., Chen, S., and Manoj, K. (2020). Experimental investigations on mechanical performance of rocks under fatigue loads and biaxial confinements. J. Central South Univ. 27 (10), 2985–2998. doi:10.1007/s11771-020-4523-7
Du, K., Sun, Y., Zhou, J., Wang, S., Tao, M., Yang, C., et al. (2021). Low amplitude fatigue performance of sandstone, marble, and granite under high static stress. Geomechanics Geophys. Geo-Energy Geo-Resources 7 (3), 68. doi:10.1007/s40948-021-00266-1
Fu, Q. (2020). “Seismic performance analysis of SRC frame structure under bidirectional earthquake,”. MSc Thesis (Tianjin, China: Hebei University of Technology). doi:10.27104/d.cnki.ghbjy.2020.000068
Li, D., Wong, L., Liu, G., and Zhang, X. (2012). Influence of water content and anisotropy on the strength and deformability of low porosity meta-sedimentary rocks under triaxial compression. Eng. Geol. 126, 46–66. doi:10.1016/j.enggeo.2011.12.009
Li, H., Qiao, Y., He, M., Shen, R., Gu, Z., Tai, C., et al. (2023a). Effect of water saturation on dynamic behavior of sandstone after wetting-drying cycles. Eng. Geol. 319, 107105. doi:10.1016/j.enggeo.2023.107105
Li, Z., Suo, J., Fan, J., Marion, F., Jiang, D., and Daniel, N. (2023b). Damage evolution of rock salt under multilevel amplitude creep–fatigue loading with acoustic emission monitoring. Int. J. Rock Mech. Min. Sci. 164, 105346. doi:10.1016/j.ijrmms.2023.105346
Liu, D., Hu, P., and Zhao, L. (2022). Experimental study on the influence of saturation on mechanical properties of rocks in red bed areas. Water Transp. Eng. 4, 166–171. 179. doi:10.3969/j.issn.1002-4972.2022.04.030
Liu, Y., Lebedev, M., Zhang, Y., Wang, E., Li, W., Liang, J., et al. (2022a). Micro-cleat and permeability evolution of anisotropic coal during directional CO2 flooding: An in situ micro-CT study. Nat. Resour. Res. 31, 2805–2818. doi:10.1007/s11053-022-10102-2
Liu, Y., Wang, E., Jiang, C., Zhang, D., Li, M., Yu, B., et al. (2023a). True triaxial experimental study of anisotropic mechanical behavior and permeability evolution of initially fractured coal. Nat. Resour. Res. 32, 567–585. doi:10.1007/s11053-022-10150-8
Liu, Y., Wang, E., Li, M., Song, Z., Zhang, L., and Zhao, D. (2023b). Mechanical response and gas flow characteristics of pre-drilled coal subjected to true triaxial stresses. Gas Sci. Eng. 111, 204927. doi:10.1016/j.jgsce.2023.204927
Liu, Z., Cao, P., Zhao, Q., Cao, R., and Wang, F. (2022b). Deformation and damage properties of rock-like materials subjected to multi-level loading-unloading cycles. J. Rock Mech. Geotechnical Eng. doi:10.1016/j.jrmge.2022.11.009
Luo, K., Bai, Y., Zhao, S., Xia, D., Wu, C., and Jia, Y. (2022). Experimental study on the influence of saturation time on acoustic emission characteristics of clay-bearing rock minerals. Min. Eng. Res. 37 (2), 26–36. doi:10.13582/j.cnki.1674-5876.2022.02.004
Pan, Y., Wang, C., and Wang, Y. (2022). Mechanical degradation mechanism of rock under seismic disturbance stress. Q. J. Eng. Geol. Hydrogeology 55 (4). doi:10.1144/qjegh2022-007
Sui, Y., Lin, T., Liu, X., Dong, C., Cheng, W., Zhang, G., et al. (2020). Numerical simulation of the influence of cyclic stress on microstructure and mechanical properties of rocks in gas storage reservoirs. J. China Univ. Petroleum Ed. Nat. Sci. 44 (2), 78–84. (In Chinese). doi:10.3969/j.issn.1673-5005.2020.02.010
Wang, C. (2021). “Study on low-frequency dynamic physico-mechanical properties of gypsum rocks,”. MSc Thesis (Jiaozuo, China: Henan Polytechnic University). doi:10.27116/d.cnki.gjzgc.2021.000243
Wang, C., Zhang, D., Yu, B., and Li, S. (2023). Deformation and seepage characteristics of coal under true triaxial loading-unloading. Rock Mech. Rock Eng. 56, 2673–2695. doi:10.1007/s00603-022-03207-w
Wang, G., Zhang, J., Cheng, Y., and Zhu, C. (2001). Experimental study on the influence of water saturation on rock mechanical parameters. Pet. Drill. Tech. 29 (4), 59–61. doi:10.3969/j.issn.1001-0890.2001.04.023
Wang, J., Li, J., Shi, Z., and Chen, J. (2022a). Fatigue damage and fracture evolution characteristics of sandstone under multistage intermittent cyclic loading. Theor. Appl. Fract. Mech. 119, 103375. doi:10.1016/j.tafmec.2022.103375
Wang, J., Zhang, Q., Song, Z., Liu, X., Wang, X., and Zhang, Y. (2022b). Microstructural variations and damage evolvement of salt rock under cyclic loading. Int. J. Rock Mech. Min. Sci. 152, 105078. doi:10.1016/j.ijrmms.2022.105078
Wei, S., Wang, C., Yang, Y., and Wang, M. (2020). Physical and mechanical properties of gypsum-like rock Materials. Adv. Civ. Eng. 2020, 1–17. doi:10.1155/2020/3703706
Wood, J. (2015). Crushed-rock vs. Full-diameter core samples for water-saturation determination in a tight-gas siltstone play. SPE Reserv. Eval. Eng. 18 (3), 407–416. doi:10.2118/174548-PA
Xi, D., Liu, Y., Liu, X., Shan, Y., and Liu, W. (2001). Influence of fatigue loading on physical and mechanical properties of rocks. Chin. J. Geotechnical Eng. 23 (3), 292–295. (In Chinese). doi:10.3321/j.issn:1000-4548.2001.03.007
Xiao, H., and Tang, X. (2022). Flotation experimental study on phosphate ore in Dianchi Lake area, Yunnan. Chem. Industry Eng. Prog. 51 (2), 27–30. doi:10.16283/j.cnki.hgkwyjg.2022.02.005
Zhang, Z., Zhang, L., and Chen, C. (2022). Flotation study of a mixed-type phosphate ore in Dongchuan, Yunnan. Phosphate & Compd. Fertilizer 37 (9), 15–16+36. doi:10.3969/j.issn.1007-6220.2022.09.006
Zhao, B., Xu, T., Yang, S., and Fu, T. (2021). Numerical simulation and experimental study on fatigue damage and failure of high-stress rocks under cyclic loading. J. Central South Univ. Sci. Technol. 52 (8), 2725–2735. doi:10.11817/j.issn.1672-7207.2021.08.019
Zheng, G., Xu, J., Wang, P., Fang, X., and Wang, H. (2017). Dynamic and static mechanical tests of red sandstone under different water saturation levels. J. Air Force Eng. Univ. Nat. Sci. Ed. 18 (1), 99–104. (In Chinese). doi:10.3969/j.issn.1009-3516.2017.01.017
Keywords: seismic disturbance, water-saturated, phosphate rock, strength characteristics, failure characteristic
Citation: Li S, Wang H, Wang C, Zhang B and Zhang D (2023) Deterioration mechanism of physical and mechanical properties of phosphate rock under seismic disturbance and saturation. Front. Earth Sci. 11:1211314. doi: 10.3389/feart.2023.1211314
Received: 24 April 2023; Accepted: 15 June 2023;
Published: 07 August 2023.
Edited by:
Yubing Liu, China University of Mining and Technology, ChinaReviewed by:
Chao Liu, China University of Mining and Technology, ChinaMinghui Li, Shenzhen University, China
Copyright © 2023 Li, Wang, Wang, Zhang and Zhang. This is an open-access article distributed under the terms of the Creative Commons Attribution License (CC BY). The use, distribution or reproduction in other forums is permitted, provided the original author(s) and the copyright owner(s) are credited and that the original publication in this journal is cited, in accordance with accepted academic practice. No use, distribution or reproduction is permitted which does not comply with these terms.
*Correspondence: Chongyang Wang, d2N5QGNxdS5lZHUuY24=