 Shengzhong Zhang1
 Bing Zhang
- 1Information Network Center, China University of Geosciences (Beijing), Beijing, China
- 2Key Laboratory of Computational Geodynamics, College of Earth and Planetary Sciences, University of Chinese Academy of Sciences, Beijing, China
- 3Geophysical Exploration Center, Zhengzhou, China
- 4Guangdong Earthquake Agency, Guangzhou, China
The Tien Shan and its adjacent areas have been a prime place to understand the process of continental collision, the mechanism of mountain building and the interaction of tectonic blocks. In this study, we collect seismic data recorded by 74 broad-band stations from the China Provincial Digital Seismic Networks and the Regional Kyrgyzstan and Kazakhstan Networks between January, 2007 and September, 2009. A joint inversion technique that combines three types of datasets (receiver functions, phase velocities of Rayleigh wave measured from both ambient noise and teleseismic earthquake data) is applied to image the crustal and upper mantle structure beneath the Tien Shan and its adjacent areas. The average crustal thickness in the study area is about 50 km, however, the Moho depth extends to ∼70 km beneath the Kyrgyz Platform near the southwestern Tien Shan. Our velocity models show a good correlation with subsurface geological features at shallow depths: low velocities are predominantly observed beneath the basins due to thick sedimentary layer, whereas high velocities are mainly distributed beneath the mountain ranges due to crystalline basement rocks. In the upper mantle a low velocity zone is obviously observed beneath the western Tien Shan. Both the crust thickness and S wave velocity structure of the Tien Shan and its adjacent regions display obvious horizontal and vertical heterogeneities from west to east, which suggests that the far-field effects of the collision between Eurasian plate and Indian plate plays an important role in the tectonic activity of the Tien Shan. The apparent velocity heterogeneities beneath the northern Tarim Basin may indicate that the Tarim Basin may have been eroded and damaged by upwelling hot materials from the upper mantle.
1 Introduction
The Tien Shan and its adjacent areas, the focus of the study, are situated more than 1,500 km from the India–Eurasia collision, and extends approximately 2,500 km in the east–west direction with a width of up to 400 km in the north–south direction in its western part (e.g., Burtman, 2015; England & Molnar, 2015; Yu et al., 2017). As one of the largest and most active intra-continental mountain systems in the world, the orogenic belt is composed of several parallel ranges and intermountain basins oriented nearly east–west and surrounded by several stable blocks, such as the Junggar Basin and Kazakh Shield to the north and the Tarim Basin to the south (Figure 1). In general, the Tien Shan orogenic belt can be divided into three segments from west to east: the western, central, and eastern Tien Shan.
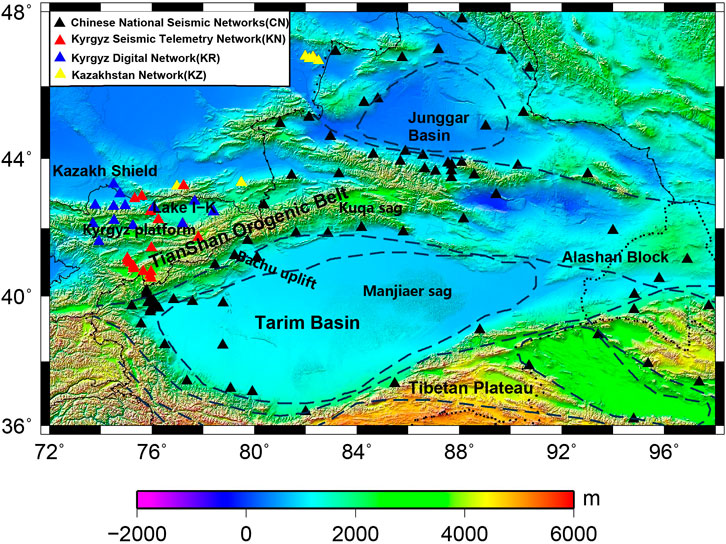
FIGURE 1. Seismic stations used in the study. Black triangles represent regional stations operated by the China Earthquake Administration (CEA), blue triangles indicate seismic stations of Kyrgyz and Kazakh networks, red triangles are stations deployed by XW, G, KZ and KN networks.
The Tien Shan was initially formed at the end of the late Palaeozoic, and was associated with the closure of the Palaeo-Asian Ocean and the accretion of continental blocks and island arcs (e.g., Burtman, 1975; Windley et al, 1990; Avouac et al, 1993; Allen et al, 1999). Since the Oligocene the Tien Shan is in the re-active stage due to the continental collision between the Indian and Eurasian Plates (Tapponnier and Molnar, 1979; Li et al, 2009). Several multistage magmatic episodes are identified from the late Cambrian to late Permian based on zircon U/Pb dating (De Grave et al, 2011). There are lots of intracontinental faults characterized by active periods during the Triassic and Jurassic and remained stable during the Cretaceous and early Tertiary beneath the Tien Shan and its adjacent areas (Omuralieva et al, 2009). However, the far-field effect of the India–Eurasia collision since approximately 50 Ma makes the modern Tien Shan rejuvenated in the late Cenozoic (e.g., Molnar & Tapponnier, 1975; Yin et al, 1998; Kaban& Yuanda 2014). The tectonic activity continues to the present day in the Tien Shan orogenic belt and its adjacent areas based on current intracontinental seismicity and complex Cenozoic tectonics (Ma et al, 2023).
Many geophysical and geological researches have been devoted to study the enigmatic Tien Shan(e.g., Kosarev et al, 1993; Roecker et al, 2001; Vinnik et al, 2002; Vinnik et al2004; Lei &Zhao, 2007; Li et al, 2009; Makarov et al, 2010; Lei, 2011; Zabelina et al, 2013; Gao et al, 2013; Gilligan et al, 2014; Li et al, 2016). However, some controversies still remain because of sparse stations and the limitation of a single method. Active source data from Middle AsiaN Active Source (MANAS) project revealed a thick crust beneath the southern Tien Shan, which may suggest that the Tarim crust is underthrusting beneath the Tien Shan (Makarov et al, 2010; Gilligan et al, 2014). The seismic reflection data beneath the south-west Tien Shan showed that there is no firm justifications for undertrusting of the Tarim block beneath the Tien Shan (Gao et al, 2013; Li et al, 2016). Body wave tomographic studies using passive source data showed that a relatively low-velocity zone in the upper mantle exceed 150 km depth is visible beneath the central Tien Shan, which has been interpreted as asthenospheric upwelling induced by lithospheric delamination (Roecker et al., 1993; Li et al, 2009; Lei, 2011; Zabelina et al, 2013). The low-velocity anomaly in the middle crust beneath the central Tien Shan were also reported by some of these studies (Li et al, 2009; Lei, 2011; Zabelina et al, 2013), and the low-velocity anomaly was interpreted probably by magmatic intrusion into the crust from the upper mantle. Receiver function studies revealed a thin lithospheric lid with high velocity beneath central Tien Shan may indicate the strong lithosphere is competent to transmit stress from Tarim Basin north to the Kazakh Shield. The strong mantle lithosphere and the lack of low velocity layer in the crust (Vinnik et al, 2002; Makarov et al, 2010) in the Nargn Basin where the shallowest Moho is found indicate that the strong lithospheric block protects the overlying crust form deformation (Bielinski et al, 2003;Vinnik et al, 2004;Gilligan et al, 2014).
Owing to sparse station coverage and limited data availability, a detailed 3-D structure from the shallow crust down to the uppermost mantle beneath the Tien Shan are still poorly resolved. As is known, surface wave dispersion measurements are sensitive to the absolute velocity while receiver functions are mostly sensitive to the velocity contrast. To reduce the ambiguities due to one single type of observation, in this study, we apply a joint inversion technique by using multiple dataset: receiver functions, and surface waves measured from both ambient noise and teleseismic earthquake to investigate the crustal and uppermost mantle structure beneath the Tien Shan and its adjacent areas.
2 Data and methods
We use a joint inversion technique that combines three types of datasets (receiver functions, phase velocities of fundamental mode Rayleigh wave measured from ambient noise and teleseismic earthquake arrivals) from 91 seismic stations deployed by a number of groups from 2007 to 2009 (Figure 2A) to image the crustal and upper mantle structure in the Tien Shan and its adjacent areas. Since receiver functions are mostly sensitive to velocity discontinuities and surface wave dispersion measurements are more sensitive to volumetric velocity variations, such a joint inversion can significantly improve the resolution compared to those obtained using a single type of data.
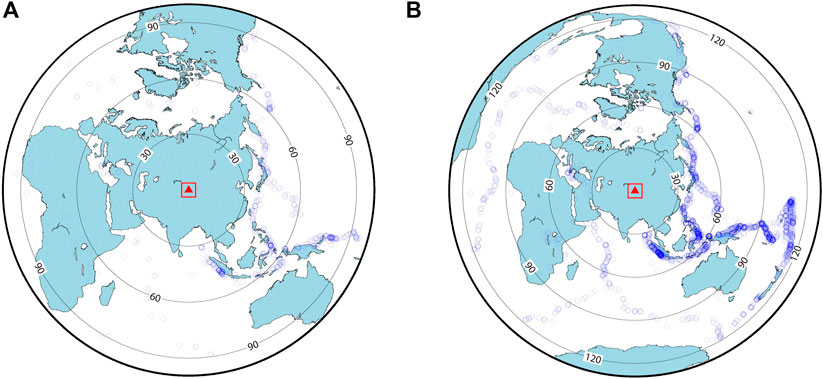
FIGURE 2. (A) Epicentres of teleseismic events used in the P-wave receiver functions analysis. (B) Epicentres of teleseismic events for two-plane-wave tomography in this study. Blue circles represent earthquakes, red square and triangle represent the study area and the center of the array, respectively.
We select 487 telesismic events with magnitudes larger than 5.0 and epicentral distances between 30° and 90° (Figure 2A) recorded by 91 broadband stations from the China Provincial Digital Seismic Networks, the Regional Kyrgyzstan and Kazakhstan Networks between January, 2007 and September, 2009. A bandpass filter of 0.05–2 Hz with a Gaussian parameter of 3 is adopted to remove the lower frequency noise. Then P wave receiver functions are calculated with a time domain iterative deconvolution method (Langston, 1979; Liggorria and Ammon, 1999). Finally 17,350 receiver functions are obtained in total, and the Moho depth and Vp/Vs. ratio at each station are determined by applying a H-k stacking method (Zhu and Kanamori, 2000).
We extract Rayleigh wave phase velocity dispersion curves from both telesismic earthquakes and ambient noise data. Continuous seismic data recorded at 74 stations from January 2009 to September 2009 are used to retrieve short-to intermediate-period surface waves (Figure 2B; Shapiro and Campillo, 2004; Shapiro et al, 2005; Bensen et al, 2007). More than 2,700 reliable Rayleigh wave phase velocity dispersion curves in a period band from 8 s to 40 s are obtained. The estimated lateral resolution based on checkerboard tests is about 1.2° × 1.2°(Figure 3).
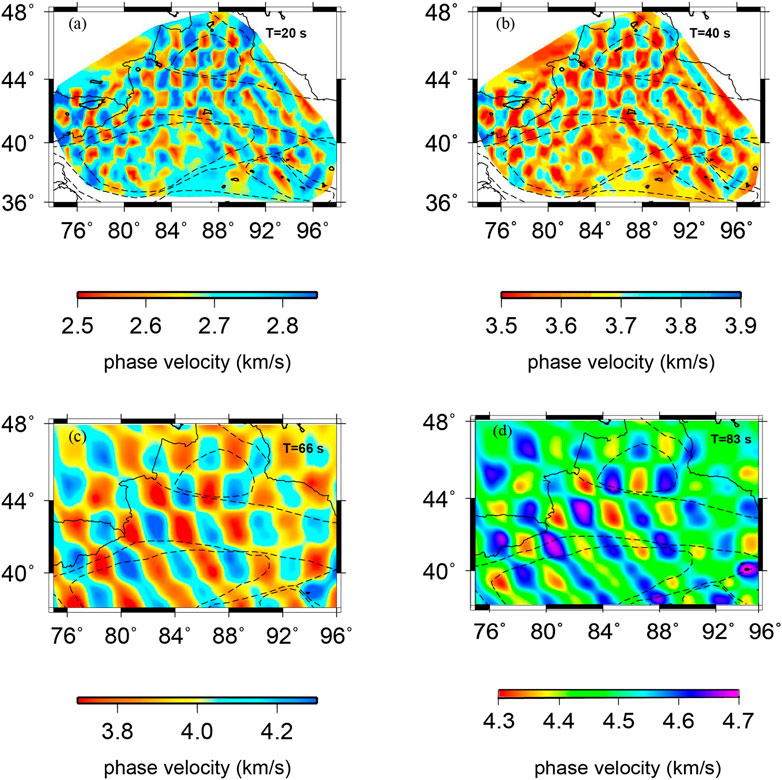
FIGURE 3. Checkerboard tests of 20 s, 40 s and 66 s, 83 s in ambient noise tomography and two-plane-wave tomography, respectively.
By applying a two-plane-wave tomography method proposed by Yang and Forsyth (2006a,b), 896 earthquakes with Ms ≥ 5.5 and epicentral distances between 30° and 120° are picked to extract intermediate-long period surface waves (29–111 s). Checkerboard test with 2° × 2° elements shows an overall good recovery of the phase velocity except the marginal area (Figure 3). Rayleigh wave dispersion measurements from ambient noise and two-plane wave methods are then combined to generate Rayleigh wave phase velocity maps from 8 to 111 s.
Finally, we perform a linear joint inversion of surface wave dispersion data and teleseismic P wave receiver functions. Ozalaybey et al (1997) first proposed to invert the S wave velocity structure of the crust and upper mantle by combining the receiver functions with the surface wave dispersions. Since then, this method has been applied in different regions with good results (Julia et al, 2000; Herrmann and Ammon, 2004). In this paper, an iterative least-squares linear inversion method (Herrmann and Ammon, 2004) is used to jointly invert the receiver functions and base-order Rayleigh surface wave group velocities at Tien Shan and its neighboring stations. During the joint inversion iteration, the Vp/Vs. ratio is fixed for each layer of the model, and the density is calculated from the P-wave velocity after each iteration. In order to obtain the simplest model in the case of data matching, a first-order difference constraint is applied to the velocity variation at each boundary during the inversion process. By simultaneously inverting the Rayleigh wave dispersions and receiver functions with the method of Juli`a et al. (2000), we construct a 3-D shear wave velocity model from the surface down to 120 km depth. In our joint inversion, the starting model is set up as a simple half space with a constant shear wave velocity of 4.0 km/s, a Vp/Vs. ratio of 1.75, and a density of 3.3 kg/
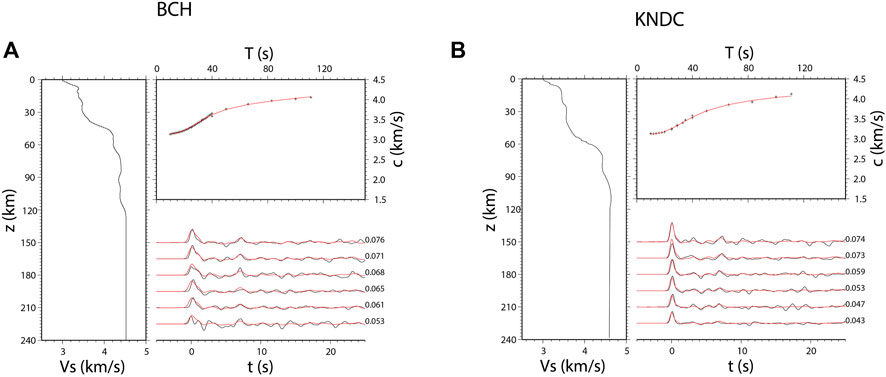
FIGURE 4. (A) The inverted S wave velocity structure for station BCH located at 39.790°N, 78.780°E. (B) The inverted S wave velocity structure for station KNDC located at 43.217°N, 76.966°E. The dispersion curve fitting: black crosses denote observed phase velocities and red lines represent predicted phase velocities. Receiver function fitting: black and red lines represent observed and predicted receiver functions, respectively. The values to the right of the curves are ray parameters.
3 Results
The measured crustal thickness shows large scale lateral variation passing across the margin of basins to the orogenic belt, varying from 40 km to 70 km (Figure 5A). The shallowest Moho is observed beneath the edge of Tarim terrane, Lake I-K in the central Tien Shan and Kazakh Shield, while the deepest Moho is located in the southwestern part of Tien Shan area, the Kokshaal and Kyrgyz platform. The Moho depths beneath the magins of Tarim Basin and Junggar Basin are much thinner than beneath the Tien Shan orogenic belt. The crustal thickness of Tien Shan area shows a thickening trend from north to south. The observed crustal thickness shows a significant positive correlation with surface topography. The Vp/Vs. ratio is in the range of 1.55–1.90 as illustrated in Figure 5B. The detailed Moho depth, Vp/Vs. ratio and their uncertainties are given in Supplementary Table S1 as a Supplementary Materials.
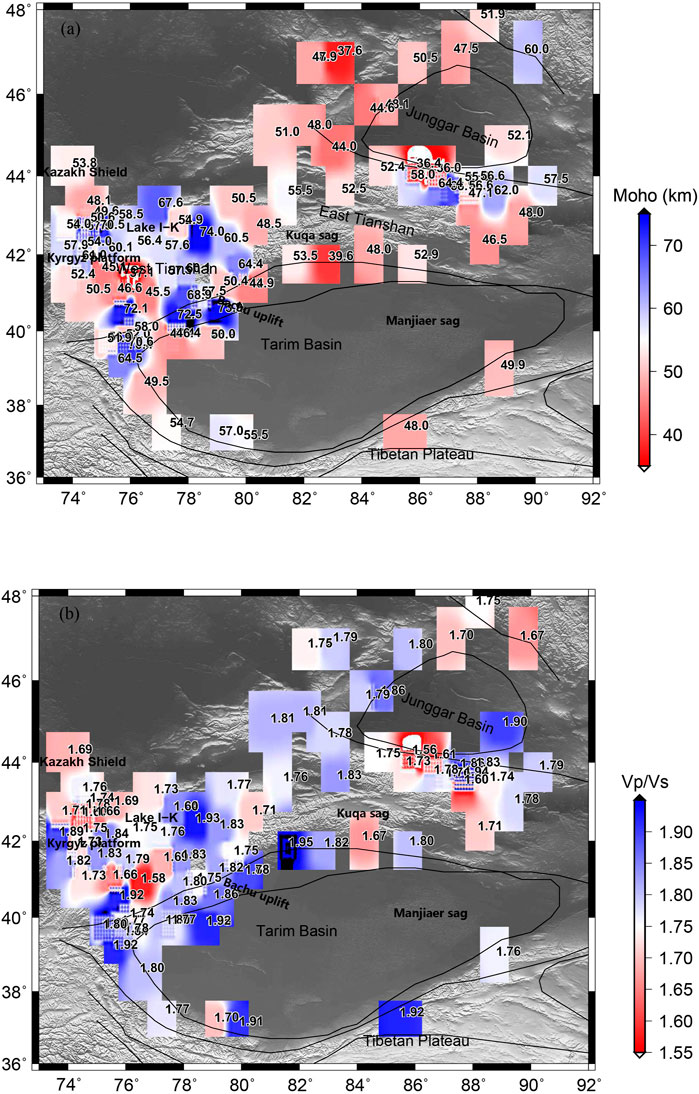
FIGURE 5. Estimated Moho depth (A) and Vp/Vs. ratios (B) from teleseismic P wave receiver functions.
The average S wave velocity structure at different depths in the crust and upper mantle highlights heterogeneities (Figure 6). At shallow depth (surface-20 km, Figure 6A), the edges of Tarim Basin and Junggar Basin are delineated with apparently low velocity (∼3.0 km/s) because of the presence of thick sediment. A high velocity feature (3.3 km/s-3.4 km/s) is observed beneath the Tien Shan orogenic belt and Kazakh platform. The eastern Tien Shan appears to have a slightly lower velocity thanthe western Tien Shan. It is notable that the prominent high velocity anomalies are observed beneath the Bachu Uplift in the northwest, while the lowest speed appears in the Mangiaer Sag.
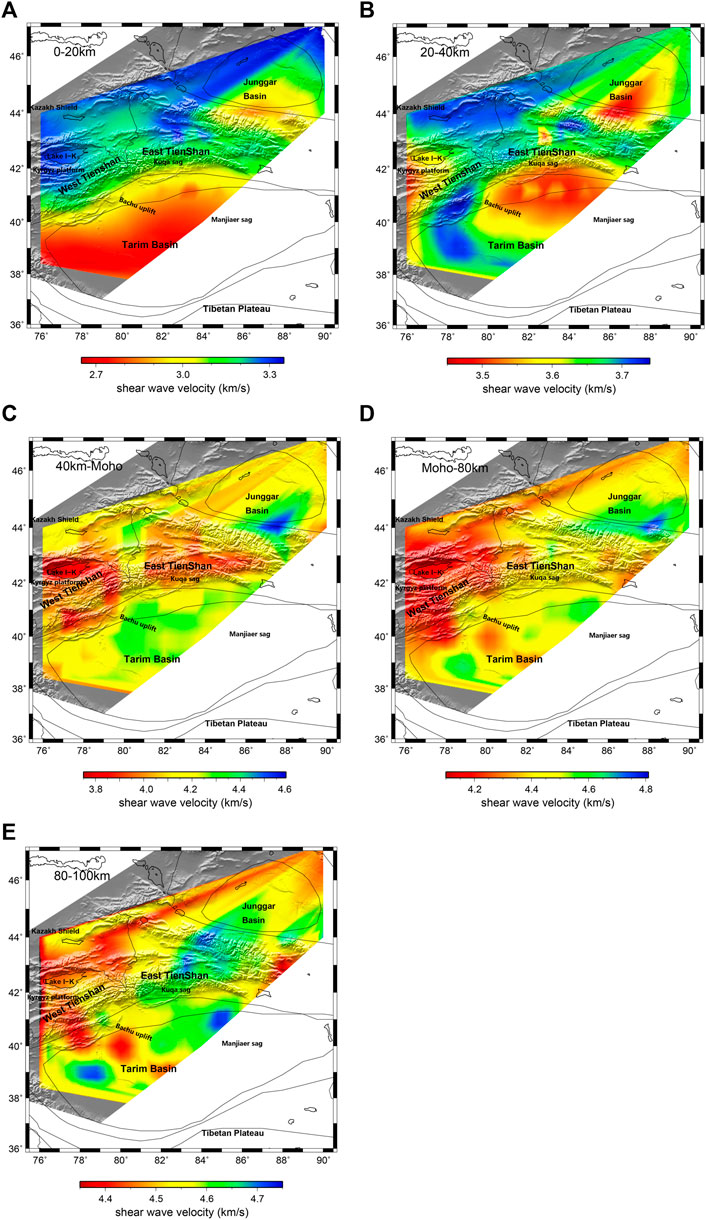
FIGURE 6. (A) Averaged S velocity within the up crust in the depth interval from surface to 20 km. (B) Averaged S velocity within the middle crust in the depth interval from 20 km to 40 km. (C) Averaged S velocity within the low crust in the depth interval from 40 km to Moho. (D) Averaged S velocity within the upper mantle in the depth interval from Moho to 80 km. (E) Averaged S velocity within the upper mantle in the depth interval from 80 km to 100 km.
In the middle crust (20 km–40 km) (Figure 6B), the Tien Shan is still depicted with relatively high velocities, meanwhile the velocity of west Tien Shan is slightly lower than the east part. The margin of Tarim Basin shows a high velocity trend gradually. Moreover, the northwest part is evidently higher than the northeast. Kuqa Sag, located in the northwest of the Tarim Basin, also shows a relatively high velocity(∼3.7 km/s) which is comparable to the Kazakh Platform; however, the northeast of the Tarim Basin exhibits a relatively low speed(∼3.5 km/s).
In the lower crust (40 km-Moho) (Figure 6C), the high speed is presented beneath the Tazhong Uplift and Junggar Basin (∼4.2 km/s), while the low speed is observed in the TienShan area, varying from 3.7 km/s to 3.9 km/s. We notice that the S wave speed shows a significant variation across the Tien Shan from west to east.
In the uppermost mantle (Figures 6D, E), the basin areas still remain high velocity feature (4.5 km/s–4.7 km/s), while the mountainous region is characterized by continuously low speed anomaly from mid-to-low crust to the upper mantle.
4 Discussion and conclusion
The Moho depths estimated from receiver functions are given in Figure 5. The crustal thickness shows an inverse relation with topography, reflecting general isostatic compensation of the topography. The Moho in the study area varies sharply, and its overall distribution shows the characteristics of thinness in the east and thickness in the west. The crustal thickness in the inner part of the contact zone between Junggar Basin and Tien Shan is about 51 km, and the crustal thickness deepens from about 51 km to 54 km when it extends from the inner part of the contact zone of Junggar Basin to the inner part of Tianshan and reaches the front of Tianshan Mountain; the crustal thickness in the contact zone between Tarim Basin and Tianshan is about 48 km. (2) Figure 5B illustrates the variation of the Vp/Vs. ratio of the crust across the study area. The Vp/Vs. ratios are relatively high with an average value of 1.9 in the werst Tien Shan, where thickened crusts are observed. In contrast, beneath the central orogen, which also has a relative thick crust, the Vp/Vs. ratios are much lower, with an average value of 1.73. The complex variation of crustal Poisson’s ratio in the study area indicates the complexity of the crustal material composition and significant inhomogeneous tectonics. (3) There is no obvious correlation between the crustal thickness and Poisson’s ratio in the whole study area.
In our study, we construct a 3-D velocity model obtained from the joint inversion of Rayleigh wave dispersions and receiver functions. Our results show that the middle-lower crust beneath the east Tien Shan is delineated with a relative low velocity while a prominent high velocity anomaly highlights in the upper mantle (Figures 7A, B), which has been also revealed in previous researches (Xu et al, 2002; Zhao et al, 2003). Zhao et al (2003) reported that the polarization directions of fast shear-waves of the stations located at the Tarim Basin and Junggar Basin is dominant N-S, aligning with the direction of impact extrusion deformation between tectonic units, which indicates that the lithospheres of the Tarim and Junggar basins have subducted beneath the eastern Tien Shan. The relatively high velocity anomaly in the upper mantle observed in this study also support the subduction of Tarim Basin towards the eastern Tien Shan which leads to the uplift of the orogenic belt.
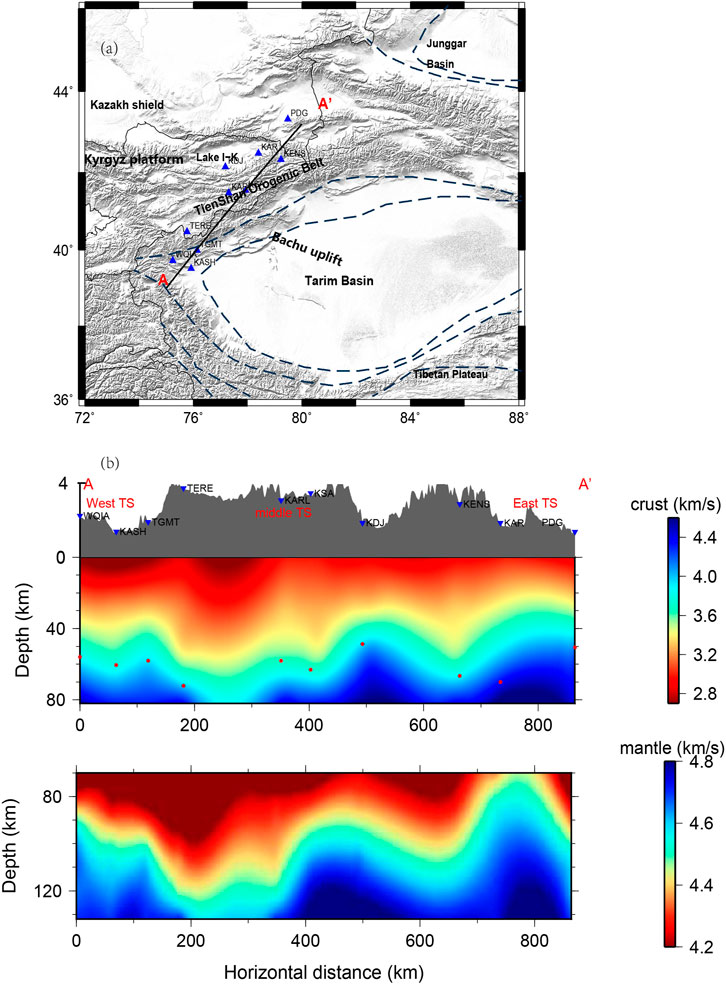
FIGURE 7. (A) Topography along Line AA’ is shown at the top. (B) Cross-section of S velocity along the Line AA’ for the crust (top) and for the uppermantle (bottom). Inverted blue triangles represent seismic stations. Red dots delegate Moho depth from the receiver function.
The relatively low velocity beneath the west Tien Shan extends from the middle-low crust to upper mantle continuously, which is generally consistent with previous tomographic images (Friederich, 2003; Kufner et al, 2016; Li et al, 2018). In the west Tien Shan, the high speed lid in the upper mantle moves eastward into the deeper lithosphere, while the west part is replaced by apparently low velocities. We suggest that the orogeny and deformation beneath the east Tien shan are relatively weak than in the west Tien Shan since the far-field effects of the India-Eurasian collision diminish from west to east. The approximately NS-trending low velocity zone of lower crust and the high velocity lid of upper mantle vary with depths between east and west parts of Tien Shan, implying the differences in tectonic activities and deformations for eastern and western Tien Shan. The differences may be caused by the different responses of western and eastern Tianshan to the India-Eurasia collision. The intracontinental orogenic process of the whole Tien Shan orogenic belt is not only limited to the crust and the low velocity anolmaly in the upper mantle beneath west Tien Shan may be caused by a small-scale convection due to the lithosphere delamination and deformation.
Based on geological analysis, Molnar and Tapponnier (1975) stated that the Tarim Basin is completely rigid and stable as a Paleozoic craton basin above the Precambrian basement, which plays a role of stress transfer in the process of the Tien Shan orogeny. The results in our study show obvious heterogeneities in S wave velocities in the northern Tarim Basin. In the upper mantle, we notice that an obvious low velocity anomaly is distributed in the northwestern Tarim, suggesting that the lithosphere of Tarim Basin may not be as stable as the craton basin should be. Body wave images also found that there are significant differences in velocity between the northern and southern parts of Tarim Basin (Xu et al, 2002). Qu et al (2013) speculated that there might be partial melting from the upper mantle which might be related to the Permian lithospheric volcanism in this region. Therefore, we suggest that in some ways the Tarim Basin may have been eroded by upwelling hot material from the mantle.
In a summary, a detailed 3-D shear wave velocity structure in the crust and upper mantle across the Tien Shan was derived by the joint inversion of teleseismic P wave receiver functions with Rayleigh wave phase velocity dispersion data in this study. A high-resolution image of the crust and upper mantle structure could provide significant tomographic evidence for a new analysis perspective to the dynamic processes of the Tien Shan orogenic belt. Both the crust thickness and S wave velocity structure of the Tien Shan and its adjacent regions display obvious horizontal and vertical heterogeneities from west to east which suggests that the far-field effects of the collision between Eurasian plate and Indian plate plays an important role in the tectonic activity of the Tien Shan. The apparent velocity heterogeneities beneath the northern Tarim Basin may indicate that the Tarim Basin may have been eroded and damaged by upwelling hot materials from the upper mantle.
Data availability statement
The data analyzed in this study is subject to the following licenses/restrictions: The data that support the findings of this study are available from China Earthquake Administration but restrictions apply to the availability of these data, which were used under license for the current study, and so are not publicly available. Data are however available from the authors upon reasonable request and with permission of China Earthquake Administration. Requests to access these datasets should be directed to https://www.cea-igp.ac.cn/.
Author contributions
SZ: methodology, validation, formal analysis, investigation, writing—original draft, visualization. BZ: conceptualization, writing—review and editing, supervision. MZ and LO: methodology, visualization. All authors contributed to the article and approved the submitted version.
Funding
This study was funded by National Science Foundation of China Grant (No. 42104054).
Acknowledgments
The seismic waveform data used in this study were provided by the China Earthquake Administration and IRIS. We also thank Prof. Xiaobo Tian for the creative discussions and suggestions.
Conflict of interest
The authors declare that the research was conducted in the absence of any commercial or financial relationships that could be construed as a potential conflict of interest.
Publisher’s note
All claims expressed in this article are solely those of the authors and do not necessarily represent those of their affiliated organizations, or those of the publisher, the editors and the reviewers. Any product that may be evaluated in this article, or claim that may be made by its manufacturer, is not guaranteed or endorsed by the publisher.
Supplementary material
The Supplementary Material for this article can be found online at: https://www.frontiersin.org/articles/10.3389/feart.2023.1215103/full#supplementary-material
References
Allen, M. B., Vincent, S. J., and Wheeler, P. J. (1999). Late cenozoic tectonics of the kepingtage thrust zone: Interactions of the tien Shan and Tarim Basin, northwest China. Tectonics 18 (4), 639–654. doi:10.1029/1999tc900019
Avouac, J. P., Tapponnier, P., Bai, M., You, H., and Wang, G. (1993). Active thrusting and folding along the northern tien Shan and late cenozoic rotation of the tarim relative to dzungaria and Kazakhstan. J. Geophys. Res. 98 (B4), 6755–6804. doi:10.1029/92jb01963
Bensen, G. D., Ritzwoller, M. H., Barmin, M. P., Levshin, A. L., Lin, F., Moschetti, M. P., et al. (2007). Processing seismic ambient noise data to obtain reliable broad-band surface wave dispersion measurements. Geophys. J. Int. 169 (3), 1239–1260. doi:10.1111/j.1365-246x.2007.03374.x
Bielinski, R. A., Park, S. K., Rybin, A., Batalev, V., Jun, S., and Sears, C. (2003). Lithospheric heterogeneity in the Kyrgyz Tien Shan imaged by magnetotelluric studies. Geophys. Res. Lett. 30 (15), 1806. doi:10.1029/2003GL017455
Burtman, V. S. (2015). Tectonics and geodynamics of the Tian Shan in the middle and late paleozoic. Geotectonics 49, 302–319. doi:10.1134/s0016852115040020
De Grave, J., Glorie, S., Buslov, M. M., Izmer, A., Fournier-Carrie, A., Batalev, V. Y., et al. (2011). The thermo-tectonic history of the song-kul plateau, Kyrgyz tien Shan: Constraints by apatite and titanite thermochronometry and zircon U/Pb dating. Gondwana Res. 20, 745–763. doi:10.1016/j.gr.2011.03.011
England, P., and Molnar, P. (2015). Rheology of the lithosphere beneath thecentral and Western Tien Shan. J. Geophys. Res. 120, 3803–3823. doi:10.1002/2014jb011733
Friederich, W. (2003). The S-velocity structure of the East Asianmantle from inversion of shear and surface waveforms. Geophys. J. Int. 153, 88–102. doi:10.1046/j.1365-246x.2003.01869.x
Gao, R., Hou, H., Cai, X., Knapp, J. H., He, R., Liu, J., et al. (2013). Fine crustal structure beneath the junction of the southwest Tian Shan and Tarim Basin, NW China. Lithosphere 5 (4), 382–392. doi:10.1130/l248.1
Gilligan, A., Roecker, S. W., Priestley, K. F., and Nunn, C. (2014). Shear velocity model for the Kyrgyz Tien Shan from joint inversion of receiver function and surface wave data. Geophys. J. Int. 199, 480–498. doi:10.1093/gji/ggu225
Herrmann, R. B., and Ammon, C. J. (2004). “Surface waves, receiver functions and crustal structure,” in Computer programs in seismology (St. Louis, Missouri: Saint Louis Univ.). [Electronic] (Version 3.30.
Julia`, J., Ammon, C. J., Herrmann, R. B., and Correig, A. M. (2000). Joint inversion of receiver function and surface wave dispersion observations. Geophys. J. Int. 143, 99–112. doi:10.1046/j.1365-246x.2000.00217.x
Kosarev, G. L., Petersen, N. V., Vinnik, L. P., and Roecker, S. W. (1993). Receiver functions for the tien Shan analog broadband network: Contrasts in the evolution of structures across the talasso-fergana fault. J. Geophys. Res. 98, 4437–4448. doi:10.1029/92jb02651
Kufner, S. K., Schurr, B., Sippl, C., Yuan, X., Ratschbacher, L., Akbar, A. s. M., et al. (2016). Deep India meets deep asia: Lithospheric indentation, delamination and break-off under pamir and hindu kush (central asia). Earth Planet. Sci. Lett. 435, 171–184. doi:10.1016/j.epsl.2015.11.046
Langston, C. A. (1979). Structure under mount rainier, Washington, inferred from teleseismic body waves. J. Geophys. Res. 84, 4749–4762. doi:10.1029/jb084ib09p04749
Lei, J. (2011). Seismic tomographic imaging of the crust and upper mantle under the central and Western Tien Shan orogenic belt. J. Geophys. Res. 116, B09305. doi:10.1029/2010JB008000.B09305
Lei, J., and Zhao, D. (2007). Teleseismic p-wave tomography and the upper mantle structure of the central Tien Shan orogenic belt. Phys. Earth Planet. Interiors 162 (3), 165–185. doi:10.1016/j.pepi.2007.04.010
Li, H., Su, W., Wang, C. Y., and Huang, Z. (2009). Ambient noise Rayleigh wave tomography in Western Sichuan and eastern Tibet. Earth Planet. Sci. Lett. 282 (1), 201–211. doi:10.1016/j.epsl.2009.03.021
Li, W., Chen, Y., Yuan, X. H., Schurr, B., Mechie, J., Oimahmadov, I., et al. (2018). Continental lithospheric subduction and intermediate-depth seismicity: Constraints from S-wave velocity structures in the Pamir and Hindu Kush. Earth Planet. Sci. Lett. 482, 478–489. doi:10.1016/j.epsl.2017.11.031
Li, Y., Shi, L., and Gao, J. (2016). Lithospheric structure across the central Tien Shan constrained by gravity anomalies and joint inversions of receiver function and Rayleigh wave dispersion. J. Asian Earth Sci. 124, 191–203. doi:10.1016/j.jseaes.2016.05.003
Ligorria, J. P., and Ammon, C. J. (1999). Iterative deconvolution and receiver function estimation. Bull. Seism. Soc. Am. 89 (5), 1395–1400. doi:10.1785/bssa0890051395
Ma, X., Zhao, L. F., Xie, X. B., Chang, X., and Yao, Z. X. (2023). Warm versus cold crust in the Tien Shan orogenic belt revealed by seismic Lg attenuation tomography. Geophys. J. Int. 233, 2142–2154. doi:10.1093/gji/ggad055
Makarov, V. I., Alekseev, D. V., Batalev, V. Y., Bataleva, E. A., Belyaev, I. V., Bragin, V. D., et al. (2010). Underthrusting of tarim beneath the tien Shan and deep structure of their junction zone: Main results of seismic experiment along manas profile kashgar-song-köl. Geotectonics 44 (2), 102–126. doi:10.1134/s0016852110020020
Molnar, P., and Tapponnier, P. (1975). Cenozoic Tectonics of Asia: Effects of a Continental Collision: Features of recent continental tectonics in Asia can be interpreted as results of the India-Eurasia collision. Science 189 (4201), 419–426. doi:10.1126/science.189.4201.419
Omuralieva, A., Nakajima, J., and Hasegawa, A. (2009). Three-dimensional seismic velocity structure of the crust beneath the central tien Shan, Kyrgyzstan: Implications for large- and small-scale mountain building. Tectonophysics 465, 30–44. doi:10.1016/j.tecto.2008.10.010
Özalaybey, Serdar, Savage, M. K., Sheehan, A. F., Louie, J. N., and Brune, J. N. (1997). Shear-wave velocity structure in the northern Basin and Range province from the combined analysis of receiver functions and surface waves. Bull. Seismol. Soc. Am. 87 (1), 183–199. doi:10.1785/bssa0870010183
Qu, C., Yang, W. C., and Yu, C. Q. (2013). Seismic velocity tomography and Poisson’s ratio imaging in Tarim basin. Earth Sci. Front. 20 (5), 2–11.
Roecker, S. (2001). Constraints on the crust and upper mantle of the Kyrgyz Tien Shan from the preliminary analysis of GHENGIS broadband data. Russ. Geol. Geophys. 42, 1554–1565.
Roecker, S. W., Sabitova, T. M., Vinnik, L. P., Burmakov, Y. A., Golvanov, M. I., Mamatkanova, R., et al. (1993). Three-dimensional elastic wave velocity structure of the Western and central Tien Shan. J. Geophys. Res. 98 (B9), 15779–15795. doi:10.1029/93jb01560
Shapiro, N. M., and Campillo, M. (2004). Emergence of broadband Rayleigh waves from correlations of the ambient seismic noise. Geophys. Res. Lett. 31 (7), 1615–1619. doi:10.1029/2004gl019491
Shapiro, N. M., Campillo, M., Stehly, L., and Ritzwoller, M. H. (2005). High-resolution surface-wave tomography from ambient seismic noise. Science 307 (5715), 1615–1618. doi:10.1126/science.1108339
Tapponnier, P., and Molnar, P. (1979). Active faulting and cenozoic tectonics of the tien Shan, Mongolia, and baykal regions. J. Geophys. Res. 84 (B7), 3425–3459. doi:10.1029/jb084ib07p03425
Vinnik, L. P., Reigber, C., Aleshin, I. M., Kosarev, G. L., Kaban, M. K., Oreshin, S. I., et al. (2004). Receiver function tomography of the central Tien Shan. Sci. Lett. 225 (1–2), 131–146. doi:10.1016/j.epsl.2004.05.039
Vinnik, L. P., Roecker, S., Kosarev, G. L., Oreshin, S. I., and Koulakov, I. Y. (2002). Crustal structure and dynamics of the Tien Shan. Geophys. Res. Lett. 29 (22), 4-1–4-4. doi:10.1029/2002gl015531
Windley, B. F., Allen, M. B., Zhang, C., Zhao, Z. Y., and Wang, G. R. (1990). Paleozoic accretion and cenozoic redeformation of the Chinese tien Shan range, central asia. Geology v18, p128–p131. doi:10.1130/0091-7613(1990)018<0128:paacro>2.3.co;2
Xu, Y., Liu, F. T., Liu, J. H., and Chen, H. (2002). Crust and uppermantle structure beneath Western China from P wave travel time tomography. J. Geophys. Res. 107, ESE 4-1–ESE 4-15. doi:10.1029/2001JB000402
Yang, Y., and Forsyth, D. W. (2006b). Rayleigh wave phase velocities, small-scale convection, and azimuthal anisotropy beneath southern California. J. Geophys. Res. 111, B07306. doi:10.1029/2005JB004180
Yang, Y., and Forsyth, D. W. (2006a). Regional tomographic inversion of the amplitude and phase of Rayleigh waves with 2-D sensitivity kernels. Geophys. J. Int. 166 (3), 1148–1160. doi:10.1111/j.1365-246x.2006.02972.x
Yin, A., Nie, S., Craig, P., Harrison, T. M., Ryerson, F. J., Qian, X. L., et al. (1998). Late cenozoic tectonic evolution of the southern Chinese Tian Shan. Tectonics 17, 1–27. doi:10.1029/97tc03140
Zabelina, I. V., Koulakov, I. Yu., and Buslov, M. M. (2013). Deep mechanisms in the Kyrgyz Tien Shan orogen (from results of seismic tomography). Russ. Geol. Geophys 54, 695–706. doi:10.1016/j.rgg.2013.06.005
Zhao, J. M., Liu, G. D., Lu, Z. X., Xiankang, Z., and Guoze, Z. (2003). Lithospheric structure and dynamic processes of the Tianshan orogenic belt and the Junggar basin. Tectonophysics 376, 199–239. doi:10.1016/j.tecto.2003.07.001
Keywords: joint inversion, Tien Shan, crust and uppermost mantle structure, ambient noise, receiver function
Citation: Zhang S, Zhang B, Zhou M and Ouyang L (2023) Seismic velocity structure of the crust and uppermost mantle beneath the Tien Shan and its adjacent areas. Front. Earth Sci. 11:1215103. doi: 10.3389/feart.2023.1215103
Received: 01 May 2023; Accepted: 05 June 2023;
Published: 16 June 2023.
Edited by:
Jie Liao, Sun Yat-sen University, ChinaReviewed by:
Guangwei Zhang, Ministry of Emergency Management, ChinaShanshan Liang, China Earthquake Networks Center, China
Copyright © 2023 Zhang, Zhang, Zhou and Ouyang. This is an open-access article distributed under the terms of the Creative Commons Attribution License (CC BY). The use, distribution or reproduction in other forums is permitted, provided the original author(s) and the copyright owner(s) are credited and that the original publication in this journal is cited, in accordance with accepted academic practice. No use, distribution or reproduction is permitted which does not comply with these terms.
*Correspondence: Bing Zhang, emhhbmdiaW5ndWNhc0AxNjMuY29t