- 1Faculty of Humanities and Arts, Macau University of Science and Technology, Taipa, Macao SAR, China
- 2Department of Architecture, School of Civil Engineering and Mechanics, Yanshan University, Qinhuangdao, China
The Shanhaiguan Great Wall is a section of the Great Wall of the Ming Dynasty, which is a UNESCO World Heritage Site. Both sides of its basic structure are composed of rammed earth and gray bricks. The surface gray bricks sustain damage from environmental factors, resulting in a decline in their structural quality and even a threat to their safety. Traditional surface damage detection methods rely primarily on manual identification or manual identification following unmanned aerial vehicle (UAV) aerial photography, which is labor-intensive. This paper applies the YOLOv4 machine learning model to the gray surface bricks of the Plain Great Wall of Shanhaiguan as an illustration. By slicing and labeling the photos, creating a training set, and then training the model, the proposed approach automatically detects four types of damage (chalking, plants, ubiquinol, and cracking) on the surface of the Great Wall. This eliminates the need to expend costly human resources for manual identification following aerial photography, thereby accelerating the work. Through research, it is found that 1) compared with manual detection, this method can quickly and efficiently monitor a large number of wall samples in a short period of time and improve the efficiency of brick wall detection in ancient buildings. 2) Compared with previous approaches, the accuracy of the current method is improved. The identifiable types are increased to include chalking and ubiquinol, and the accuracy rate increases by 0.17% (from 85.70% before to 85.87% now). 3) This method can quickly identify the damaged parts of the wall without damaging the appearance of the historical building structure, enabling timely repair measures.
1 Introduction
1.1 Research background
The Great Wall of Shanhaiguan (also known as Shanhaiguan Pass or Shanhai Pass) was built in the 14th year of Hongwu’s reign in the Ming dynasty (1,381–1,644). In addition to the main line of the Great Wall, Laolongtou, Nanhaikou Pass, Ninghaicheng City, Nanyicheng City, Shanhaiguan City, the First Pass Under Heaven, Dongluocheng City, Beiyicheng City, Hanmen Pass, and Mount Jiaoshan Dapingding are also located there (UNESCO, 2023; Zhao et al., 2023). Shanhaiguan, China, is located 9 miles (15 km) northeast of Qinhuangdao City in Hebei Province and 305 km (190 miles) from Beijing. The Great Wall is one of the most ambitious projects built in ancient China. The Great Wall of all dynasties in China has played a very important defensive role. In 1987, the Great Wall was listed as a world cultural heritage site by UNESCO (Zhao et al., 2023). The existence of the Great Wall was also a spiritual line of defense against invasion for ancient China. In modern times, the Chinese have used the Great Wall as a symbol of China. As a part of the Great Wall of China, the Shanhaiguan Great Wall is very important to preserve its integrity and pay attention to daily maintenance.
The Great Wall of Shanhaiguan is divided into the Binhai (by the sea) Great Wall, the Plain Great Wall, and the Mountains Great Wall, depending on the location of the terrain (Figure 1). The Plain Great Wall is mainly made up of an outer layer covered with gray brick and an inner layer of rammed earth. The outer layer consisting of covered brick is bricked together with white ash. Part of the wall was original to the Ming dynasty’s construction, and another part of the wall had experienced several protective maintenance activities. After a long time in its natural environment containing wind, rain, and inorganic salt, as with other old gray brick buildings, the wall surface of the gray bricks suffered a variety of damages, such as chalking, plant growth, ubiquinol, and cracking. This damage must be detected and repaired in a timely manner to prevent further structural damage. The traditional methods of identifying damage faced by brick and stone buildings mainly include on-site artificial observation and instrumental analysis (Sowden, 1990; Flores-Colen et al., 2011; Hulimka et al., 2019; Han et al., 2022; Zhao et al., 2023). This work is carried out by experts (mostly experienced craftsmen or professional workers). Although traditional procedures can help obtain accurate building conditions, they also have several disadvantages. First, for large projects, such as the Great Wall, manual procedures require great manpower; with limited personnel, it takes a long time to find damaged areas, which may cause greater damage due to the untimely repair process in comparison with the timely confirmation of damage conditions. Second, since the Shanhaiguan Great Wall is tall and parts of it are located on mountains, it is very difficult to reach all parts of the wall facades. Correspondingly, it is difficult to identify their damage. Therefore, we need a more efficient method to help experts identify damage and minimize unnecessary further damage.
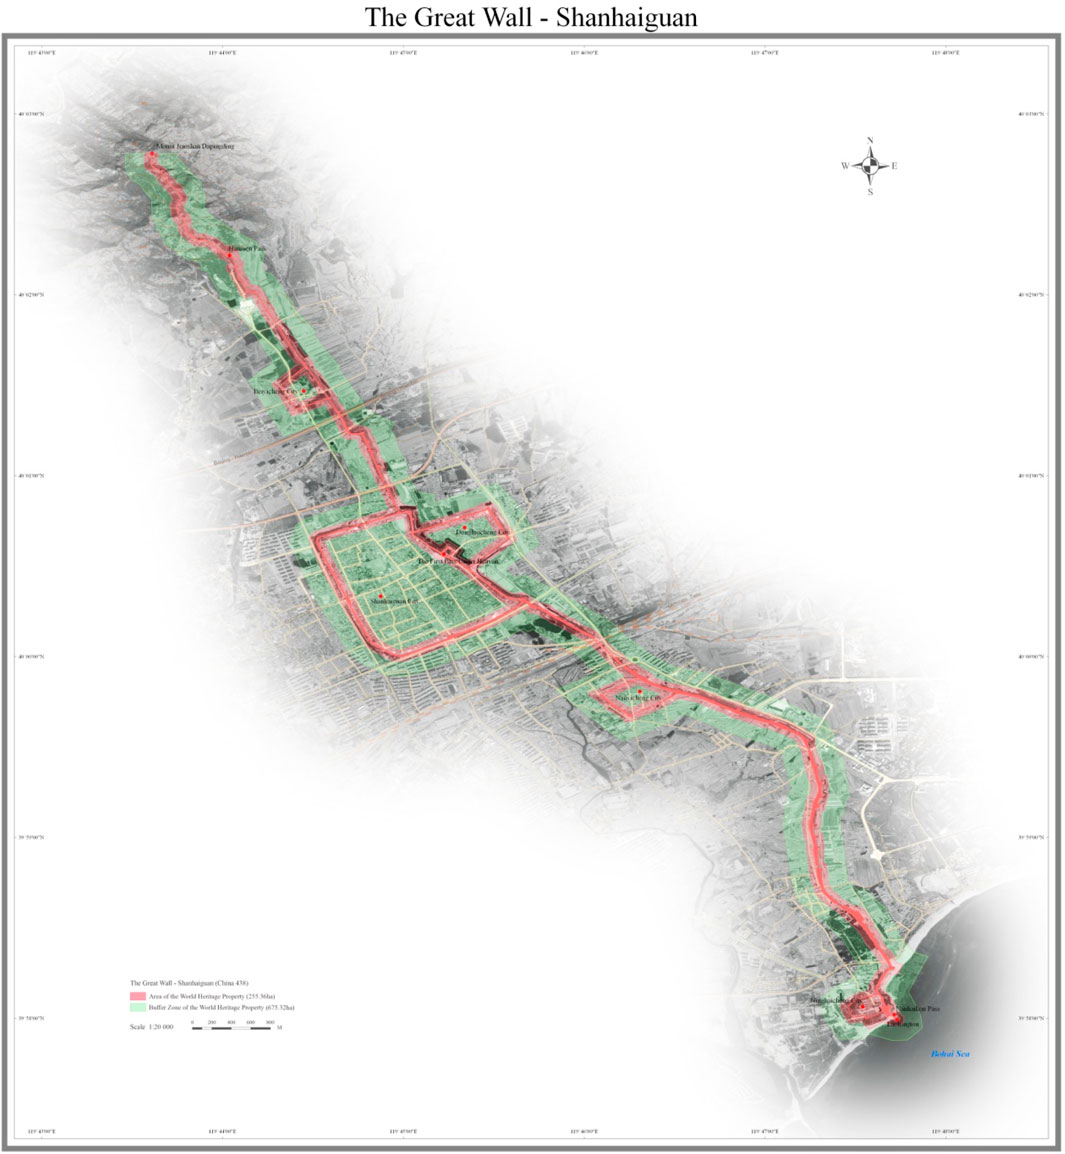
FIGURE 1. World Heritage scope of the Great Wall of Shanhaiguan (Image Source: https://whc.unesco.org/en/list/438/maps/).
1.2 Literature review
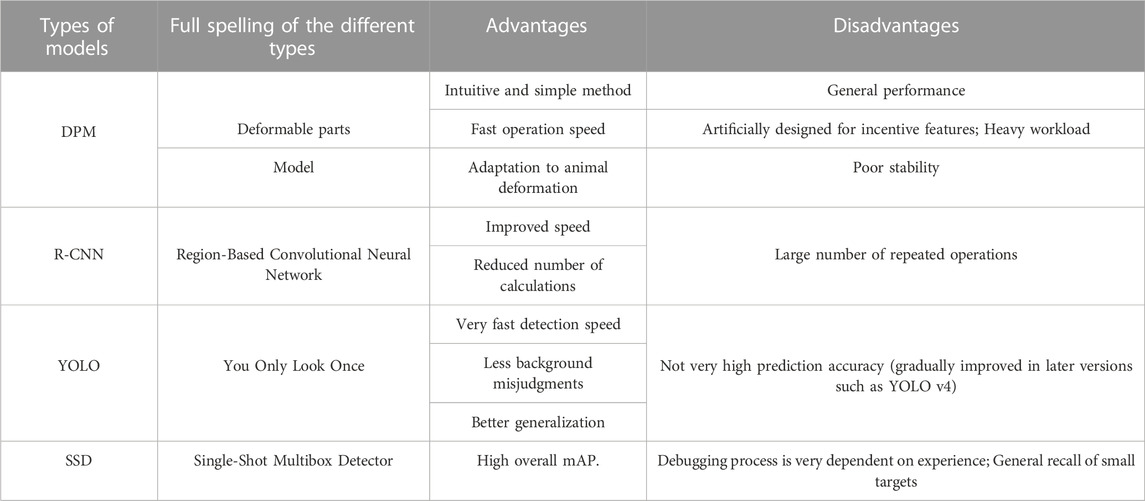
The rapid development of technology in various field of science and engineering has enabled the rapid growth of efficient high-level analyses. Two important achievements are unmanned aerial vehicles (UAVs) and image processing via machine learning techniques. A UAV system can help us obtain photos of all the details of building facades, especially for places that are difficult to reach (Hoła and Czarnecki, 2023; Qinhuangdao, 2023). Such systems are often used in conjunction with terrestrial laser scanning for automated damage identification and analysis (Hoła, 2023; Sestras et al., 2020; Ulvi, 2021); however, this strategy is not sufficiently convenient because terrestrial laser scanning requires professional equipment in addition to photos of facades. Due to its strong ability to learn from data, machine learning can solve problems efficiently. Image processing has been widely applied in biology, medicine, astronomy and different areas of engineering. The combination of machine learning and image processing can help solve more complex problems (Dolecek and Cho, 2022). Researchers can take photos with a UAV and then use machine learning to process the images to efficiently identify the damage suffered by heritage objects. The primary image processing models for object detection are DPM, R-CNN, YOLO and the SSD (Felzenszwalb et al., 2009; Girshick et al., 2014; Liu et al., 2016; Redmon et al., 2016). The properties of these methods are listed in Table 1. Scholars have carried out damage detection applications by performing image processing on cultural heritage objects or traditional buildings (Foti, 2015; Azarafza et al., 2019; Galantucci and Fatiguso, 2019; Wang et al., 2019; Mishra et al., 2022; Samhouri et al., 2022; Karadag, 2023). For example, the architectural heritage of the city of “Al-Salt in Jordan was detected based on the CNN-VGG16 model (Samhouri et al., 2022). Machine learning (ML) has also been applied to ancient masonry structures (Foti, 2015; Galantucci and Fatiguso, 2019; Mishra et al., 2022) to predict the missing or damaged parts of historical buildings within the scope of early Ottoman tombs (Karadag, 2023). Based on Table 1, if YOLOv4 is applied to Great Wall brick damage identification, it will be more efficient and prevent more unnecessary damage.
1.3 Problem statement and objectives
The Department of Cultural Relics Protection used UAVs to take photos of the Plain Great Wall of Shanhaiguan for inspection. If image analysis technology can automatically identify the type of damage suffered by the surface bricks of the Great Wall, it can also reduce the required labor costs to a certain extent. Therefore, this paper takes the Shanhaiguan Great Wall as an example to build a YOLOv4 machine learning model, verify the accuracy of machine learning, and realize the automatic detection of the damage types experienced by gray bricks on the surface of the Shanhaiguan Great Wall. In this paper, the researchers investigate five questions.
(1) How many distinct types of damage can gray bricks be classified into as a result of on-site investigations and photographs?
(2) How does machine learning contribute to the development of the core technology that helps detect various types of brick damage?
(3) What is the outcome of the photo recognition and analysis of the damage types suffered by the gray bricks on the Shanhaiguan Great Wall?
(4) How effective is the trained machine learning model?
(5) Compared to manual identification, how precise is automatic detection?
2 The Great Wall and influential climate factors
2.1 Climate characteristics of Qinhuangdao
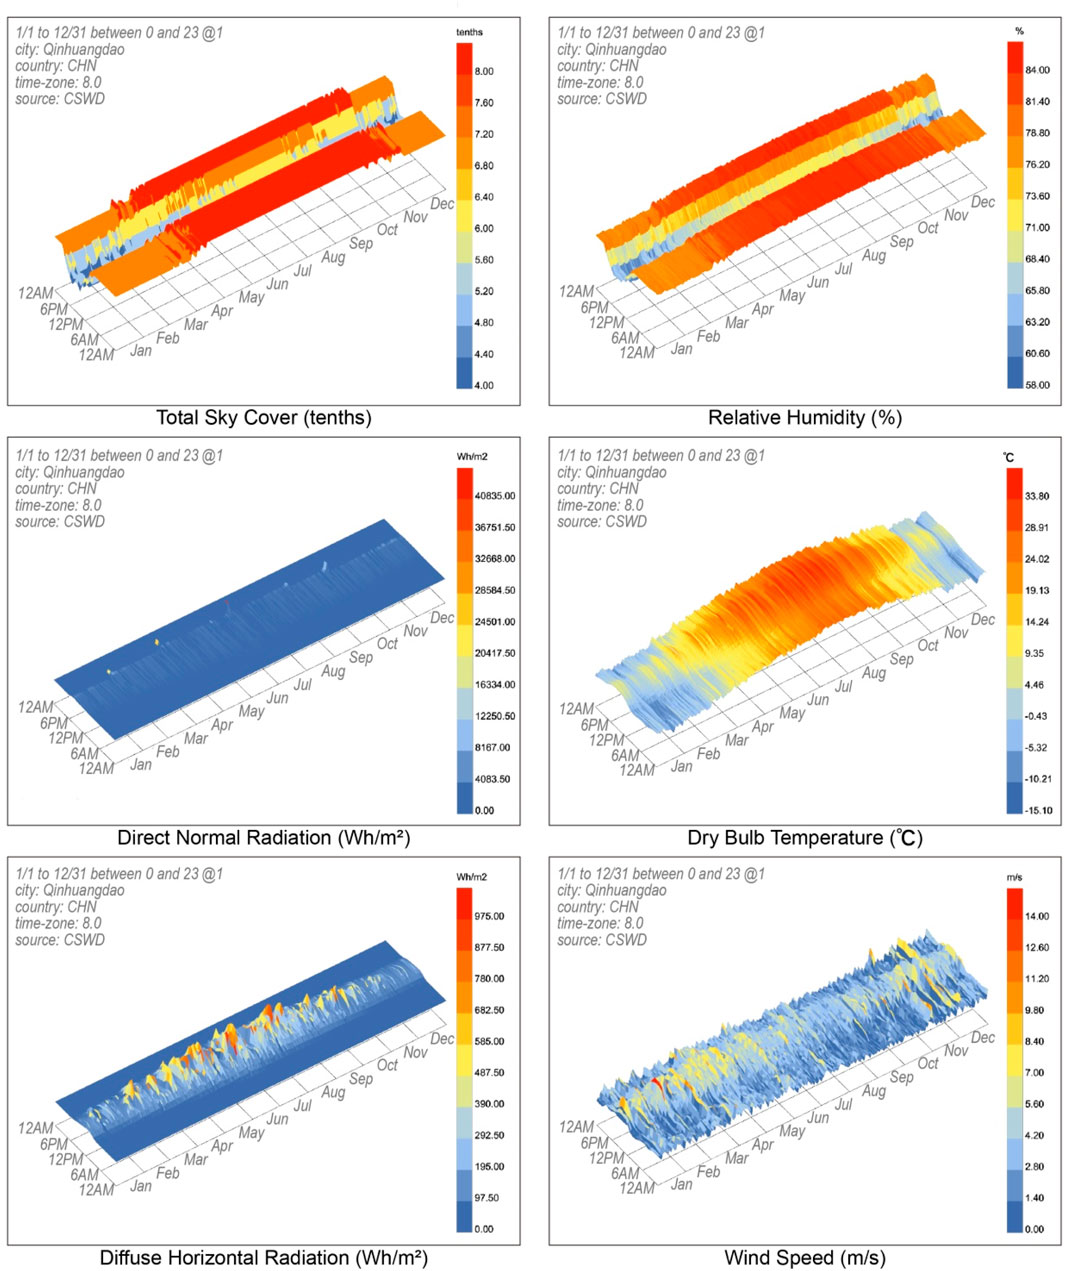
Shanhaiguan is located in northeastern Qinhuangdao City, Hebei Province, bordering Yanshan (a mountain range in Hebei Province, China) to the north and Bohai (an inland sea in Hebei Province, China) to the south. The climate is described in Figure 2. The monsoon-influenced, humid continental climate (Koppen Dwa) of Qinhuangdao features four distinct seasons. January’s average daily temperature of 4.8°C is colder than Beijing’s average daily temperature of 3.7°C. This is because the Siberian high frequently induces northwesterly winds, reducing the influence of the ocean (Weatherspark, 2023). Summers are hot and humid due to the East Asian Monsoon, which frequently produces onshore winds. Summer is also when the coast moderates the weather the most: the average high temperature here in July is 28.1°C (compared to 30.9°C in Beijing). July and August have an average daily temperature of 24.7°C, making them equally warm. The average annual temperature is 11.0°C (51.8°F), and 70% of the annual precipitation falls between June and August (Qinhuangdao-Climate, 2023). The difference in temperature between day and night is significant. In the winter, freeze‒thaw cycles occur. The average annual precipitation is 600–700 mm. It is windy throughout the year, and this is influenced by both land and sea breezes.
2.2 Analysis of the architectural features of the Shanhaiguan Great Wall
Most sections of the Plain Great Wall in Shanhaiguan are in a natural environment surrounded by trees or fields rather than in an urban environment, and there are no buildings surrounding them to shield them, so the effect of climate is more obvious. In ancient China, the construction of the Great Wall was a costly, enormous, and arduous project. Before the Ming Dynasty, the main building materials used to build the Great Wall were loess, sandstone, and wood. During the Ming Dynasty, lime, gray bricks, and tiles were used in large quantities. Before the Ming Dynasty, the materials used were local, and the stones were mined on the mountain. Regular stone materials were also made in nearby quarries, and some quarries not only produced Great Wall stones but also various Great Wall stone components. Once the Ming Dynasty arrived, a large number of gray bricks, blue tiles, and lime stones were used to build the Great Wall, and they were basically fired in nearby kilns. A section of the Shanhaiguan Great Wall is shown in Figure 3. The lower half of the wall was built with more gray bricks. If not considered, subsequent damage will affect the building structure and lead to collapse.
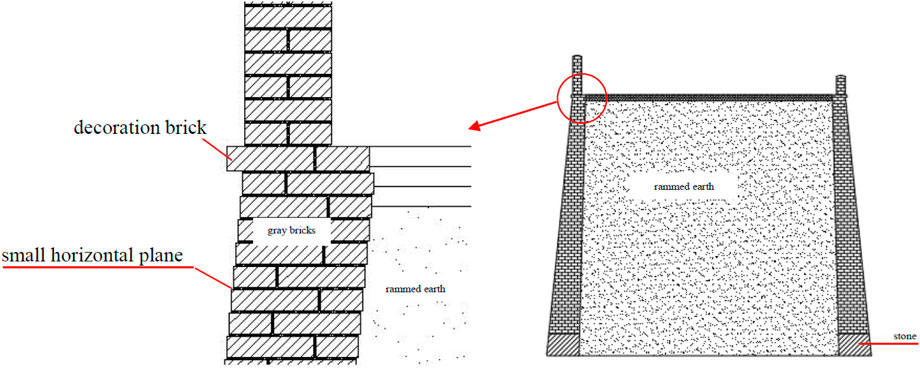
FIGURE 3. Structural schematic of the Plain Great Wall of Shanhaiguan. (Image Source: drawn by the author).
2.3 Damage types and cause analysis of the Shanhaiguan Great Wall
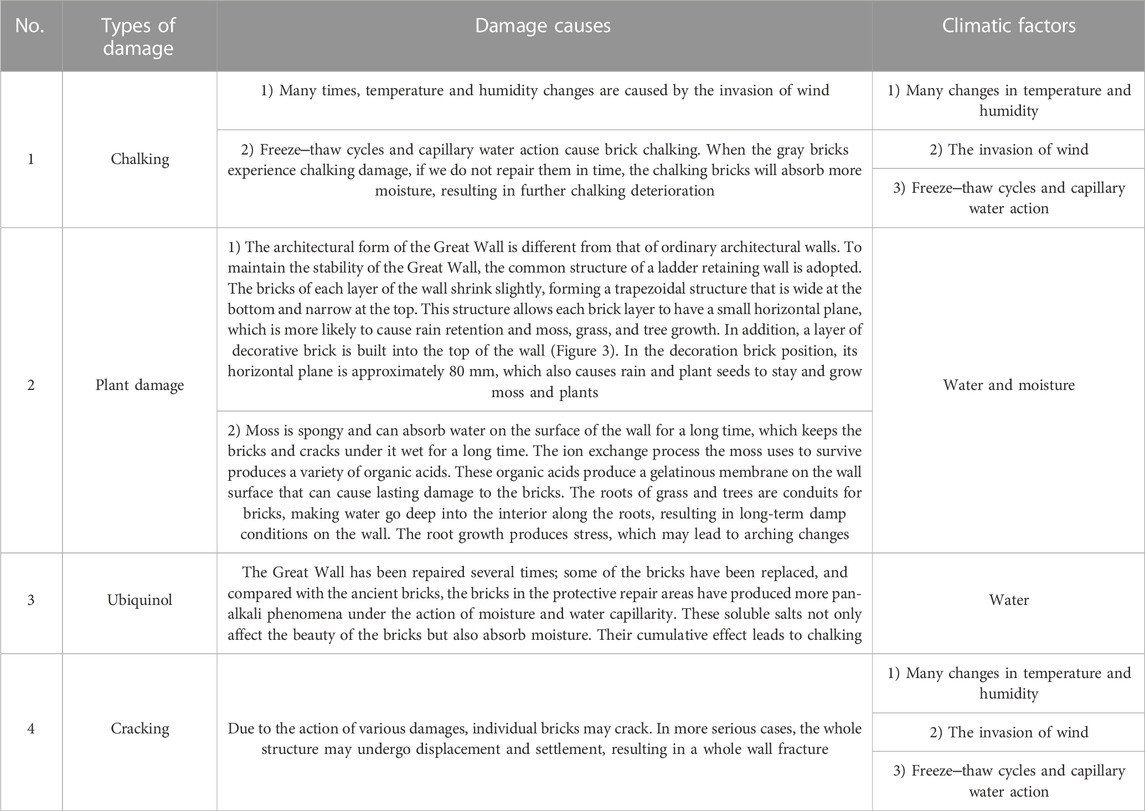
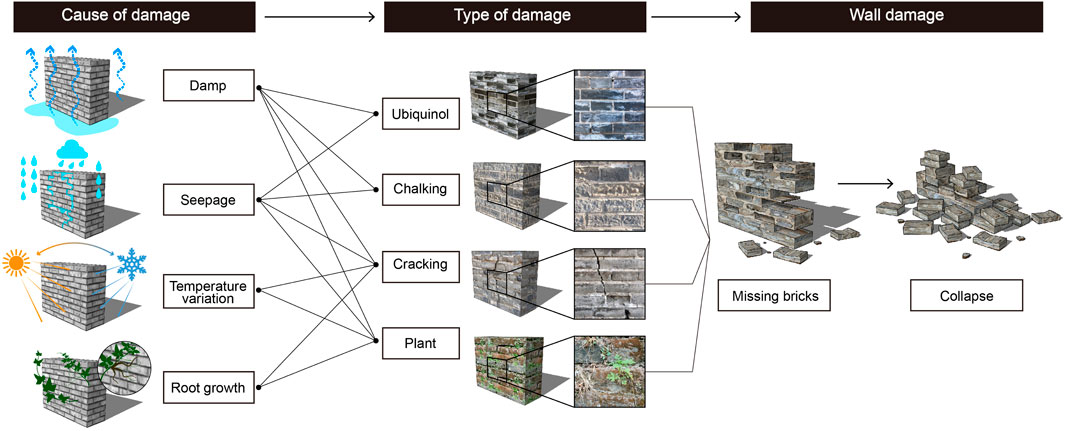
Four common damage types affect the Plain Great Wall in Shanhaiguan. These causes of damage are listed in Table 2, and the interactions between the damage types and climate factors are illustrated in Figure 4. Among the four types of damage, brick ubiquinol generally occurs on bricks with relatively recent ages, while brick chalking is more serious than brick ubiquinol, but it generally occurs on older bricks. Brick chalking causes a brick’s load-carrying capacity to decrease, and when the stress exceeds a brick’s load-carrying capacity, the brick breaks. Eventually, it collapses (Figure 5).
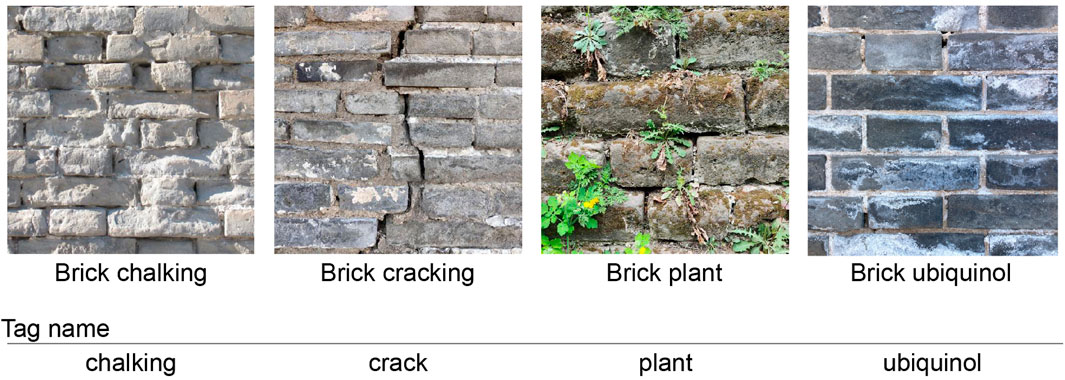
FIGURE 4. Damage types and label names of the gray bricks of the Shanhaiguan Great Wall. (Image Source: the picture was taken by the author, and the text was drawn and added by the author. The shooting date was 24 April 2023).
3 Materials and methods
3.1 Research process
This article aims to discuss the target detection method based on machine learning and use the YOLOv4 model trained in this experiment to identify the surface damage types affecting the Shanhaiguan Great Wall, including chalking, plant growth, ubiquinol, and cracking. This study provides an intelligent detection method and scientific research tools for repair work and material heritage (the machine learning operating environment is depicted in Appendix A). Currently, the type of damage affecting the surface of the Great Wall is detected primarily through manual inspection, but this method is labor-intensive, time-consuming, and affected by subjective error. Therefore, using YOLOv4 for automated damage detection can greatly improve efficiency and reduce errors. In addition, data augmentation techniques are used in the model training of this study, which helps to improve the generalization ability of the model, thus making it more suitable for practical applications. YOLO (You Only Look Once) is a real-time object detection system. Different from traditional target detection methods, YOLO treats target detection as a regression problem and predicts the bounding boxes and categories of all objects in the image at once. YOLOv4 is a version of the YOLO series. It has made many optimizations and improvements based on the original YOLO, improving the accuracy and speed of detection. Its main features are speed, accuracy, and the ability to handle objects of many sizes and shapes. Figure 6 depicts the seven steps of the research methodology: data collection, data unification, data labeling, model training, model testing, results analysis, and model application.
(1) Data collection. At the site of the Shanhaiguan Great Wall, researchers used mobile devices such as digital cameras to obtain high-resolution images of the surface of the Shanhaiguan Great Wall in a multidirectional and multiangle manner. A total of 1,839 photos of the Great Wall’s gray brick materials were collected, providing a rich source of data and necessary information for damage identification.
(2) Data unification. When analyzing and processing the collected photos, the researchers found that the damage faced by the gray bricks on the surface of the Great Wall mainly included of four situations: gray brick chalking, gray brick cracking, plant damage, and gray brick ubiquinol. Among them, the chalking of gray bricks was the main damage type, accounting for more than 80% of all photos. To ensure the effectiveness of the training process, the researchers selected representative images of each damage type for induction and used them as training data for the model. At the same time, to improve the effectiveness of model training, all pictures were uniformly processed into a size of 512 × 512 pixels.
(3) Data labeling. To ensure the accuracy of the training data, a team of cultural relic experts and architectural scholars conducted four rounds of label drawing and checking on 372 photos. The label content included the damage type and the location information of the damage type in the picture. Through this process, the researchers obtained an accurate training dataset, which laid a solid foundation for the subsequent model training procedure.
(4) Model training. The target detection framework (YOLOv4) was used for model training, and the collected photos and manually labeled datasets were used for training. Furthermore, data augmentation techniques such as random scaling, random rotation, random cropping, and random perturbation were adopted to improve the robustness and generalization ability of the model. During the training process, the researchers gradually optimized the parameters and structure of the model. For example, hyperparameters such as different learning rates, numbers of iterations, and batch sizes ensured that the model could accurately identify damage.
(5) Model testing. The researchers tested the trained model by using a variety of methods, including calculating the loss value index of the model and comparing the pictures of the detection results, as well as testing and debugging 200 trained models. The model with the best detection effect was selected as the model for practical application. Through the test, the researchers determined the performance indicators of the model and visualized the results.
(6) Results analysis. Results analysis provides an in-depth exploration of model test results, aiming to evaluate the accuracy and reliability of the model and explore its possible errors and deficiencies to improve and optimize the model. At the same time, the type and number of possible errors are checked, such as false detections and missed detections. In addition to the quantitative indicator comparison, the results analysis also needed to be combined with the actual application scenario and comprehensively consider factors such as the effect, speed, and stability of the model to find the optimal model solution.
(7) Model application. The trained model was applied to an actual damage recognition task, and the performance and characteristics of the model were analyzed to provide technical support for Great Wall repairs. When applying the model, the researchers first deployed and optimized it to ensure that it could quickly and accurately process the damage data derived from the gray bricks on the surface of the Great Wall. The researchers then captured a set of high-resolution images of the Great Wall’s outer walls via cell phones and used the model to identify the damage in the data.
Through the above method, the researchers established a research process for identifying the damage types on the surface of the Great Wall based on machine learning, which can automatically detect and identify the damage types on the surface of the Great Wall. It provides an efficient, accurate, and reliable technical means for repairing the Great Wall and has important practical value.
3.2 Sample processing
To train a machine learning model, data needed to be collected and processed. In this study, the researchers photographed and recorded the surface materials of the Shanhaiguan Great Wall. A total of 1,839 photos of the gray bricks were collected (Figure 7), covering the outer walls of the bottom floor and the top platform of the Great Wall; the positions of the gray bricks of the Great Wall were covered to the greatest extent possible. All photographs were manually reviewed to select photographs that were representative of the target damage types, and similar photographs were rejected. In the end, a total of 361 photos were used as material samples for machine learning, including 107 photos of gray brick chalking, 47 photos of gray brick cracking, 100 photos of plant damage, and 107 photos of gray brick ubiquinol.
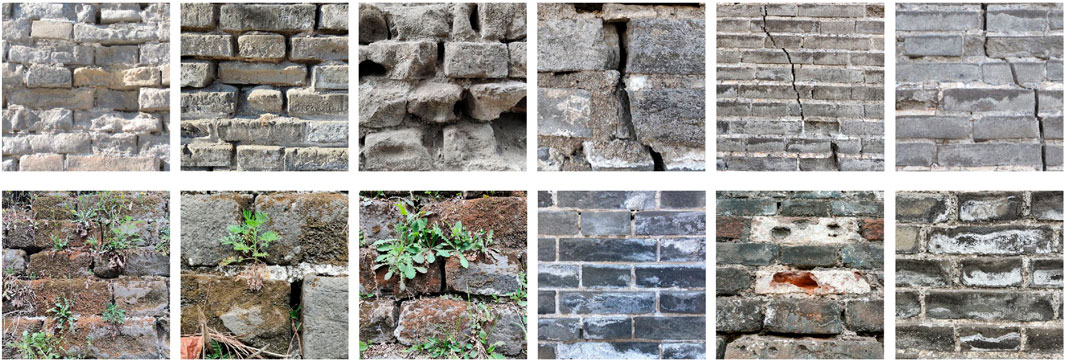
FIGURE 7. Photos of gray bricks possessed by the Shanhaiguan Great Wall. (Image Source: photographed by the author).
To improve the efficiency of the machine learning training process and standardize the materials, the researchers processed all photos and unified their dimensions to 512 × 512 pixels. Finally, the researchers labeled the 361 photos individually to identify the types of damage faced by the gray bricks. Once complete, another group of researchers reviewed and outputted the corresponding photo files and label files. These label files are used as input data for machine learning model training so that the model can learn the damage types affecting gray bricks and perform accurate damage identification in the next step: practical application.
3.3 Model training
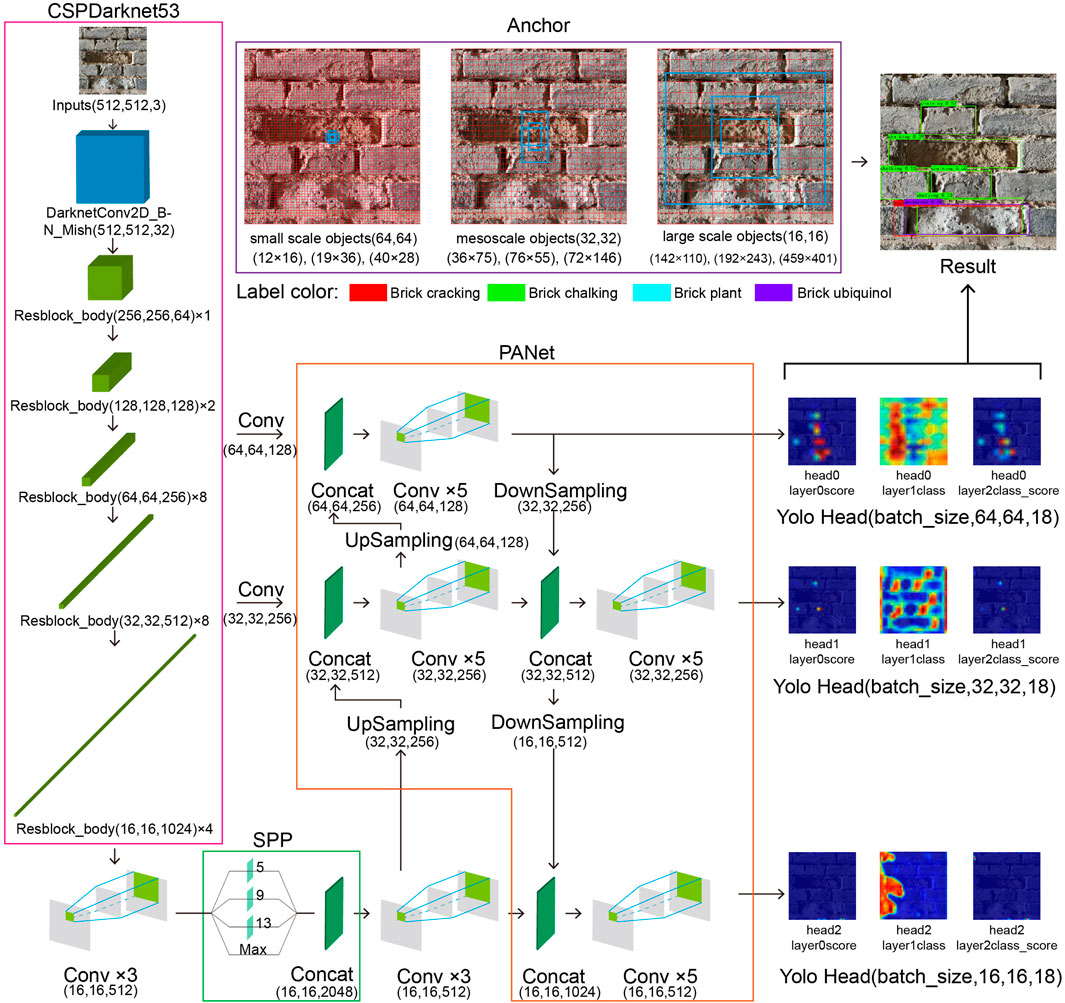
In this study, the researchers use the YOLOv4 target detection model as the training model. YOLOv4 is a target detection framework based on deep learning (Bochkovskiy et al., 2020), and its network structure has the following three characteristics (Figure 8). The main structure of the model includes a backbone network, a feature pyramid network, and a detection head. The backbone network adopts the CSPDarknet53 structure and uses residual blocks and cross-layer connections to improve its feature extraction effect and the expression ability of the network (Yuan and Xu, 2021). The feature pyramid network adopts the PANet structure and fuses feature maps with different scales to improve the accuracy and stability of target detection. The detection head includes multiple convolutional layers and pooling layers, which are used to generate a detection frame and predict the category and confidence of the target (Yu et al., 2017). In addition, YOLOv4 uses a series of techniques, such as data enhancement, multiscale training, and category weight adjustment, to further improve the performance of the model. In terms of evaluation, YOLOv4 uses indicators such as the mean average precision (mAP) and frames per second (FPS).
To make the model more accurate, the researchers employ data augmentation techniques, including random scaling, random rotation, random cropping, and random perturbation. The specific functions are as follows.
(1) Random scaling: During the model training process, the training image is randomly scaled to simulate object size changes in actual scenes.
(2) Random rotation: During the model training process, the training image is randomly rotated to enhance the model’s ability to recognize objects at different angles.
(3) Random cropping: During the model training process, the training image is randomly cropped to simulate the appearance of objects in different positions in actual scenes.
(4) Random perturbation: During the model training process, the pixel value of the training image is randomly perturbed to enhance the model’s resistance to image noise and interference.
These techniques augment the dataset and mitigate model overfitting on the data. During the training process, the researchers gradually optimize the model parameters and structure. For example, structures such as multilayer convolution, pooling layers, and fully connected layers, as well as techniques such as learning rate adjustment and batch normalization, are used to ensure that the model can accurately identify damage. Finally, after several rounds of iterative training, the researchers obtain a series of models with different iteration cycles. In the next research step, these models are tested to select a damage detection model for Great Wall bricks with high accuracy.
In addition, when the machine is trained for the first time, since it has no prior knowledge related to the recognition of Great Wall gray bricks, no relevant weight file is available. Therefore, this study adopts the method of transfer learning, using the pretrained weights of the VOC dataset to initialize the parameters of the backbone feature extraction network used by the model. The entire model is trained for a total of 200 epochs, with the Adam optimizer used to calculate the gradients and update the parameters. Given the limited amount of data in the training set, the batch size is set to 2. Training is frozen with a learning rate of 0.001 for the first 10 iterations to speed up the convergence of the model and avoid corrupting the pretrained weights. Subsequently, in the next 190 iterations, the learning rate is set to 0.0001, the backbone feature extraction network is unfrozen, and the entire model is further trained with a smaller initial learning rate to speed up the training time of the entire network.
4 Discussion: automatically identifying and analyzing the results
4.1 Model testing
In the model testing phase of this study, to comprehensively evaluate the performance of the model, the researchers use two different testing methods. First, the loss value of the model is calculated on the test set, which can help the researchers understand the performance achieved by the model on the testing dataset and optimize the model. Second, the researchers compare and analyze the pictures of the detection results produced by the model so that the detection effect of the model can be intuitively observed, and the accuracy and reliability of the model can be verified. Through the comprehensive analysis performed with these two methods, the researchers can comprehensively evaluate the performance of the model and provide guidance for further optimization and improvement.
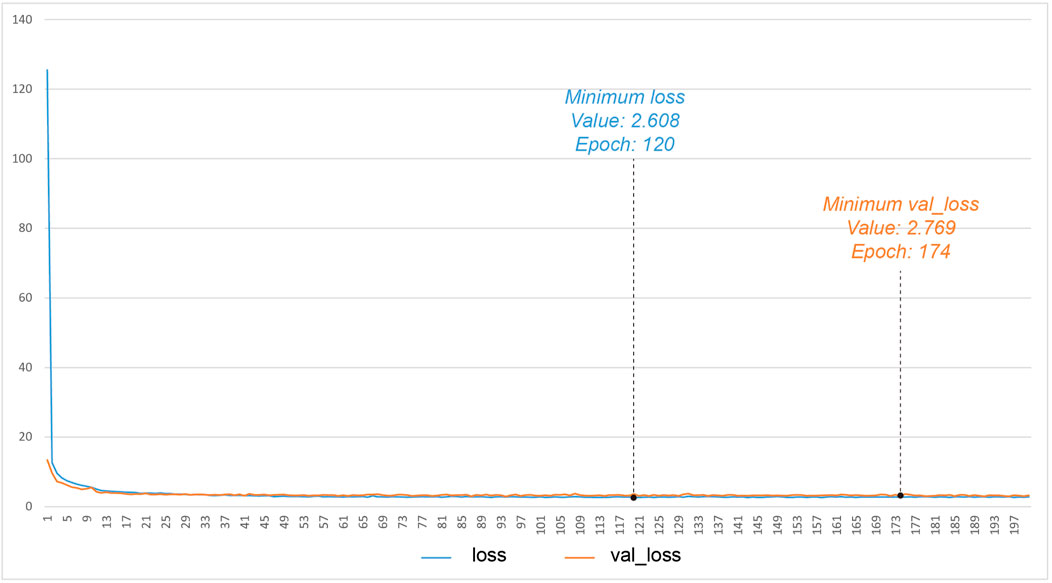
(1) The loss value of the model is calculated on the test set. During the model training process, a corresponding weight file is generated for each iteration cycle, and these weight files use two indicators, the loss and val_loss, to evaluate the training performance of the model. “Loss” represents the loss function value calculated on the training set and signifies the error induced by the current model on the training set, that is, the gap between the predicted value and the real value when the model is learning the training data. By continuously optimizing the model parameters, the loss value can be continuously reduced, thereby improving the fitting ability of the model on the training set. val_loss represents the loss function value calculated on the validation set, indicating the error of the current model on the validation set, that is, the performance achieved by the model when predicting unknown data. Usually, with the continuous optimization of the model, the loss value and val_loss value gradually decrease. The loss and val_loss values can help the researchers understand the training effect and generalization ability of the model so that it can be further adjusted and improved (Guan et al., 2022). During the first training epoch, the loss value is greater than the val_loss value (loss value = 125.538, val_loss = 13,473) (Figure 9). After dozens of iteration generations, the values of the two metrics decrease precipitously to less than 4, eventually stabilizing at approximately 3. At the 200th epoch, the loss and val_loss values are 2.783 and 3.239, respectively. When the loss and val_loss values reach approximately 3, the model training process reaches its bottleneck, and no further decline is observed. Therefore, the researchers choose the weight files of the 120th, 174th, and 200th epochs for additional testing.
(2) The test results of the model are compared and analyzed with pictures. To evaluate the performance of the tested models and identify the best model, a picture comparison analysis is performed in this study. Specifically, the researchers use the above three weight files with different parameters to control the outputs of the models. To increase the randomness of the samples, the researchers randomly select six samples from the 361 training set samples as test samples and name them A–F. Subsequently, the researchers load different weight files into the models, output the detection results, and conduct a comparative analysis.
Under the same confidence level (0.5), the detection performances yielded by the three models with different training parameters are different (Figure 10). First, the Max Epoch model has omissions in its detection results for sample D (D2), failing to detect any damage type in sample D. Second, the Min Loss and Min Val_loss models present the same detection results for samples D, E, and F. However, for sample A, the MinVal_loss model can detect more brick damage types. Based on a comprehensive observation, the Min Val_loss model has the best detection effect among all the models; no missing results occur, and more types of brick damage can be detected. Therefore, when selecting a model, MinVal_loss should be preferred as the training parameter settings to obtain better detection results.
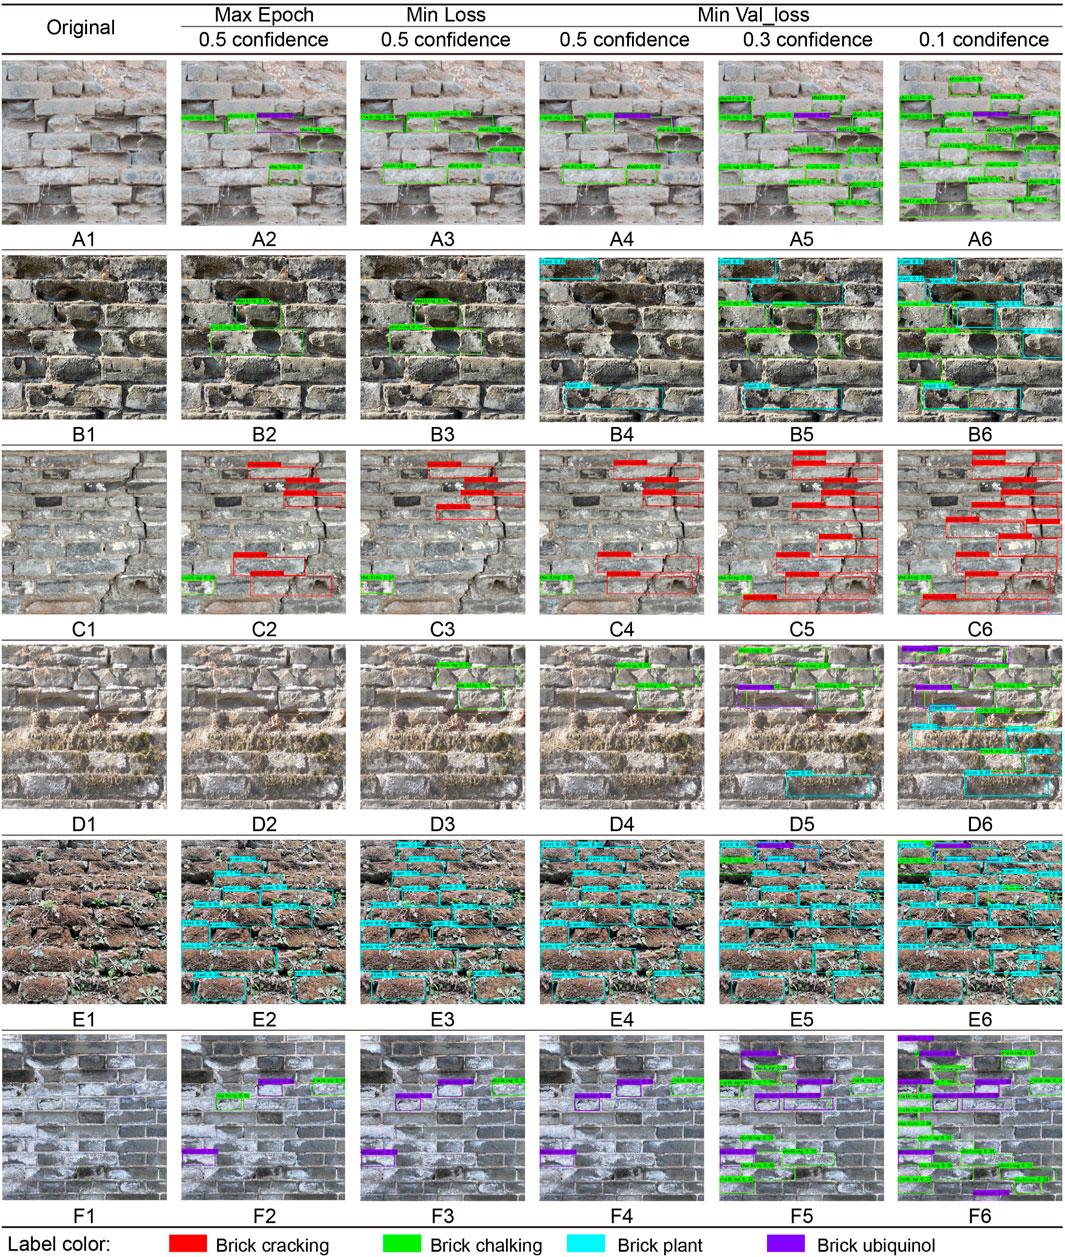
FIGURE 10. The outcomes of various weight file tests. The test samples are selected at random from the 361 training set samples (labeled A to F), and different weight files are loaded into the model to generate the results. (Image Source: drawn by the author).
Overall, the effect of the Min Val_loss model is best, but its detection results are not sufficient for covering all the damaged bricks in the picture, so the confidence parameters need to be further adjusted. In the target detection model, confidence is used to judge the credibility of the obtained target detection results. Usually, the model provides a probability value for the existence of an object and bounding box position information. A lower confidence level can increase the detection sensitivity of the model but may lead to false detections, while a higher confidence level can reduce the false detection rate but may decrease the detection sensitivity of the model. In Figure 10, since the usual confidence level (0.5) cannot capture all the damaged bricks in the picture, the confidence level is reasonably adjusted by gradually reducing it (0.3 and 0.1) and performing picture tests. In the experiment, through multiple tests involving different confidence and weight files, it is found that when the confidence is 0.1, the weight file of Min Loss can reduce the false detection rate and missed detection rate while ensuring high detection sensitivity. As a result, the weight file of Min Loss is ultimately chosen, and a confidence level of 0.1 is set as the model and testing parameters for subsequent analysis purposes. Thus, all damaged bricks in the image can be detected with greater precision, and the risks of false detections and missed detections are reduced.
To gain a deeper understanding of the model’s internal working principles, the model’s head and layer are converted into images (feature maps) so that model parameters can be observed more clearly, and the detection accuracy can be tested (Figure 11). In the YOLOv4 model, “head” refers to the combination of positioning and classifier mechanisms, whereas “layer” refers to the convolutional layer stack and other computing layers.
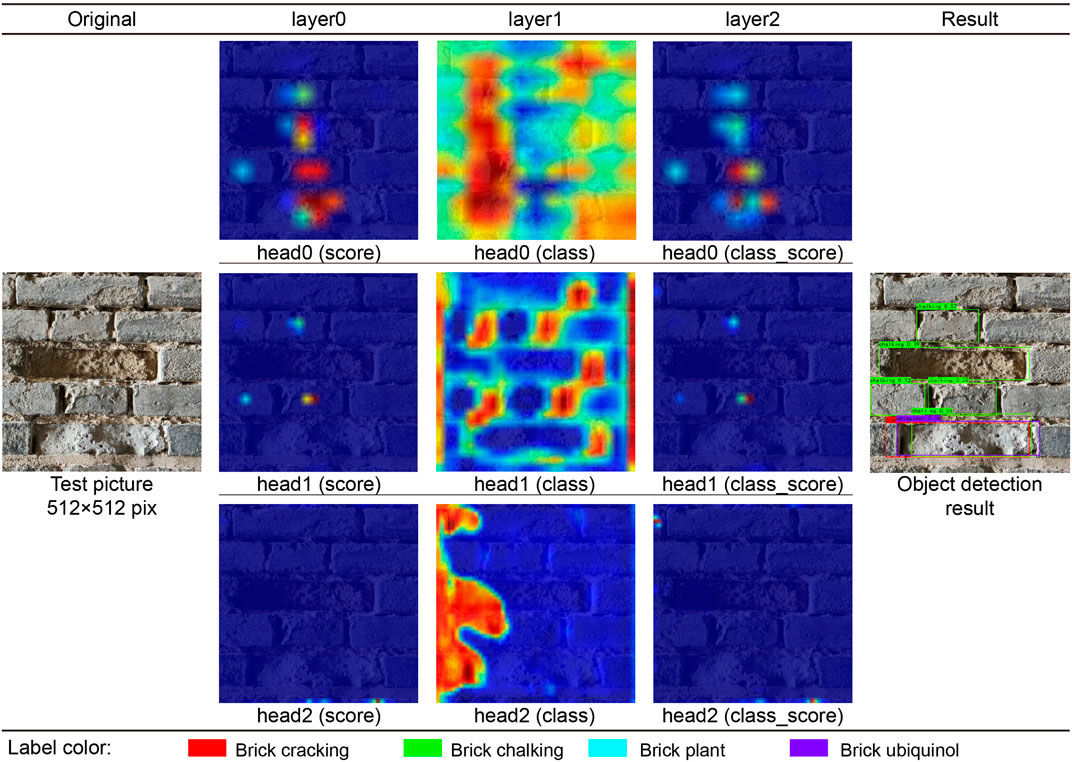
FIGURE 11. The effect of the layer’s feature extraction process on the detection obtained for the test image. (Image Source: drawn by the author).
The specific explanation is as follows.
(1) Output heads: This consists of Head 0, Head 1, and Head 2. Each head is responsible for detecting objects with different scales, and by combining the results of these output heads, an object detection result can be obtained for the entire picture. Among them, Head 0 processes the largest feature map, so it does not perform well in terms of detecting small objects, but it performs better with regard to detecting large objects. Head 2 deals with the smallest feature map, so it does a better job of detecting small objects but is less effective for large objects. Head 1 addresses the feature map with an intermediate scale, and its detection effect is between those of Head 0 and Head 2.
(2) Each head contains score, class, and class_score layers. Among them, the score layer is responsible for predicting the confidence of the bounding box. It indicates the probability of the existence of the target object, and the higher its value is, the greater the possibility of the existence of the object. The class layer is responsible for predicting the category of each bounding box. It outputs a vector containing the predicted classes, the length of which is equal to the number of classes; the class_score layer, which is responsible for predicting class scores, represents the likelihood that the bounding box belongs to each class. It represents the confidence that each bounding box belongs to each class.
(3) The indicators combined by the heads and layers can be used to evaluate the target detection accuracy of the model, and at the same time, they can be used to observe the working principles and internal calculation process of the model. For example, by analyzing the classification accuracies and confidence scores produced for different types of objects, the detection effects yielded by the model for specific types of objects and the optimization direction of the model parameters can be determined (Jiang and Wang, 2020). In addition, by observing the detection results produced at different levels, it is also possible to judge the performance, pros and cons of the model at different detection levels and then adjust and optimize the model parameters.
The following can be found in this research (Figure 11).
1) Layer 0 can capture the probability of the specific location of the damaged Great Wall bricks in the picture.
2) Layer 1 is responsible for judging the number of damage categories experienced by the Great Wall bricks in the picture.
3) Layer 2 predicts the probabilities of different damage categories for the Great Wall bricks in the picture according to the results of Layer 0 and Layer 1.
4) The final detector draws an anchor box according to the result of Layer 2; that is, the bounding box containing the coordinates, width, height, and color of the center point.
Through the above process, the researchers can observe some characteristics of the test samples and models. 1) Different colors in the feature map represent the importance or activation of different regions. Green or blue areas indicate areas with low weight values, while red or yellow areas indicate areas with high weight values. A heatmap composed of these colors can indicate how much the detection model pays attention to object detection or how much it responds to a particular object. 2) The reaction of Head 0 is most intense because the scale of the Great Wall gray bricks in the picture is larger, and it is more suitable to use a shallower layer for detection. Head 2 has almost no response because the scale of the Shanhaiguan Great Wall bricks in the picture exceeds the range that Head 2 can detect. 3) The reaction of Layer 1 is most intense because this layer is responsible for extracting the category information of the damaged bricks, and the category information of the damaged bricks has a greater impact on the detection results. The responses of Layer 0 and Layer 2 are similar and moderate because they are responsible for detecting the position information of the brick damage, and the impact of the position information on the detection results is relatively balanced.
4.2 Model application
Photos of the Shanhaiguan Great Wall are taken as materials for a model application experiment. Without any postprocessing, the sizes of these images are 6,000 × 4,000 pixels. In addition, the newly captured images are affected by factors such as the shooting angle offset of the handheld camera, light and shadows, which can be used to determine whether the failure to detect wall bricks is due to a photo’s scale, angle, light, or shadow in general practical applications. Figure 12 depicts the effect of the layer’s feature extraction procedure on the detection results obtained for one of the aforementioned photographs.
(1) The model supports the detection of multiple photoscale ranges. Compared to the images in the training set, the variety of the field photographs of Shanhaiguan Great Wall bricks is greater, as is the wall brick recognition area. The model is compatible with a broader range of images, the detection process is unaffected, and a recognition effect comparable to the test result can be achieved.
(2) The shooting angle is unimportant to the model. The application photos taken on-site have certain upward viewing angles, but this does not affect the recognition of the detection content.
(3) The model can exclude the influences of light and shadows in the input photo during the detection process. Many light and shadow occlusions are contained in the photos of the Shanhaiguan Great Wall bricks. The feature extraction process of the layers is not affected during the detection process, and the recognition results are not affected in the final detection step.
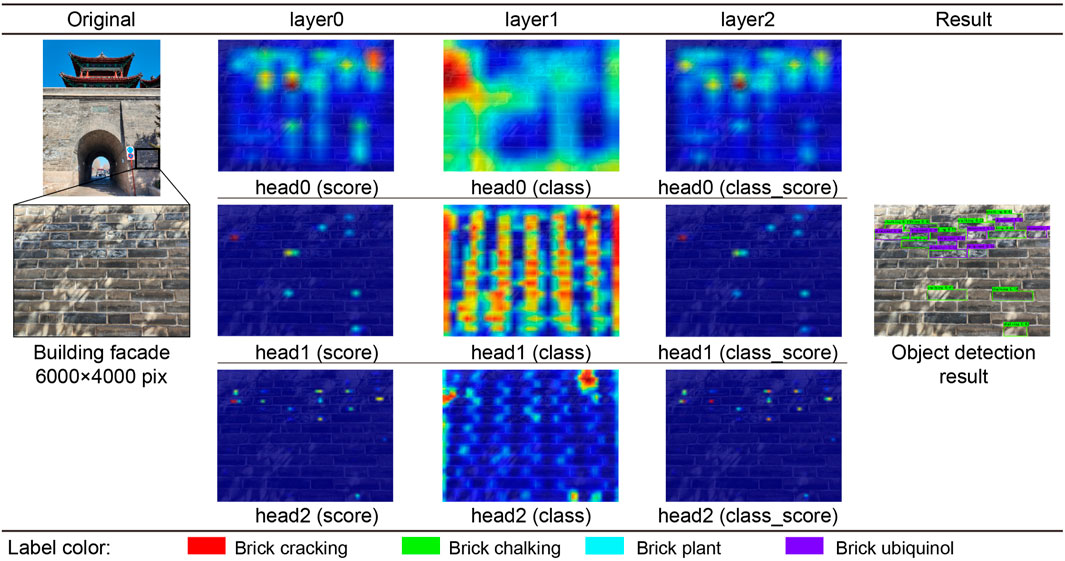
FIGURE 12. The effect of the layer feature extraction process on on-site photo detection. (Image Source: drawn by the author).
From the pictures taken at different positions of the Shanhaiguan Great Wall and the detection results, the overall model detection effect is improved (Figure 13). Most of the wall damage conditions can be identified, but certain errors are observed in special cases.
(1) When there is more ubiquinol in the gray brick body, the model misses it. The gray brick body in the lower right corner of Project 1 has localized ubiquinol that is not identified.
(2) When ubiquinol and chalking appear at the same time, the model cannot accurately distinguish the difference between them. In the central area of Project 2, the model only recognizes chalking due to the damage caused by ubiquinol and the chalking on the whole brick wall.
(3) A small number of misjudgments occur. Although the model incorrectly perceives the brick on the left side of Project 3 as cracked, it is not cracked.
(4) When plants cover the bricks, the joints of the bricks become blurred, and individual bricks are not recognized. Many plants are located on the left side of Item 4, and the bricks are connected into one piece, which increases the difficulty of model detection, resulting in unrecognized parts of some bricks with plants.
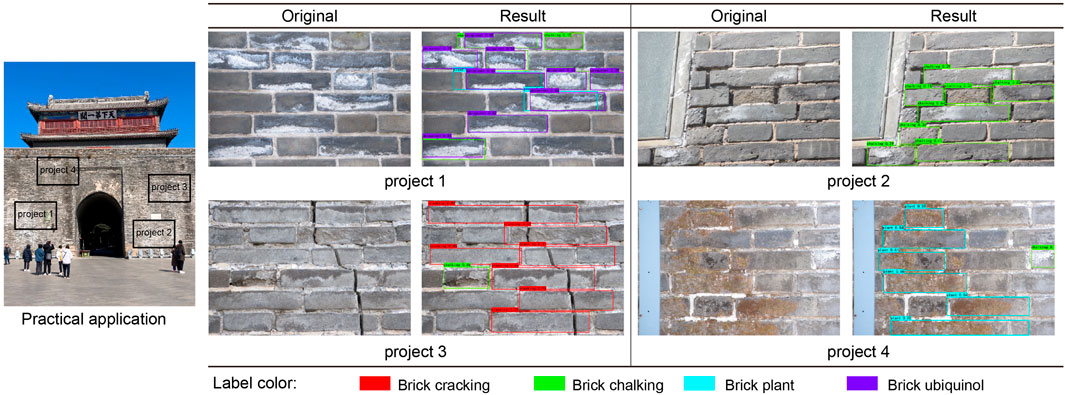
FIGURE 13. The detection effects produced for various photographs of construction sites. (Image Source: drawn by the author).
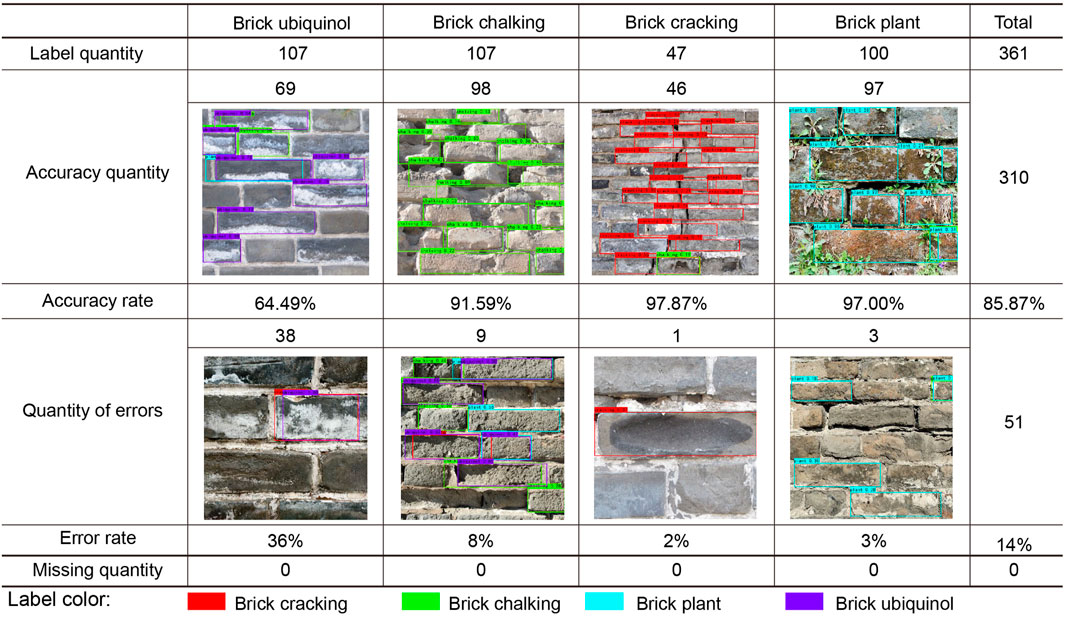
To further illustrate the accuracy of the model in this application, the researchers calculate statistics concerning the accuracy rates of the samples in this study (Figure 14). There are 107 ubiquinol samples among the 361 total samples, and the model correctly identifies 69 of them, yielding a 64.49% identification accuracy rate. The data contain 107 chalking samples, and the model accurately identifies 98 of them, yielding a 91.59% identification accuracy rate. The dataset includes 47 cracking samples, 46 of which the model correctly identifies, and the identification accuracy rate is 97.87%. The model accurately identifies 97 of the 100 plant samples, yielding a 97.00% identification accuracy rate. None of the samples are detected or missed. The overall accuracy rate basically meets the imposed detection expectations; the accuracy rates produced for chalking, plant, and cracking are relatively high; and the accuracy rate of ubiquinol needs to be improved. For example, misjudgments make it difficult to distinguish between chalking and ubiquinol. When the gray brick surface is sunken, cracking features are misidentified. When the color of the gray brick body is similar to that of plants, plant features are misidentified.
As mentioned above, judging from the results of the overall model application, the research model has the ability to detect the types of gray brick damage faced by the Shanhaiguan Great Wall, but its detection accuracy, type recognition, and accuracy need to be improved. Although the model cannot completely replace the manual detection depth of professional researchers, it yields improved detection efficiency and can be used as an auxiliary mechanism for projects such as the inspection and restoration of the Shanhaiguan Great Wall. In addition, although this study only examines the gray bricks of Shanhaiguan, it can still be used for reference and expanded application in research involving similar brick wall structures or military defense-based architectural heritage objects.
4.3 Main limitations and wider applicability
Although the proposed method can rapidly process the numerous photos taken by UAVs and save much manpower, due to its lower accuracy than that of the R-CNN series, experts must still check the unidentified pictures. Due to the artificial data labeling procedure, the initial workload is not small. Even so, because the method used in this paper can combine UAV photos and machine learning, it offers an object detection methods, especially for parts that are difficult to reach, such as damage on the tall facades of modern concrete buildings, not just for heritage objects.
Affected by the limitations of the YOLO model algorithm, the developed method does not distinguish brick ubiquinol well, with an accuracy of 64.49%. The reason for this may be that ubiquinol boundaries are more unclear and that their color is similar to that of the ash in the cracks in the brick wall. The colors of the other three types of damage are different from those of the bricks, and these damage types are detected well (the corresponding accuracies are all above 90%). This means that the model cannot perform well in terms of material distinction but can perform well in color detection. To improve the detection effect of the model, further research in the future must continue to optimize the model, increase the amount of training data or utilize another model structure, such as the SSD method. In general, this study shows how machine learning can be used to find damage in heritage brick walls.
5 Conclusion
Qinhuangdao has a humid continental climate, hot and humid in the summer and freeze‒thaw cycles in the winter, which can easily lead to aging and damage in city walls and bricks. The Shanhaiguan Great Wall is located in northeastern Qinhuangdao City, Hebei Province. It is located in a typical climate-affected area. The wall is often eroded by environmental factors such as long-term wind and rain and inorganic salts. Therefore, regular monitoring and maintenance measures are required for the Shanhaiguan Great Wall. Nevertheless, the Shanhaiguan Great Wall has a large area and a large number of brick walls, making the manual detection of individual damaged contents a laborious task. Therefore, this paper proposes a machine learning-based method for the automatic monitoring of wall brick damage types. The method detects four types of damage suffered by the Shanhaiguan Great Wall based on the YOLOv4 target detection framework: chalking, plant damage, ubiquinol, and cracking. In this study, a total of 1839 on-site photographs are used to train the model for 200 epochs, after which three different weight files are tested, yielding a good detection effect in practical applications. This method can monitor a large number of wall samples in a short period of time and detect ancient brick walls more efficiently than the manual detection technique. The significance of this study is primarily reflected in three aspects.
(1) This non-destructive testing method allows for a better understanding of the actual conditions of historic buildings. It can help the government and historical protection departments more accurately understand the actual statuses of World Heritage military defense buildings.
(2) The model can improve the efficiency of building damage monitoring. Without destroying the appearance of historical building structures, the damaged parts can be quickly identified, and repair measures can be taken in time.
(3) The proposed approach can assist researchers in their research. The information obtained from monitoring can better assist researchers and provide an important basis for conducting research on historically protected buildings. According to the monitoring results, different types of repair programs are proposed.
The researchers in this study collects much data concerning the Shanhaiguan Great Wall in Qinhuangdao. Through the training, testing, and application of the model, it is proven that the proposed method is effective for the monitoring the damage experienced by gray bricks. Compared with previous related research, the discrimination and recognition readiness rates achieved for recognition types are improved. The identifiable types are increased to include chalking and ubiquinol, and the accuracy rate of the model increases by 0.17% (from 85.70% before to 85.87% now). Additionally, the following three aspects of the model’s detection process need to be improved.
(1) Improve its recognition accuracy: It is necessary to increase the amount of training data and label more representative training data so that the model can more accurately identify the types of objects.
(2) Perform parameter adjustment: The parameters of the model should be adjusted to increase the recognition performance of the model, such as parameter adjustments in the learning rate and the activation function.
(3) Enhance the generalization ability of the model: Data enhancement techniques, such as scaling and rotation, should be used to increase the recognition accuracy of the model.
Data availability statement
The datasets presented in this study can be found in online repositories. The names of the repository/repositories and accession number(s) can be found in the article/Supplementary Material.
Author contributions
Conceptualization, QL, LZ, and YC; methodology, QL, LZ, and LY; software, LZ and LY; validation, LZ and LY; formal analysis, YC and LZ; investigation, LZ and YC; resources, QL, YL, and JZ; data curation, YC; writing—original draft preparation, QL, LZ, and YC; writing—review and editing, QL, LZ, and YC; visualization, QL and LZ; supervision, LZ and YC; project administration, QL; funding acquisition, QL. All authors contributed to the article and approved the submitted version.
Conflict of interest
The authors declare that the research was conducted in the absence of any commercial or financial relationships that could be construed as a potential conflict of interest.
Publisher’s note
All claims expressed in this article are solely those of the authors and do not necessarily represent those of their affiliated organizations, or those of the publisher, the editors and the reviewers. Any product that may be evaluated in this article, or claim that may be made by its manufacturer, is not guaranteed or endorsed by the publisher.
References
Azarafza, M., Ghazifard, A., Akgün, H., and Asghari-Kaljahi, E. (2019). Development of a 2D and 3D computational algorithm for discontinuity structural geometry identification by artificial intelligence based on image processing techniques. Bull. Eng. Geol. Environ. 78, 3371–3383. doi:10.1007/s10064-018-1298-2
Bochkovskiy, A., Wang, C. Y., and Liao, H. Y. M. (2020). Yolov4: optimal speed and accuracy of object detection. arXiv preprint arXiv:2004.10934.
Dolecek, G. J., and Cho, N. (2022). Advances in image processing using machine learning techniques. IET Signal Process 16, 615–618. doi:10.1049/sil2.12146
Felzenszwalb, P. F., Girshick, R. B., McAllester, D., and Ramanan, D. (2009). Object detection with discriminatively trained part-based models. IEEE Trans. pattern analysis Mach. Intell. 32 (9), 1627–1645. doi:10.1109/TPAMI.2009.167
Flores-Colen, I., Manuel Caliço Lopes de Brito, J., and Peixoto de Freitas, V. (2011). On-site performance assessment of rendering façades for predictive maintenance. Struct. Surv. 29 (2), 133–146. doi:10.1108/02630801111132812
Foti, D. (2015). Non-destructive techniques and monitoring for the evolutive damage detection of an ancient masonry structure. Trans. Tech. Publ. Ltd. 628, 168–177. doi:10.4028/www.scientific.net/KEM.628.168
Galantucci, R. A., and Fatiguso, F. (2019). Advanced damage detection techniques in historical buildings using digital photogrammetry and 3D surface anlysis. J. Cult. Herit. 36, 51–62. doi:10.1016/j.culher.2018.09.014
Girshick, R., Donahue, J., Darrell, T., and Malik, J. (2014). “Rich feature hierarchies for accurate object detection and semantic segmentation,” in Proceedings of the IEEE conference on computer vision and pattern recognition, San Juan, PR, USA, 17-19 June 1997 (IEEE), 580–587. doi:10.1109/CVPR.2014.81
Guan, Z., Hou, C., Zhou, S., and Guo, Z. (2022). Research on underwater target recognition technology based on neural network. Wirel. Commun. Mob. Comput. 2022, 1–12. doi:10.1155/2022/4197178
Han, W., Pei, S., and Liu, F. (2022). Material characterization of the brick in the ming dynasty heritage wall of pianguan county: A case study. Case Stud. Constr. Mater. 16, e00940. doi:10.1016/j.cscm.2022.e00940
Hoła, A., and Czarnecki, S. (2023). Random forest algorithm and support vector machine for nondestructive assessment of mass moisture content of brick walls in historic buildings. Automation Constr. 149, 104793. doi:10.1016/j.autcon.2023.104793
Hoła, A. (2023). Verification of non-destructive assessment of moisture content of historical brick walls using random forest algorithm. Appl. Sci. 13 (10), 6006. doi:10.3390/app13106006
Hulimka, J., Kałuża, M., and Kubica, J. (2019). Failure and overhaul of a historic brick tower. Eng. Fail. Anal. 102, 46–59. doi:10.1016/j.engfailanal.2019.04.011
Jiang, Z., and Wang, R. (2020). “Underwater object detection based on improved single shot multibox detector,” in 2020 3rd International Con-ference on Algorithms, Computing and Artificial Intelligence, Dalian, China, 23-25 September 2022 (IEEE), 1–7. doi:10.1145/3446132.3446170
Karadag, I. (2023). Machine learning for conservation of architectural heritage. Open House Int. 48 (1), 23–37. doi:10.1108/OHI-05-2022-0124
Liu, W., Anguelov, D., Erhan, D., Szegedy, C., Reed, S., Fu, C. Y., et al. (2016). “Ssd: single shot multibox detector,” in Computer vision–ECCV 2016: 14th European conference (Amsterdam, Netherlands: Springer International Publishing), 21–37. doi:10.1007/978-3-319-46448-0_2
Mishra, M., Barman, T., and Ramana, G. V. (2022). Two phase algorithm for bi-objective relief distribution location problem. J. Civ. Struct. Health Monit. 2022, 1–37. doi:10.1007/s10479-022-04751-y
Qinhuangdao (2023). Hebei—promoting the protection of the ancient great wall in new ways. Available online: http://paper.people.com.cn/rmrb/html/2023-02/14/nw.D110000renmrb_20230214_3-04.htm (Accessed on April 27, 2023).
Qinhuangdao-Climate (2023). Climate and monthly weather forecast Qinhuangdao, China. Available online: https://www.weather-atlas.com/en/china/qinhuangdao-climate (Accessed on April 27, 2023).
Redmon, J., Divvala, S., Girshick, R., and Farhadi, A. (2016). “You only look once: unified, real-time object detection,” in Proceedings of the IEEE conference on computer vision and pattern recognition (New York: IEEE), 779–788. doi:10.1109/CVPR.2016.91
Samhouri, M., Al-Arabiat, L., and Al-Atrash, F. (2022). Prediction and measurement of damage to architectural heritages facades using convolutional neural networks. Neural Comput. Appl. 34 (20), 18125–18141. doi:10.1007/s00521-022-07461-5
Sestras, P., Roșca, S., Bilașco, Ș., Naș, S., Buru, S. M., Kovacs, L., et al. (2020). Feasibility assessments using unmanned aerial vehicle technology in heritage buildings: rehabilitation-restoration, spatial analysis and tourism potential analysis. Sensors 20 (7), 2054. doi:10.3390/s20072054
Sowden, A. M. (1990). The maintenance of brick and stone masonry structures. London: Imprint CRC Press. doi:10.1201/9781003062066
Ulvi, A. (2021). Documentation, Three-Dimensional (3D) Modelling and visualization of cultural heritage by using Unmanned Aerial Vehicle (UAV) photogrammetry and terrestrial laser scanners. Int. J. Remote Sens. 42, 1994–2021. doi:10.1080/01431161.2020.1834164
UNESCO (2023). The great wall. Available online: https://whc.unesco.org/en/list/438/ (Accessed on April 27, 2023).
Wang, N., Zhao, X., Zhao, P., Zhang, Y., Zou, Z., and Ou, J. (2019). Automatic damage detection of historic masonry buildings based on mobile deep learning. Automation Constr. 103, 53–66. doi:10.1016/j.autcon.2019.03.003
Weatherspark (2023). Climate and average weather year round in Qinhuangdao. Available online: https://weatherspark.com/y/134087/Average-Weather-in-Qinhuangdao-China-Year-Round (Accessed on April 27, 2023).
Yu, S. L., Westfechtel, T., and Hamada, R. (2017). “Vehicle detection and localization on bird's eye view elevation images using convolu-tional neural network,” in 2017 IEEE International Symposium on Safety, Security and Rescue Robotics (SSRR), Shanghai, China, 11-13 October 2017 (IEEE), 102–109. doi:10.1109/SSRR.2017.8088147
Yuan, D. L., and Xu, Y. (2021). Lightweight vehicle detection algorithm based on improved YOLOv4. Eng. Lett. 29, 4. Available At: https://www.engineeringletters.com/issues_v29/issue_4/EL_29_4_27.pdf.
Appendix A: Machine learning environment
Machine learning environment: The operating system is Windows 11 (X64), the CUDA version is 11.5, the deep learning framework is PyTorch (1.13.0), and the graphics card and processor are a GeForce GTX 3070 (16 G) and an AMD Ryzen 9 5900HX (3.30 GHz), respectively.
Keywords: machine learning, Shanhaiguan Great Wall, world heritage site, YOLOv4, gray bricks
Citation: Li Q, Zheng L, Chen Y, Yan L, Li Y and Zhao J (2023) Non-destructive testing research on the surface damage faced by the Shanhaiguan Great Wall based on machine learning. Front. Earth Sci. 11:1225585. doi: 10.3389/feart.2023.1225585
Received: 19 May 2023; Accepted: 24 August 2023;
Published: 04 September 2023.
Edited by:
Sansar Raj Meena, University of Padua, ItalyReviewed by:
Elena Marrocchino, University of Ferrara, ItalyMohammad Azarafza, University of Tabriz, Iran
Copyright © 2023 Li, Zheng, Chen, Yan, Li and Zhao. This is an open-access article distributed under the terms of the Creative Commons Attribution License (CC BY). The use, distribution or reproduction in other forums is permitted, provided the original author(s) and the copyright owner(s) are credited and that the original publication in this journal is cited, in accordance with accepted academic practice. No use, distribution or reproduction is permitted which does not comply with these terms.
*Correspondence: Liang Zheng, MjAwOTg1M2dhdDMwMDAyQHN0dWRlbnQubXVzdC5lZHUubW8=; Yile Chen, MjAwOTg1M2dhdDMwMDAxQHN0dWRlbnQubXVzdC5lZHUubW8=
†These authors have contributed equally to this work
 Qian Li1,2†
 Liang Zheng
 Yile Chen
 Lina Yan
 Yuanfang Li