 Shujian Li1
 Chongyang Wang
 Dongming Zhang
- 1Yunnan Phosphate Chemical Group Co Ltd, Yunnan, China
- 2State Key Laboratory of Coal Mine Disaster Dynamics and Control, Chongqing University, Chongqing, China
- 3School of Resources and Safety Engineering, Chongqing University, Chongqing, China
- 4School of Surveying, Mapping and Land Information Engineering, Henan Polytechnic University, Jiaozuo, Henan, China
In order to explore the deterioration mechanism of mechanical properties of phosphate rock under different saturation time, the degradation mechanism of phosphoric rock samples under different saturation duration was analyzed by laboratory test, theoretical analysis and neural network modeling, and the results is as follows: saturation of water will result in deterioration of mechanical properties of samples. The peak compressive strength and peak strain of the samples decreased gradually with the increase of saturation time. The average peak strength of 12, 24, and 36 h saturated specimens is 8.6%, 21.1%, and 32.2% lower than that of natural specimens, and the peak strain is 5.9%, 13.9%, and 31.3% lower, respectively. The stress-strain curves of the samples with water saturation for 36 h have more jitter stages after the peak, indicating that the plastic characteristics of the samples will be increased with water saturation for a long time. The neural network method was used to analyze the test parameters and the mechanical parameters of the samples, and the mechanical properties under the action of saturated water and confining pressure were obtained. The neural network model was established to represent the mechanical properties of the samples, and the average accuracy of the model was 0.89. The model can be used to predict and verify the mechanical properties of samples under other saturation and confining pressure conditions in the limited region. The research results can provide theoretical reference for the deterioration mechanism of confining pressure in water-rich roadway.
1 Introduction
The phenomenon of water gushing often occurs in the process of roadway excavation in a mine in Yunnan Province. Soaking and saturation will result in deterioration of mechanical properties of rock mass, thus increasing the difficulty of tunneling and support (Liu et al., 2023a; Liu et al., 2023b; Liu et al., 2023c). Therefore, it is of great significance to explore the deterioration mechanism of rock mechanical properties under different saturation duration conditions.
Many scholars at home and abroad have done a lot of research on the water deterioration mechanism of rock (Ni et al., 2005; Wood, 2015; Ma et al., 2020; Wang et al., 2020; Wang et al., 2023a; Wang et al., 2023b). Feng et al. (2022) explored the instability fracture characteristics of red sandstone samples under different water-bearing states under the combination of static and dynamic states through laboratory tests, and concluded that the mechanical response of natural sandstone samples was typical characteristic of rock burst, while the mechanical response of saturated sandstone samples was mainly reflected in the degree of rock sample fragmentation. In the study on the changes of rock mechanical properties and meso-structural characteristics under water saturation, Zhao (2022) conducted triaxial compression and scanning electron microscope tests under different confining pressures and water saturation conditions, and concluded that with the increase of water saturation, the mechanical properties of sandstone continue to decline, the water saturation deterioration effect of sandstone is significant, and the water saturation effect promotes the development of microcracks. Water and rock sample volume have obvious influences on physical mechanics and deformation characteristics of sandstone. Through experiments, Wang et al. (2019) concluded that: the elastic modulus and deformation modulus of sandstones are negatively correlated with the rock sample volume. The Poisson’s ratio of dry sandstones increases with the increase of rock sample volume, while that of saturated sandstones increases first with the increase of rock sample volume and then becomes stable. The presence of water has no obvious effect on the failure morphology of rock sample under uniaxial compression. In the study on deformation characteristics of saturated rock mass in cold region, Jia et al. (2023) pointed out that the freeze-thaw strain characteristic values of saturated rock are related to fracture length, width and rock lithology, and that freeze-thaw failure of fractured rock is a process of gradual accumulation of residual strain. Water environments (water content, osmotic water pressure), loading rates, generalized stress relaxation have obvious deterioration effects on the aging characteristics of rock. Considering the aging characteristics of surrounding rock under the action of water environment, it is of great significance for the long-term stability control of tunnel (Chen, 2021). By studying the tensile strength and failure mechanism of rock damaged by hydrothermal coupling at different loading rates, Wang et al. (2020) pointed out that the indirect tensile strength of water-saturated sandstone specimens was lower than that of dry specimens, and the strain rate dependence of water-saturated rock samples was stronger than that of dry rock. A large number of electromagnetic radiation (EMR) signals are released in the loading failure process of water-bearing fractured rock mass, which can provide certain guidance for the monitoring and warning of related geological disasters. Related research results showed that compared with dry rock samples, saturated rock samples had lower compressive strength, earlier cracking time, more complex failure mode, and lower proportion of high frequency signal of saturated rock samples than dry rock samples (Shen et al., 2021).
In recent years, neural network model has been widely used in rock mechanics research experiments (Zhang et al., 1991). Chen (2022) proposed an acoustic emission positioning method that combines spectrum analysis and convolutional neural network without the need for wave velocity model and time pick, which effectively improves the acoustic emission positioning accuracy and avoids the shortcomings of traditional positioning methods, providing a new idea for rock acoustic emission positioning. By introducing BP neural network, Chen (2022) took drilling experiment data import as the input layer and rock mechanics parameters as the output layer. Through the prediction of composite samples, the prediction accuracy of the trained BP neural network model on rock mechanics parameters and the identification ability of rock interface were verified. By establishing the fracture network topography prediction model based on artificial neural network under the influence of multiple factors, Feng (2021) sorted the factors affecting the results of shale fracture network topography, providing a new idea to solve the environmental problems in shale gas exploitation.
The above scholars have done a lot of research on the water-bearing deterioration mechanism of rocks and reached a lot of conclusions, but there are few studies on the deterioration law of rock mechanical properties under different water-saturation duration (Zhang et al., 2018; Wu et al., 2021). Therefore, triaxial compression test were carried out on phosphate rock in this paper to explore the changes of mechanical properties of rock under three conditions of 12, 24 and 36 h. On this basis, the neural network method was used to analyze the test parameters and sample mechanical parameters. The discrete data points were extended to the continuous definition domain on the number line, and the neural network model based on multi-layer perceptron was established, in order to provide theoretical reference for the excavation and support of water-rich roadway in a Yunnan mine.
2 Sample and methods
2.1 Specimen preparation
The rock sample in this paper is taken from the phosphorus block rock in the upper layer of phosphate mine roadway in Yunnan. The selected rock sample was cut and polished to make a standard cylindrical sample with φ 50 × 100 mm. Meanwhile, in order to avoid the influence of the end friction effect on the test, the flatness of the end face was controlled within 0.02 mm, the surface of the specimen was smooth without obvious joints and cracks, and the cylindrical specimen was manufactured in strict accordance with the standards of the International Society of Rock Mechanics, as shown in Figure 1.
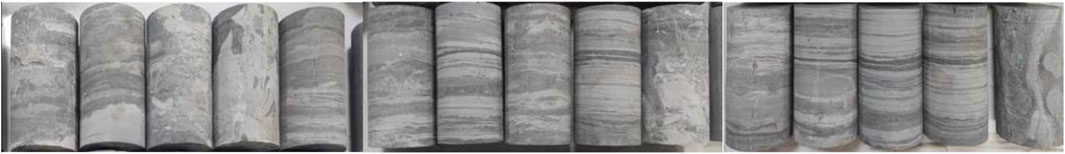
FIGURE 1. Cylindrical standard sample.
2.2 Testing device
1) Ultrasound Testing Device.
The longitudinal wave velocity was carried out by the UTA-2000A intelligent ultra-sonic monitor (as shown in Figure 2A). The sampling frequency is 10 MHz; sensor frequency is 35 kHz, and Vaseline cream as coupling agent is used between the sample and sensors.
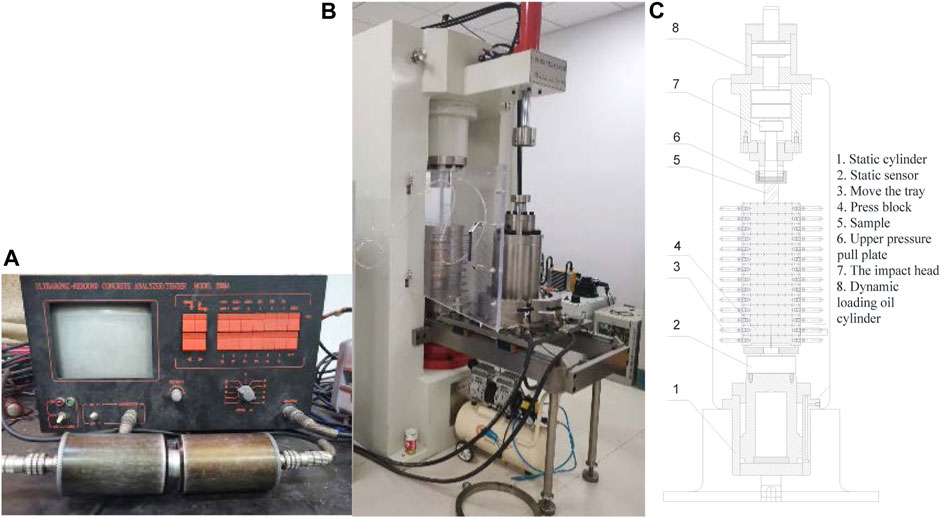
FIGURE 2. Testing device. (A) UTA 2001A ultrasonic inspection monitor. (B) QKX-YD-1000 electro-hydraulic servo rock dynamic fatigue test machine. (C) Test schematic diagram.
2) Fatigue loading test and triaxial compression test were carried out on a QKX-YD-1000 electro-hydraulic servo rock dynamic fatigue test machine, which was produced by Qingdao Qiankunxing Intelligent Technology Co., Ltd., Qingdao, Shandong Province. As shown in Figures 2B, C. The maximum axial load of the system is 800 kN, the maximum loading speed is 800 mm/min, and the maximum displacement is 50 mm (Wang 2021).
2.3 Test methods
1) Grouping: The specimens are divided into 4 groups, labeled as Group A, Group B, Group C, and Group D, with 8 specimens in each group. Group A specimens undergo no treatment and are labeled as the natural group. Specimens in Group B, Group C, and Group D were forced to fill with water in a vacuum saturator for 12, 24, 36 h, respectively, and then sealed with plastic wrap.
2) Measurement of physical properties: Calipers and an electronic balance are used to measure the dimensions and mass of the specimens, and calculate the density. The UTA-2000A Intelligent Ultrasonic Monitoring Instrument (Figure 3A) is used to conduct ultrasonic testing on the specimens. Based on the density and ultrasonic testing results, homogeneous specimens are selected for further testing.
3) Conventional triaxial tests: Conduct conventional triaxial tests on the A, B, C, and D groups of specimens to measure mechanical parameters such as peak strength (σ1), peak strain (εc), elastic modulus (E), cohesion (c), and angle of internal friction (f). In this experiment, the confining pressure for the three groups of specimens is set at 4, 6, 8, 10, and 12 MPa.
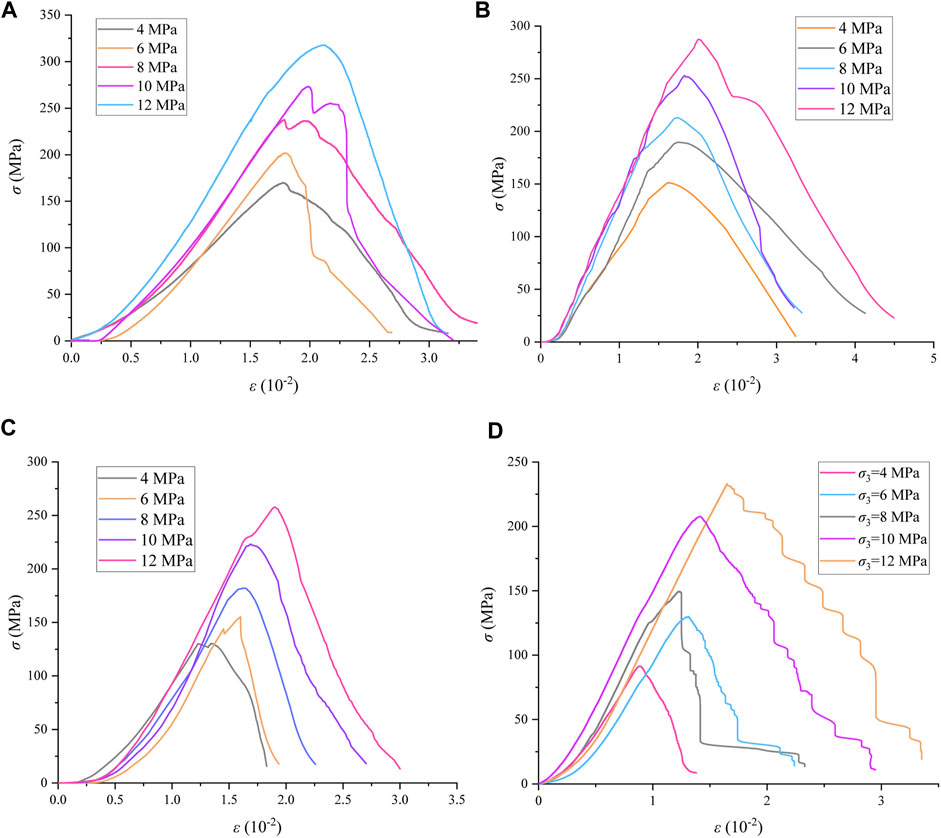
FIGURE 3. The stress-strain curves of the samples in the conventional triaxial compression test under different water length conditions. (A) Group A (0 h). (B) Group B (12 h). (C) Group C (24 h). (D) Group D (36 h).
3 Test results and analysis
Figure 3 shows the stress-strain curves of the samples in the conventional triaxial compression test. As can be seen from Figure 3, the variation of stress-strain curve of samples of each group roughly went through four stages: compaction, elasticity, yield and failure. 1) Compaction stage: the original cracks inside the sample were compacted to form nonlinear compression deformation; 2) Elastic stage: the stress-strain curve was basically linear, obeying Hooke’s law; 3) Yield stage: as the axial stress continues to load, the material with low strength inside the sample first enters the yield failure stage, the stress-strain curve deviated from the straight line, and the increased rate of axial stress gradually decreases; 4) Failure stage: when the sample reached the ultimate strength, the bearing capacity of the sample decreased rapidly with the increase of deformation, and the deformation damage of the sample was further aggravated.
Observe the peak stress of samples in each group in Figure 3. For Group A, the peak strength of the sample is 169.9 MPa when the confining pressure is 4 MPa. When the confining pressure is 6, 8, 10 and 12 MPa, the peak strength of each sample increases by 18.7%, 38.1%, 60.9%, and 87.1%, respectively. For Group B, the peak strength of the samples is 151.2 MPa when the confining pressure is 4 MPa. When the confining pressure is 6, 8, 10 and 12 MPa, the peak strength of each sample increases by 25.4%, 41.1%, 67.0%, and 90.0%, respectively. For Group C, the peak strength of the samples is 84.17 MPa when the confining pressure is 4 MPa. When the confining pressure is 6, 8, 10 and 12 MPa, the peak strength of each sample increases by 17.6%, 39.7%, 70.1%, and 97.8%, respectively. For Group D, the peak strength of the samples is 91.5 MPa when the confining pressure is 4 MPa. When the confining pressure is 6, 8, 10 and 12 MPa, the peak strength of each sample increases by 41.9%, 63.3%, 127.0%, and 154.7%, respectively.
Meanwhile, the transverse comparison of samples of each group shows that the peak strength of samples in Group A (239.5 MPa) is the largest, and the average peak strength of samples in Group B (218.8 MPa), Group C (189.1 MPa), and Group D (162.3 MPa) under different confining pressures is 8.6%, 21.1%, and 32.2% lower than that of Group A, respectively. The peak strain of samples in Group A (1.89×10⁻²) is the largest, and the average peak strain of samples in Group B (1.78×10⁻²), Group C (1.63×10⁻²), and Group D (1.30×10⁻²) under different confining pressures is 5.9%, 13.9%, and 31.3% lower than that of Group A, respectively, indicating that saturation of water has an obvious deterioration effect on samples.
According to Mohr-Coulomb strength criterion, the maximum shear stress of the sample bearing is determined by cohesion and internal friction Angle, which can be expressed as (Wei et al., 2020):
where, c is cohesion; μ is the internal friction coefficient,
where, σ1 is the peak strength; k and Q are material strength parameters, and the relationship between their values and c, φ is as follows:
According to Eq. 2, the relationship between the peak strength and confining pressure of the samples was obtained by regression, and the mechanical parameters of the samples of each group were calculated, as shown in Table 1.
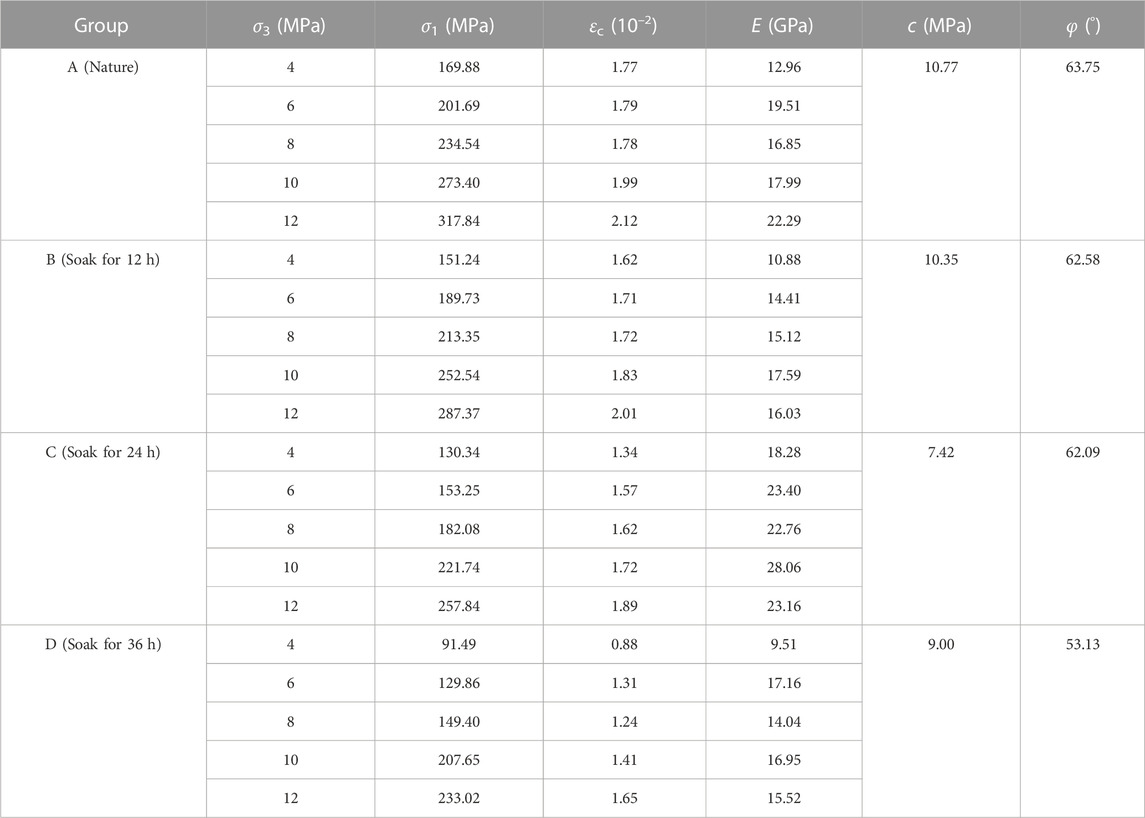
TABLE 1. Mechanical parameters of each group of samples.
4 Neural network analysis
4.1 Neural network model training
A neural network prediction model with saturation time and confining pressure as influencing factors was developed. In the model, peak strains, peak strength and elastic modulus as the output factors, as shown in Figure 4.
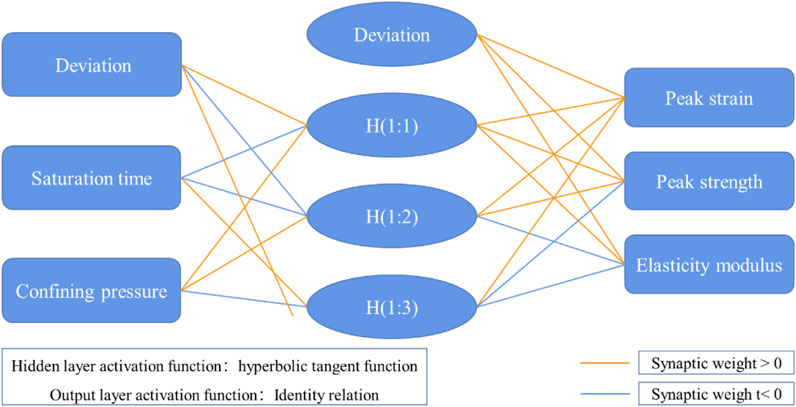
FIGURE 4. Diagram of the neural network model.
As shown in Figure 4, the activation function of the hidden layer of the multi-layer perceptron is the hyperbolic tangent function (Aras et al., 2020; Moussas et al., 2021):
In Figure 3, the calculation formula of the weight of each input layer is as follows:
1) Set the initial random weight (for the convenience of calculation, we take the deviation as the first input factor), where
2) The factors of the input layer are multiplied by the weight:
Type,
3) Calculate the output of hidden layer:
4) The error between the hidden layer output result and the real result was calculated:
where, E for error, Ynet1 is the input signal received by the hidden layer, namely, the weighting of each factor and the input layer. Yout1 is the output value of the activation function of hidden layers.
5) Update weight:
Taking the saturation time factor as an example, updating the weights after the error back propagation requires first calculating the partial derivative of
According to Eq. 9, the values of each split term are calculated in turn, and it can be seen that:
Substituting Eq. 11 into Eq. 10:
Using the calculation results of Equation 12, the value of the saturation time
The comparison of the results calculated by the neural network model in the figure with the original data is shown in Figure 5.
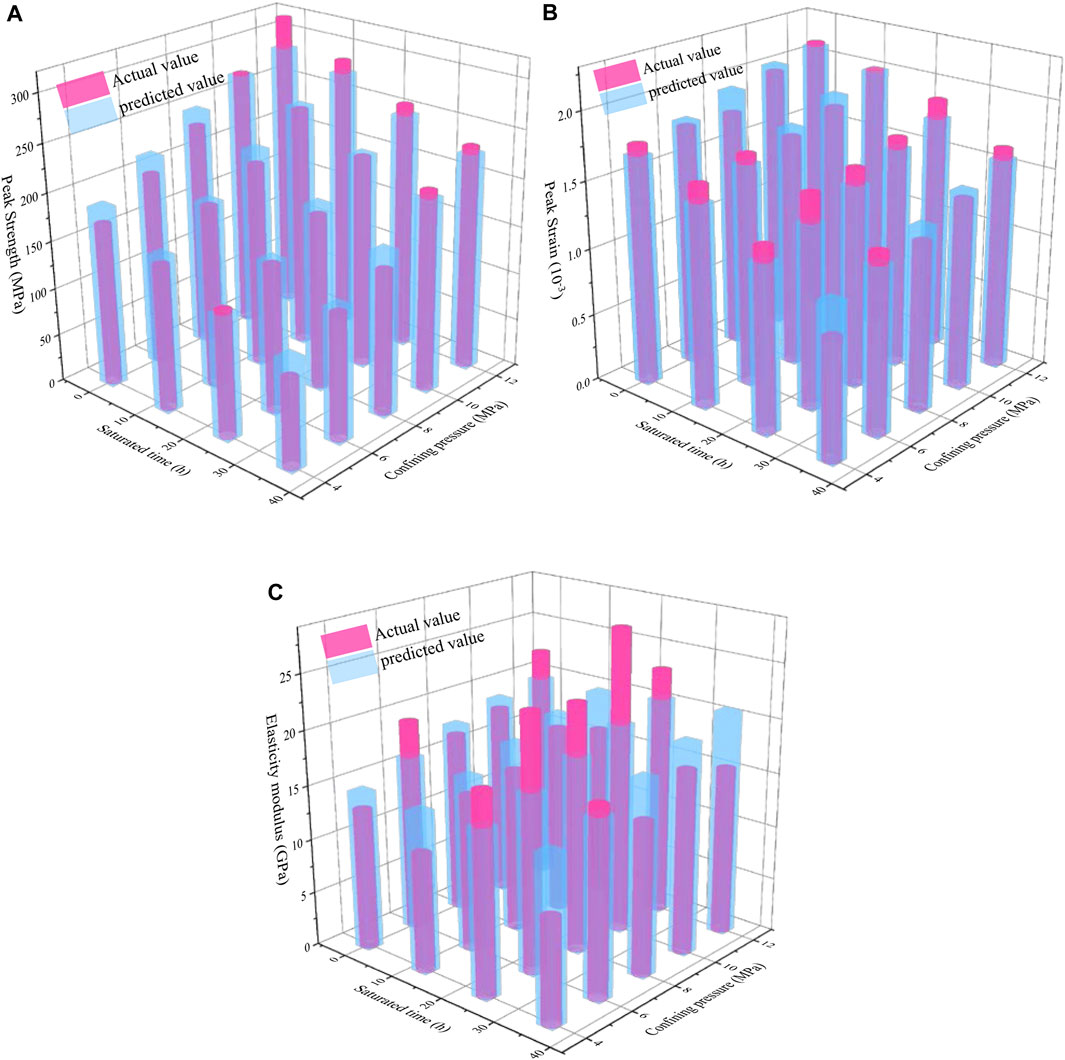
FIGURE 5. Comparison of neural network prediction results and actual values. (A) Peak strain. (B) Peak strength. (C) Elasticity modulus.
Figure 5 shows that the peak strain and peak strength prediction results obtained by the neural network model of the multilayer perceptron are highly similar to the original restoration results, while the difference between the peak modulus prediction results and the original data is more obvious. In order to analyze the fitting degree of the model in detail, the residual coefficients and correlation coefficients of the prediction results of the three dependent variables need to be calculated. The remaining error was calculated as follows:
where,
Figure 6 shows the residuals and standard deviations of the predicted peak strain and peak strength compared to the actual values. As can be seen from the figure, both standardized residual values are between [-2,2], The absolute value of the peak strain of residual
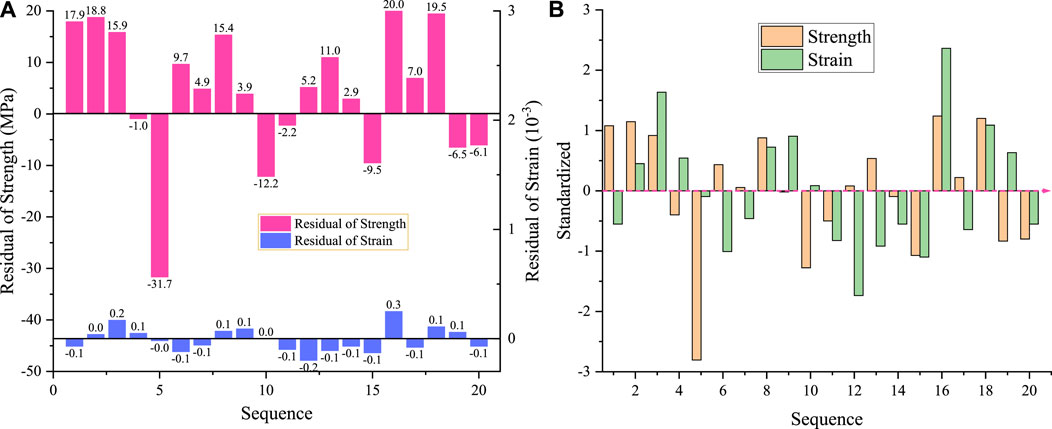
FIGURE 6. Training results. (A) Residuals. (B) Standardized residuals.
4.2 Neural network model prediction
The above calculation results show that the saturation time and confining pressure have little effect on the elastic modulus, so only the peak strain and peak strength are predicted in continuous intervals below. The discrete input factors of saturation time and confinement pressure were extended into a continuous domain and imported into the trained multi-layer perceptron neural network model for prediction, and 444 sets of predicted values were obtained. Among them, the saturation time was extended from 0, 12, 24, and 36 groups to a continuous interval of 0–36, and the confining pressure was extended from 4, 6, 8, 10, and 12 groups to a continuous interval of 0–12.
Under the same saturation time, the average value of peak strain and peak strength corresponding to different confining pressures at the same saturation time was calculated, and 37 sets of data were obtained. Under the same confining pressure, the average value of peak strain and peak strength corresponding to different filling times under the same confining pressure was calculated to obtain 12 sets of data. The average value was calculated using the following formula:
In the formula,
To visualize the effects of saturation time and confining pressure on peak strain and peak strength, we fit the predicted curves separately. Different confining pressure values and different saturated time were used as independent variables, and peak strain and peak strength values were used as dependent variables. Cubic polynomials were used for fitting, and the fitting formula was as follows:
The fitting curve is shown in Figure 7. The correlation between the fitted curve and the original data was 0.99, indicating that the cubic polynomial fitting effect was good, and the fitted curve could predict the peak strain and peak strength in a continuous interval. It can be seen from the figure that the peak strain and peak strength increase continuously with the increase of confining pressure, and the peak strain decreases gradually with the increase of water saturation time. Under the same water retention time, the peak strain and peak strength increased with the increase of confining pressure, and the increase amplitude showed a trend of first increasing and then decreasing. Under the same confining pressure, the peak strain and peak strength decreased with the increase of water saturation time, and the decreasing amplitude also showed a trend of first increasing and then decreasing.
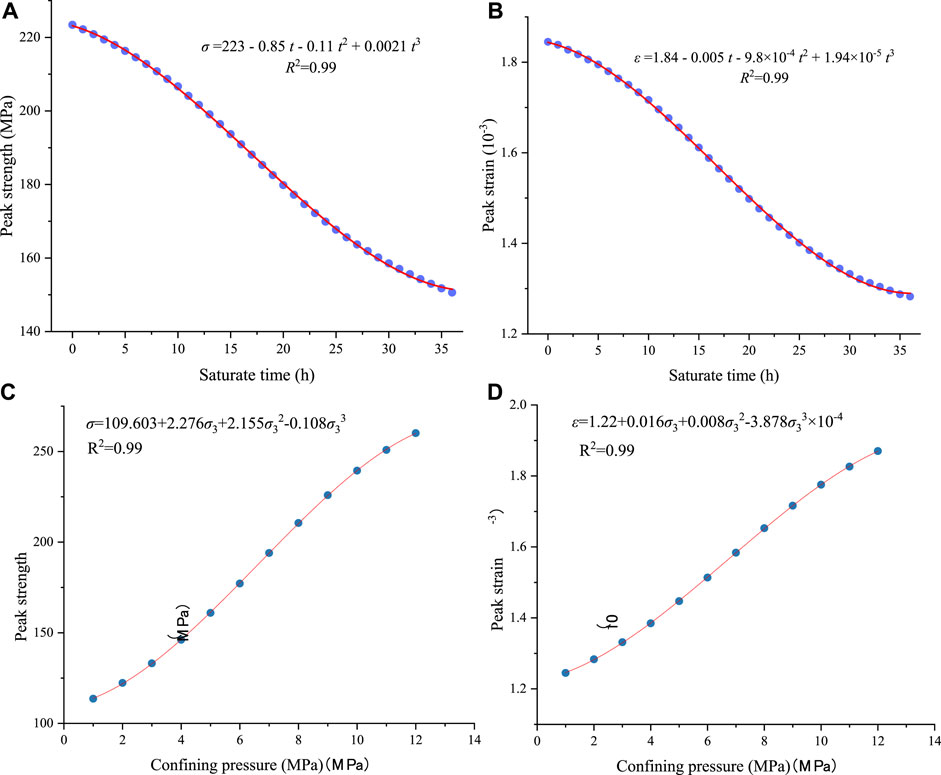
FIGURE 7. Neural network prediction results. (A) Plot of peak strength versus duration of saturation. (B) Plot of peak strain versus duration of satiation time. (C) Plot of peak strength versus confining pressure. (D) Plot of peak strain versus confining pressure.
5 Conclusion
In this paper, the degradation mechanism of phosphoric rock samples under different saturation duration was analyzed by laboratory test, theoretical analysis and neural network modeling, and the results is as follows:
1) The peak compressive strength and peak strain of the samples decreased gradually with the increase of saturation time. The average peak strength of 12, 24, and 36 h saturated specimens is 8.6%, 21.1%, and 32.2% lower than that of natural samples, and the peak strain is 5.9%, 13.9%, and 31.3% lower, respectively. It indicates that saturated water has obvious deterioration on mechanical properties of samples.
2) The stress-strain curves of the samples with water saturation for 36 h have more jitter stages after the peak, indicating that the plastic characteristics of the samples will be increased with water saturation for a long time.
3) The neural network model was established to characterize the change of mechanical properties of the samples. The average accuracy of the model was 0.89. This model can well show the variation of mechanical properties of samples under the action of saturated water and confining pressure.
4) The model can be used to predict and verify the mechanical properties of samples under other saturation and confining pressure conditions in the limited region. The research results can provide theoretical reference for the deterioration mechanism of confining pressure in water-rich roadway.
Data availability statement
The raw data supporting the conclusion of this article will be made available by the authors, without undue reservation.
Author contributions
CW supervised the research and proposed the research direction. SL was responsible for report analysis and paper writing. DZ, MW, FZ, and YP were responsible for data processing. All authors contributed to the article and approved the submitted version.
Conflict of interest
Authors SL, MW, and FZ were employed by Yunnan Phosphate Chemical Group Co., Ltd., Yunnan, China.
The remaining authors declare that the research was conducted in the absence of any commercial or financial relationships that could be construed as a potential conflict of interest.
Publisher’s note
All claims expressed in this article are solely those of the authors and do not necessarily represent those of their affiliated organizations, or those of the publisher, the editors and the reviewers. Any product that may be evaluated in this article, or claim that may be made by its manufacturer, is not guaranteed or endorsed by the publisher.
References
Aras, A., Ozsen, H., and Dursun, A. (2020). Using artificial neural networks for the prediction of bond work index from rock mechanics properties. Mineral Process. Extr. Metallurgy Rev. 41 (3), 145–152. doi:10.1080/08827508.2019.1575216
Chen, C. (2021). Experimental study on aging characteristics and deformation localization of rock under triaxial loading under water-rock coupling. Chongqing, China: Chongqing University. doi:10.27670/dcnki.Gcqdu.2021.001103
Chen, J., Chen, Z., and Pu, Y. (2022). Based on spectrum analysis and the convolution of the neural network of rock acoustic emission signal positioning study. J. rock Mech. Eng. 9 (S2), 3271–3281. doi:10.13722/j.carolcarrollnkijrme.2021.0836
Chen, Q. (2022). Rock mechanics parameters prediction experiments with drilling. Beijing, China: China Mining University. doi:10.27623/dcnki.Gzkyu.2022.002321
Feng, F., Chen, S., Wang, Q., Rostami, J., Khoreshok, A., Sheng, S., et al. (2022). Experimental study on failure characteristics of natural and saturated sandstone under true triaxial unloading and dynamic disturbance condition. Chin. J. Rock Mech. Eng. 41 (11), 2240–2253. doi:10.13722/j.cnki.jrme.2022.0040
Feng, M. (2021). Morphologic evolution and neural network prediction model of hydraulic fracture network in shale with natural fractures. Chongqing, China: Chongqing university. doi:10.27670/dcnki.Gcqdu.2021.002399
Jia, P., Wang, X., and Wang, D. (2023). Full water fracture rock deformation of freezing and thawing characteristic study. Rock soil Mech. 44 (02), 345–354. doi:10.16285/j.rsm.2022.0554
Liu, S., and Li, X. (2023a). Experimental study on the effect of cold soaking with liquid nitrogen on the coal chemical and microstructural characteristics. Sci. Pollut. Res. 30 (3), 36080–36097. doi:10.1007/s11356-022-24821-9
Liu, S., Sun, H., Zhang, D., Yang, K., Li, X., Wang, D., et al. (2023c). Experimental study of effect of liquid nitrogen cold soaking on coal pore structure and fractal characteristics. Energy 275 (7), 127470. doi:10.1016/j.energy.2023.127470
Liu, S., Sun, H., Zhang, D., Yang, K., Wang, D., Li, X., et al. (2023b). Nuclear magnetic resonance study on the influence of liquid nitrogen cold soaking on the pore structure of different coals. Phys. Fluids 35 (1), 012009. doi:10.1063/5.0135290
Ma, L., Huang, C., Meints, C., Morin, K. A., Dy, E., Tufa, K., et al. (2020). A full-scale case study on the leaching process of acid rock drainage in waste rock piles and the net infiltration through cover systems. Water Air Soil Pollut. 231 (6), 305. doi:10.1007/s11270-020-04660-5
Moussas, V., and Diamantis, K. (2021). Predicting uniaxial compressive strength of serpentinites through physical, dynamic and mechanical properties using neural networks. J. Rock Mech. Geotechnical Eng. 13 (1), 167–175. doi:10.1016/j.jrmge.2020.10.001
Ni, H., Wang, R., and Zhang, Y. (2005). Numerical simulation study on rock breaking mechanism and process under high pressure water jet. Appl. Math. Mechanics-English Ed. 26 (12), 1595–1604. doi:10.1007/BF03246268
Shen, R., Li, T., Li, H., He, S., Zhao, E., Hou, Z., et al. (2021). Study on the effect of water on electromagnetic radiation characteristics of fractured sandstone under load. Environ. Earth Sci. 80 (3), 87. doi:10.1007/s12665-020-09338-z
Wang, C., Liu, C., and Liu, D. (2019). Experimental study on volume effect of water-saturated fractured sandstone under uniaxial compression. Chin. J. Undergr. Space Eng. 15 (05), 1331–1340.
Wang, C., Wei, S., Zhang, D., Yang, Y., Yu, B., and Pan, Y. (2023b). Physical properties and tensile strength evolution of gypsum materials under different water content conditions. Constr. Build. Mater. 364, 129865. doi:10.1016/j.conbuildmat.2022.129865
Wang, C., Zhang, D., Yu, B., and Li, S. (2023a). Deformation and seepage characteristics of coal under true triaxial loading-unloading. Rock Mech. Rock Eng. 56, 2673–2695. doi:10.1007/s00603-022-03207-w
Wang, F., Zhou, D., Zhou, X., Xiao, N., and Guo, C. (2020a). Rock breaking performance of TBM disc cutter assisted by high-pressure water jet. Appl. Sciences-Basel 10 (18), 6294. doi:10.3390/app10186294
Wang, P., Yin, T., and Hu, B. (2020b). Dynamic tensile strength and failure mechanisms of thermally treated sandstone under dry and water-saturated conditions. Trans. Nonferrous Metals Soc. China 30 (8), 2217–2238. doi:10.1016/S1003-6326(20)65374-2
Wei, S., Wang, C., Yang, Y., and Wang, M. (2020). Physical and mechanical properties of gypsum-like rock materials. Adv. Civ. Eng. 20, 1–17. doi:10.1155/2020/3703706
Wood, J. (2015). Crushed-rock vs. full-diameter core samples for water-saturation determination in a tight-gas siltstone play. Spe Reserv. Eval. Eng. 18 (3), 407–416. doi:10.2118/174548-PA
Wu, Y., Li, X., and Zhu, L. (2021). Fracture mechanism of rock collapse in the freeze-thaw zone of the eastern Sichuan-Tibet Mountains under seasonal fluctuating combinations of water and heat. Nat. Hazards 108 (2), 2309–2333. doi:10.1007/s11069-021-04781-y
Zhang, Q., Song, J., and Nie, X. (1991). Application of neural network models to rock mechanics and rock engineering. Int. J. Rock Mech. Min. Sci. 28 (6), 535–540. doi:10.1016/0148-9062(91)91130-J
Zhang, Q., Wang, J., Hou, L., and Lin, P. (2018). Study on the instability mechanisms and monitoring control of stratified rock slope with water-rich strata. Geotechnical Geol. Eng. 36 (3), 1665–1672. doi:10.1007/s10706-017-0421-7
Keywords: phosphorite, saturation duration, mechanical property, triaxial compression test, neural network
Citation: Li S, Wang C, Zhang D, Wang M, Zhou F and Pan Y (2023) Deterioration mechanism of mechanical properties of phosphorite under different saturation duration. Front. Earth Sci. 11:1227742. doi: 10.3389/feart.2023.1227742
Received: 23 May 2023; Accepted: 23 June 2023;
Published: 03 July 2023.
Edited by:
Yubing Liu, China University of Mining and Technology, ChinaReviewed by:
Xuelong Li, Shandong University of Science and Technology, ChinaWenpu Li, Taiyuan University of Technology, China
Copyright © 2023 Li, Wang, Zhang, Wang, Zhou and Pan. This is an open-access article distributed under the terms of the Creative Commons Attribution License (CC BY). The use, distribution or reproduction in other forums is permitted, provided the original author(s) and the copyright owner(s) are credited and that the original publication in this journal is cited, in accordance with accepted academic practice. No use, distribution or reproduction is permitted which does not comply with these terms.
*Correspondence: Chongyang Wang, d2N5QGNxdS5lZHUuY24=; Dongming Zhang, WmhhbmdkbUBjcXUuZWR1LmNu